A Fast and Accurate Maximum Power Point Tracking Approach Based on Neural Network Assisted Fractional Open-Circuit Voltage
Abstract
1. Introduction
- It provides accurate results in all weather and irradiance conditions.
- It has a stable operation with no oscillation around the MPP.
- It is a cost-effective method, which does not require expensive sensing components.
- It has a faster transient response and can track the MPP during a sudden decrease in the solar irradiance.
2. PV Characteristics and Performance
2.1. PV Mathematical Models
2.2. PV Performance
3. Maximum Power Point Tracking Approaches
4. The Proposed Method
4.1. Theory of Operation
4.2. Neural Network Based FOCV Setup
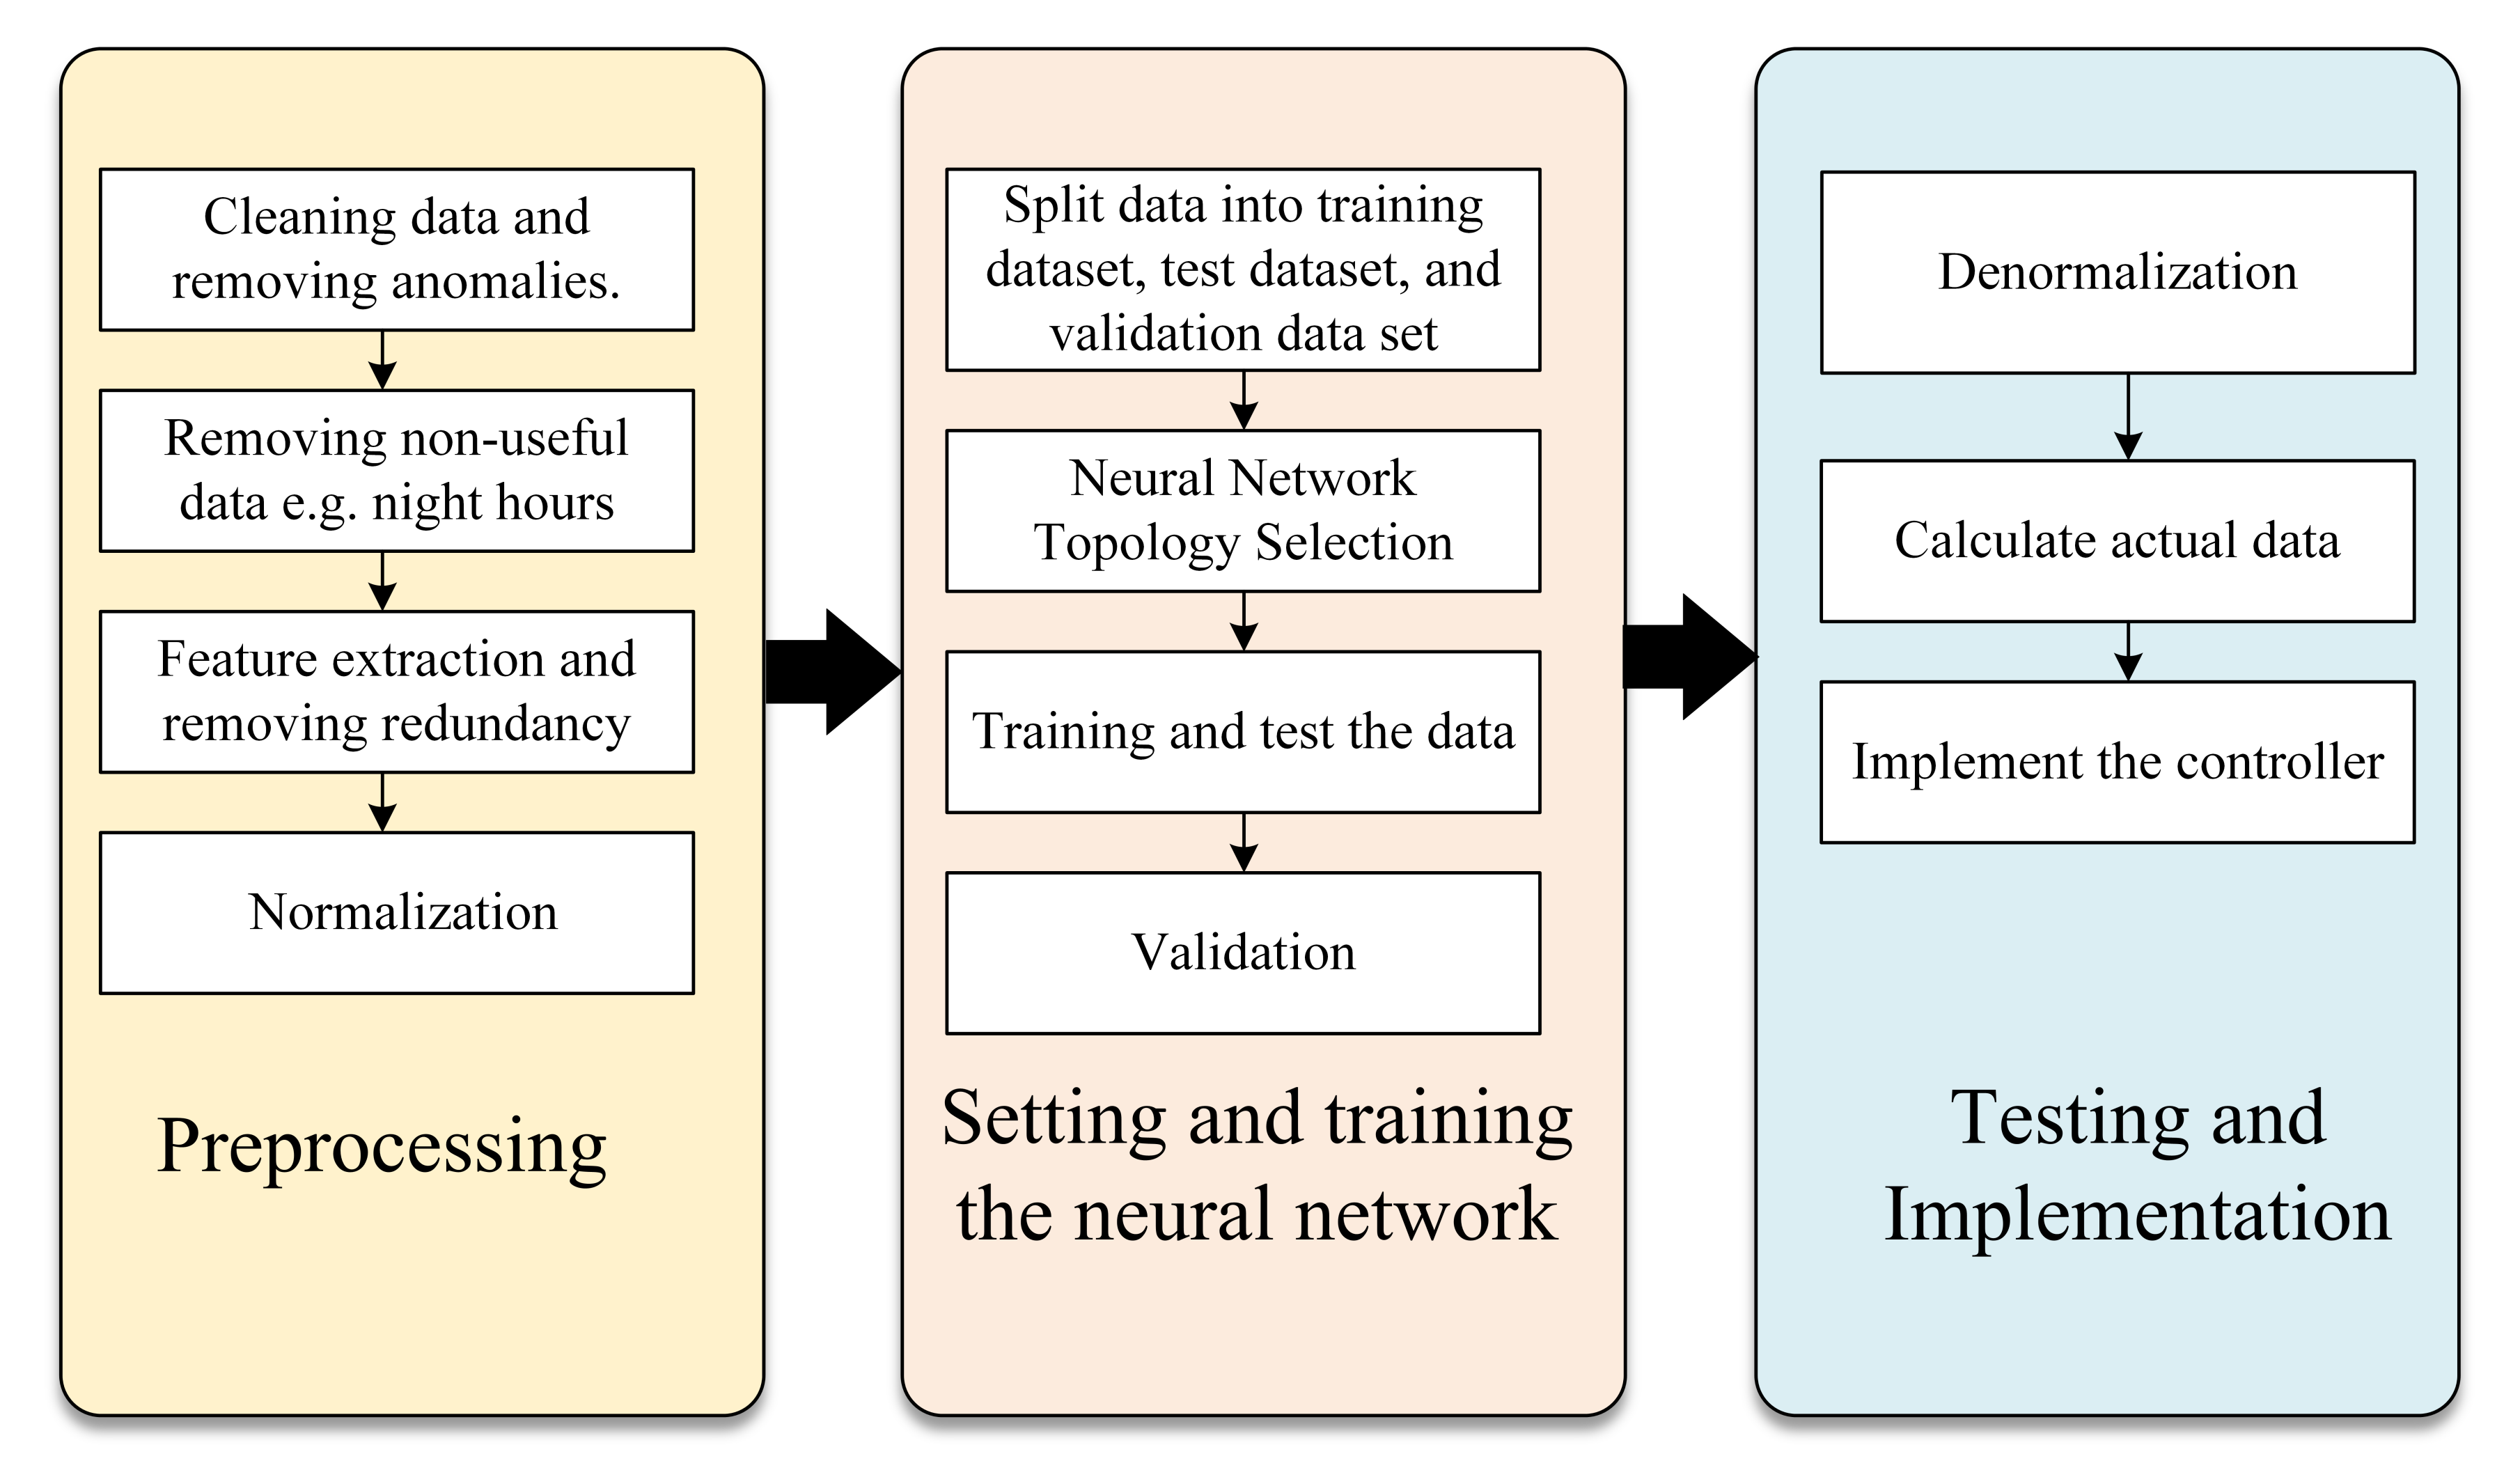
4.2.1. Preprocessing
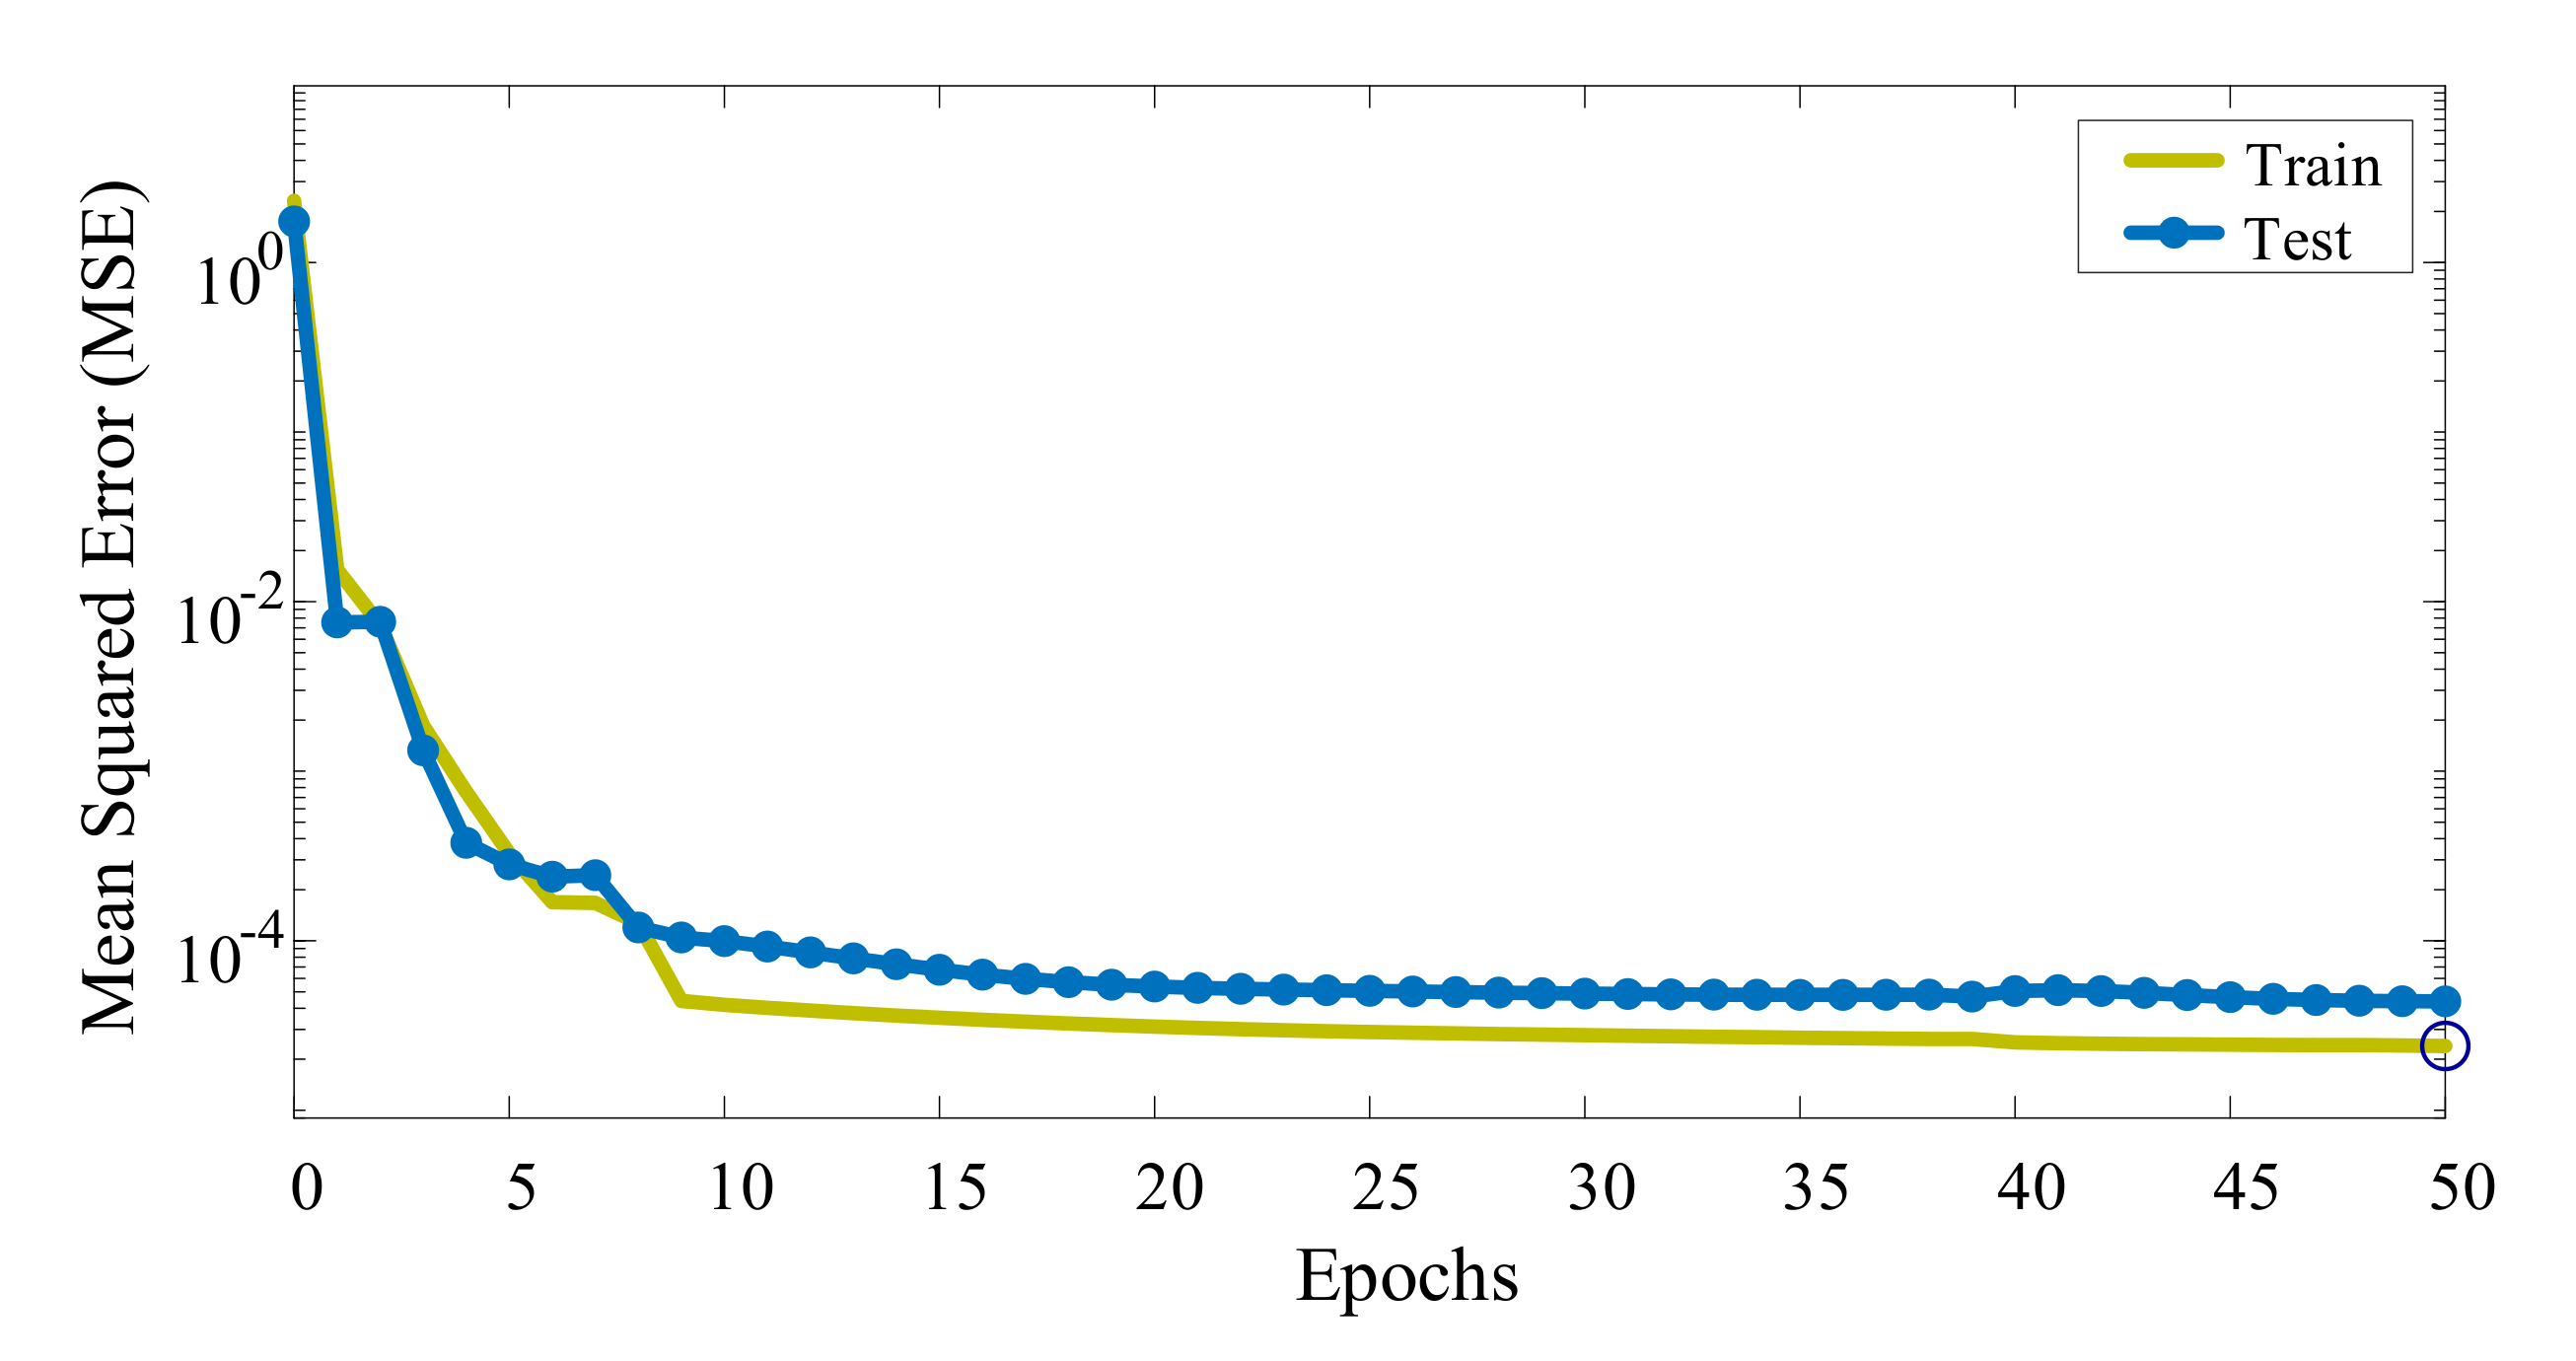
4.2.2. Setting the Network And Training
4.2.3. Testing and Implementation of The Controller
5. Simulations
5.1. Case1: Variation of Solar Irradiance with a Constant Temperature Value
5.2. Variation of Both Irradiance and Temperature
5.3. Energy Analysis
6. Conclusions
Funding
Acknowledgments
Conflicts of Interest
Abbreviations
| PV | Photovoltaics |
| MPPT | Maximum power point tracking |
| FFNN | Feedforward neural network |
| FOCV | Fractional circuit voltage |
References
- Fayaz, H.; Rahim, N.; Saidur, R.; Solangi, K.; Niaz, H.; Hossain, M. Solar energy policy: Malaysia vs developed countries. In Proceedings of the 2011 IEEE Conference on Clean Energy and Technology (CET), Kuala Lumpur, Malaysia, 27–29 June 2011; pp. 374–378. [Google Scholar]
- Mendoza, J.M.F.; Gallego-Schmid, A.; Rivera, X.C.S.; Rieradevall, J.; Azapagic, A. Sustainability assessment of home-made solar cookers for use in developed countries. Sci. Total Environ. 2019, 648, 184–196. [Google Scholar] [CrossRef] [PubMed]
- Liu, Z. What is the future of solar energy? Economic and policy barriers. Energy Sources Part Econ. Planning Policy 2018, 13, 169–172. [Google Scholar] [CrossRef]
- Irfan, M.; Zhao, Z.Y.; Ikram, M.; Gilal, N.G.; Li, H.; Rehman, A. Assessment of India’s energy dynamics: Prospects of solar energy. J. Renew. Sustain. Energy 2020, 12, 053701. [Google Scholar] [CrossRef]
- Messenger, R.A.; Abtahi, A. Photovoltaic Systems Engineering; CRC Press: Boca Raton, FL, USA, 2017. [Google Scholar]
- Tyagi, V.; Rahim, N.A.; Rahim, N.; Jeyraj, A.; Selvaraj, L. Progress in solar PV technology: Research and achievement. Renew. Sustain. Energy Rev. 2013, 20, 443–461. [Google Scholar] [CrossRef]
- Villalva, M.G.; Gazoli, J.R.; Ruppert Filho, E. Comprehensive approach to modeling and simulation of photovoltaic arrays. IEEE Trans. Power Electron. 2009, 24, 1198–1208. [Google Scholar] [CrossRef]
- Shi, Y.; Li, R.; Xue, Y.; Li, H. High-frequency-link-based grid-tied PV system with small DC-link capacitor and low-frequency ripple-free maximum power point tracking. IEEE Trans. Power Electron. 2015, 31, 328–339. [Google Scholar] [CrossRef]
- Ghenai, C.; Bettayeb, M. Design and optimization of grid-tied and off-grid solar PV systems for super-efficient electrical appliances. Energy Effic. 2020, 13, 291–305. [Google Scholar] [CrossRef]
- Rafique, M.M.; Bahaidarah, H.M.; Anwar, M.K. Enabling private sector investment in off-grid electrification for cleaner production: Optimum designing and achievable rate of unit electricity. J. Clean. Prod. 2019, 206, 508–523. [Google Scholar] [CrossRef]
- Kavya Santhoshi, B.; Mohana Sundaram, K.; Padmanaban, S.; Holm-Nielsen, J.B.; KK, P. Critical review of PV grid-tied inverters. Energies 2019, 12, 1921. [Google Scholar] [CrossRef]
- Qing, X.; Niu, Y. Hourly day-ahead solar irradiance prediction using weather forecasts by LSTM. Energy 2018, 148, 461–468. [Google Scholar] [CrossRef]
- Khosravi, A.; Koury, R.; Machado, L.; Pabon, J. Prediction of hourly solar radiation in Abu Musa Island using machine learning algorithms. J. Clean. Prod. 2018, 176, 63–75. [Google Scholar] [CrossRef]
- Dong, N.; Chang, J.F.; Wu, A.G.; Gao, Z.K. A novel convolutional neural network framework based solar irradiance prediction method. Int. J. Electr. Power Energy Syst. 2020, 114, 105411. [Google Scholar] [CrossRef]
- Esram, T.; Chapman, P. Comparision of Photovoltaic Array MPPT Techniques. IEEE Trans. Energy Convers. 2007, 22, 439–449. [Google Scholar] [CrossRef]
- Liu, F.; Duan, S.; Liu, F.; Liu, B.; Kang, Y. A variable step size INC MPPT method for PV systems. IEEE Trans. Ind. Electron. 2008, 55, 2622–2628. [Google Scholar]
- Subudhi, B.; Pradhan, R. A comparative study on maximum power point tracking techniques for photovoltaic power systems. IEEE Trans. Sustain. Energy 2012, 4, 89–98. [Google Scholar] [CrossRef]
- Abdelsalam, A.K.; Massoud, A.M.; Ahmed, S.; Enjeti, P.N. High-performance adaptive perturb and observe MPPT technique for photovoltaic-based microgrids. IEEE Trans. Power Electron. 2011, 26, 1010–1021. [Google Scholar] [CrossRef]
- Mei, Q.; Shan, M.; Liu, L.; Guerrero, J.M. A novel improved variable step-size incremental-resistance MPPT method for PV systems. IEEE Trans. Ind. Electron. 2010, 58, 2427–2434. [Google Scholar] [CrossRef]
- Lin, L.; Zhang, J.; Shao, S. Differential Power Processing Architecture With Virtual Port Connected in Series and MPPT in Submodule Level. IEEE Access 2020, 8, 137897–137909. [Google Scholar] [CrossRef]
- Motahhir, S.; El Hammoumi, A.; El Ghzizal, A. The most used MPPT algorithms: Review and the suitable low-cost embedded board for each algorithm. J. Clean. Prod. 2020, 246, 118983. [Google Scholar] [CrossRef]
- Bollipo, R.B.; Mikkili, S.; Bonthagorla, P.K. Critical Review on PV MPPT Techniques: Classical, Intelligent and Optimisation. IET Renew. Power Gener. 2020, 14, 1433–1452. [Google Scholar]
- Pathak, P.K.; Yadav, A.K.; Alvi, P. Advanced Solar MPPT Techniques Under Uniform and Non-Uniform Irradiance: A Comprehensive Review. J. Sol. Energy Eng. 2020, 142. [Google Scholar] [CrossRef]
- Mansoor, M.; Mirza, A.F.; Ling, Q. Harris hawk optimization-based MPPT control for PV Systems under Partial Shading Conditions. J. Clean. Prod. 2020, 274, 122857. [Google Scholar] [CrossRef]
- Abdel-Rahim, O.; Alamir, N.; Orabi, M.; Ismeil, M. Fixed-frequency phase-shift modulated PV-MPPT for LLC resonant converters. J. Power Electron. 2020, 20, 279–291. [Google Scholar] [CrossRef]
- Pradhan, R.; Panda, A. Performance evaluation of a MPPT controller with model predictive control for a photovoltaic system. Int. J. Electron. 2020, 107, 1543–1558. [Google Scholar] [CrossRef]
- De Brito, M.A.G.; Galotto, L.; Sampaio, L.P.; e Melo, G.d.A.; Canesin, C.A. Evaluation of the main MPPT techniques for photovoltaic applications. IEEE Trans. Ind. Electron. 2012, 60, 1156–1167. [Google Scholar] [CrossRef]
- Chen, W.; Shen, H.; Shu, B.; Qin, H.; Deng, T. Evaluation of performance of MPPT devices in PV systems with storage batteries. Renew. Energy 2007, 32, 1611–1622. [Google Scholar] [CrossRef]
- Uoya, M.; Koizumi, H. A calculation method of photovoltaic array’s operating point for MPPT evaluation based on one-dimensional Newton–Raphson method. IEEE Trans. Ind. Appl. 2014, 51, 567–575. [Google Scholar] [CrossRef]
- Rezk, H.; Mazen, A.O.; Gomaa, M.R.; Tolba, M.A.; Fathy, A.; Abdelkareem, M.A.; Olabi, A.; Abou Hashema, M. A novel statistical performance evaluation of most modern optimization-based global MPPT techniques for partially shaded PV system. Renew. Sustain. Energy Rev. 2019, 115, 109372. [Google Scholar] [CrossRef]
- Garcia, M.; Maruri, J.M.; Marroyo, L.; Lorenzo, E.; Pérez, M. Partial shadowing, MPPT performance and inverter configurations: Observations at tracking PV plants. Prog. Photovoltaics Res. Appl. 2008, 16, 529–536. [Google Scholar] [CrossRef]
- Femia, N.; Petrone, G.; Spagnuolo, G.; Vitelli, M. Optimization of perturb and observe maximum power point tracking method. IEEE Trans. Power Electron. 2005, 20, 963–973. [Google Scholar] [CrossRef]
- Hussein, K.; Muta, I.; Hoshino, T.; Osakada, M. Maximum photovoltaic power tracking: An algorithm for rapidly changing atmospheric conditions. IEE Proc. Gener. Transm. Distrib. 1995, 142, 59–64. [Google Scholar] [CrossRef]
- Salas, V.; Olias, E.; Barrado, A.; Lazaro, A. Review of the maximum power point tracking algorithms for stand-alone photovoltaic systems. Sol. Energy Mater. Sol. Cells 2006, 90, 1555–1578. [Google Scholar] [CrossRef]
- Elgendy, M.A.; Zahawi, B.; Atkinson, D.J. Assessment of perturb and observe MPPT algorithm implementation techniques for PV pumping applications. IEEE Trans. Sustain. Energy 2011, 3, 21–33. [Google Scholar] [CrossRef]
- Xiao, W.; Dunford, W.G. A modified adaptive hill climbing MPPT method for photovoltaic power systems. In Proceedings of the 2004 IEEE 35th Annual Power Electronics Specialists Conference (IEEE Cat. No. 04CH37551), Aachen, Germany, 20–25 June 2004; Volume 3, pp. 1957–1963. [Google Scholar]
- Nishioka, K.; Sakitani, N.; Uraoka, Y.; Fuyuki, T. Analysis of multicrystalline silicon solar cells by modified 3-diode equivalent circuit model taking leakage current through periphery into consideration. Sol. Energy Mater. Sol. Cells 2007, 91, 1222–1227. [Google Scholar] [CrossRef]
- Brunton, S.L.; Rowley, C.W.; Kulkarni, S.R.; Clarkson, C. Maximum power point tracking for photovoltaic optimization using ripple-based extremum seeking control. IEEE Trans. Power Electron. 2010, 25, 2531–2540. [Google Scholar] [CrossRef]
- Mohammad, A.N.M.; Radzi, M.A.M.; Azis, N.; Shafie, S.; Zainuri, M.A.A.M. An Enhanced Adaptive Perturb and Observe Technique for Efficient Maximum Power Point Tracking Under Partial Shading Conditions. Appl. Sci. 2020, 10, 3912. [Google Scholar] [CrossRef]
- Liu, F.; Kang, Y.; Zhang, Y.; Duan, S. Comparison of P&O and hill climbing MPPT methods for grid-connected PV converter. In Proceedings of the 2008 3rd IEEE Conference on Industrial Electronics and Applications, Singapore, 3–5 June 2008; pp. 804–807. [Google Scholar]
- Esram, T.; Kimball, J.W.; Krein, P.T.; Chapman, P.L.; Midya, P. Dynamic maximum power point tracking of photovoltaic arrays using ripple correlation control. IEEE Trans. Power Electron. 2006, 21, 1282–1291. [Google Scholar] [CrossRef]
- Hammami, M.; Grandi, G. A single-phase multilevel PV generation system with an improved ripple correlation control MPPT algorithm. Energies 2017, 10, 2037. [Google Scholar] [CrossRef]
- Kottas, T.L.; Boutalis, Y.S.; Karlis, A.D. New maximum power point tracker for PV arrays using fuzzy controller in close cooperation with fuzzy cognitive networks. IEEE Trans. Energy Convers. 2006, 21, 793–803. [Google Scholar] [CrossRef]
- Alajmi, B.N.; Ahmed, K.H.; Finney, S.J.; Williams, B.W. Fuzzy-logic-control approach of a modified hill-climbing method for maximum power point in microgrid standalone photovoltaic system. IEEE Trans. Power Electron. 2010, 26, 1022–1030. [Google Scholar] [CrossRef]
- Bendib, B.; Krim, F.; Belmili, H.; Almi, M.; Boulouma, S. Advanced Fuzzy MPPT Controller for a stand-alone PV system. Energy Procedia 2014, 50, 383–392. [Google Scholar] [CrossRef]
- Lin, W.M.; Hong, C.M.; Chen, C.H. Neural-network-based MPPT control of a stand-alone hybrid power generation system. IEEE Trans. Power Electron. 2011, 26, 3571–3581. [Google Scholar] [CrossRef]
- Zečević, Ž.; Rolevski, M. Neural Network Approach to MPPT Control and Irradiance Estimation. Appl. Sci. 2020, 10, 5051. [Google Scholar] [CrossRef]
- Mueller, A.V.; Hemond, H.F. Extended artificial neural networks: Incorporation of a priori chemical knowledge enables use of ion selective electrodes for in-situ measurement of ions at environmentally relevant levels. Talanta 2013, 117, 112–118. [Google Scholar] [CrossRef] [PubMed]
- Simpson, P.K. Artificial Neural Systems: Foundations, Paradigms, Applications, and Implementations; Elsevier Science Inc.: Amsterdam, The Netherlands, 1989. [Google Scholar]
- Hagan, M.T.; Menhaj, M.B. Training feedforward networks with the Marquardt algorithm. IEEE Trans. Neural Netw. 1994, 5, 989–993. [Google Scholar] [CrossRef] [PubMed]







| G | T | K | ||||
|---|---|---|---|---|---|---|
| 400 | 20 | 26.3106 | 3.0091 | 79.1704 | 31.8532 | 0.826 |
| 800 | 45 | 23.7686 | 6.0453 | 143.6872 | 29.9841 | 0.7927 |
| 1000 | 50 | 23.2755 | 7.5521 | 175.7788 | 29.8026 | 0.781 |
| 600 | 25 | 26.0688 | 4.5389 | 118.323 | 31.9547 | 0.8158 |
| 100 | 30 | 22.896 | 0.714 | 16.3469 | 27.9174 | 0.8201 |
| 200 | 25 | 24.7221 | 1.4769 | 36.5124 | 29.9076 | 0.8266 |
| 300 | 35 | 23.9895 | 2.2404 | 53.747 | 29.3799 | 0.8165 |
| 900 | 40 | 24.4561 | 6.8125 | 166.607 | 30.8412 | 0.793 |
| 700 | 30 | 25.5538 | 5.3 | 135.436 | 31.602 | 0.8086 |
| 500 | 40 | 23.9789 | 3.7658 | 90.2998 | 29.7159 | 0.8069 |
| Method | Case 1 | Case 2 | Performance | |||||
|---|---|---|---|---|---|---|---|---|
| Energy (kW/year) | % | Energy (kW/year) | % | Oscillation | Transition | True MPP | Implementation | |
| FOCV | 358.6 | 98.2 | 349.6 | 95.8 | No | Fast | NO | Digital and analog |
| P&O | 375.1 | 98 | 352.9 | 96.6 | Yes | Slow | Yes | Digital and analog |
| Proposed | 362.8 | 99.4 | 361.7 | 99.1 | No | Fast | Yes | Digital |
Publisher’s Note: MDPI stays neutral with regard to jurisdictional claims in published maps and institutional affiliations. |
© 2020 by the author. Licensee MDPI, Basel, Switzerland. This article is an open access article distributed under the terms and conditions of the Creative Commons Attribution (CC BY) license (http://creativecommons.org/licenses/by/4.0/).
Share and Cite
Alzahrani, A. A Fast and Accurate Maximum Power Point Tracking Approach Based on Neural Network Assisted Fractional Open-Circuit Voltage. Electronics 2020, 9, 2206. https://doi.org/10.3390/electronics9122206
Alzahrani A. A Fast and Accurate Maximum Power Point Tracking Approach Based on Neural Network Assisted Fractional Open-Circuit Voltage. Electronics. 2020; 9(12):2206. https://doi.org/10.3390/electronics9122206
Chicago/Turabian StyleAlzahrani, Ahmad. 2020. "A Fast and Accurate Maximum Power Point Tracking Approach Based on Neural Network Assisted Fractional Open-Circuit Voltage" Electronics 9, no. 12: 2206. https://doi.org/10.3390/electronics9122206
APA StyleAlzahrani, A. (2020). A Fast and Accurate Maximum Power Point Tracking Approach Based on Neural Network Assisted Fractional Open-Circuit Voltage. Electronics, 9(12), 2206. https://doi.org/10.3390/electronics9122206


