Integrating Enhanced Sparse Autoencoder-Based Artificial Neural Network Technique and Softmax Regression for Medical Diagnosis


Abstract
1. Introduction
2. Related Works
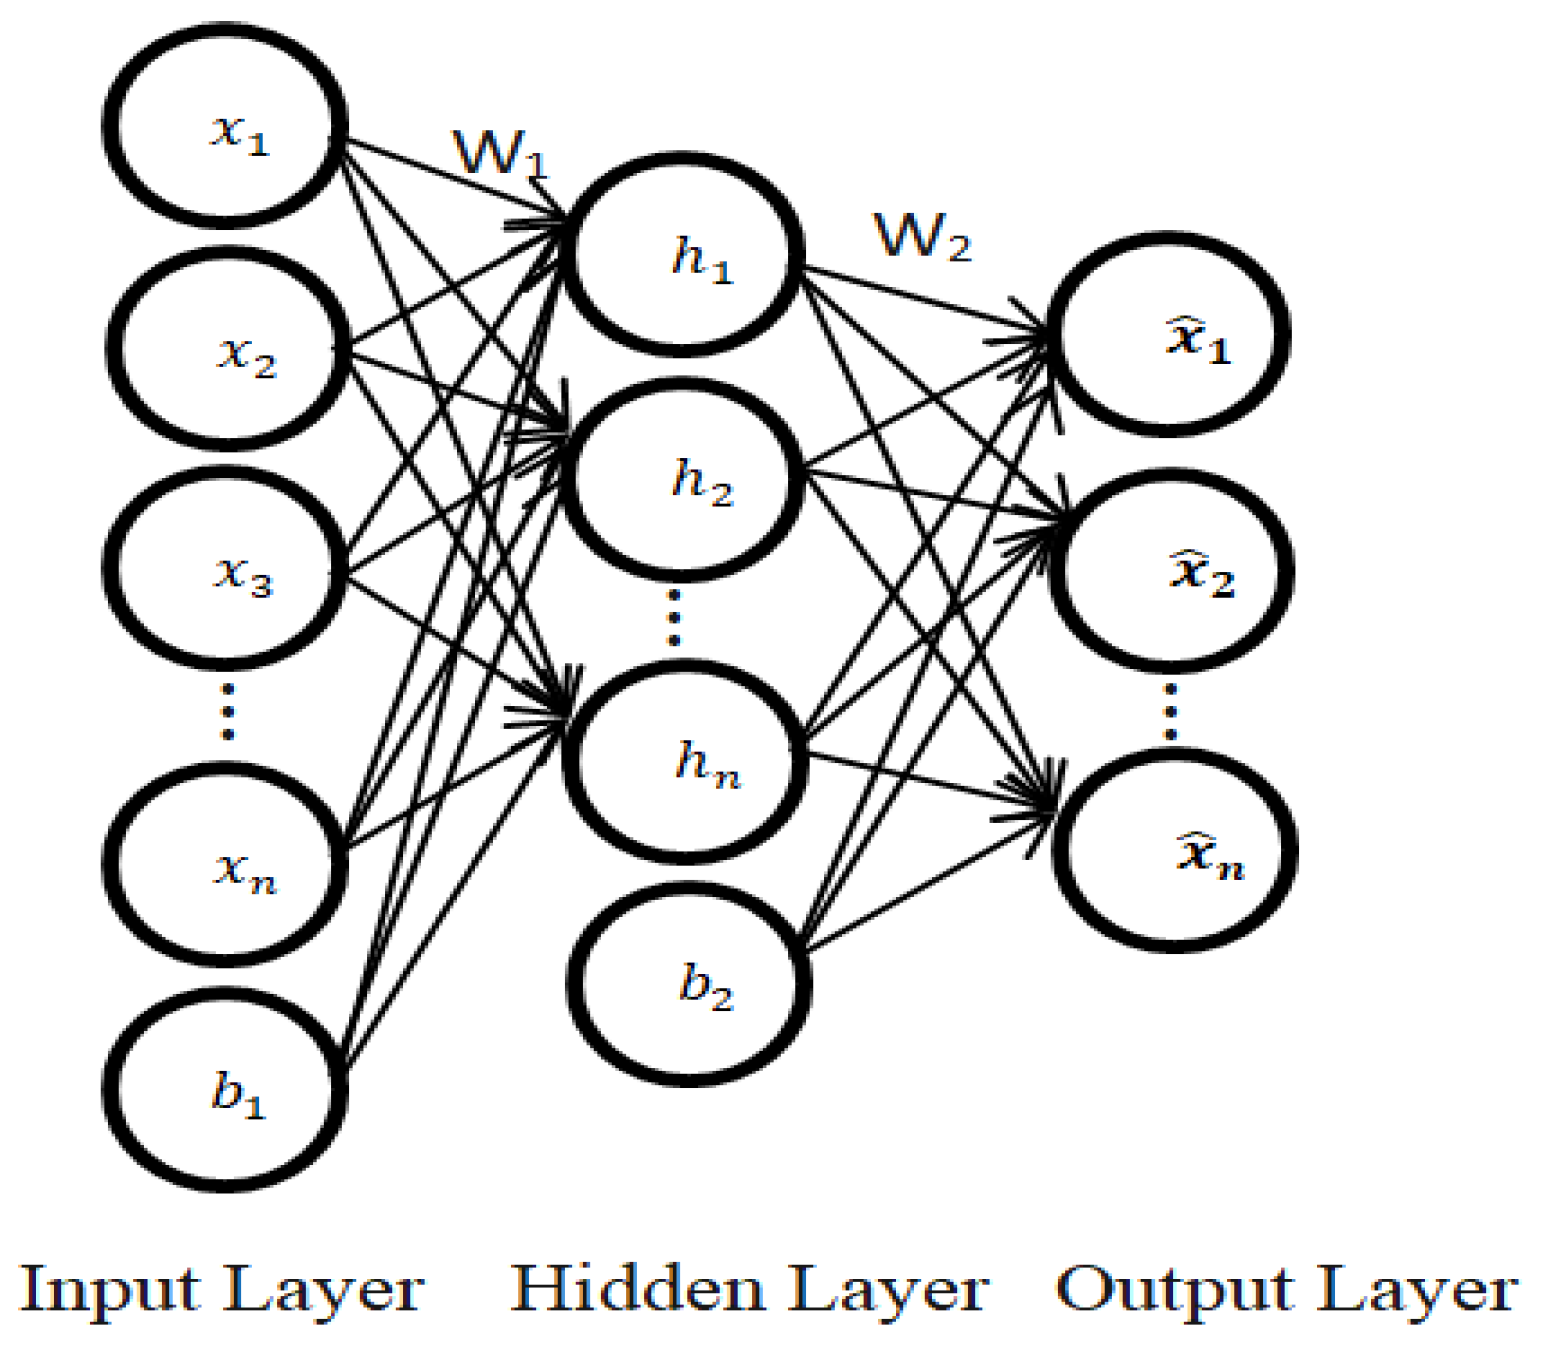
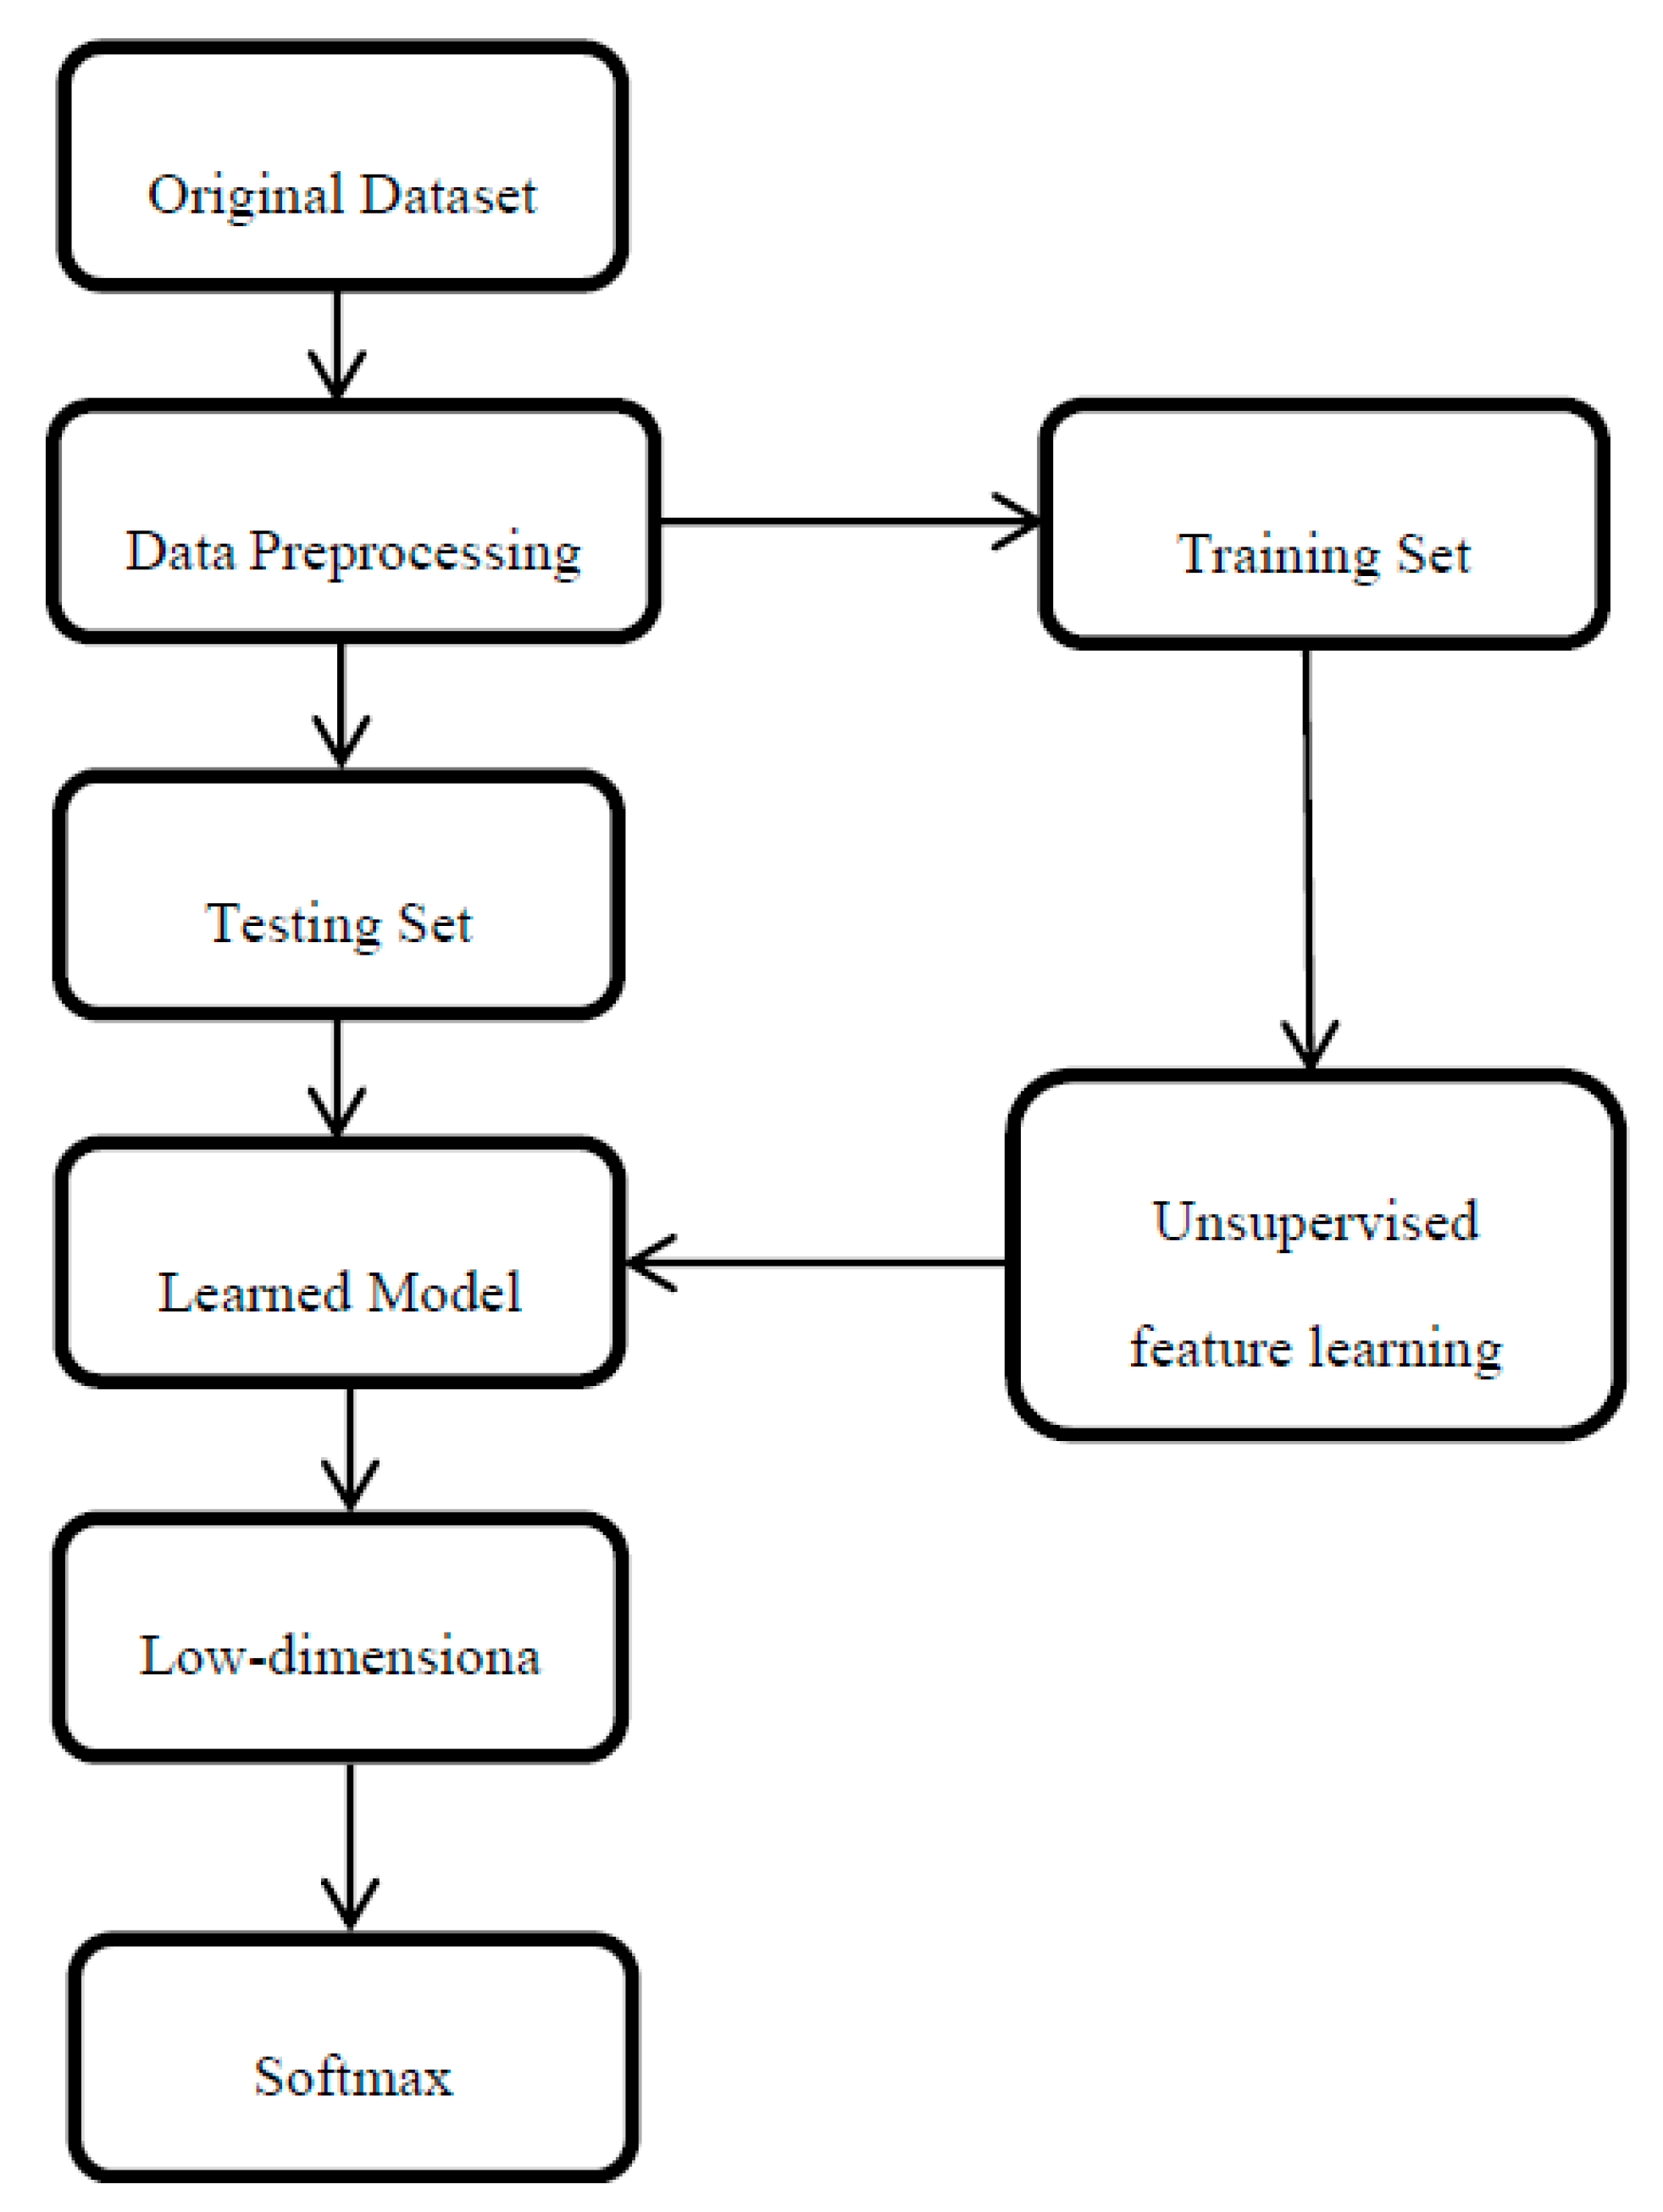
3. Methodology
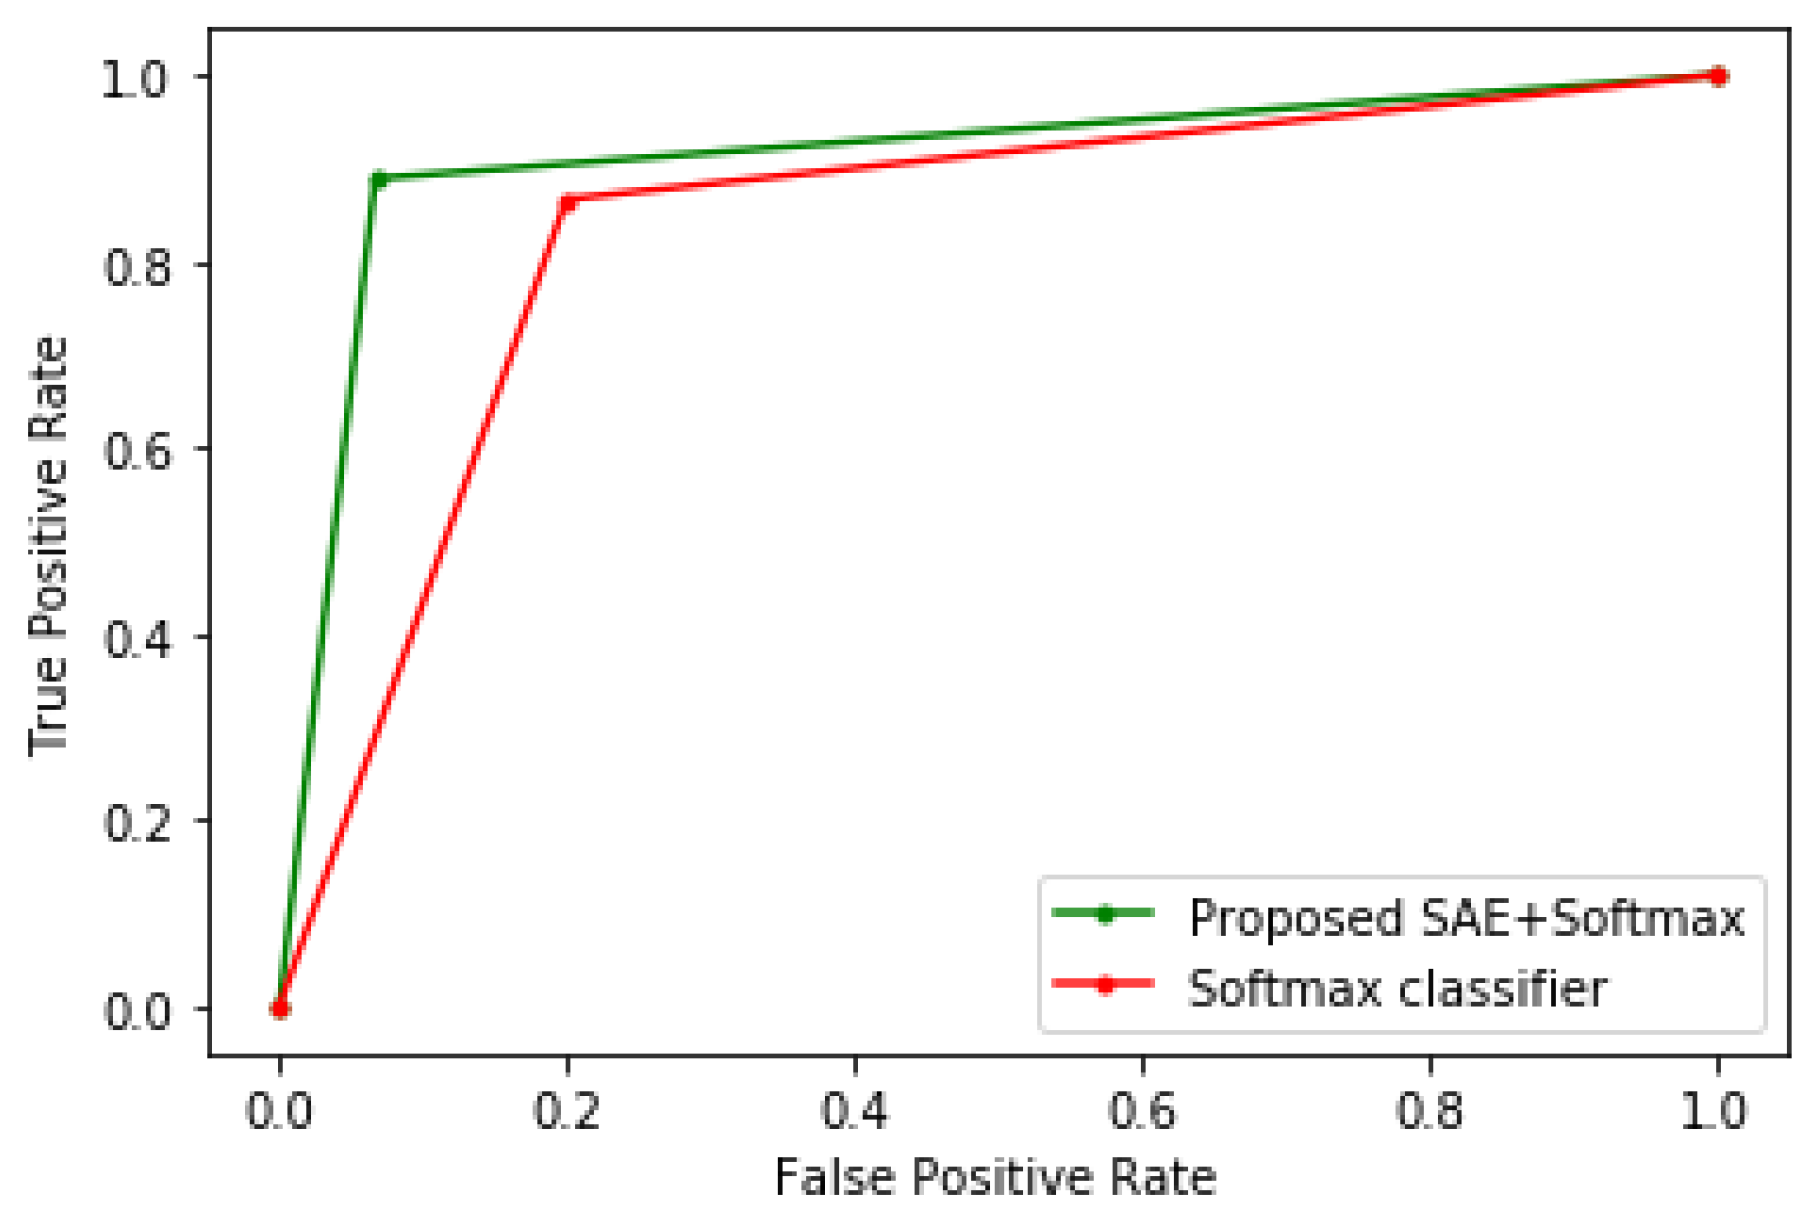
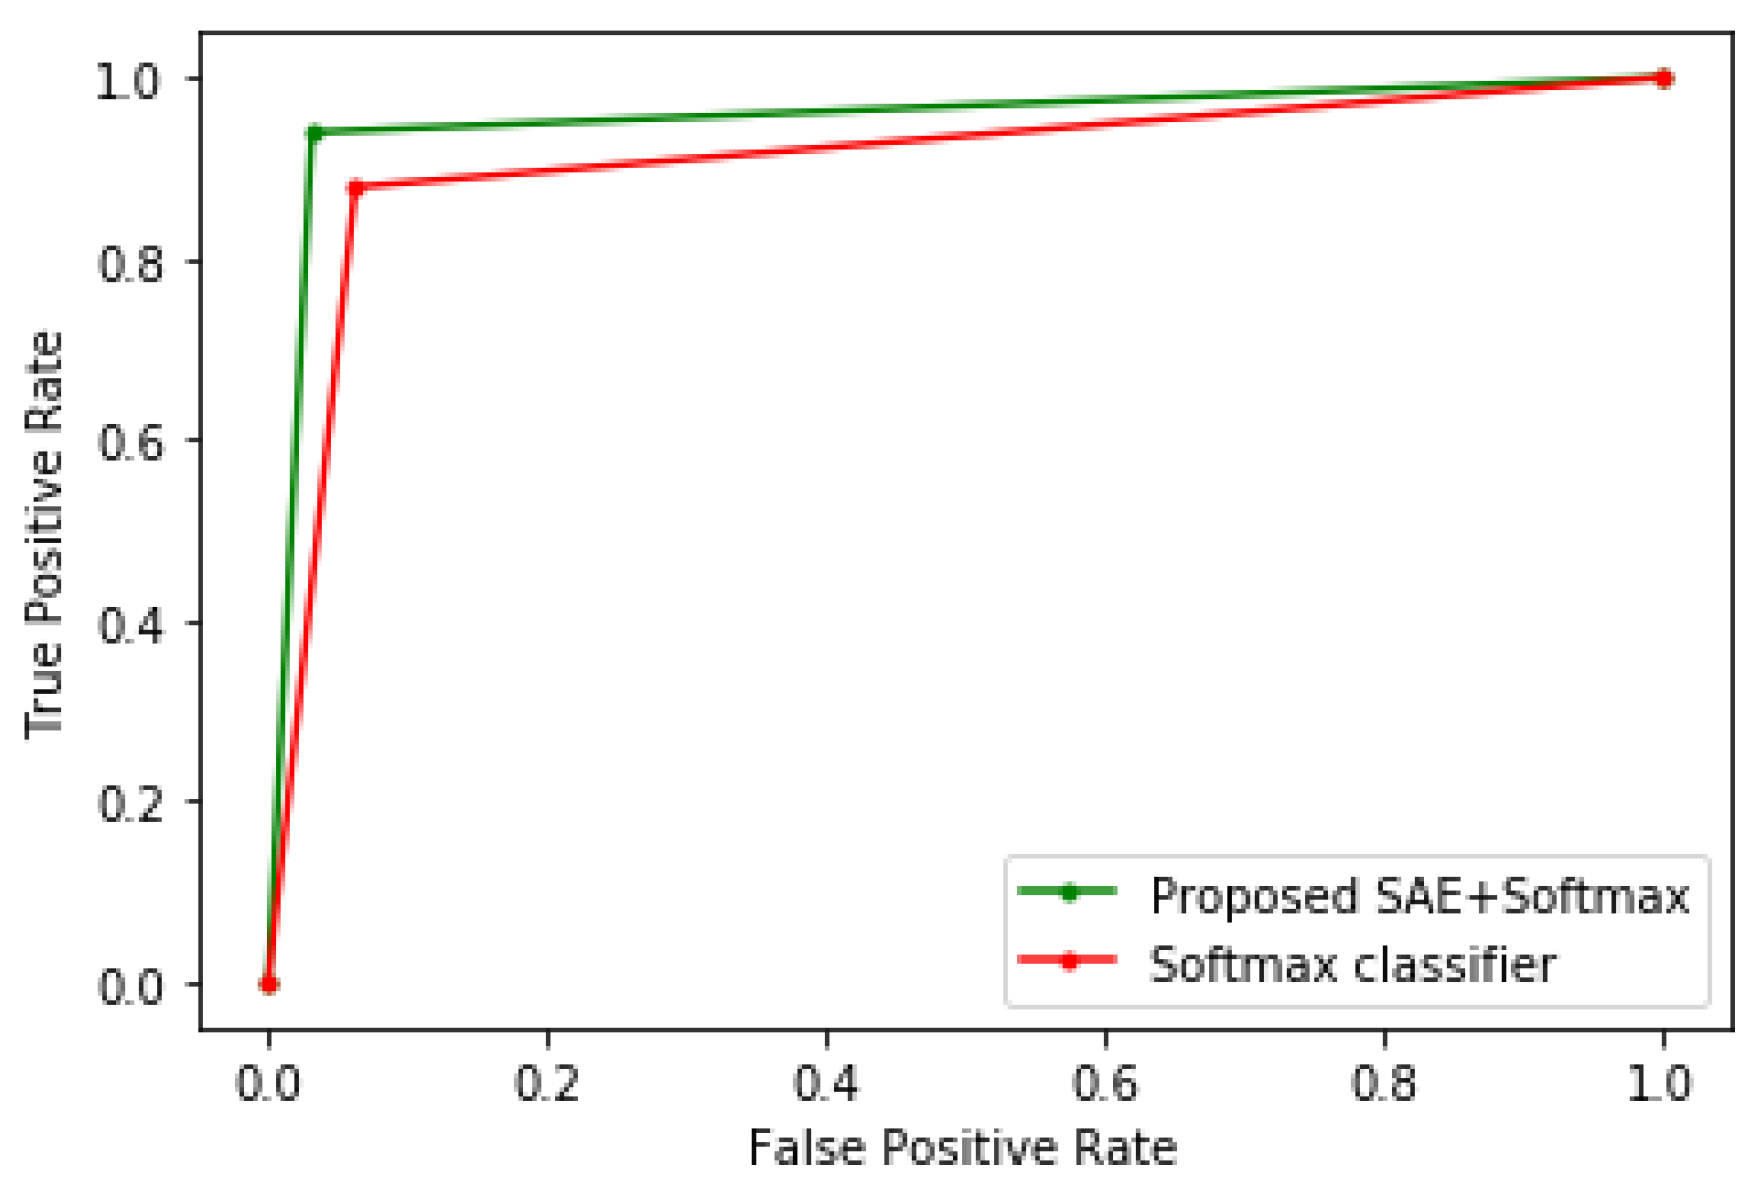
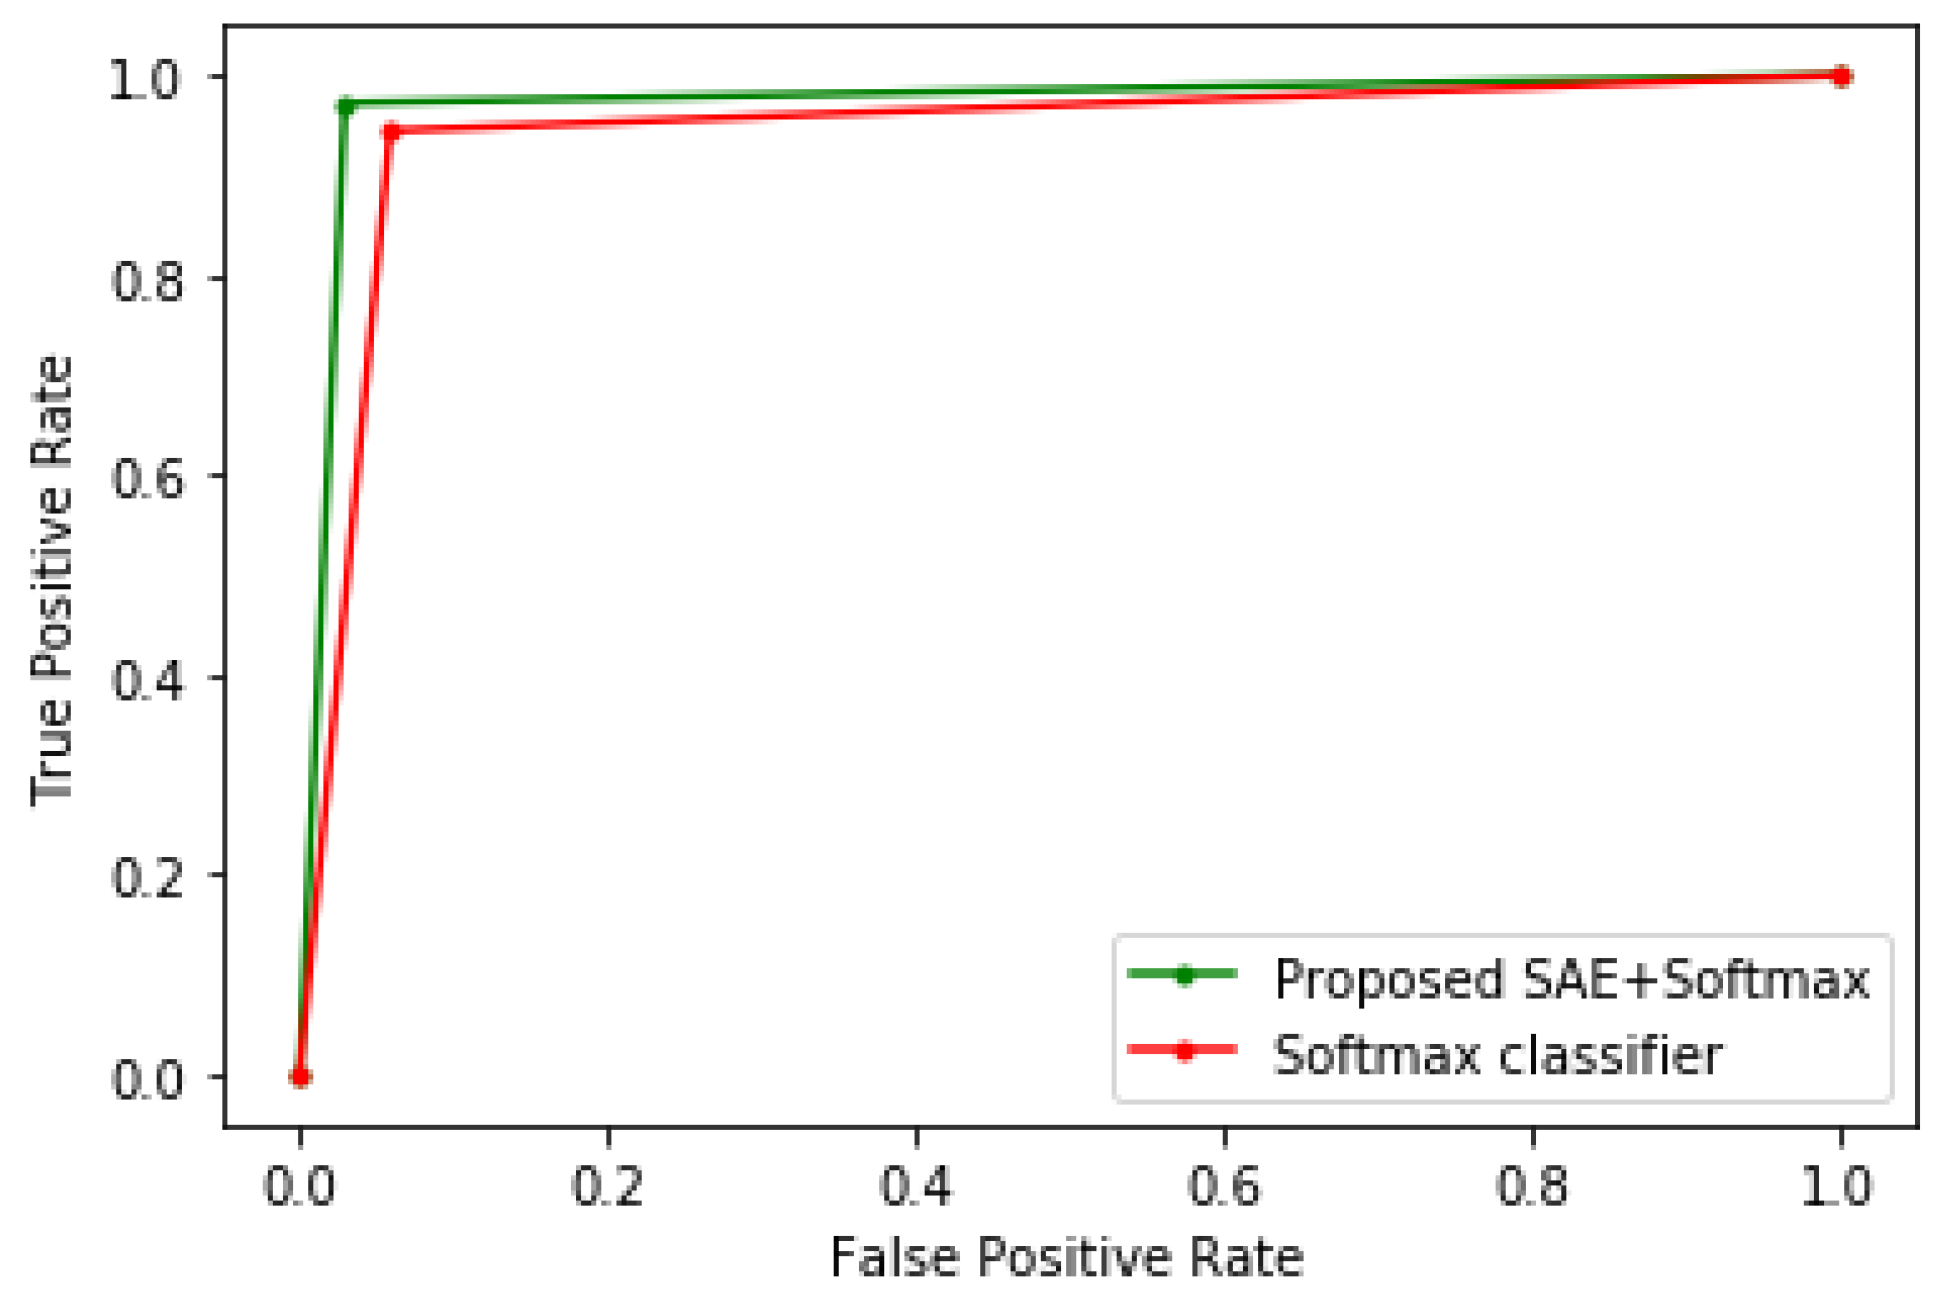
4. Results and Discussion
- True positive (TP): Sick people correctly predicted as sick.
- False-positive (FP): Healthy people wrongly predicted as sick.
- True negative (TN): Healthy people rightly predicted as healthy.
- False-negative (FN): Sick people wrongly predicted as healthy.
5. Conclusions
Author Contributions
Funding
Acknowledgments
Conflicts of Interest
References
- Stanley, D.E.; Campos, D.G. The Logic of Medical Diagnosis. Perspect. Biol. Med. 2013, 56, 300–315. [Google Scholar] [CrossRef] [PubMed]
- Epstein, H.M. The Most Important Medical Issue Ever: And Why You Need to Know More About It. Society to Improve Diagnosis in Medicine. 2019. Available online: https://www.improvediagnosis.org/dxiq-column/most-important-medical-issue-ever/ (accessed on 30 August 2020).
- Liu, N.; Li, X.; Qi, E.; Xu, M.; Li, L.; Gao, B. A novel Ensemble Learning Paradigm for Medical Diagnosis with Imbalanced Data. IEEE Access 2020, 8, 171263–171280. [Google Scholar] [CrossRef]
- Ma, Z.; Ma, J.; Miao, Y.; Liu, X.; Choo, K.K.R.; Yang, R.; Wang, X. Lightweight Privacy-preserving Medical Diagnosis in Edge Computing. IEEE Trans. Serv. Comput. 2020, 1. [Google Scholar] [CrossRef]
- Li, X.; Jia, M.; Islam, M.T.; Yu, L.; Xing, L. Self-supervised Feature Learning via Exploiting Multi-modal Data for Retinal Disease Diagnosis. IEEE Trans. Med. Imaging 2020, 1. [Google Scholar] [CrossRef] [PubMed]
- Chen, Z.; Guo, R.; Lin, Z.; Peng, T.; Peng, X. A data-driven health monitoring method using multi-objective optimization and stacked autoencoder based health indicator. IEEE Trans. Ind. Inform. 2020, 1. [Google Scholar] [CrossRef]
- Raghavendra, U.; Gudigar, A.; Bhandary, S.V.; Rao, T.N.; Ciaccio, E.J.; Acharya, U.R. A Two Layer Sparse Autoencoder for Glaucoma Identification with Fundus Images. J. Med. Syst. 2019, 43, 299. [Google Scholar] [CrossRef]
- Musafer, H.; Abuzneid, A.; Faezipour, M.; Mahmood, A. An Enhanced Design of Sparse Autoencoder for Latent Features Extraction Based on Trigonometric Simplexes for Network Intrusion Detection Systems. Electronics 2020, 9, 259. [Google Scholar] [CrossRef]
- Rubini, L.J.; Eswaran, P. UCI Machine Learning Repository: Chronic_Kidney_Disease Data Set. 2015. Available online: https://archive.ics.uci.edu/ml/datasets/chronic_kidney_disease (accessed on 26 June 2020).
- UCI Machine Learning Repository: Cervical cancer (Risk Factors) Data Set. Available online: https://archive.ics.uci.edu/ml/datasets/Cervical+cancer+%28Risk+Factors%29 (accessed on 27 January 2020).
- Framingham Heart Study Dataset. Available online: https://kaggle.com/amanajmera1/framingham-heart-study-dataset (accessed on 24 January 2020).
- Mienye, I.D.; Sun, Y.; Wang, Z. Improved sparse autoencoder based artificial neural network approach for prediction of heart disease. Inform. Med. Unlocked 2020, 18, 100307. [Google Scholar] [CrossRef]
- Verma, L.; Srivastava, S.; Negi, P.C. A Hybrid Data Mining Model to Predict Coronary Artery Disease Cases Using Non-Invasive Clinical Data. J. Med. Syst. 2016, 40, 178. [Google Scholar] [CrossRef]
- Tama, B.A.; Im, S.; Lee, S. Improving an Intelligent Detection System for Coronary Heart Disease Using a Two-Tier Classifier Ensemble. BioMed. Res. Int. 2020. Available online: https://www.hindawi.com/journals/bmri/2020/9816142/ (accessed on 28 August 2020). [CrossRef]
- Ahishakiye, E.; Wario, R.; Mwangi, W.; Taremwa, D. Prediction of Cervical Cancer Basing on Risk Factors using Ensemble Learning. In Proceedings of the 2020 IST-Africa Conference (IST-Africa), Kampala, Uganda, 6–8 May 2020; pp. 1–12. [Google Scholar]
- Xiong, Y.; Lu, Y. Deep Feature Extraction from the Vocal Vectors Using Sparse Autoencoders for Parkinson’s Classification. IEEE Access 2020, 8, 27821–27830. [Google Scholar] [CrossRef]
- Daoud, M.; Mayo, M.; Cunningham, S.J. RBFA: Radial Basis Function Autoencoders. In Proceedings of the 2019 IEEE Congress on Evolutionary Computation (CEC), Wellington, New Zealand, 10–13 June 2019; pp. 2966–2973. [Google Scholar] [CrossRef]
- Ng, A. Sparse Autoencoder. 2011. Available online: https://web.stanford.edu/class/cs294a/sparseAutoencoder.pdf (accessed on 6 June 2020).
- İrsoy, O.; Alpaydın, E. Unsupervised feature extraction with autoencoder trees. Neurocomputing 2017, 258, 63–73. [Google Scholar] [CrossRef]
- Kayabol, K. Approximate Sparse Multinomial Logistic Regression for Classification. IEEE Trans. Pattern Anal. Mach. Intell. 2020, 42, 490–493. [Google Scholar] [CrossRef]
- Herrera, J.L.L.; Figueroa, H.V.R.; Ramírez, E.J.R. Deep fraud. A fraud intention recognition framework in public transport context using a deep-learning approach. In Proceedings of the 2018 International Conference on Electronics, Communications and Computers (CONIELECOMP), Cholula Puebla, Mexico, 21–23 February 2018; pp. 118–125. [Google Scholar] [CrossRef]
- Wang, M.; Lu, S.; Zhu, D.; Lin, J.; Wang, Z. A High-Speed and Low-Complexity Architecture for Softmax Function in Deep Learning. In Proceedings of the 2018 IEEE Asia Pacific Conference on Circuits and Systems (APCCAS), Chengdu, China, 26–28 October 2018; pp. 223–226. [Google Scholar] [CrossRef]
- Ruder, S. An overview of gradient descent optimization algorithms. arXiv 2017, arXiv:1609.04747. [Google Scholar]
- Qian, N. On the momentum term in gradient descent learning algorithms. Neural Netw. 1999, 12, 145–151. [Google Scholar] [CrossRef]
- Mienye, I.D.; Sun, Y.; Wang, Z. An improved ensemble learning approach for the prediction of heart disease risk. Inform. Med. Unlocked 2020, 20, 100402. [Google Scholar] [CrossRef]
- Abdulhammed, R.; Musafer, H.; Alessa, A.; Faezipour, M.; Abuzneid, A. Features Dimensionality Reduction Approaches for Machine Learning Based Network Intrusion Detection. Electronics 2019, 8, 322. [Google Scholar] [CrossRef]
- Latha, C.B.C.; Jeeva, S.C. Improving the accuracy of prediction of heart disease risk based on ensemble classification techniques. Inform. Med. Unlocked 2019, 16, 100203. [Google Scholar] [CrossRef]
- Amin, M.S.; Chiam, Y.K.; Varathan, K.D. Identification of significant features and data mining techniques in predicting heart disease. Telemat. Inform. 2019, 36, 82–93. [Google Scholar] [CrossRef]
- Mohan, S.; Thirumalai, C.; Srivastava, G. Effective Heart Disease Prediction Using Hybrid Machine Learning Techniques. IEEE Access 2019, 7, 81542–81554. [Google Scholar] [CrossRef]
- Haq, A.U.; Li, J.P.; Memon, M.H.; Nazir, S.; Sun, R. A Hybrid Intelligent System Framework for the Prediction of Heart Disease Using Machine Learning Algorithms. Mob. Inf. Syst. 2018, 2018, 3860146. [Google Scholar] [CrossRef]
- Repaka, A.N.; Ravikanti, S.D.; Franklin, R.G. Design and Implementing Heart Disease Prediction Using Naives Bayesian. In Proceedings of the 2019 3rd International Conference on Trends in Electronics and Informatics (ICOEI), Tirunelveli, India, 23–25 April 2019; pp. 292–297. [Google Scholar] [CrossRef]
- Samuel, O.W.; Asogbon, G.M.; Sangaiah, A.K.; Fang, P.; Li, G. An integrated decision support system based on ANN and Fuzzy_AHP for heart failure risk prediction. Expert Syst. Appl. 2017, 68, 163–172. [Google Scholar] [CrossRef]
- Wu, W.; Zhou, H. Data-Driven Diagnosis of Cervical Cancer with Support Vector Machine-Based Approaches. IEEE Access 2017, 5, 25189–25195. [Google Scholar] [CrossRef]
- Abdullah, F.B.; Momo, N.S. Comparative analysis on Prediction Models with various Data Preprocessings in the Prognosis of Cervical Cancer. In Proceedings of the 2019 10th International Conference on Computing, Communication and Networking Technologies (ICCCNT), Kanpur, India, 6–8 July 2019; pp. 1–6. [Google Scholar] [CrossRef]
- Chang, C.-C.; Cheng, S.-L.; Lu, C.-J.; Liao, K.-H. Prediction of Recurrence in Patients with Cervical Cancer Using MARS and Classification. Int. J. Mach. Learn. Comput. 2013, 3, 75–78. [Google Scholar] [CrossRef]
- Ijaz, M.F.; Attique, M.; Son, Y. Data-Driven Cervical Cancer Prediction Model with Outlier Detection and Over-Sampling Methods. Sensors 2020, 20, 2809. [Google Scholar] [CrossRef]
- Nithya, B.; Ilango, V. Evaluation of machine learning based optimized feature selection approaches and classification methods for cervical cancer prediction. SN Appl. Sci. 2019, 1, 641. [Google Scholar] [CrossRef]
- Ogunleye, A.A.; Qing-Guo, W. XGBoost Model for Chronic Kidney Disease Diagnosis. IEEE/ACM Trans. Comput. Biol. Bioinform. 2019, 1. [Google Scholar] [CrossRef]
- Rady, E.-H.A.; Anwar, A.S. Prediction of kidney disease stages using data mining algorithms. Inform. Med. Unlocked 2019, 15, 100178. [Google Scholar] [CrossRef]
- Gupta, D.; Khare, S.; Aggarwal, A. A method to predict diagnostic codes for chronic diseases using machine learning techniques. In Proceedings of the 2016 International Conference on Computing, Communication and Automation (ICCCA), Greater Noida, India, 29–30 April 2016; pp. 281–287. [Google Scholar] [CrossRef]
- Khan, B.; Naseem, R.; Muhammad, F.; Abbas, G.; Kim, S. An Empirical Evaluation of Machine Learning Techniques for Chronic Kidney Disease Prophecy. IEEE Access 2020, 8, 55012–55022. [Google Scholar] [CrossRef]
- Raju, N.V.G.; Lakshmi, K.P.; Praharshitha, K.G.; Likhitha, C. Prediction of chronic kidney disease (CKD) using Data Science. In Proceedings of the 2019 International Conference on Intelligent Computing and Control Systems (ICCS), Madurai, India, 15–17 May 2019; pp. 642–647. [Google Scholar] [CrossRef]
- Aljaaf, A.J.; Al-Jumeily, D.; Haglan, H.M.; Alloghani, M.; Baker, T.; Hussain, A.J.; Mustafina, J. Early Prediction of Chronic Kidney Disease Using Machine Learning Supported by Predictive Analytics. In Proceedings of the 2018 IEEE Congress on Evolutionary Computation (CEC), Rio de Janeiro, Brazil, 8–13 July 2018; pp. 1–9. [Google Scholar] [CrossRef]
- Ebiaredoh-Mienye, S.A.; Esenogho, E.; Swart, T.G. Artificial Neural Network Technique for Improving Prediction of Credit Card Default: A Stacked Sparse Autoencoder Approach. Int. J. Electr. Comput. Eng. (IJECE) 2020. [Google Scholar] [CrossRef]


| Algorithm | Accuracy (%) | Precision (%) | Recall (%) | F1 Score (%) |
|---|---|---|---|---|
| LR | 83 | 84 | 86 | 84 |
| CART | 75 | 74 | 75 | 74 |
| SVM | 82 | 78 | 82 | 80 |
| KNN | 81 | 75 | 81 | 77 |
| LDA | 83 | 81 | 83 | 82 |
| Softmax classifier | 86 | 84 | 88 | 86 |
| Proposed SAE + Softmax | 91 | 93 | 90 | 92 |
| Algorithm | Accuracy (%) | Precision (%) | Recall (%) | F1 Score (%) |
|---|---|---|---|---|
| LR | 94 | 96 | 91 | 93 |
| CART | 90 | 93 | 96 | 94 |
| SVM | 94 | 90 | 93 | 91 |
| KNN | 93 | 98 | 95 | 96 |
| LDA | 95 | 93 | 91 | 92 |
| Softmax classifier | 94 | 97 | 91 | 94 |
| Proposed SAE + Softmax | 97 | 98 | 95 | 97 |
| Algorithm | Accuracy (%) | Precision (%) | Recall (%) | F1 Score (%) |
|---|---|---|---|---|
| LR | 98 | 93 | 97 | 95 |
| CART | 95 | 97 | 95 | 96 |
| SVM | 96 | 94 | 96 | 95 |
| KNN | 94 | 93 | 89 | 91 |
| LDA | 96 | 97 | 93 | 95 |
| Softmax classifier | 96 | 95 | 97 | 96 |
| Proposed SAE + Softmax | 98 | 97 | 97 | 97 |
| Algorithm | Method | Accuracy (%) |
|---|---|---|
| Verma et al. [13] | PSO and Softmax regression | 88.4 |
| Tama et al. [14] | Ensemble and PSO | 85.71 |
| Latha and Jeeva [27] | An Ensemble of NB, BN, RF, and MLP | 85.48 |
| Amin et al. [28] | A hybrid NB and LR | 87.4 |
| Mohan et al. [29] | HRFLM | 88.4 |
| Haq et al. [30] | LASSO-LR Model | 89 |
| Repaka et al. [31] | NB-AES | 89.77 |
| Samuel et al. [32] | ANN-Fuzzy-AHP | 91 |
| Mienye et al. [12] | SAE+ANN | 90 |
| Our approach | Improved SAE + Softmax | 91 |
| Algorithm | Method | Accuracy (%) |
|---|---|---|
| Wu and Zhou [33] | SVM-PCA | 94.03 |
| Abdullah et al. [34] | SVM LR | 93.4884 93.4884 |
| Chang et al. [35] | C5.0 | 96 |
| Ijaz et al. [36] | iForest+SMOTE+RF | 98.925 |
| Mienye et al. [12] | SAE+ANN | 98 |
| Nithya and Ilango [37] | C5.0 RF | 97 96.9 |
| Our approach | Improved SAE + Softmax | 97 |
| Algorithm | Method | Accuracy (%) |
|---|---|---|
| Ogunleye and Qing-Guo [38] | Optimized XGBoost | 100 |
| Rady and Anwar [39] | PNN | 96.7 |
| Gupta et al. [40] | AdaBoost | 88.66 |
| Khan et al. [33] | NBTree | 98.75 |
| Raju et al. [42] | XGBoost | 99.29 |
| Aljaaf et al. [43] | MLP | 98.1 |
| Our approach | Improved SAE + Softmax | 98 |
Publisher’s Note: MDPI stays neutral with regard to jurisdictional claims in published maps and institutional affiliations. |
© 2020 by the authors. Licensee MDPI, Basel, Switzerland. This article is an open access article distributed under the terms and conditions of the Creative Commons Attribution (CC BY) license (http://creativecommons.org/licenses/by/4.0/).
Share and Cite
Ebiaredoh-Mienye, S.A.; Esenogho, E.; Swart, T.G. Integrating Enhanced Sparse Autoencoder-Based Artificial Neural Network Technique and Softmax Regression for Medical Diagnosis. Electronics 2020, 9, 1963. https://doi.org/10.3390/electronics9111963
Ebiaredoh-Mienye SA, Esenogho E, Swart TG. Integrating Enhanced Sparse Autoencoder-Based Artificial Neural Network Technique and Softmax Regression for Medical Diagnosis. Electronics. 2020; 9(11):1963. https://doi.org/10.3390/electronics9111963
Chicago/Turabian StyleEbiaredoh-Mienye, Sarah A., Ebenezer Esenogho, and Theo G. Swart. 2020. "Integrating Enhanced Sparse Autoencoder-Based Artificial Neural Network Technique and Softmax Regression for Medical Diagnosis" Electronics 9, no. 11: 1963. https://doi.org/10.3390/electronics9111963
APA StyleEbiaredoh-Mienye, S. A., Esenogho, E., & Swart, T. G. (2020). Integrating Enhanced Sparse Autoencoder-Based Artificial Neural Network Technique and Softmax Regression for Medical Diagnosis. Electronics, 9(11), 1963. https://doi.org/10.3390/electronics9111963