Article

Detection of Self-Healing Discharge in Metallized Film Capacitors Using an Ultrasonic Method

1
Key Laboratory for Biomedical Engineering of Ministry of Education, Zhejiang University, Hangzhou 310027, China
2
Zhejiang Fangyuan Electrical Equipment Testing Co., Ltd., Jiaxing 314033, China
3
State Grid Electric Power Research Institute-Wuhan Nanrui Co., Ltd., Wuhan 430070, China
4
School of Electrical and Power Engineering, China University of Mining and Technology, Xuzhou 221116, China
*
Author to whom correspondence should be addressed.
Electronics 2020, 9(11), 1893; https://doi.org/10.3390/electronics9111893
Submission received: 7 October 2020 / Revised: 4 November 2020 / Accepted: 8 November 2020 / Published: 11 November 2020
(This article belongs to the Special Issue Analysis and Optimal Design Method for Electric Machine and Devices)

Abstract

:
Benefiting from self-healing features, metallized film capacitors (MFCs) are widely employed to compensate reactive power (VAR) and thus improve the performance of AC systems. To ensure the aforementioned functions, self-healing testing is a compulsory quality inspection for every type of MFC. In 2014, the International Electrotechnical Commission (IEC) issued a standard that recommended a general and instructive test procedure based on audible noise or ultrasound signals. However, more details relevant to this high voltage (HV) test were not provided. In this paper, we focused on the ultrasonic detection technique to reveal the self-healing characteristics of two typical MFCs. By launching a series of HV tests with star and delta MFCs, the waveform features, discharge energy, and spectrum distributions were analyzed. It was observed that the partial discharge always occurs before self-healing discharge with the same spectrum features ranging above 40 kHz. To solve the entanglement of these two discharge processes, a relative amplitude difference method is proposed. Based on the experimental observations, a detection algorithm incorporated with the ultrasonic emission sensors, preamplifier, and high-speed A/D converter was developed to assist the self-healing performance test.

1. Introduction

Metallized film capacitors (MFCs) are widely used in reactive power compensation and the improvement of power factors. The key property of MFCs is the spontaneous extinction, named “self-healing”, of a local electrical breakdown due to defects or micro-voids, and this property can prevent the device from being destroyed by such discharges [1]. MFCs with poor self-healing characteristics can fail to heal and increase the danger of explosion in MFCs. As a result, self-healing measurement of MFCs is essential to eliminating poor-quality products and maintaining safety.
The reliability of capacitors is important to the health of power electronic systems, so their degradation models and lifetime predictions have been investigated [2,3,4]. After investigation of the self-healing process, the most preferable type for completing self-healing and its favored conditions were given [5]. The contributing factors to self-healing, including the sheet resistance of electrodes; the interlayer air, pressure, and temperature dependence [6,7]; and other dynamic characteristics [8], were investigated to evaluate their effects. Models were built to describe the destruction [9,10,11] and the clearing mechanism [12] in the self-healing process. To evaluate the self-healing performance, measurement systems with AC supply were used to measure the properties of individual self-healing events [13] and identify self-healing [14]. These results can contribute to shorter development cycles of MFCs. Measurements with the AC power supply mentioned above are limited since the AC current can cause dangers of explosion. V. Belko detected self-healing by voltage change on electrodes with a DC-based detecting system [15]. The results were vital to MFCs’ degradation and aging laws, but this measurement method cannot count the self-healing events. Another DC measuring method based on the leakage current was proposed [16]. Although the results can be used to predict the lifetime of MFCs, such a small current is easily affected. An effective method of self-healing detection based on ultrasound has been suggested [17]. However, no quantitative data of this method have been reported. The objective of this research was to detect self-healing events using the ultrasonic method and provide some experimental data for engineers as a useful reference.

2. Self-Healing Detection with Ultrasonics

2.1. Typical MFC Structures

A typical MFC consists of the capacitor elements, wire, stuffing, wire terminals, ground terminals, discharge resistors, and a metal shell, as shown in Figure 1. Groups of capacitor units constitute one MFC, while a unit consists of several cylindrical capacitor elements. The stuffing improves the medium compressive strength and discharge property. The discharge resistors release the residual voltage after powering off. The metal shell protects the inside items and radiates heat as well.
One MFC consists of three phase units, while a phase consists of one or more cylindrical capacitor elements. The phases are connected by two main methods: Δ connection and Y-N connection. Figure 2 displays these connections. In Figure 2, L1, L2, L3 stand for three live wires with different phase values respectively and N represents the neutral line. As shown in Figure 2, phases in Δ-connection capacitors are connected end to end, while the phases share the same end with a neutral line in Y-N-connection capacitors.
Figure 3 shows the structure of one capacitor element from three views. Centered on the insulated mandrel, the metallized films are wound into the cylindrical elements. The metallized films are composed of thin layers (tens of nanometers [18]) of metal, known as the metallic coating, evaporated onto the surface of polymer films [19]. After that, thin layers of metal (metal spraying layer) are sputtered onto both sides of the cylindrical elements and become the electrodes.
Table 1 summarizes the materials most commonly used in MFCs, although different producers may have their own suppliers for these materials [18].

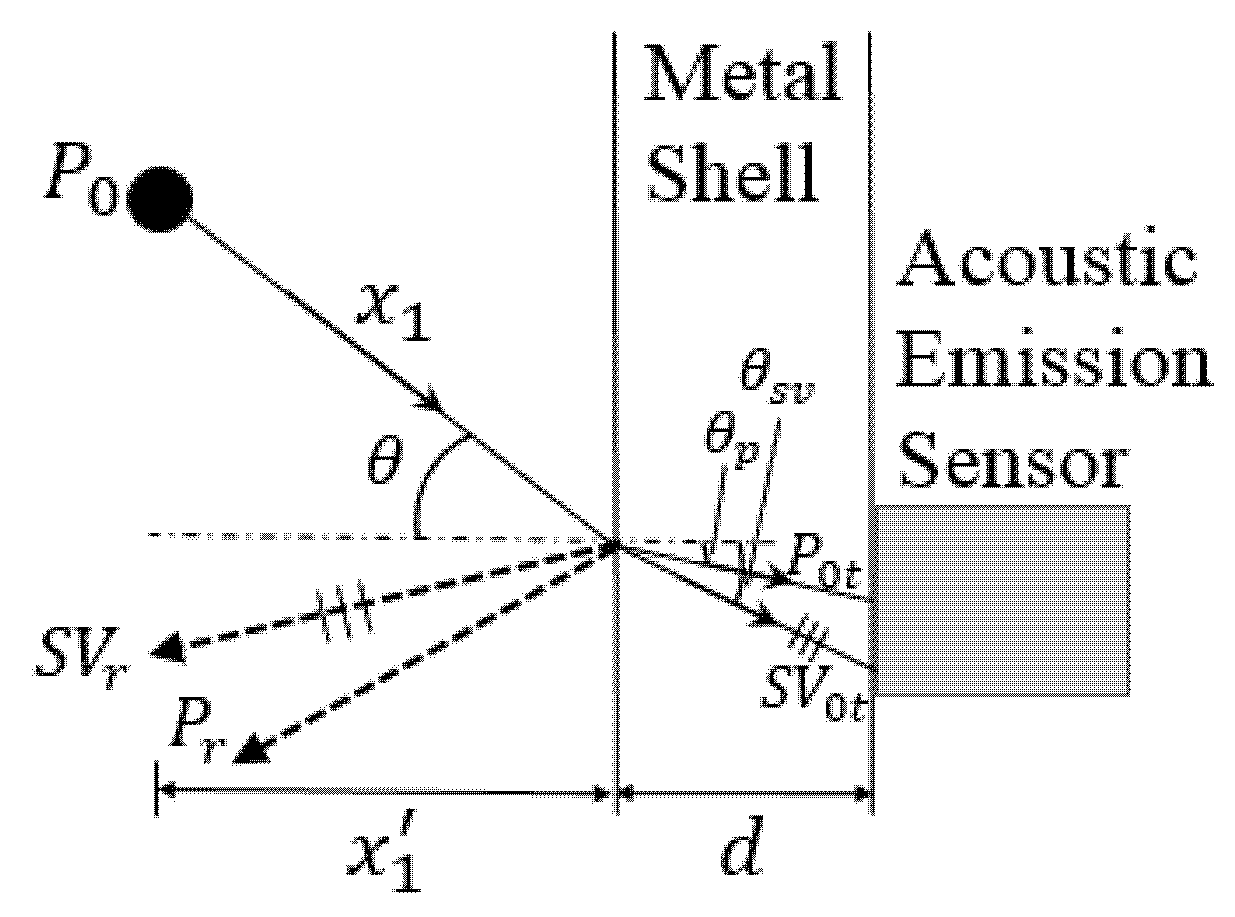
2.2. Self-Healing and Ultrasound Emission

Normally, there are some defects, such as micro-voids and air gaps, in the metallized films. A localized breakdown appears due to these defects as the applied voltage increases. The stored energy discharged from the breakdown will cause a high temperature. The film is punctured because of the breakdown. The heat vaporizes the thin electrodes at the defect site. An event of self-healing or partial discharge is the interruption of the plasma of the breakdown arc whereby the site becomes electrically isolated at the end [20]. Self-healing appears at the sites of micro-voids, while partial discharge appears at the sites of air gaps, and their dissipated energy for the breakdown differs.
The pressure from the discharged heat and electric field force will push the bubbles inside MFCs to expand and shrink and change the partial volume. The dense–sparse waves (known as the sound waves) generated from the volume change are detected outside the capacitor. According to the method suggested by IEC [17], the sound waves are mainly in the ultrasonic frequency band (40–80 kHz).
The ultrasound waves propagating inside the MFCs include longitudinal waves and shear waves. The former have the same direction for particle vibration and propagation, while the direction for shear waves is vertical. The ultrasound waves generated from the inside discharges of MFCs are longitudinal waves, and they will refract and reflect at the interface between different media.
The ultrasound waves will be reflected by the capacitor elements, the metal shell, cable lines, and other parts of the MFC and received by the acoustic emission sensor attached to the shell at the end. The possible propagation paths are shown in Figure 4. The received ultrasonic signal is composed of the first-arrival signal x 1 and multi-reflected signals x 2 .
Figure 5 shows a received ultrasonic signal inside a sealed container. It can be seen that the amplitude of the reflected waves is much smaller than that of the first-arrival waves, and the main energy of the ultrasonic signal is determined by the first-arrival waves. Thus, only the first-arrival waves are mainly calculated.
The propagation path of the first-arrival ultrasonic waves is given in Figure 6, and it can be seen that the initial ultrasound wave P 0 is refracted into two separate waves—longitudinal wave P 0 t and shear wave S V 0 t —after traveling through path x 1 with a horizontal length x 1 . At the same time, P 0 is reflected at the interface and generates two separate reflected waves—reflected longitudinal wave P r and reflected shear wave S V r . The ratio between the maximum amplitudes of the refracted and incident waves is known as the refraction coefficient and depends on the acoustic impedances of the two materials (stuffing and metal shell), Z s , m s = ρ c , where ρ is the material’s density and c is the speed of sound in the material [21,22]. The refraction coefficients of the refracted longitudinal wave and shear wave ( T P , T S V respectively) are calculated as follows:
T P = 2 Z m s cos θ Z m s cos θ + Z s cos θ p
T S V = 2 Z m s cos θ Z m s cos θ + Z s cos θ s v
where θ is the incident angle, while θ p and θ s v represent the refracting angles of the longitudinal waves and shear waves, respectively.
With regarding to the attenuation in the stuffing, the refracted longitudinal wave and shear wave can be described as follows:
P 0 t = P 0 · e α s x 1 x 1 · 2 Z m cos θ Z m cos θ + Z s cos θ p
S V 0 t = P 0 · e α s x 1 x 1 · 2 Z m cos θ Z m cos θ + Z s cos θ s v
where P 0 is the initial sound pressure of the source and α s is the acoustic attenuation coefficient of the stuffing. x 1 is the length of the travelling path.
According to Snell’s Law, the angles θ p and θ s v can be described as
θ p = arcsin ( v p m · sin θ v p s )
θ s v = arcsin ( v s v m · sin θ v p s )
where v p s and v p m represent the sound velocities of longitudinal waves in the stuffing and metal shell, respectively, while v s v m is the sound velocity of the refracting shear waves in the metal shell.
The attenuation and time delay in the metal shell can be ignored since the thickness is normally less than 1 mm, and the total sound pressure P t o t a l received by the acoustic emission sensor can be described as
P t o t a l = P 0 t 2 + S V 0 t 2
It can be concluded that the sound pressure of received ultrasonic signals is determined by the initial sound waves caused by the inside discharges and the acoustic properties of the stuffing in MFCs.

3. Ultrasonic Features of Self-Healing Events

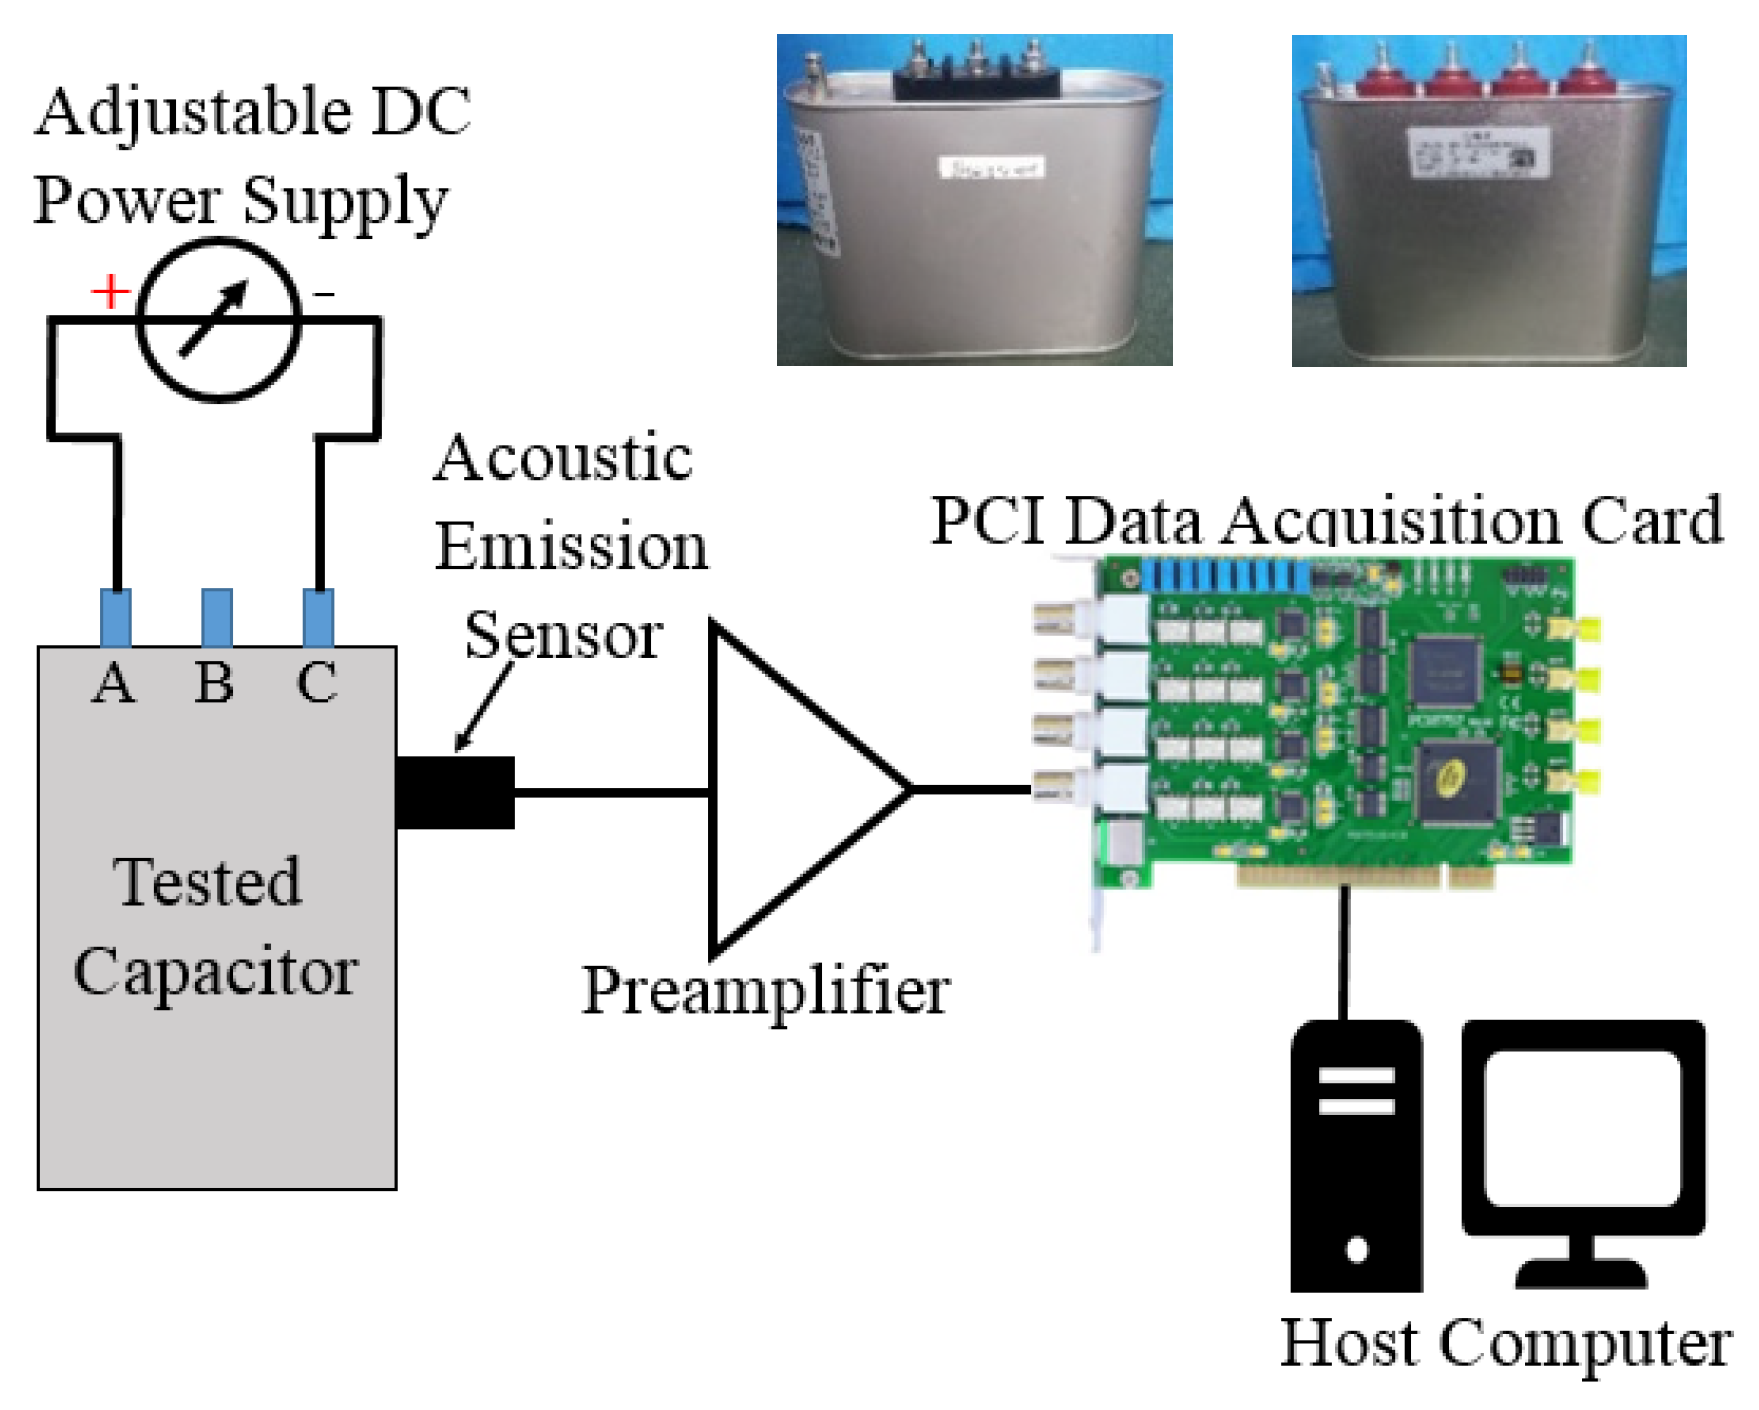
3.1. Experimental Setup

According to international standards [17], an experimental system was built to detect self-healing discharges; Figure 7 shows its setup. In the system, a series of high voltages are applied to two of the electrodes of the tested capacitors by the adjustable DC power supply. Then, the ultrasound waves generated from the discharges are received by an acoustic emission sensor. The acoustic emission sensor is a commercial device (SR 40 M) with maximum sensitivity of 75 dB. As reported in reference [17], the central frequency of the MFC self-healing signal is at around 60 kHz, which is located within the frequency band of the employed sensor (15–70 kHz). It is anticipated that customized ultrasonic transducers with larger frequency range, i.e., spiral-shaped ultrasonic sensors, could perform better in sampling the discharge signal [23,24]. The ultrasonic self-healing signal is amplified 100 dB by the preamplifier, and this analogue signal is converted to a digital signal by the data acquisition card with a peripheral component interconnection (PCI). The host computer is responsible for the processing and counting of the ultrasonic self-healing signal. In this paper, dry-type MFCs with different inside connections and values of reactive power were compared and measured. Table 2 gives the basic electric parameters of these tested MFCs.

3.2. Ultrasonic Time-Domain Features in Self-Healing Detection

With increasing applied voltage, the received ultrasound waves were recorded as shown in Figure 8. The test procedure can be manually divided into three stages, namely, the beginning stage, the partial discharge stage, and the self-healing stage.

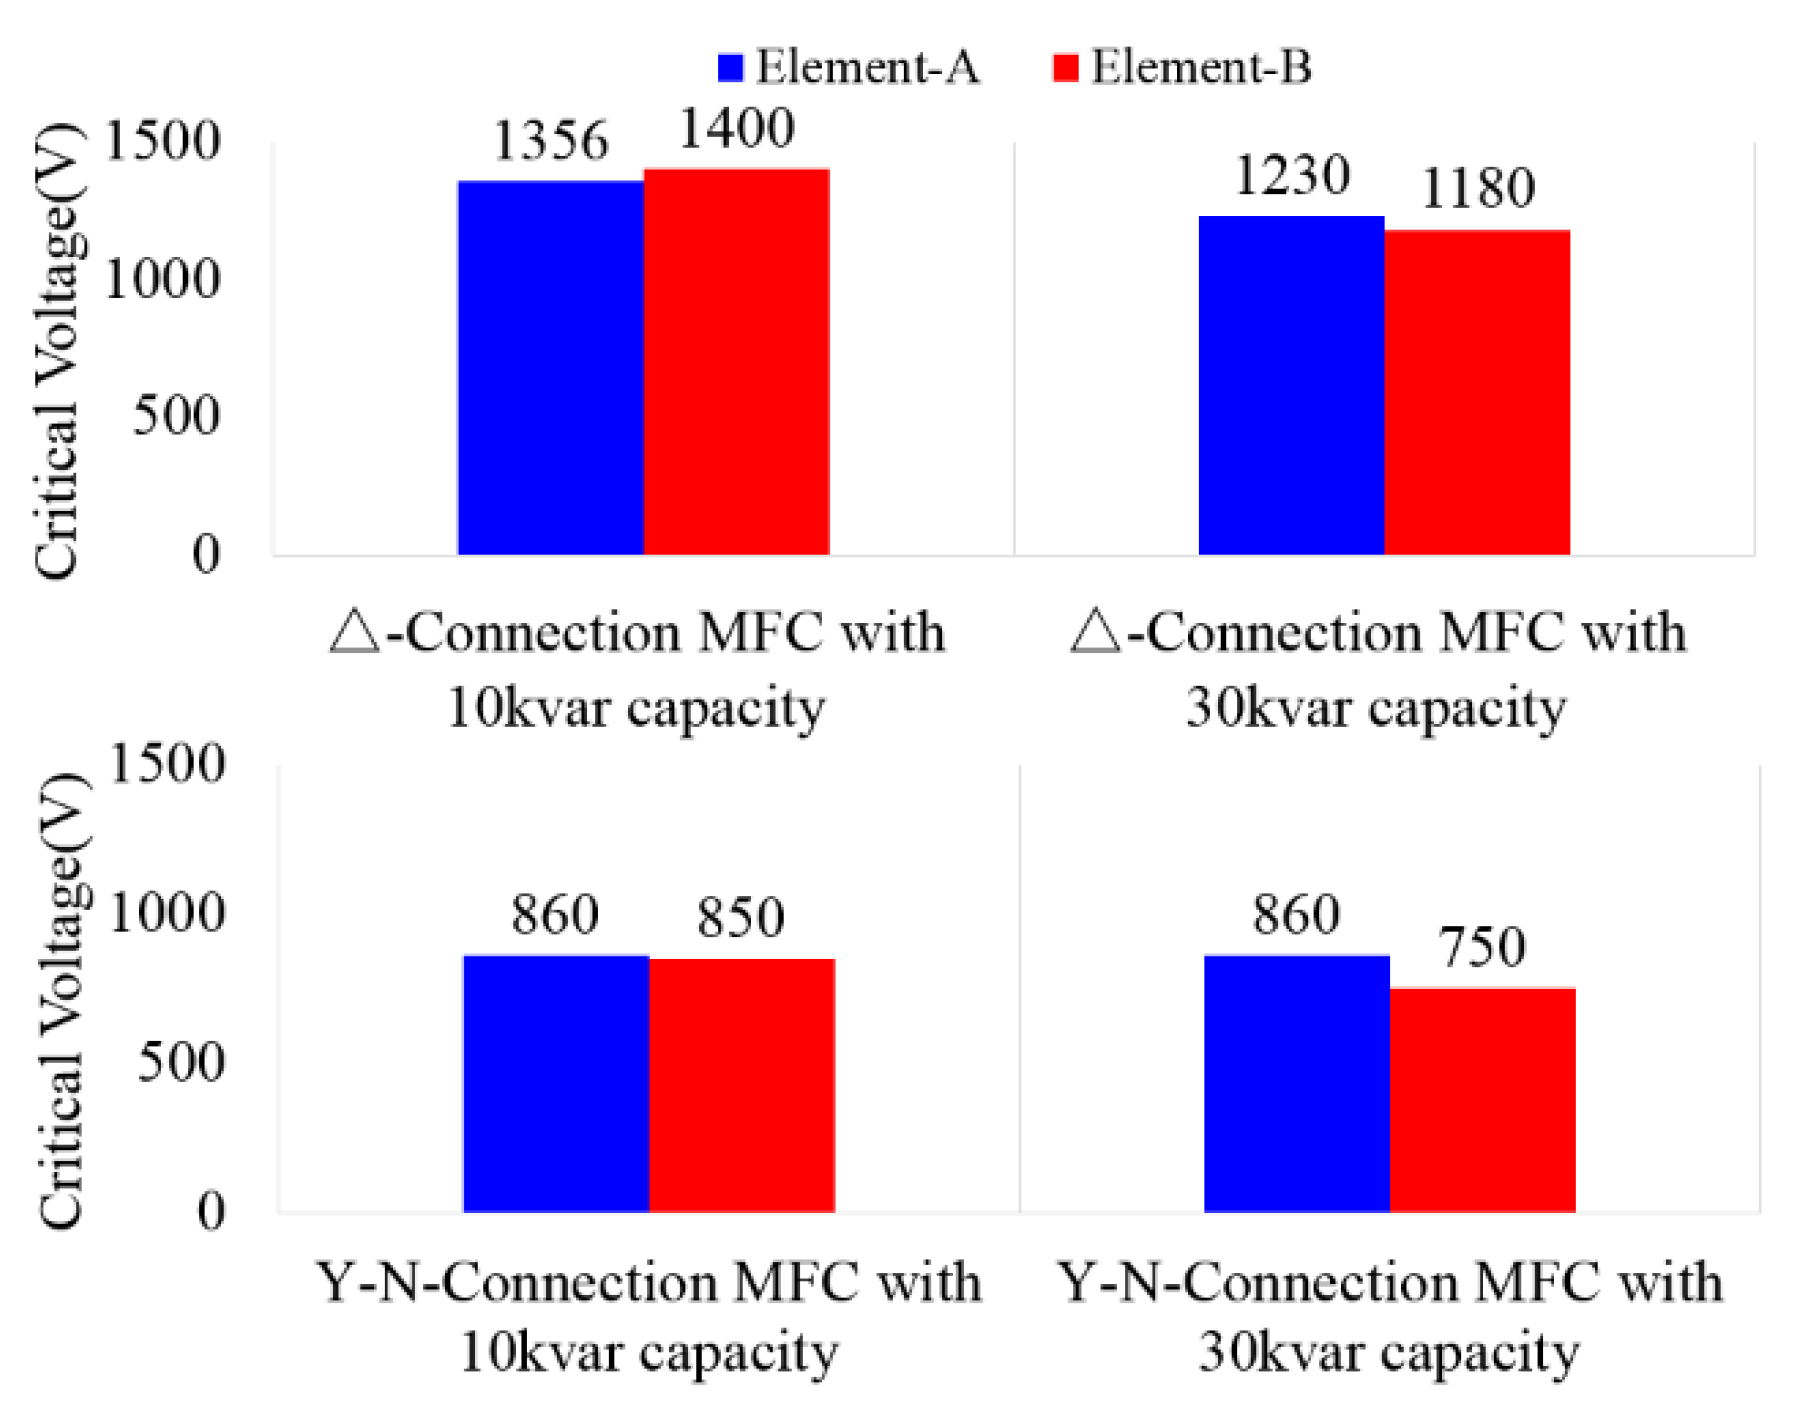
3.2.1. Critical Voltages for Self-Healing Discharges

The three stages in self-healing detection can be differentiated by the operating voltages. The applied voltage was raised to 1000 V firstly and then raised at a lower speed, as shown in Figure 9. The beginning stage was defined below 600 V. When the voltage approached 600 V, partial discharges occurred, and the detection moved to the partial discharge stage. The self-healing discharges did not occur until the applied voltage reached 1400 V.
Partial discharges still happened occasionally even after entering the self-healing stage, so they could not be distinguished from self-healing discharges by the applied voltage. The same measurement was repeated with at least 10 different capacitors. However, the critical voltage of partial discharge was randomly distributed within a range from 600 V to 700 V. This voltage uncertainty was also observed in the self-healing stage.
The measured Δ-connection MFCs had nominal voltages ( U N ) of 450 V, while those of the Y-N-connection MFCs were 250 V. The values of nominal reactive power for the tested MFCs were 10 kvar and 30 kvar, respectively. In the measurement, as shown in Figure 7, high DC voltage (U) was applied to two of the electrodes of the tested MFCs. For Y-N-connection MFCs, because of the parallel structure shown in Figure 2, the voltage applied in each element of the tested phase was equal to the applied voltage U, while that for the other two phases was zero. For Δ-connection MFCs, the value of voltage applied in each element of the tested phase was equal to the applied voltage U, while that for the other two phases was U/2. Figure 10 presents the critical voltages of each element in the measured MFCs.
Since every element in the same MFC has the same production, the critical voltages of self-healing remained at the same level for different elements in the same MFC, apart from the Y-N-connection MFC with capacity of 30 kvar. Besides this, the critical voltages of the Y-N-connection MFCs were lower than those of the Δ-connection MFCs with the same capacities. The critical voltages are related to U N (approximately 3 U N ~4 U N ) and are within the range of international standards [17]. This voltage level (3 U N ~4 U N ) can be used as a safe reference value for testing the self-healing property of MFCs.

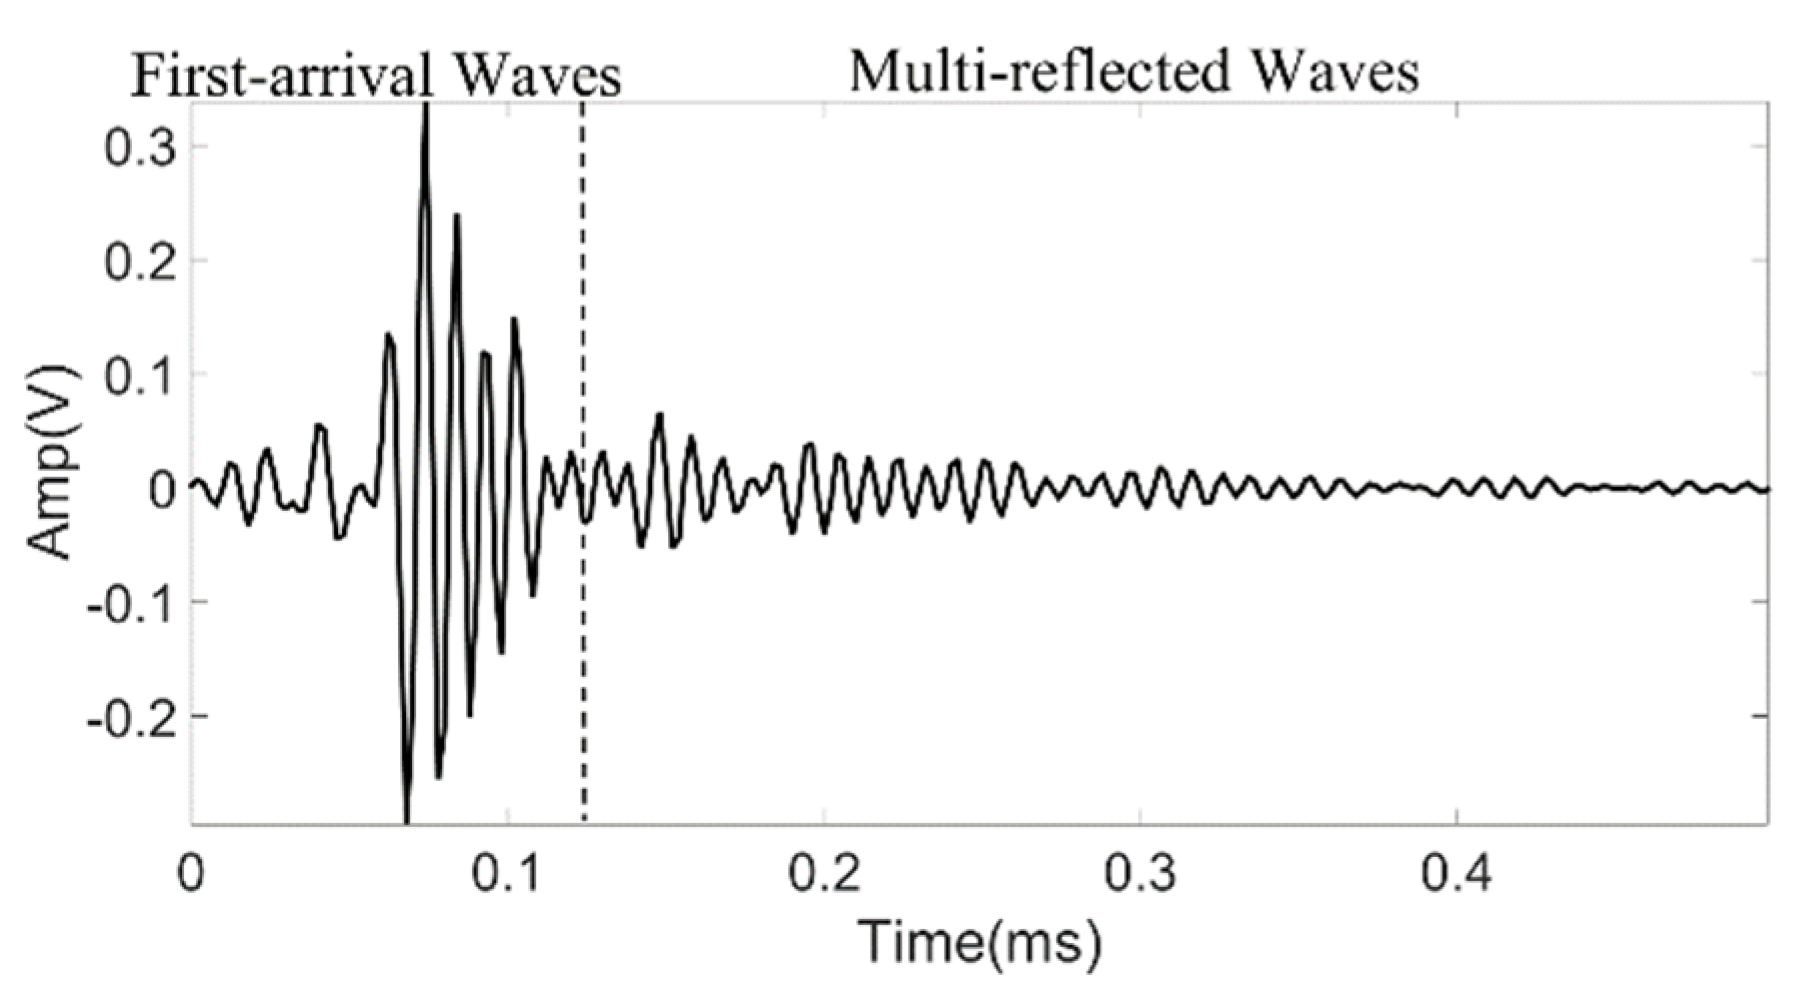
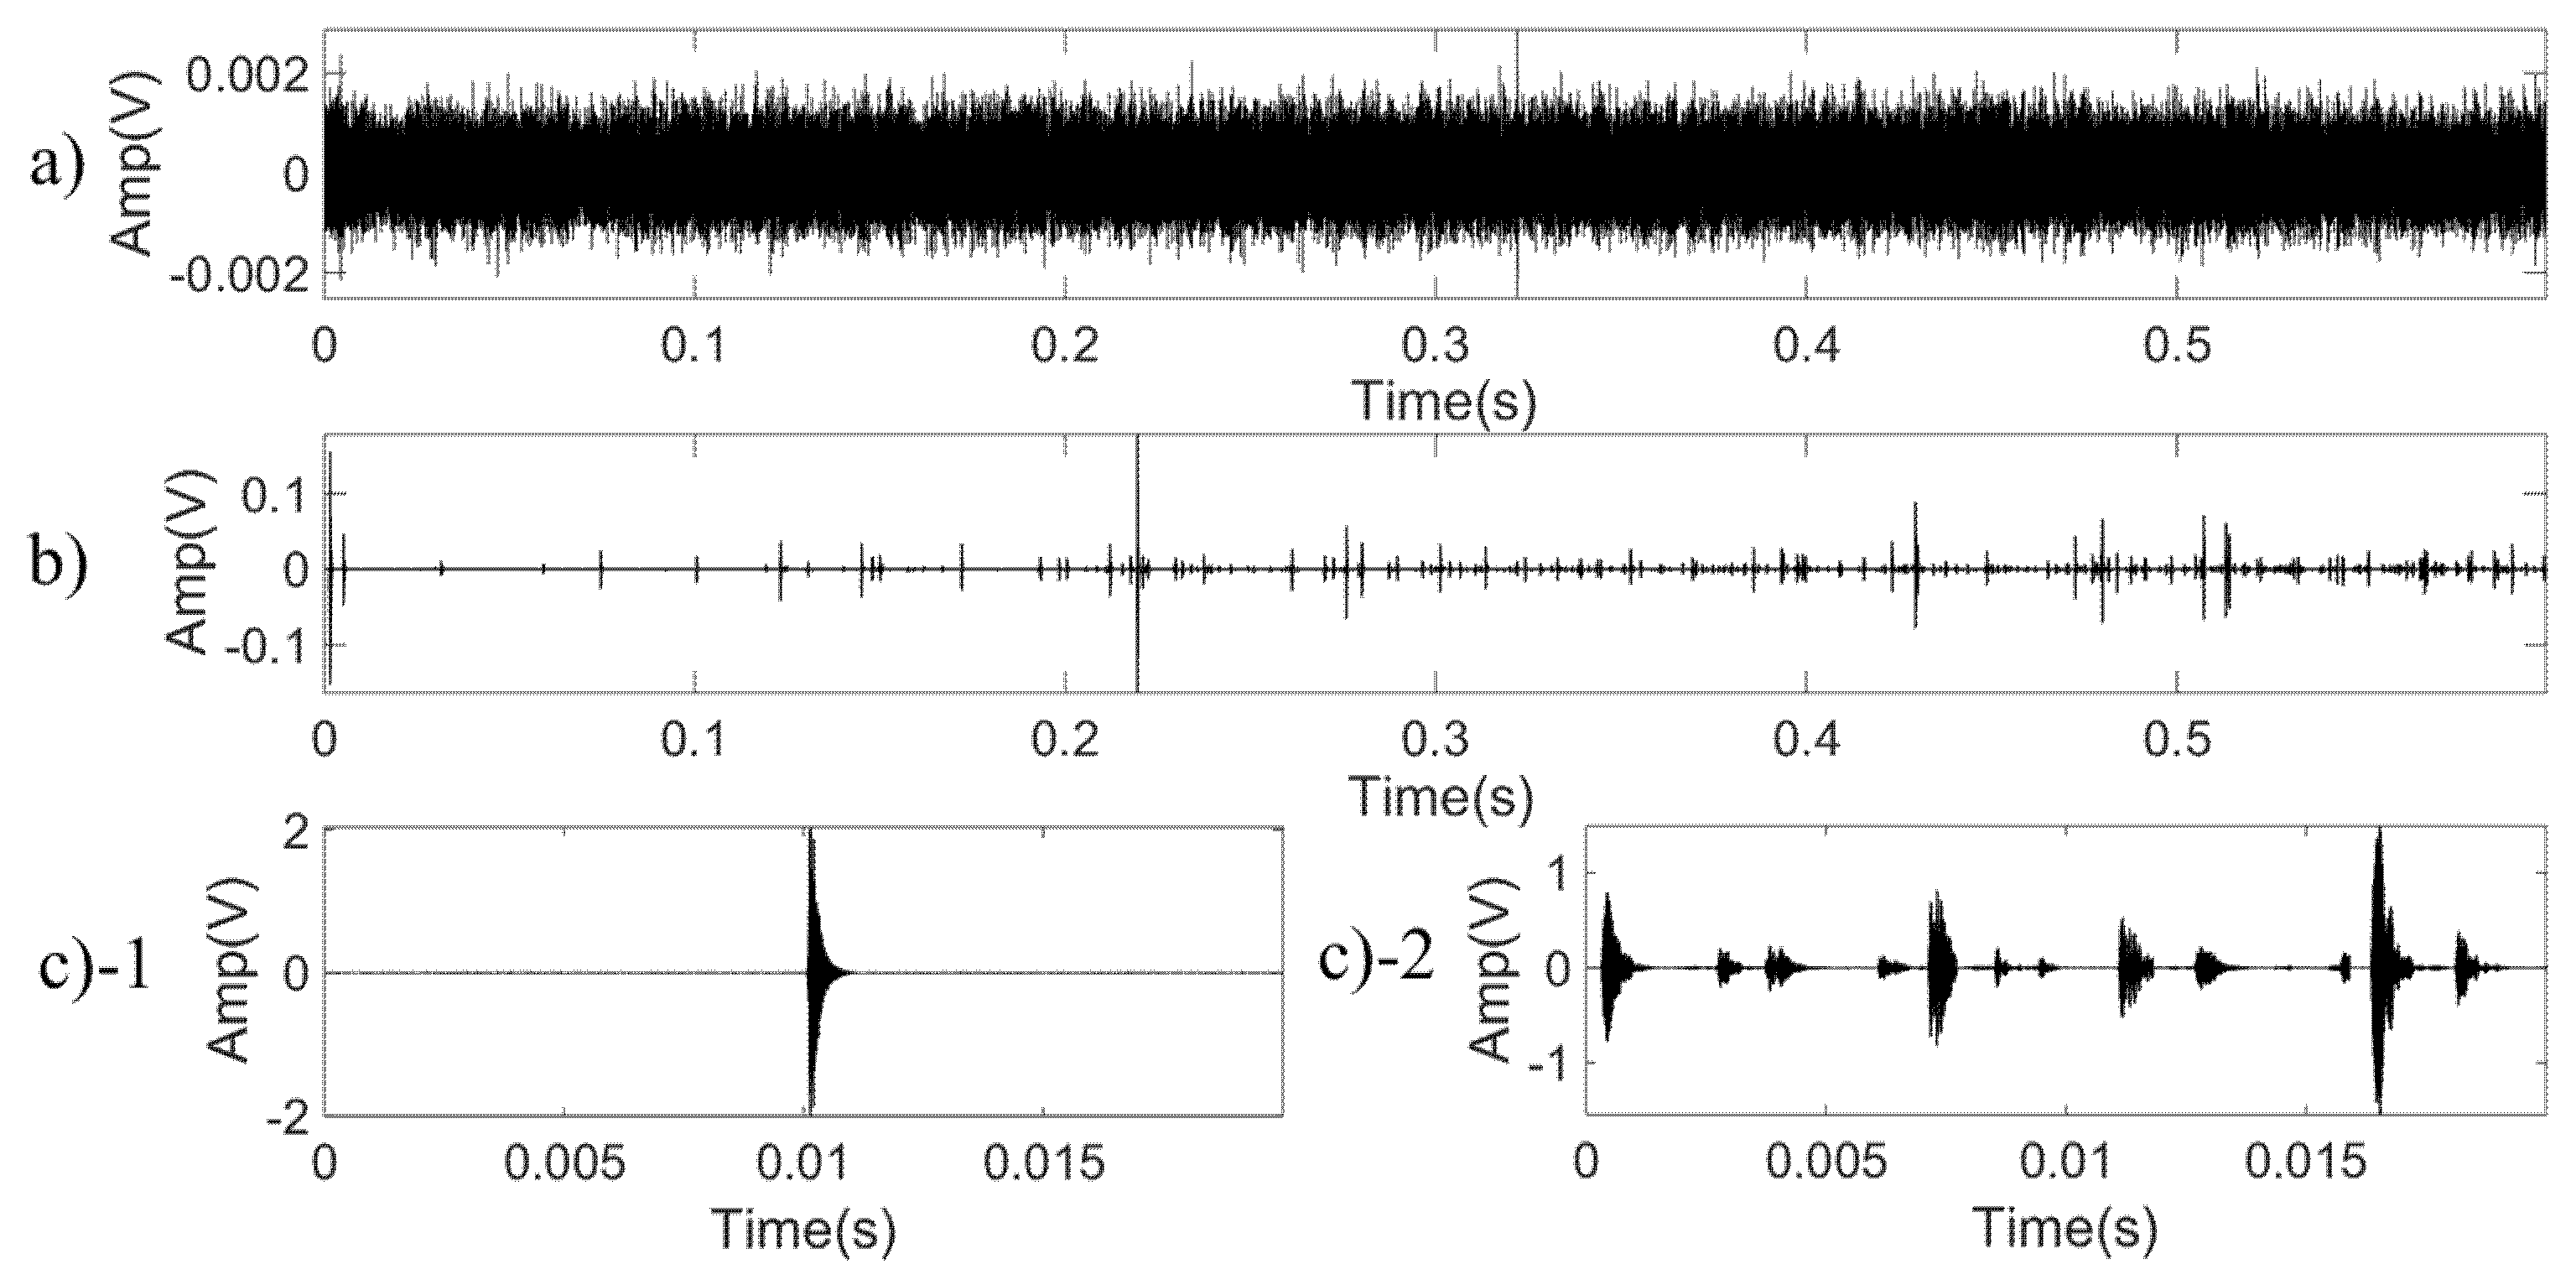
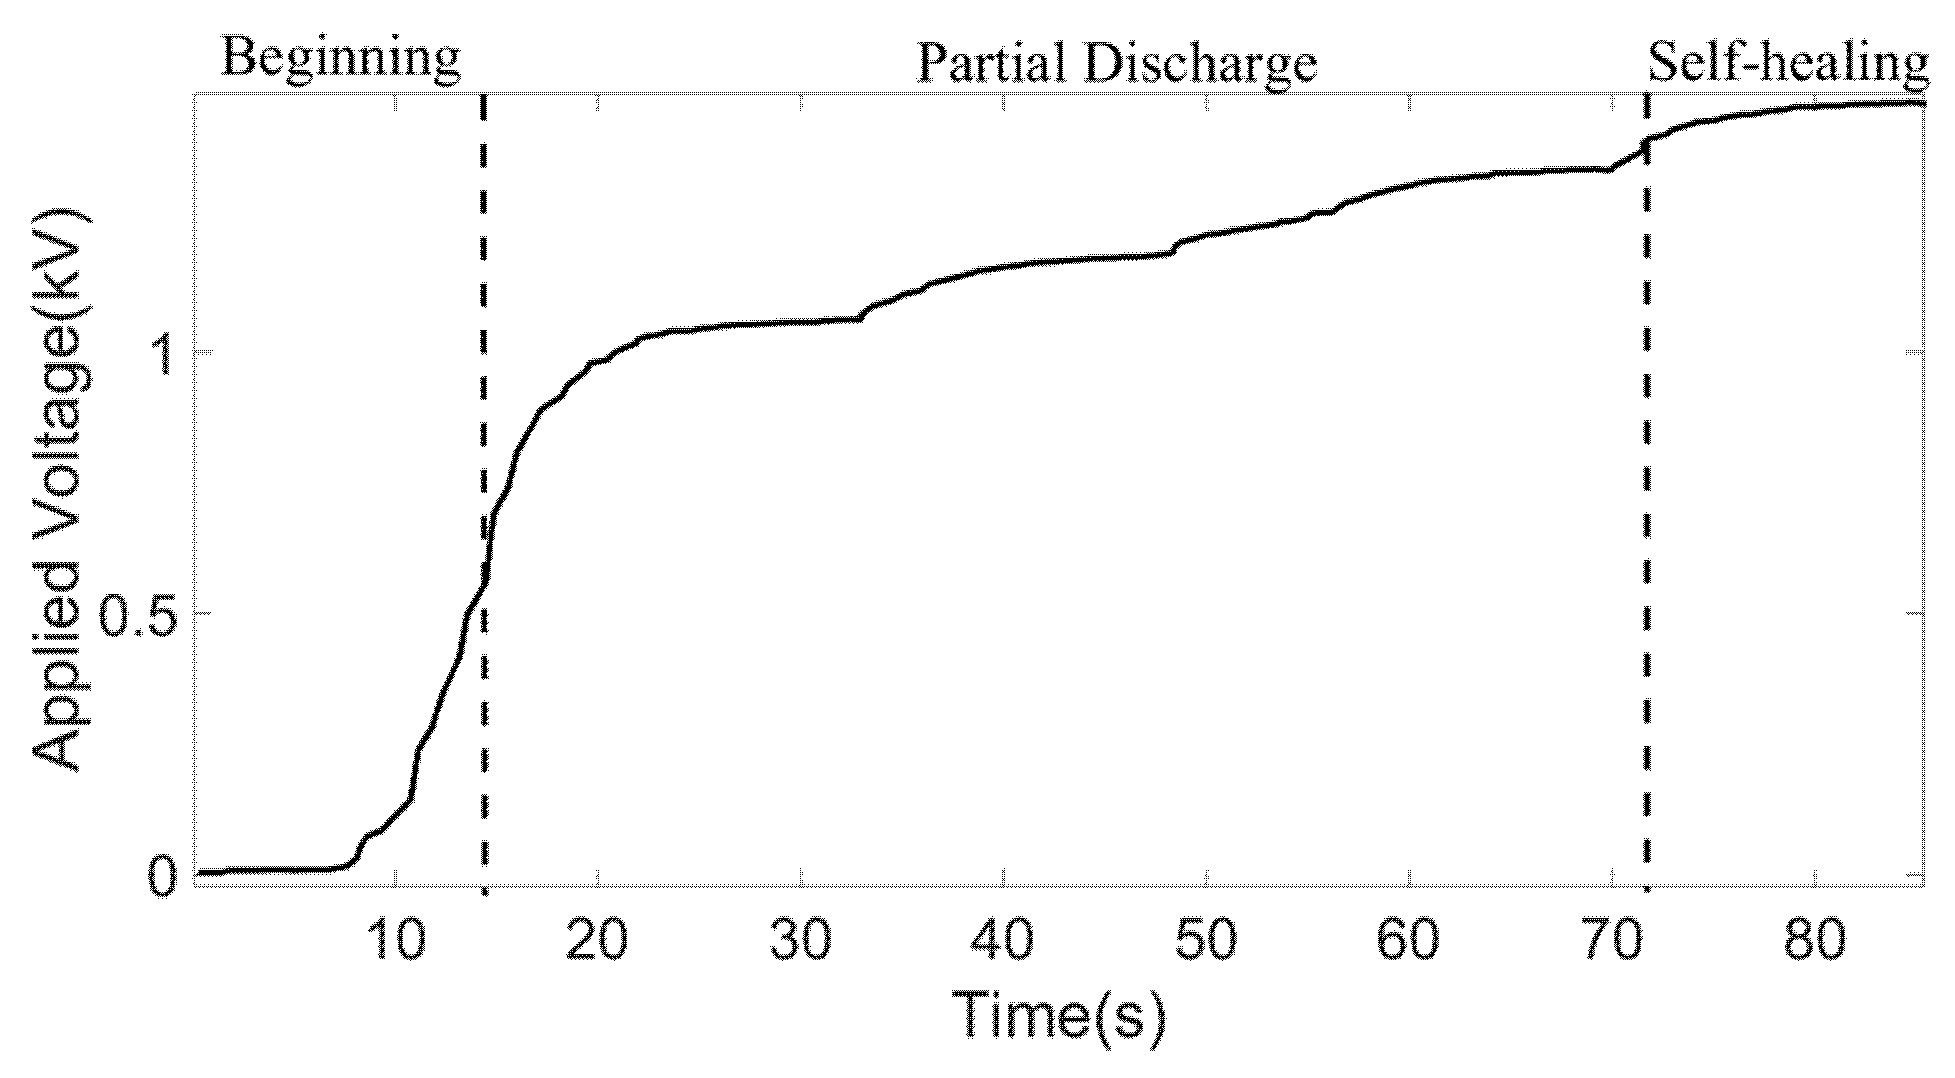
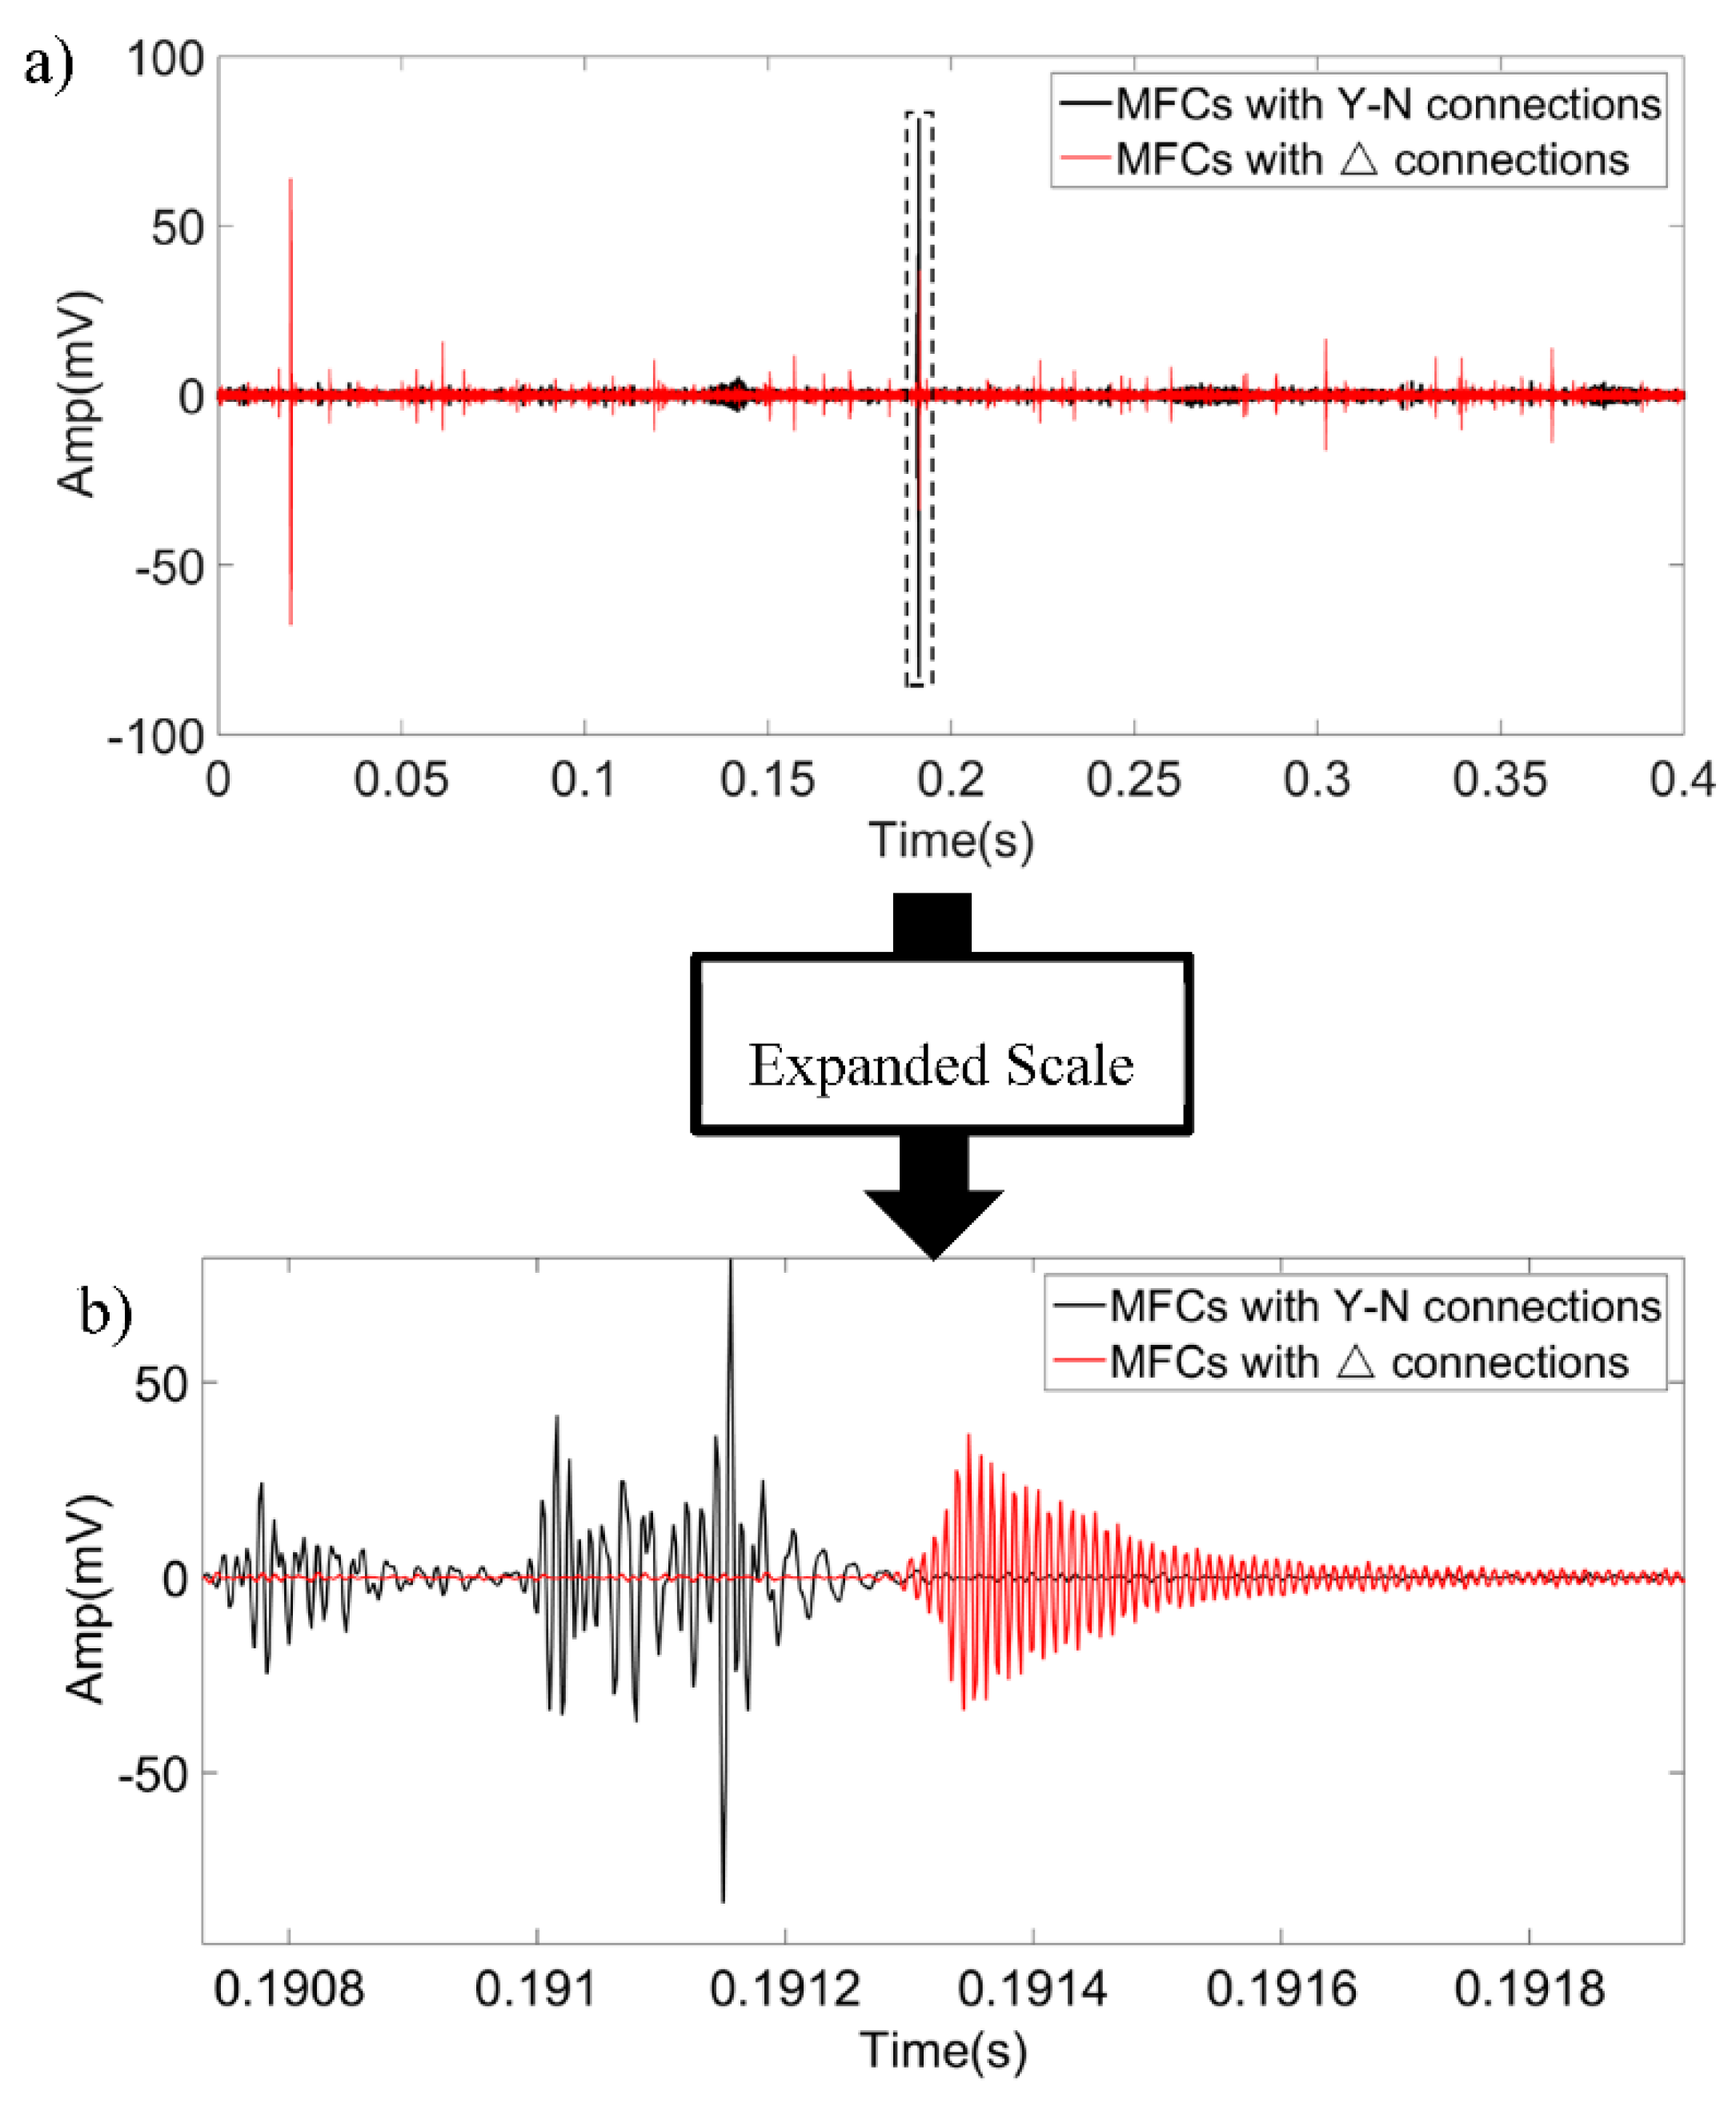
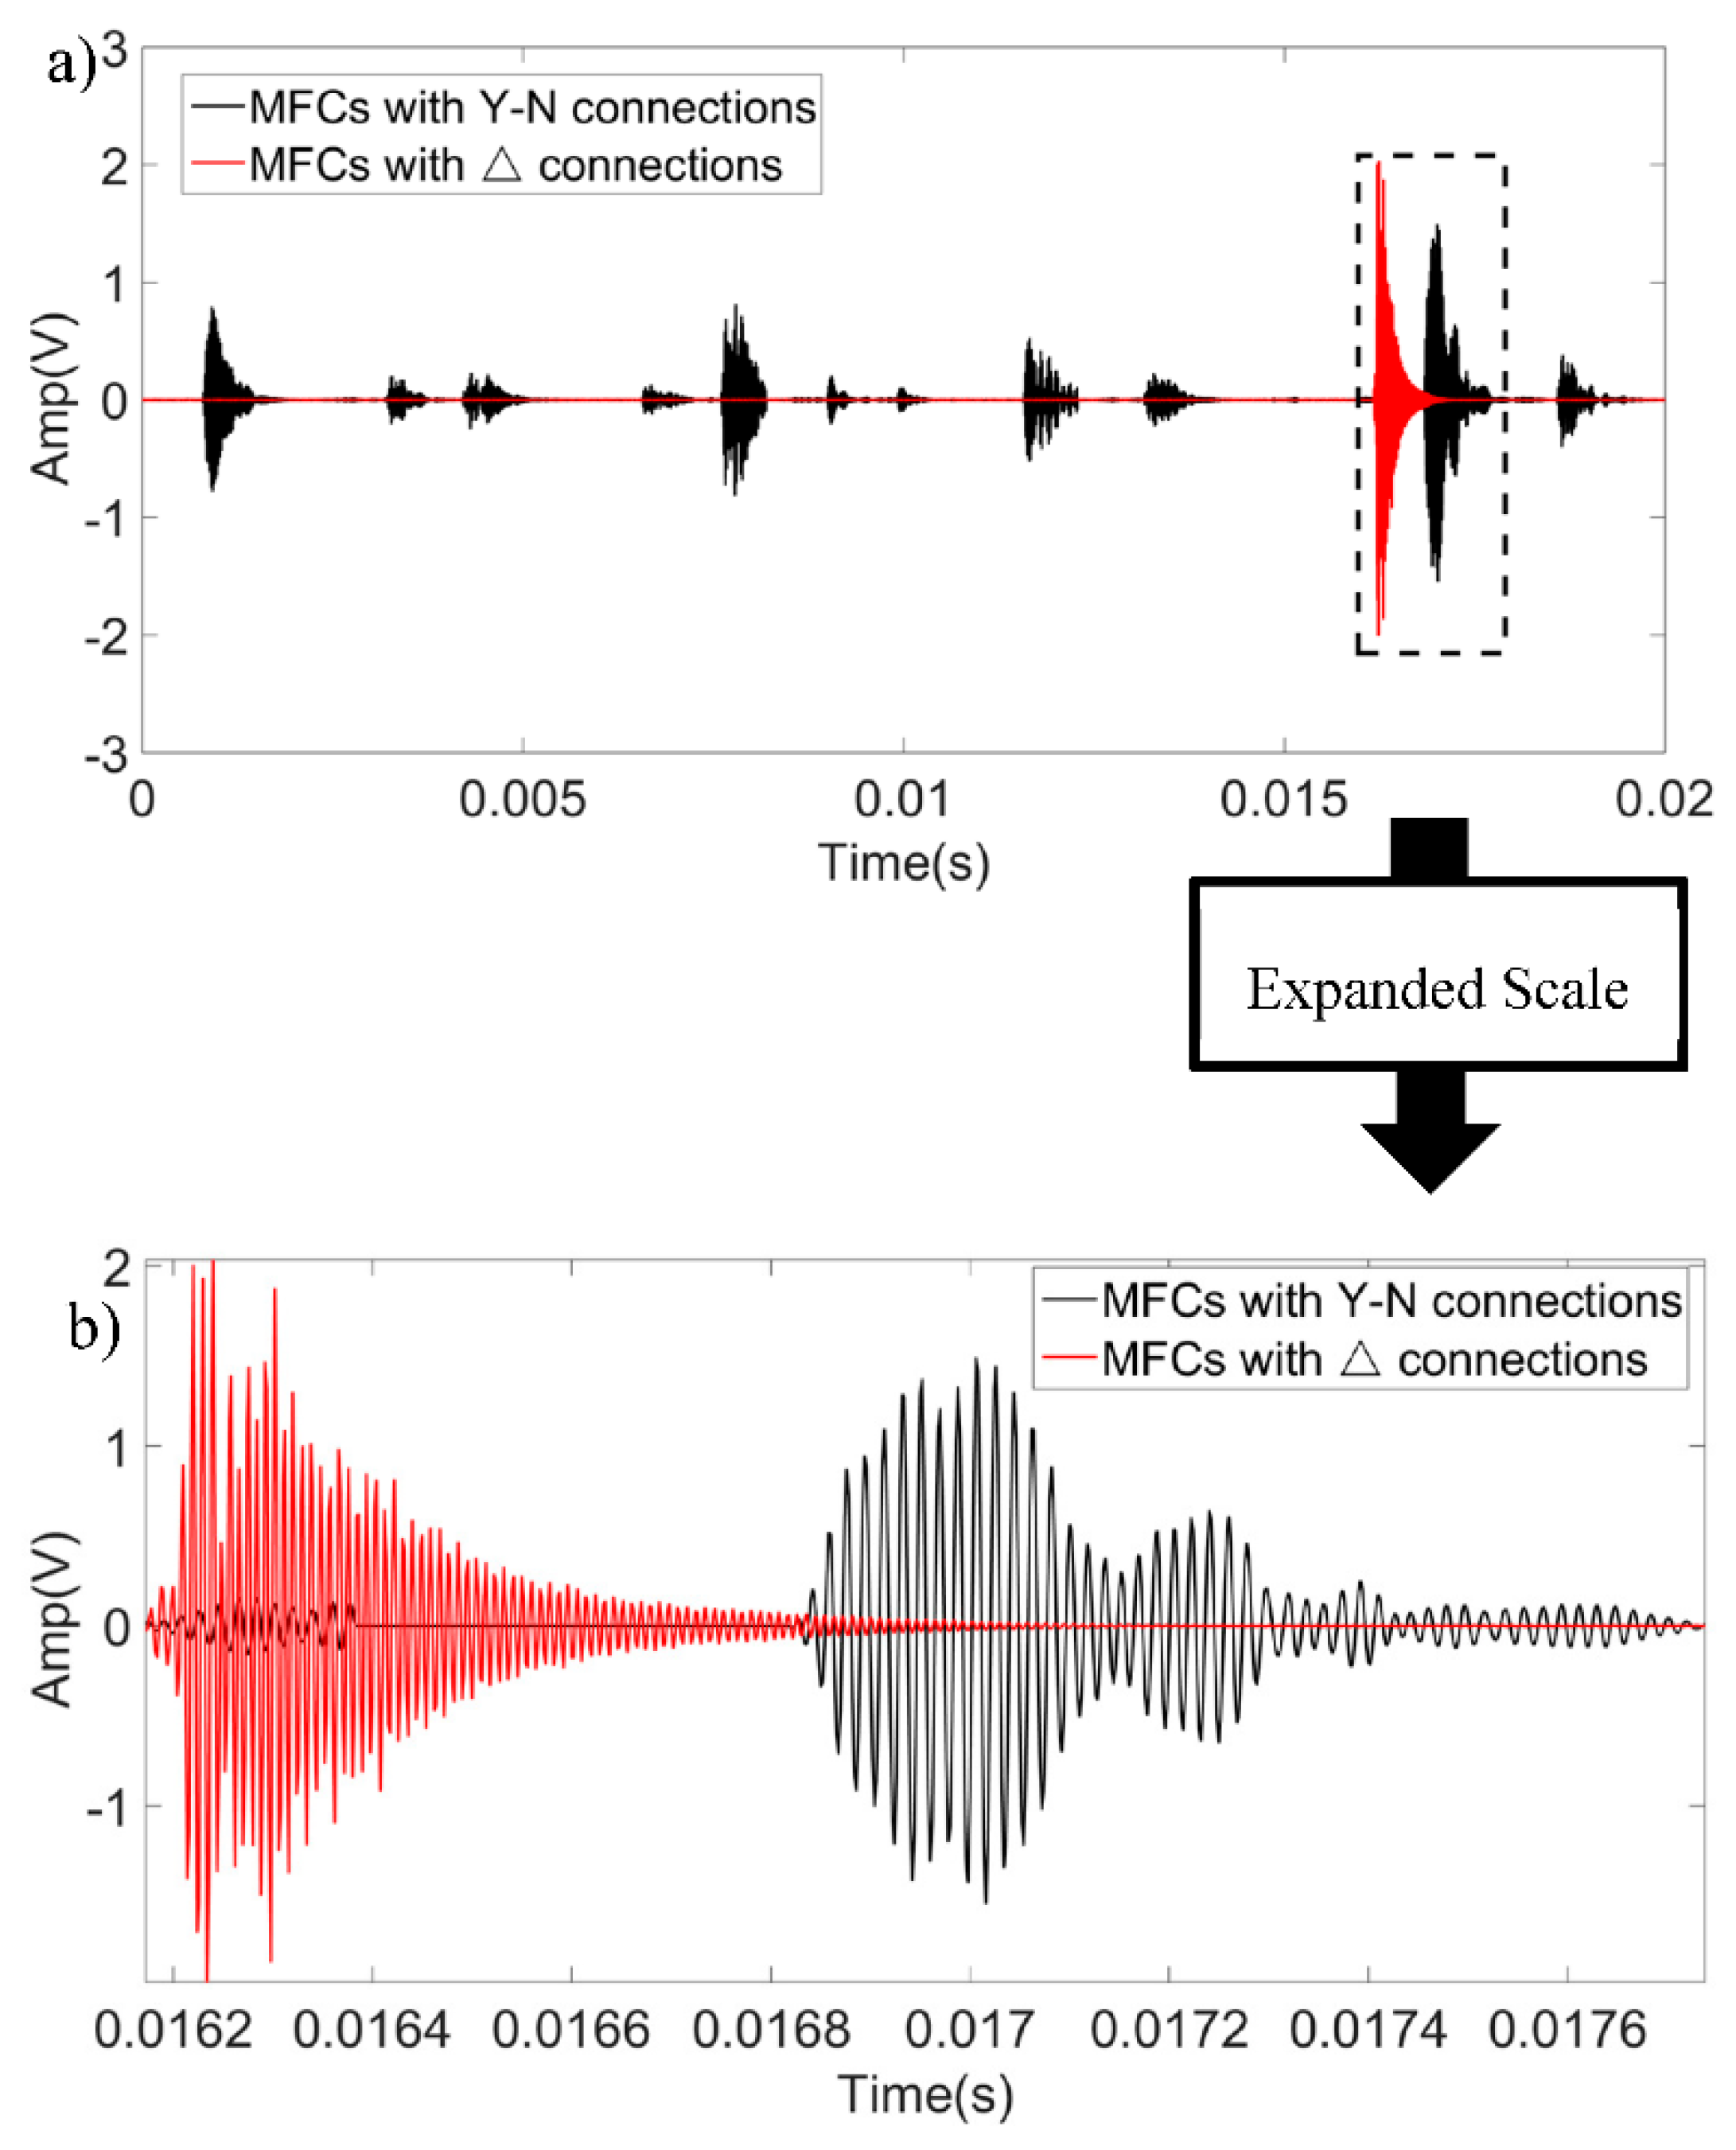
3.2.2. Time-Domain Features of Self-Healing Discharges

At the beginning stage, the signals were mostly white noise for different MFCs. Ignoring this noise, we mainly focused on the ultrasound signals.
• Time History of Received Ultrasound Waves
Due to design and manufactural differences among the tested MFCs, different time histories of ultrasound waves could be received when partial discharges occurred. Figure 11 compares these time histories of a Y-N-connection MFC and a Δ-connection MFC. A cluster of partial discharges occurred intensively in the Δ-connection MFCs when the applied voltage reached the critical voltage of partial discharge, as shown in Figure 11a. In contrast, partial discharge only occurred occasionally in the Y-N-connection MFC, which means fewer air gaps. According to the waveforms in the expanded scale shown in Figure 11b, the received ultrasonic partial discharges in the Y-N-connection MFCs contained several reflected waves, while first-arrival waves predominated in Δ-connection MFCs.
An opposite pattern was observed in the stage of self-healing. Figure 12 presents the ultrasound signals generated by self-healing discharges. Self-healing discharges occurred intensively in Y-N-connection MFCs, which means that more similar defects existed in the Y-N-connection MFC than in the Δ-connection unit. As shown in Figure 12b, the reflected waves were an important part of the ultrasonic self-healing signals in MFCs with Y-N-connections, while first-arrival waves were the main components in such signals for Δ-connection MFCs. Obviously, the shapes of the waveforms cannot be used to distinguish self-healing discharges from partial discharges.
• Amplitudes of Received Ultrasound Waves
As shown in Figure 8, the amplitude of white noise at the beginning was normally less than 2 mV, while the amplitudes of partial discharges were normally below 100 mV. The received ultrasound waves generated by self-healing discharges were several hundred millivolts and even beyond 1000 mV. This provides important information to distinguish the partial discharges from self-healing events. In this paper, the total energy of received ultrasonic self-healing signals was used to measure the amplitudes of received signals; the total ultrasonic signal energy value W U S can be calculated as follows:
W U S = t 1 t 2 U 2 ( t ) · C X d t 2
where t 1 and t 2 are the starting and end moments of self-healing, while U(t) is the received ultrasonic self-healing signal, and C X is the capacitance of the tested phase of the MFC. For Y-N-connection MFCs, C X can be described as C N /3 since all three phases of this kind of MFC are connected in parallel and voltage was applied to only one phase in one measurement event. However, for Δ connections, C X is equal to C N because voltage was applied to all three phases at the same time, as shown in Figure 2.
Figure 13 presents the energy of ultrasonic self-healing signals received in each element of Δ-connection and Y-N-connection MFCs. The values of reactive power of the tested MFCs were 10 kvar and 30 kvar. The value of W U S is different in each element in the same MFC, though it is related to the applied voltage. According to Figure 10, high voltage caused high W U S values in the different elements of the same MFC. Since the energy of the ultrasonic self-healing signal can represent the self-healing energy to some extent according to the Energy Conservation Law, and each element shares the same structure and material parameters except for the applied voltage, the relationship between them can be described as follows:
W U S W s h U a n
where W s h is the self-healing energy, U a is the applied voltage, and n is the exponent parameter that differs from literature data where n is no less than 2.2 and reaches 6 or even 7 [15].
For MFCs with different connections, the self-healing energy was unpredictable, while the self-healing energy of 30-kvar MFCs was much lower than that of 10-kvar MFCs. It is difficult to predict the self-healing energy, as the interfacial pressure, metallization thickness, applied voltage, and other contributing factors are interrelated in the self-healing process [12].

3.3. Ultrasonic Frequency-Domain Features in Self-Healing Detection

To extract the spectrum features of interest, a digital Butterworth filter was used to filter the noise out of the frequency band (40–80 k). Table 3 gives the main parameters of the filter. The frequency band in Table 3 is larger than the band suggested by IEC, since it can keep the filter signal undistorted. The power spectrum was calculated by the maximum entropy method (MEM). At the stage of partial discharge, the power spectra of MFCs with different connections are shown in Figure 14. The partial discharges had the same frequency band as the filter. The partial discharges of Δ-connection MFCs had a frequency peak at around 108 kHz. There was no other difference between the frequency-domain features of partial discharges for the different MFCs.
Figure 15 presents the power spectra of self-healing discharges in MFCs with different connections. The frequency bands remained the same as those for partial discharges. However, the peak frequencies of the ultrasonic self-healing signals varied remarkably: 54 kHz for the self-healing signal in Δ-connection MFCs, but 108 kHz for that in Y-N-connection MFCs.

4. Self-Healing Detection Software Package

To the authors’ knowledge, there is no commercial software specially developed for MFC self-healing testing. According to the general instruction of IEC [17], and based on the time-frequency features observed in this work, a self-healing detection software package was developed. The process of the main program of the detection software is shown in Figure 16. First, the parameters of the filter are set, and other parameters related to the counting are then input. After that, the input ultrasonic signal is filtered. The autocorrelation of the filtered signal is further used to remove noise, and the counting of self-healing events is then carried out. At the end, the number of self-healing events is outputted as an important reference to evaluate the self-healing property of MFCs, as required by the international standard [17].
It is worth emphasizing that the autocorrelation is calculated after filtering of the ultrasonic self-healing signal. The autocorrelation calculation method can be described as follows:
R x x ( t ) = x ( t ) x ( t ) = + x * ( τ ) x ( t + τ ) d τ
where x(t) is the input signal to be calculated and x * ( t ) is its conjugate signal. The autocorrelation of the typical ultrasonic self-healing signals in Figure 12b is shown in Figure 17. The autocorrelation results and their envelopes drawn with green and blue lines respectively are references for the identification of one event of self-healing discharge.

5. Conclusions

In this paper, an ultrasonic detection technique was employed to reveal the self-healing characteristics of two typical MFCs. It was observed that partial discharge always occurred before self-healing discharge with the same spectrum features ranging above 40 kHz. Although the operating voltage was applied phase by phase, partial discharge occurred intensively in the Δ-connection MFCs and more reflective waves were recorded. In contrast, the ultrasound generated by self-healing events in Y-connection units was more intense, which came from the first-arrival waves. To the best of the authors’ knowledge, the only parameter discerning self-healing events from partial discharges is their discharge energy, which is reflected in the amplitude of the ultrasound wave. Based on the general instructions of IEC, and the time–frequency features observed in this work, a practical detection system was developed and tested successfully.

Author Contributions

Conceptualization, Y.M. and Y.W.; methodology, Y.M.; formal analysis, Y.M. and H.Z.; resources, C.P. and H.Z.; visualization, M.J.; writing—original draft preparation, Y.M.; writing—review and editing, Y.W. and M.J.; supervision, Y.W. and H.S.; funding acquisition, H.S. All authors have read and agreed to the published version of the manuscript.

Funding

This research was funded by the National Natural Science Foundation of China, grant No. 61803332 and 51875510, the Fundamental Research Funds for the Central Universities, grant No.2019FZJD005, and the State Grid research project (5200-201922098A-0-0-00).

Acknowledgments

The authors would also like to thank Yongzhou Wang of Xiamen Faratronic Co., Ltd. for his expertise and knowledge in the production of MFCs.

Conflicts of Interest

The authors declare no conflict of interest.

References

  1. Tortai, J.-H.; Bonifaci, N.; Denat, A.; Trassy, C. Diagnostic of the self-healing of metallized polypropylene film by modeling of the broadening emission lines of aluminum emitted by plasma discharge. J. Appl. Phys. 2005, 97, 53304. [Google Scholar] [CrossRef]
  2. Zhao, S.; Chen, S.; Wang, H. Degradation modeling for reliability estimation of DC film capacitors subject to humidity acceleration. Microelectron. Reliab. 2019, 100, 113401. [Google Scholar] [CrossRef]
  3. Li, Z.; Li, H.; Lin, F.; Chen, Y.; Liu, D.; Wang, B.; Li, H.; Zhang, Q. Lifetime investigation and prediction of metallized polypropylene film capacitors. Microelectron. Reliab. 2013, 53, 1962–1967. [Google Scholar] [CrossRef]
  4. Makdessi, M.; Sari, A.; Venet, P. Metallized polymer film capacitors ageing law based on capacitance degradation. Microelectron. Reliab. 2014, 54, 1823–1827. [Google Scholar] [CrossRef]
  5. Sawa, G.; Arakawa, K.; Nagao, M.; Ieda, M. Conditions for complete self-healing breakdown in glow discharge polymerized styrene films. Thin Solid Films 1979, 59, 131–141. [Google Scholar] [CrossRef]
  6. Chen, Y.; Li, H.; Lin, F.; Lv, F.; Zhang, M.; Li, Z.; Liu, D. Study on Self-Healing and Lifetime Characteristics of Metallized-Film Capacitor Under High Electric Field. IEEE Trans. Plasma Sci. 2012, 40, 2014–2019. [Google Scholar] [CrossRef]
  7. Li, H.; Li, H.; Li, Z.; Lin, F.; Wang, W.; Wang, B.; Huang, X.; Guo, X. Temperature dependence of self-healing characteristics of metallized polypropylene film. Microelectron. Reliab. 2015, 55, 2721–2726. [Google Scholar] [CrossRef]
  8. Bel’Ko, V.O.; Bondarenko, P.N.; Emel’Yanov, O.A. The dynamic characteristics of self-healing processes in metal film capacitors. Russ. Electr. Eng. 2007, 78, 138–142. [Google Scholar] [CrossRef]
  9. Tortai, J.; Denat, A.; Bonifaci, N. Self-healing of capacitors with metallized film technology. J. Electrost. 2001, 53, 159–169. [Google Scholar] [CrossRef]
  10. Walgenwitz, B.; Tortai, J.-H.; Bonifaci, N.; Denat, A. Self-healing of metallized polymer films of different nature. In Proceedings of the 2004 IEEE International Conference on Solid Dielectrics, Toulouse, France, 5–9 July 2004; Volume 1. [Google Scholar]
  11. Li, H.; Li, H.; Li, Z.; Lin, F.; Liu, D.; Wang, W.; Wang, B.; Xu, Z. T pattern fuse construction in segment metallized film capacitors based on self-healing characteristics. Microelectron. Reliab. 2015, 55, 945–951. [Google Scholar] [CrossRef]
  12. Qin, S.; Ma, S.; Boggs, S.A. The mechanism of clearing in metalized film capacitors. In Proceedings of the 2012 IEEE International Symposium on Electrical Insulation, San Juan, PR, USA, 10–13 June 2012. [Google Scholar]
  13. Fuhrmann, H.; Carlen, M.; Chartouni, D.; Christen, T.; Ohler, C.; Votteler, T. Novel measurement methods for in-depth analysis of AC metallized film capacitors. In Proceedings of the Conference Record of the 2004 IEEE International Symposium on Electrical Insulation, Indianapolis, IN, USA, 19–22 September 2004. [Google Scholar]
  14. Chen, W.L.; Dong, Y.; Jia, H. Preliminary research on partial discharge and self-healing characteristics of metallized film capacitors. Power Capacit. React. Power Compens. 2008, 29, 31–36. (In Chinese) [Google Scholar]
  15. Belko, V.; Ivanov, I.; Plotnikov, A.; Belanov, V. Energy characteristics of self-healing process in metallized film capacitors. E3S Web Conf. 2019, 140, 02006. [Google Scholar] [CrossRef] [Green Version]
  16. Carlen, M.W.; Bruesch, P.; Gallay, R. Electrical endurance characterization of polypropylene winding capacitors for traction applications: A new experimental method. In Proceedings of the Seventh International Conference on Dielectric Materials, Measurements and Applications (Conf. Publ. No. 430), Bath, UK, 23–26 September 1996. [Google Scholar]
  17. IEC60831-2:2014. Shunt Power Capacitors of the Self-Healing Type for A.C. Systems Having a Rated Voltage up to and Including 1 000 V—Part 2: Ageing Test, Self-Healing Test and Destruction Test; AENOR: Madrid, Spain, 2014; Available online: https://www.doc88.com/p-5087810153910.html (accessed on 9 November 2020).
  18. Valentine, N.; Azarian, M.H.; Pecht, M. Metallized film capacitors used for EMI filtering: A reliability review. Microelectron. Reliab. 2019, 92, 123–135. [Google Scholar] [CrossRef]
  19. Gupta, A.; Yadav, O.P.; Devoto, D.; Major, J. A review of degradation behavior and modeling of capacitors. In Proceedings of the International Electronic Packaging Technical Conference and Exhibition, San Francisco, CA, USA, 27–30 August 2018; Volume 51920. [Google Scholar]
  20. Xin, D.; Fuchang, L.; Jin, L.; Zonggan, Y.; Nanyan, W. Influence factors for the self-healing of metallized polypropylene capacitors. In Proceedings of the 2000 Annual Report Conference on Electrical Insulation and Dielectric Phenomena (Cat. No. 00CH37132), Victoria, BC, Canada, 15–18 October 2000; Volume 2. [Google Scholar]
  21. Fa, L.; Tang, J.; Zhang, Q.; Zhang, M.; Zhang, Y.; Liang, M.; Zhao, M. Reflection and refraction of elastic wave at VTI-TTI media interface. Front. Phys. 2019, 15, 22601. [Google Scholar] [CrossRef]
  22. Sha, G.; Huang, M.; Lowe, M.J.S.; Rokhlin, S.I. Attenuation and velocity of elastic waves in polycrystals with generally anisotropic grains: Analytic and numerical modeling. J. Acoust. Soc. Am. 2020, 147, 2442–2465. [Google Scholar] [CrossRef] [PubMed]
  23. Fiorillo, A.S.; Pullano, S.A.; Critello, C.D. Spiral-Shaped Biologically-Inspired Ultrasonic Sensor. IEEE Trans. Ultrason. Ferroelectr. Freq. Control. 2019, 67, 635–642. [Google Scholar] [CrossRef] [PubMed]
  24. Fiorillo, A.S.; Pullano, S.A.; Bianco, M.G.; Critello, D.C. Ultrasonic Transducers Shaped in Archimedean and Fibonacci Spiral: A Comparison. Sensors 2020, 20, 2800. [Google Scholar] [CrossRef] [PubMed]
Figure 1. Structure of a typical metallized film capacitor (MFC).
Electronics 09 01893 g001
Figure 2. Connections of MFCs.
Electronics 09 01893 g002
Figure 3. Structure of a capacitor element of an MFC ((a) expanded view; (b) sectional view; (c) front view of the MFC). 1—metallic coating, 2—polymer film, 3—insulated mandrel, 4—metal spraying layer.
Electronics 09 01893 g003
Figure 4. Propagation paths of ultrasound waves in an MFC.
Electronics 09 01893 g004
Figure 5. Ultrasonic signal inside a sealed container.
Electronics 09 01893 g005
Figure 6. Propagation path of ultrasonic waves.
Electronics 09 01893 g006
Figure 7. Experimental system setup.
Electronics 09 01893 g007
Figure 8. Typical signals in different stages of self-healing detection: (a) beginning, (b) partial discharge, and (c) self-healing. (1—MFCs with Δ connections; 2—MFCs with Y-N connections.).
Electronics 09 01893 g008
Figure 9. Typical process of applying voltage.
Electronics 09 01893 g009
Figure 10. Critical voltages of Δ-connection and Y-N-connection MFCs with different values of reactive power.
Electronics 09 01893 g010
Figure 11. Waveforms of partial discharges in MFCs with different connections: (a) total shape, (b) shape of a single discharge.
Electronics 09 01893 g011
Figure 12. Waveforms of self-healing discharges in MFCs with different connections: (a) total shape, (b) shape of a single discharge.
Electronics 09 01893 g012
Figure 13. Received signal energy values of Δ-connection and Y-N-connection MFCs with different values of reactive power.
Electronics 09 01893 g013
Figure 14. Power spectra of partial discharges in MFCs with different connections.
Electronics 09 01893 g014
Figure 15. Power spectra of self-healing discharges in MFCs with different connections.
Electronics 09 01893 g015
Figure 16. Process diagram of the main program in the detection software.
Electronics 09 01893 g016
Figure 17. Autocorrelation results of typical self-healing signals.
Electronics 09 01893 g017
Table 1. Material properties of MFCs.
Part NameMaterialDensity [kg/m3]Sound Velocity [m/s]
StuffingMicrocrystalline Paraffin9102210
Polymer FilmsPolypropylene9002475
Metallic CoatingAluminum/Zinc2700/71406305/4216
Spray LayerZinc71404216
Table 2. Electric parameters of the tested MFCs.
Connection TypeNominal Reactive Power Q N   [ kvar ] Nominal Capacitance C N   [ μ F ] Nominal Voltage U N   [ kV ] Nominal Current I N   [ A ]
Δ10157.30.4512.8
30471.60.4538.4
Y-N10509.60.2513.3
301528.70.2540.0
Table 3. Parameters of the digital Butterworth filter.
ParametersValueUnit
TypeBand pass
Sampling Frequency500kHz
High cut-off Frequency120kHz
Low cut-off Frequency20kHz
Publisher’s Note: MDPI stays neutral with regard to jurisdictional claims in published maps and institutional affiliations.

