Article

Lipofuscin-Type Pigment as a Marker of Colorectal Cancer

1
Department of Pathology and Cancer Biology, and Epigenetics Group-Research Center, Portuguese Oncology Institute of Porto, 4200-072 Porto, Portugal
2
Department of Pathology and Molecular Immunology, Institute of Biomedical Sciences Abel Salazar-University of Porto (ICBAS-UP), 4050-313 Porto, Portugal
3
Research-Educational Institute of Optics and Biophotonics, Saratov State University, Saratov 410012, Russia
4
Interdisciplinary Laboratory of Biophotonics, National Research Tomsk State University, Tomsk 634050, Russia
5
Laboratory of Laser Diagnostics of Technical and Living Systems, Institute of Precision Mechanics and Control of the Russian Academy of Sciences, Saratov 410028, Russia
6
Physics Department-Polytechnic Institute of Porto, School of Engineering, 4249-015 Porto, Portugal
7
Centre of Innovation in Engineering and Industrial Technology (CIETI), School of Engineering, Polytechnic of Porto, 4249-015 Porto, Portugal
*
Author to whom correspondence should be addressed.
Electronics 2020, 9(11), 1805; https://doi.org/10.3390/electronics9111805
Submission received: 12 October 2020 / Revised: 27 October 2020 / Accepted: 28 October 2020 / Published: 31 October 2020
(This article belongs to the Special Issue Advanced Laser Technologies for Biophotonics)

Abstract

:
The study of the optical properties of biological tissues for a wide spectral range is necessary for the development and planning of noninvasive optical methods to be used in clinical practice. In this study, we propose a new method to calculate almost all optical properties of tissues as a function of wavelength directly from spectral measurements. Using this method, and with the exception of the reduced scattering coefficient, which was obtained by traditional simulation methods, all the other optical properties were calculated in a simple and fast manner for human and pathological colorectal tissues. The obtained results are in good agreement with previous published data, both in magnitude and in wavelength dependence. Since this method is based on spectral measurements and not on discrete-wavelength experimental data, the calculated optical properties contain spectral signatures that correspond to major tissue chromophores such as DNA and hemoglobin. Analysis of the absorption bands of hemoglobin in the wavelength dependence of the absorption spectra of normal and pathological colorectal mucosa allowed to identify differentiated accumulation of a pigment in these tissues. The increased content of this pigment in the pathological mucosa may be used for the future development of noninvasive diagnostic methods for colorectal cancer detection.

1. Introduction

Human colorectal cancer is a major concern worldwide, with high numbers of incidence per year, most of them resulting in fatality [1]. With the objective of developing new noninvasive optical methods to replace the ionizing radiation methods currently used to detect and treat diseases such as cancer, the research in the field of biophotonics has strongly increased in the last three decades [2]. To develop such alternative optical methods, knowledge on the optical properties of normal and pathological tissues is necessary for a wide wavelength range. Current optical diagnostic and therapeutic methods work at wavelengths within the traditional tissue windows: I (625–975 nm), II (1100–1350 nm), III (1600–1870 nm), and IV (2100–2300 nm) [3,4]. Complementary to these wavelength ranges, where light penetration depth presents local maxima for natural tissues [2,5], the use of optical clearing treatments can induce other optical diagnostic and treatment windows, as it was recently demonstrated for the ultraviolet (UV) range with transmittance efficiency peaks at (230 ± 30), (275 ± 25 nm), and (300 ± 40 nm) [6,7].
Considering the current optical methods that work at visible and near infrared (NIR) wavelengths, the above-indicated recent discovery of UV-windows to diagnose and treat pathologies and the emerging techniques at THz frequencies [8], it becomes urgent to map the optical properties of normal and pathological tissues for a wide spectral range. A set of optical properties can be considered as the identity card of any biological material, meaning that their evaluation can be used to discriminate between normal and pathological tissues. Their knowledge is also necessary to create individual light propagation models, which are necessary for the development of noninvasive optical diagnostic and treatment procedures [9,10,11]. Various studies were made to evaluate the wavelength dependencies for the various optical properties of different biological tissues [5,9,12,13,14,15,16,17,18,19]. Between the several optical properties that can be used to characterize a particular biological material, some of them, such as the absorption coefficient (µa), the scattering coefficient (µs), the scattering anisotropy factor (g), and the refractive index (RI) are fundamental, but others that derive from these are also commonly used [2,19]. One of those derived properties is the reduced scattering coefficient (µ′s), which can be calculated from µs and g [2,5,10]:
μ s = μ s ( 1 g ) .
Another very useful optical property is the light penetration depth, δ, which quantifies how deep light can penetrate in a tissue. Considering the diffusion approximation, its calculation is made using µa and µ′s [2,13]:
δ = 1 3 μ a ( μ a + μ s ) .
In general, for the UV range, both µs and µ′s have high values, leading to low values for δ, but with the application of optical clearing treatments, such values can increase at some particular UV wavelengths, as indicated above. In opposition, for longer wavelengths, in the visible and near-infrared (NIR) range, scattering is low and δ reaches higher values [19,20]. Steven Jacques in his widely cited review paper (more than 2500 citations in Google Scholar) has summarized the wavelength dependencies of the optical properties of different biological tissues [20]. According to this paper, the absorption coefficient shows a decreasing behavior with increasing wavelength, since major chromophores, such as proteins, DNA and hemoglobin present their absorption bands in the UV and visible range [6,20]. In addition, due to the presence of water or lipids, some other absorption bands might occur in the NIR range. The wavelength dependence for µa, in a tissue, is the sum of the absorption contributions from all tissue components [20].
Considering the UV-NIR range, the scattering coefficients also show a decreasing behavior with increasing wavelength and such dependence is a combination of Rayleigh and Mie scattering regimes [15,20]:
μ s o r μ s = a ( f R a y ( λ 500 ( nm ) ) 4 + ( 1 f R a y ) ( λ 500 ( nm ) ) b M i e ) ,
where a′ is a scaling factor that represents µs or µ′s at 500 nm, fRay is the Rayleigh scattering fraction, and bMie characterizes the mean size of Mie scatterers. Such equation has been successfully applied to fit the wavelength dependence for data of many biological soft tissues [20,21,22].
Equation (3) describes a smooth wavelength dependence for both scattering coefficients in the spectral range from UV to NIR. As a result, and considering Equation (1), g will have a smooth increasing behavior with increasing wavelength, which can be described by Equation (4) [5] or by Equation (5) [17]:
g ( λ ) = a + b [ 1 exp ( λ c d ) ] ,
g ( λ ) = a exp ( b λ ) + c exp ( d λ ) .
The estimation of the parameters a′, fRay and bMie in Equation (3) and a, b, c, and d in Equations (4) or (5) is made when fitting the discrete µs, µ′s and g data, which are usually estimated along with µa data, using inverse simulation codes based on the Adding-Doubling [23] or Monte Carlo [24] methods. To perform such inverse simulations, experimental data from the tissue, such as total transmittance (Tt), collimated transmittance (Tc) and total reflectance (Rt) are necessary. The RI data is also necessary to perform these simulations and it can be measured experimentally at discrete wavelengths through various methods [2]. Once the discrete RI values are obtained from measurements, the corresponding wavelength dependency (called dispersion) for a specific spectral range can be obtained by fitting the experimental values with an empirical relation, such as the Cauchy (Equation (6)), the Conrady (Equation (7)) [25,26,27], or the Cornu (Equation (8)) equations [2,18,19,28,29]:
n ( λ ) = A + B λ 2 + C λ 4 ,
n ( λ ) = A + B λ + C λ 3.5 ,
n ( λ ) = A + B ( λ C ) .
In opposition to the estimation of all optical properties through traditional simulation methods [23,24], we have developed a new simplified calculation procedure to obtain the wavelength dependencies for the optical properties of a biological material directly from the spectral measurements. This method is simple, and it only needs the adding-doubling simulations to obtain µ′s. All the other optical properties are directly calculated from the measured spectra. We have used such method to calculate the wavelength dependencies for all optical properties of human colorectal normal and pathological mucosa between the deep-UV and NIR (200–1000 nm). The calculation method is so sensitive that it allowed us to identify the presence of a pigment that accumulates in different proportions in normal and pathological tissues.
Section 2 explains the experimental and calculation methodology and Section 3 presents the obtained results and corresponding discussion.

2. Materials and Methods

2.1. Tissue Samples

Following the guidelines of the Ethics Committee of the Portuguese Oncology Institute of Porto, Portugal, colorectal surgical specimens from patients undergoing treatment at that Institution were used to collect the tissue samples for this study. The patients have signed a written consent, allowing the use of surgical resections for diagnostic and research purposes.
Considering the inner layer of the colorectal wall-the mucosa, the normal and pathological areas (see Figure 1) were separated.
A total of 10 samples from the normal and 10 from the pathological areas were prepared to be used in the present study. All the samples were prepared using a cryostat (LeicaTM, model CM 1850 UV) with an approximated circular form, with diameter of about 1 cm and uniform thickness of 0.5 mm. All these samples were submitted to various spectral measurements, as described in the following sub-section.

2.2. Spectral Measurements

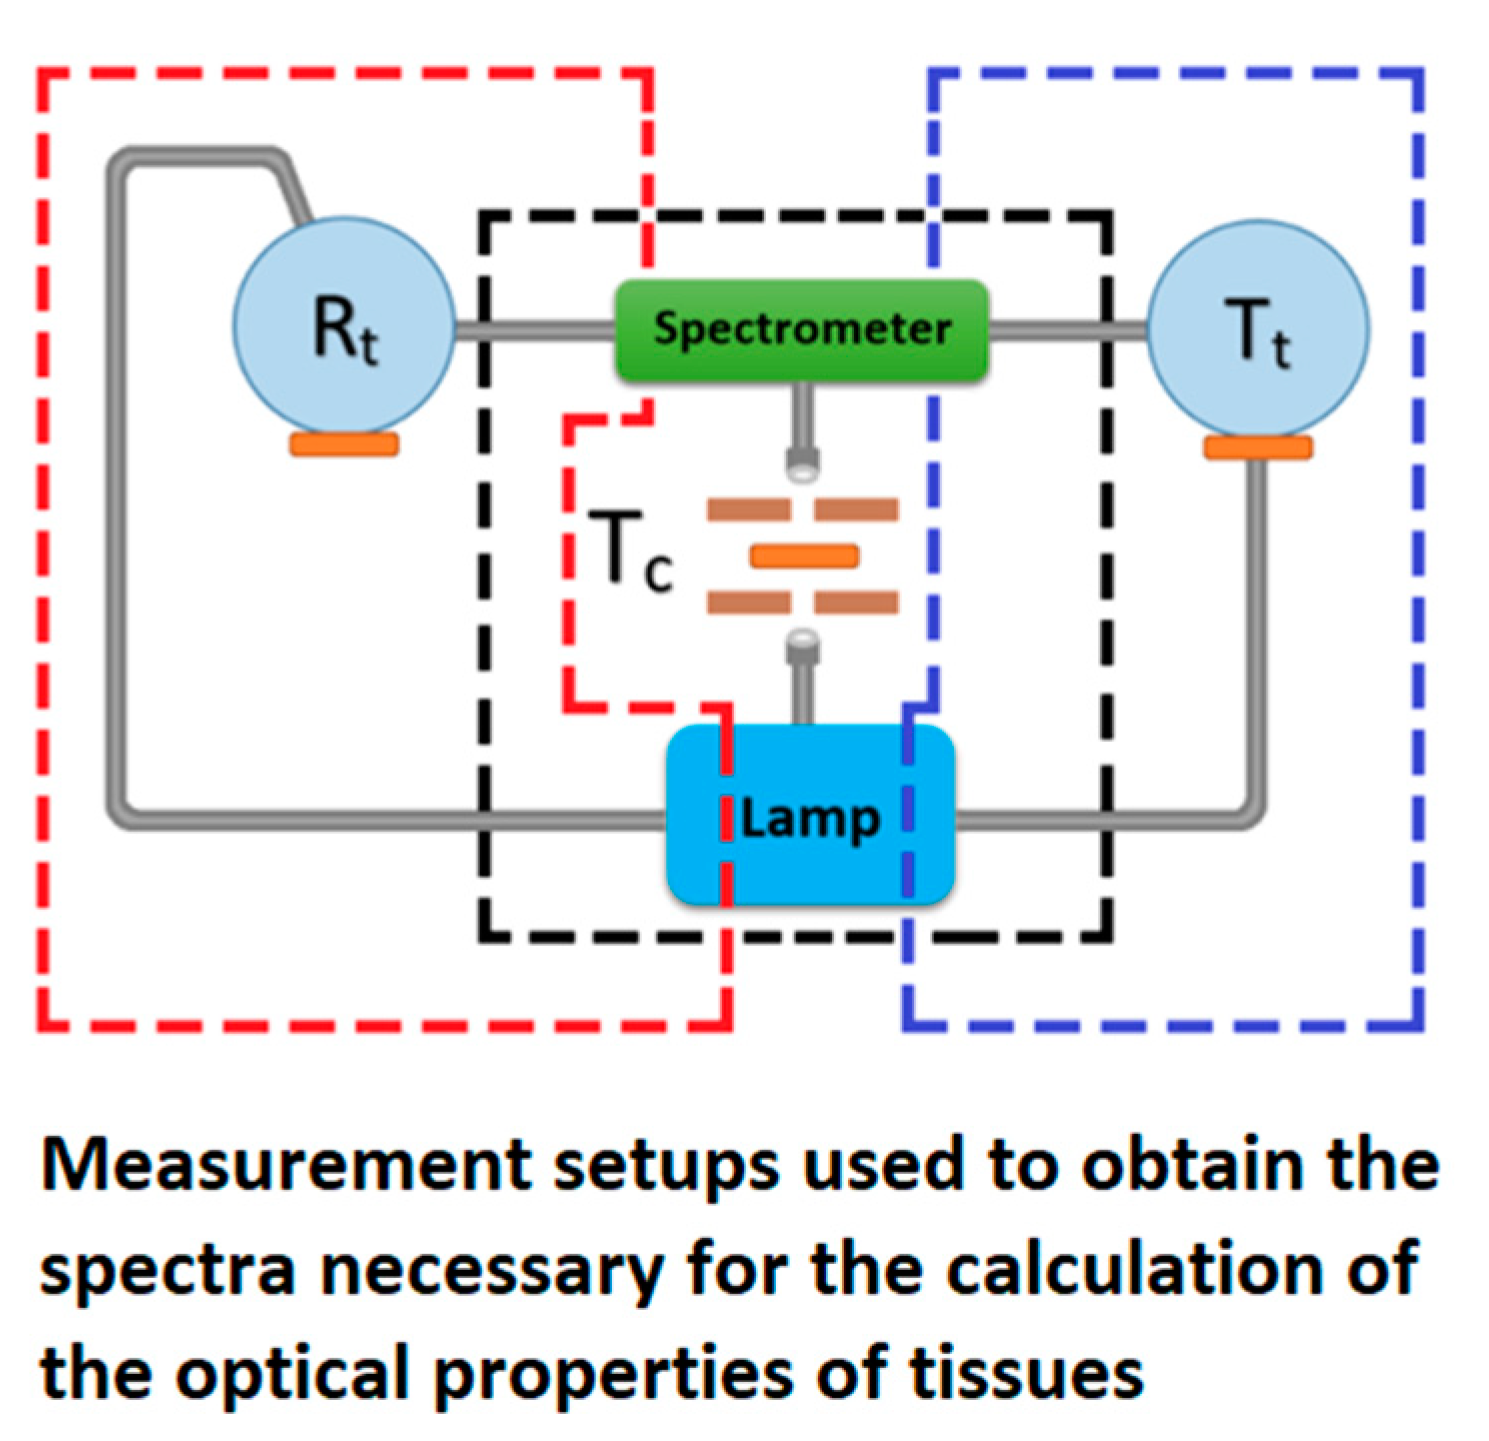
The spectral measurements necessary to calculate the optical properties are Tt, Rt, and Tc. Figure 2 presents a mixed scheme of the measurement setups to obtain these spectra.
Considering Figure 2, the setup to measure Rt is presented inside the left-dashed red line, the setup to measure Tc is presented inside the center-dashed black line and the setup to measure Tt is presented inside the right-dashed blue line. For the measurements of Rt and Tt, a pulsed high-power and broad-band xenon lamp was used, while to measure Tc, a deuterium-halogen lamp was used. In all setups, light was delivered and collected with optical fiber cables and collimated lenses. All this equipment was acquired from AvantesTM (Apeldoorn, The Netherlands). While in the Rt and Tt measurements a 6 mm beam is used to acquire the spectra through an integrating sphere, in the Tc measurements, a collimated beam of 1 mm is established by a set of pinholes below and above the sample.
All the 20 samples (10 normal and 10 pathological) were used to perform each of the three measurements, so that average results for the optical properties could be calculated.

2.3. Calculations

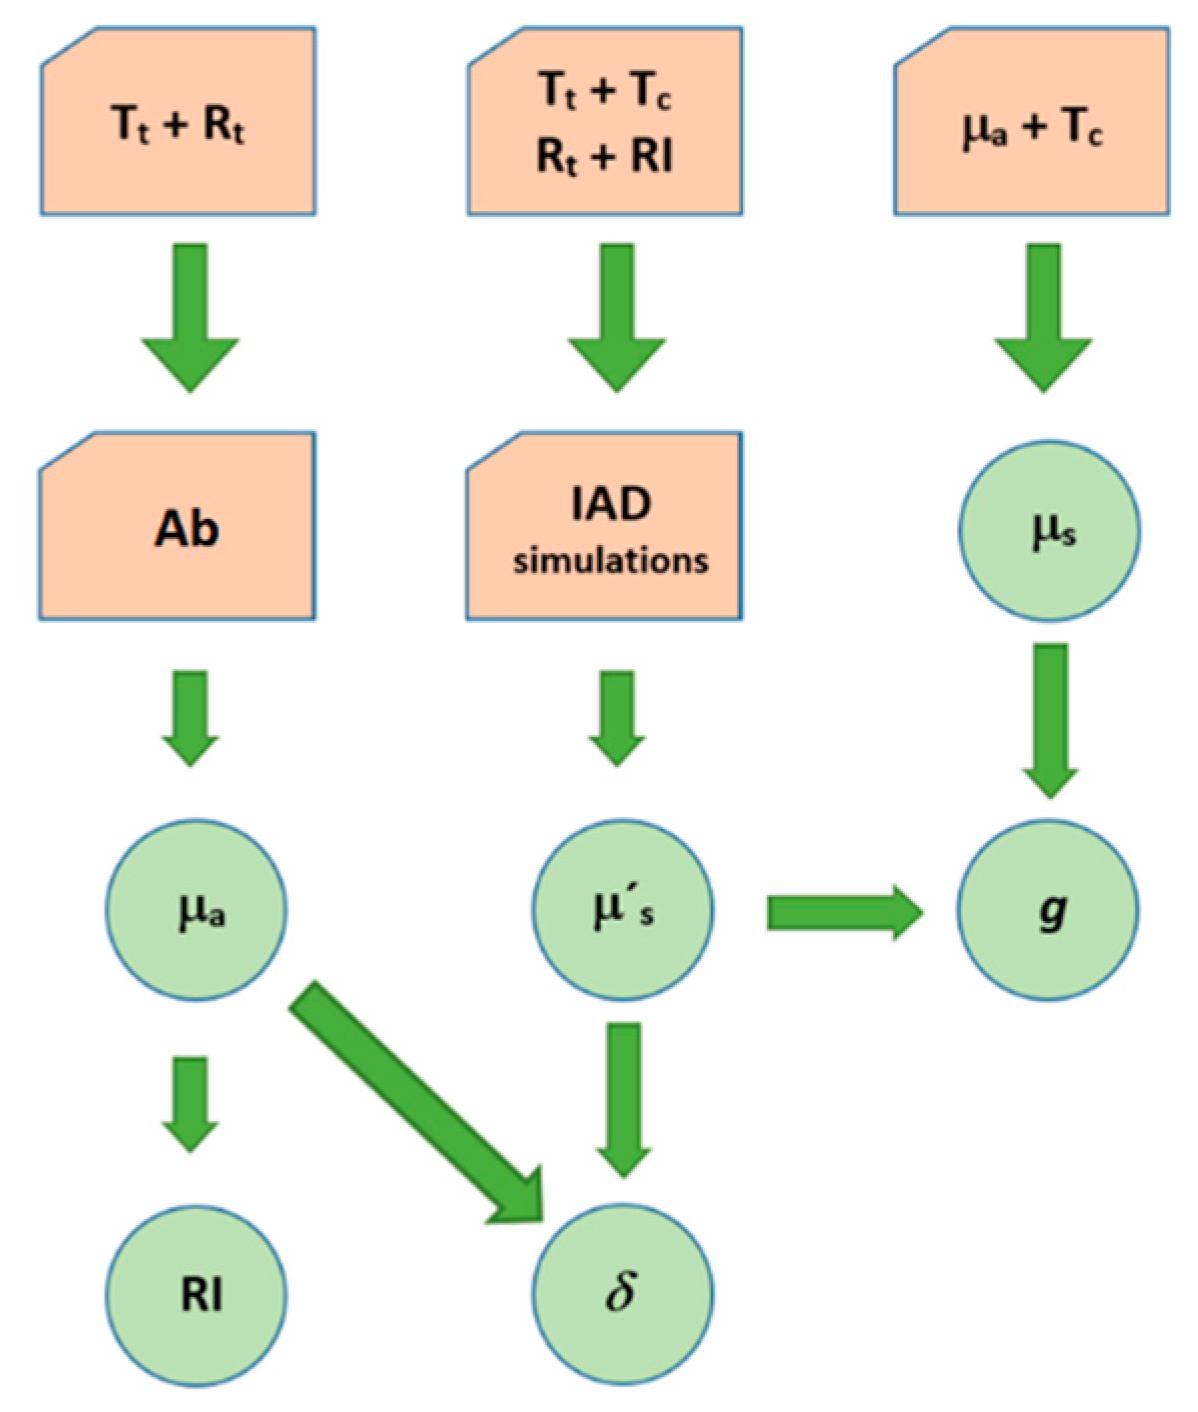
As indicated in Section 1, with the exception of µ′s, our method allows obtaining all other optical properties of a tissue through direct calculation from the spectral measurements. Such a method is fast, simple, and straightforward, as represented schematically in Figure 3 and described below.
The first calculation step consists on obtaining the wavelength dependence for the absorbance (Ab) of the tissue sample. Such a calculation is made with Equation (9), using the Rt and Tt spectra.
A b ( λ ) = 1 ( T t ( λ ) + R t ( λ ) 100 ) .
By dividing Ab(λ) by the sample thickness, we obtain µa(λ), which can be used to calculate the real part of the RI of the tissue, ntissue(λ).
In this calculation, to obtain the tissue’s dispersion, we start by obtaining the imaginary part of tissue’s RI, κ(λ), through Equation 10 [30]:
κ ( λ ) = λ 4 π μ a ( λ ) .
With this calculation, κ(λ) can be used in the following Kramers-Kronig (K-K) relation to obtain ntissue(λ) [30,31]:
n t i s s u e ( λ ) = 1 + 2 π 0 λ Λ × λ Λ 2 λ 2 κ ( λ ) d Λ ,
where Λ represents the integrating variable over a wavelength range under consideration and λ is a fixed wavelength in that range that can be tuned for better adjustment of the calculated dispersion. Such better adjustment is obtained if some experimental RI data for some wavelengths and/or a possible dispersion curve for the tissue in a smaller spectral range than the one to be considered are available [32].
The following step consists of obtaining the µ′s data through inverse adding-doubling (IAD) simulations [23]. To perform these simulations, sample thickness, Tt, Rt, Tc, and RI data within the wavelength range to consider are used as input. The IAD code used in these estimations is the one developed by Scott Prahl and it is available online at http://omlc.org/software/iad. Such code also generates µa, but since we have already calculated it from the Tt, Rt spectra and since each simulation corresponds to a single wavelength, we only collect the µ′s data from the simulations for later reconstruction of its wavelength dependence. The selection of wavelengths to perform these simulations is kept to a minimum since the general curve that describes µ′s(λ) is described by Equation (3). In the present study, we considered wavelengths at each 50 nm between 200 and 1000 nm. Once all the µ′s values for the selected wavelengths are estimated, the data is fitted with Equation (3), and a′, fRay, and bMie are obtained during the fitting.
Using the calculated µa(λ) and the estimated µ′s(λ) in Equation (2), the wavelength dependence for δ, δ( λ), is calculated.
To calculate µs(λ), the sample thickness, d, µa(λ), and the Tc spectrum are used in Bouguer–Beer–Lambert law [2,10],
μ s ( λ ) = ln [ T c ( λ ) ] d μ a ( λ ) ,
where µa(λ) is the one obtained from Tt and Rt spectra through Equation (9).
Finally, g(λ) is calculated from µs(λ) and µ′s(λ) through Equation (1).
The calculation procedure here described was used to obtain the mean optical properties for human colorectal mucosa (normal and pathological) tissues. By analyzing such calculated properties, it was possible to identify some spectral signatures and also to detect different pigment accumulation in normal and pathological mucosa. Such distinct accumulation of this pigment can be used in future for the development of a noninvasive diagnostic method, based on diffuse reflectance, Rd, measurements. Section 3 presents the results of this study and corresponding discussion.

3. Results

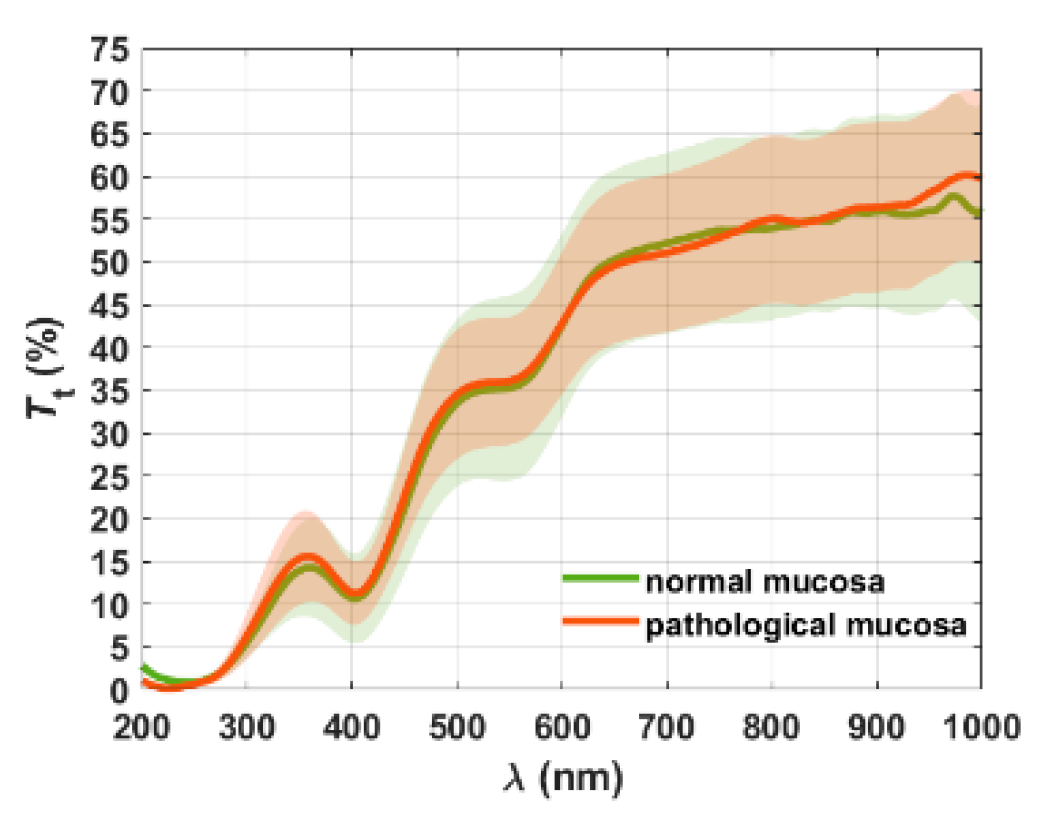
We initiated the present study by performing the spectral measurements from the normal and pathological tissue samples. Figure 4 presents the mean of 10 Tt spectra and standard deviation (SD) bars for normal and pathological mucosa.
We see from the mean spectra in Figure 4 that both tissues present low transmittance in the deep-UV range. The form and magnitude of the Tt spectra is similar for both tissues, showing an increasing behavior with increasing wavelength and the absorption bands of hemoglobin near 415 nm (Soret-oxygenated hemoglobin) and 550 nm (deoxygenated hemoglobin) [33].
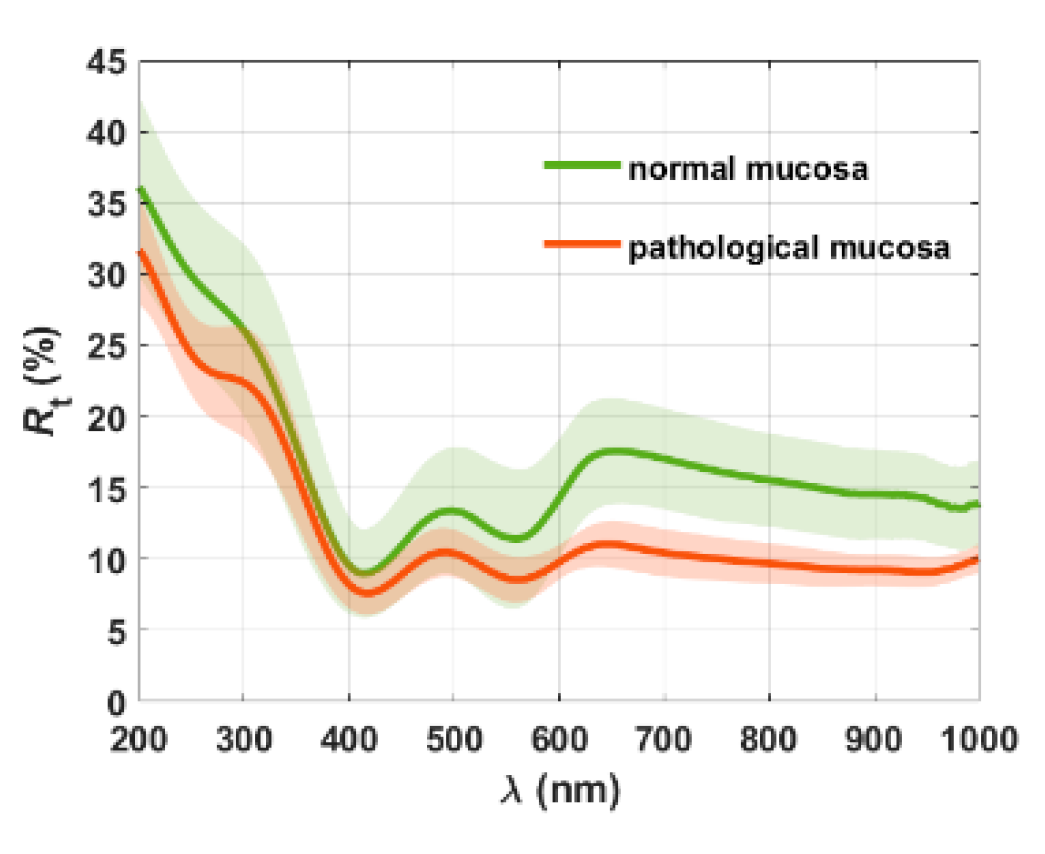
Figure 5 presents the mean of 10 Rt spectra and SD bars for normal and pathological mucosa.
Comparing between the spectra in graphs of Figure 5 we see that both tissues show similar magnitude and wavelength dependence for Rt. Once again, the occurrence of two absorption bands near 415 and 550 nm indicate the presence of both oxygenated and deoxygenated hemoglobin [33].
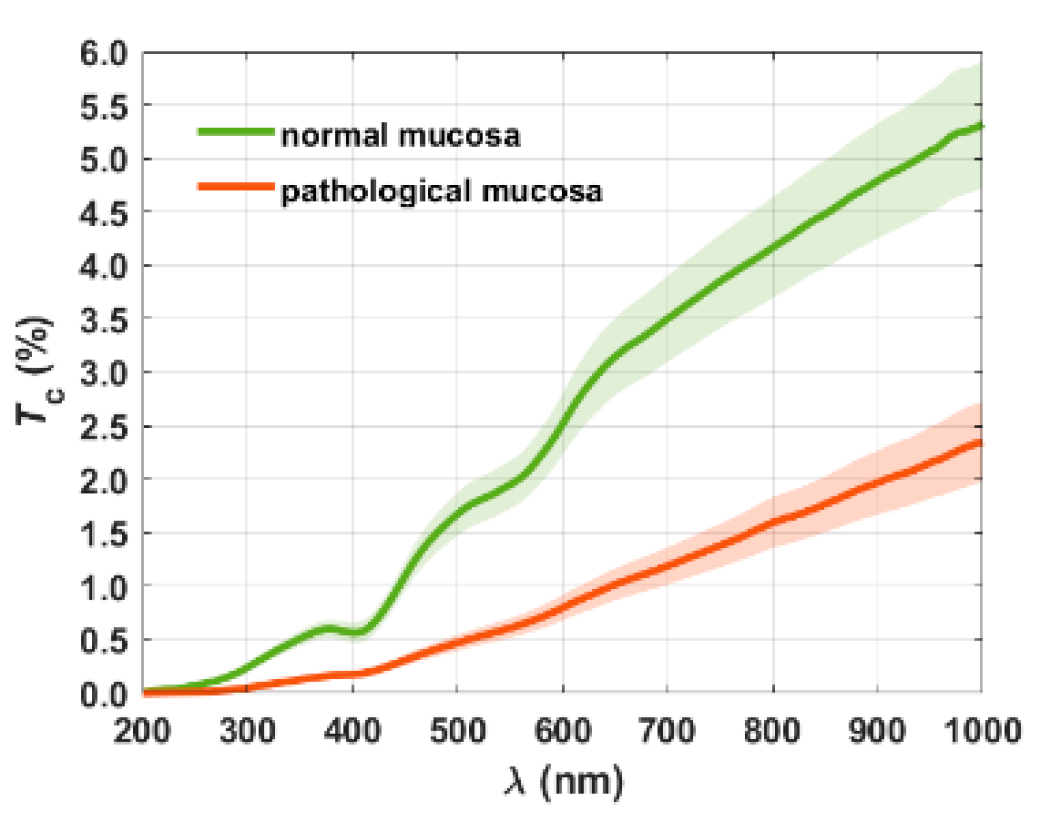
Figure 6 presents the mean of 10 Tc spectra and SD bars for normal and pathological mucosa.
Considering the sensitive Tc measurements presented in Figure 6, we see that, although the wavelength dependence is similar for both tissues, some differences are visible. The normal mucosa seems to have higher blood content, since the magnitude of the absorption bands of hemoglobin is higher than in the pathological mucosa. On the other hand, the Tc magnitude is higher for the normal mucosa in the entire spectral range, a fact that may mislead in the evaluation of the total blood content in both tissues.
Using the individual Tt and Rt spectra that originated the mean curves in graphs of Figure 4 and Figure 5 in Equation (9), we calculated 10 absorption spectra, Ab(λ), for each tissue, which were then divided by the sample thickness, d = 0.05 cm, to obtain the 10 µa(λ) curves. Figure 7 presents the mean µa(λ) curves and corresponding SD bars for both tissues.
Both datasets in Figure 7 show that these tissues present a typical wavelength dependence for µa, since its magnitude decreases with increasing wavelength from the UV to the NIR wavelengths. These spectra show three absorption bands: the first one at 268 nm, which is a combination of the absorption bands of DNA (260 nm) and hemoglobin (274 nm), the second at ~415 nm (Soret band), and the third near 550 nm (deoxygenated hemoglobin) [33].
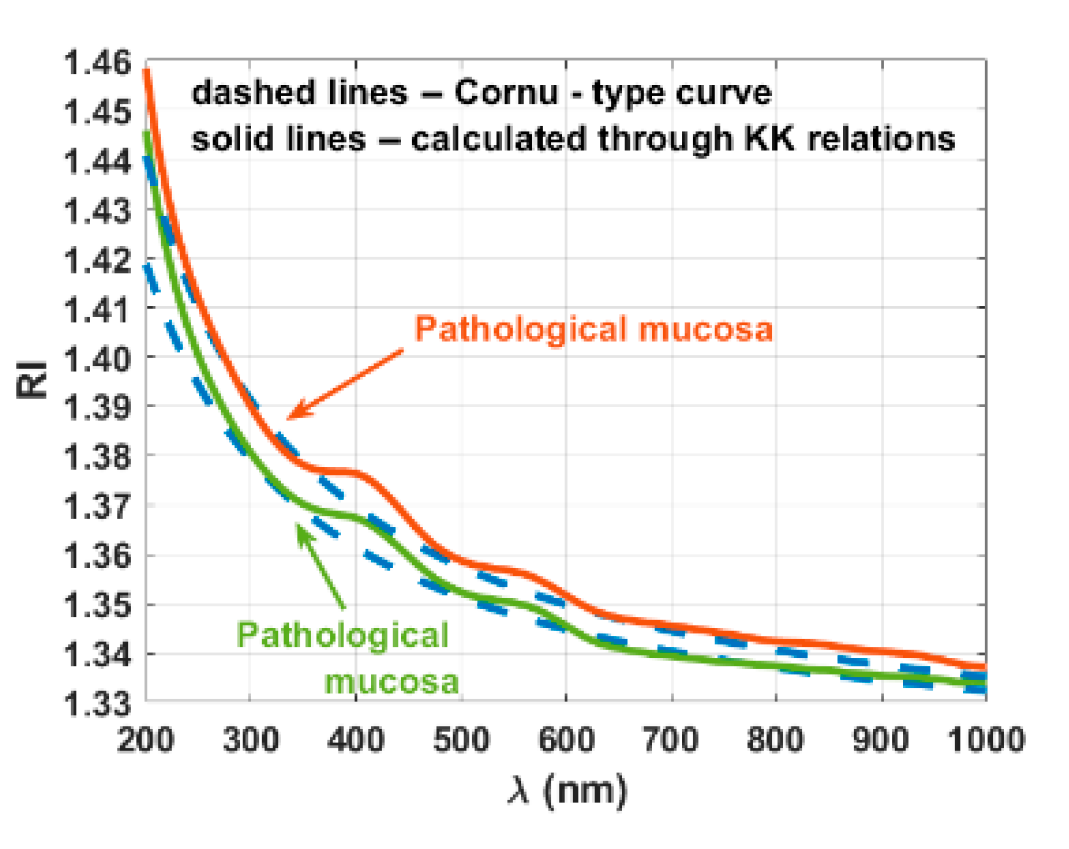
The mean curves in Figure 7 were used in calculations with Equations(10) and (11) to obtain tissue’s dispersions. The solid lines in Figure 8 present the result of this calculation for both tissues, along with the previously estimated Cornu curves (dashed lines) [34], now extended to 200 nm for comparison.
Considering the datasets for each tissue in Figure 8, the dispersion obtained from the absorption spectrum (solid line) and the one calculated from experimental RI data (dashed line) [34] show good agreement.
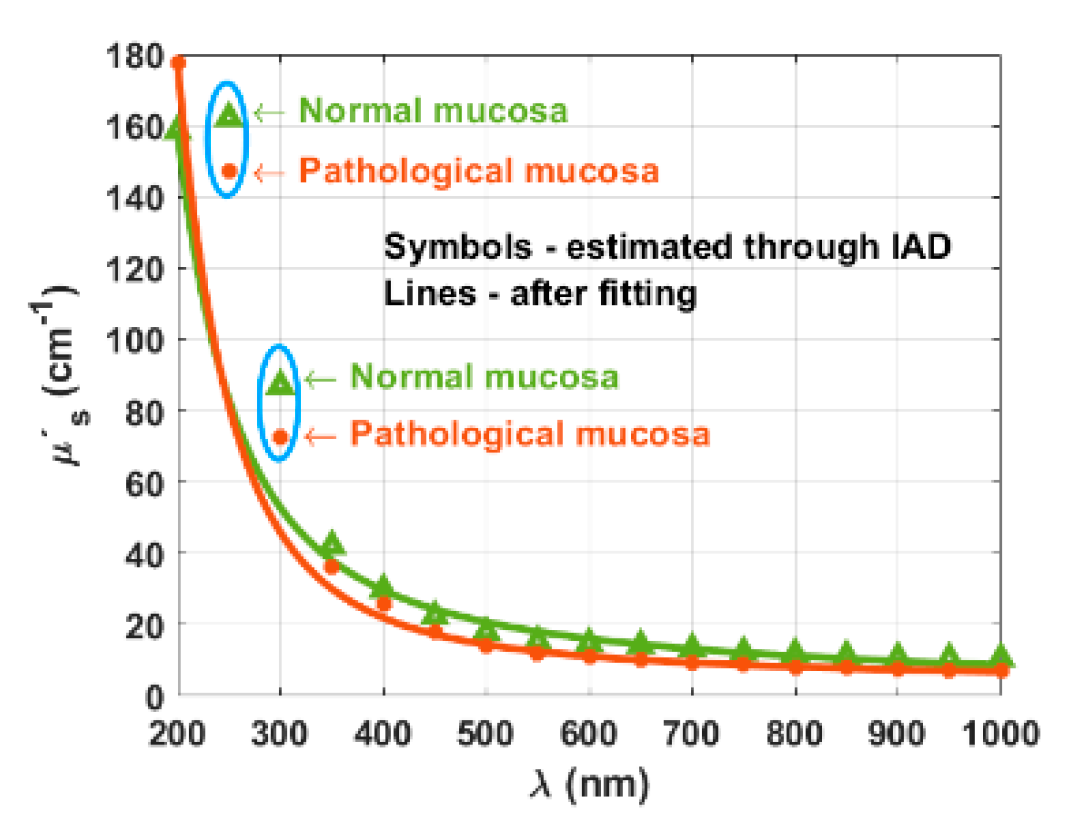
After calculating the dispersions of both tissues between 200 and 1000 nm, we had all the necessary data to perform the IAD simulations. Those simulations were performed for both tissues, using the sample thickness of 0.05 cm, and the spectral data from mean Tt, mean Rt, mean Tc and the calculated dispersions, as presented in graphs of Figure 4, Figure 5 and Figure 6 and Figure 8. The estimated µ′s values and the fitting curves described by Equation (3) are presented in Figure 9.
As we can see from curves in Figure 9, to obtain a good fitting (R-square > 0.997 in both cases), we needed to neglect some of the estimated points (points inside blue lines). The estimated curves show the smooth-decreasing behavior with increasing wavelength, indicating that both tissues have strong and multiple scattering at short-wavelengths. Since the simulations that generated the µ′s points presented in Figure 9 were made using the mean experimental spectra, no SD bars are presented. Comparing both tissues, we see that the magnitude of µ′s in the pathological mucosa is lower for wavelengths in the NIR range and higher in the deep-UV region, near 200 nm, which suggests a higher protein content in this tissue as reported by Peña-Llopis and Brugarolas [35].
When performing the fitting of the estimated µ′s data, we obtained the following equations for the curves presented in Figure 9.
μ s normal ( λ ) = 20.76 × ( 0.137 × ( λ 500 ( nm ) ) 4 + ( 1 0.137 ) × ( λ 500 ( nm ) ) 1.068 ) ,
μ s pathological ( λ ) = 14.47 × ( 0.2806 × ( λ 500 ( nm ) ) 4 + ( 1 0.2806 ) × ( λ 500 ( nm ) ) 0.6621 ) ,
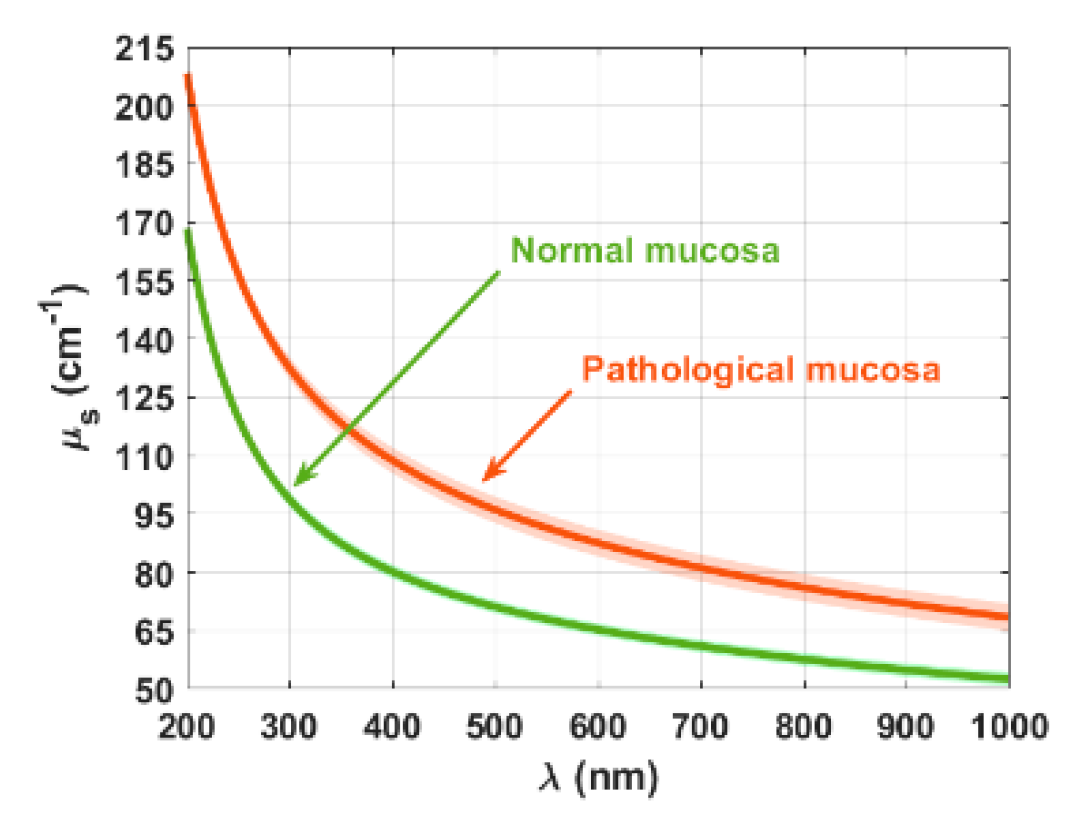
The following step consisted on obtaining µs(λ) for both tissues. Considering the 10 Tc spectra measured from a particular tissue and the calculated µa(λ) curves, 10 µs(λ) curves were calculated with Equation (12). Figure 10 presents the calculated mean µs(λ), after adjusting with a curve as described by Equation (3), and SD bars for both tissues.
Both curves in Figure 10 show the expected smooth-decreasing behavior, and low SD values along the entire spectral range, meaning that scattering is not too different from one sample to another within the sample groups of normal and pathological mucosa used in the present study. Similar to what was observed for µ′s, the pathological mucosa presents higher magnitude values for µs in the deep-UV, indicating a higher protein content. The curves presented in Figure 10 are described by the following equations, which were obtained with R-square values of 0.9978 (normal mucosa) and 0.9989 (pathological mucosa).
μ s normal ( λ ) = 71.14 × ( 0.0244 × ( λ 500 ( nm ) ) 4 + ( 1 0.0244 ) × ( λ 500 ( nm ) ) 0.4035 )
μ s pathological ( λ ) = 96.07 × ( 0.0169 × ( λ 500 ( nm ) ) 4 + ( 1 0.0169 ) × ( λ 500 ( nm ) ) 0.4665 )
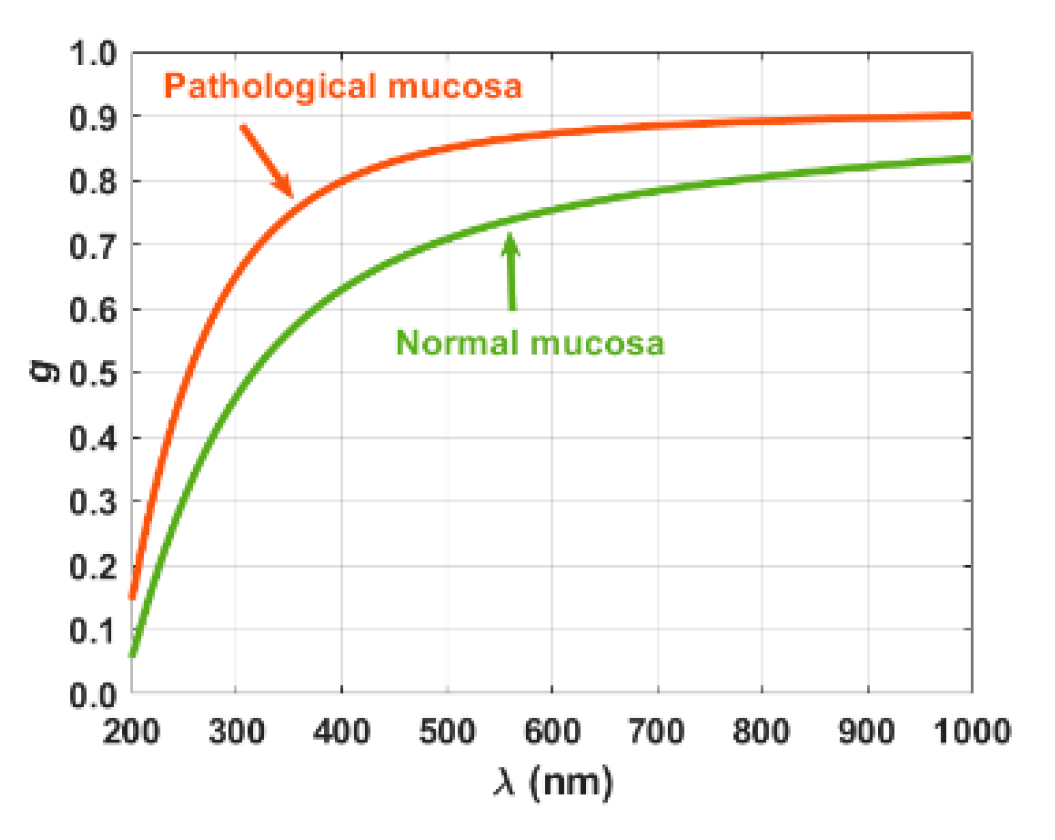
After obtaining the curves for µ′s(λ) and µs(λ) for both tissues, we used Equation (1) to calculate g(λ). Figure 11 presents the results of these calculations.
Figure 11 shows that both tissues present a good wavelength dependence for g in the entire spectral range – g increases with wavelength from the deep-UV to NIR. The pathological mucosa presents higher g values than the normal mucosa in the entire spectral range, which suggests a higher scattering directionality at all wavelengths. Considering the range between 200 and 230 nm, such higher scattering directionality might be due to the presence of a higher protein content in the pathological mucosa. For the longer wavelengths, higher-sized structures that emerge during cancer development might be responsible for the higher scattering directionality.
To obtain the equations that describe the curves presented in Figure 11, we used the curve fitting tool of MATLABTM to fit that data.
g ( λ ) = 0.6763 exp ( 2.171 × 10 4 λ ) 3.946 exp ( 9.055 × 10 3 λ ) .
g ( λ ) = 0.8335 exp ( 8.226 × 10 5 λ ) 8.028 exp ( 12.25 × 10 3 λ ) .
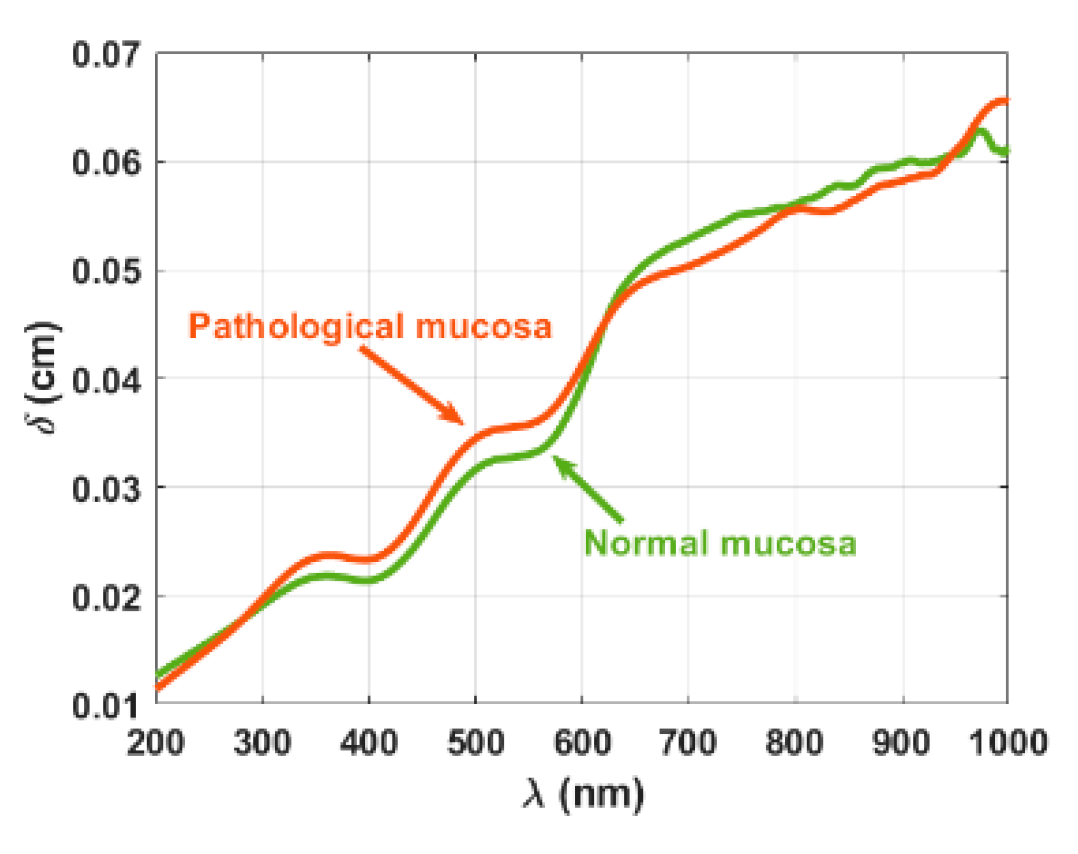
These fittings were obtained with R-square values of 0.9998 for the normal mucosa and 0.9997 for the pathological mucosa. Finally, using µa(λ) and µ′s(λ) in Equation (2), we calculated δ(λ) for both tissues. The results of these calculations are presented in Figure 12.
Both curves in Figure 12 show the expected wavelength dependence for δ. These curves also show the absorption bands of hemoglobin near 415 and 550 nm. For the case of the pathological mucosa, the occurrence of a double absorption band with peaks near 830 and 930 nm indicates that some lipids have accumulated in this tissue during cancer development as reported [34]. Comparing the magnitude of the δ values in curves of Figure 12 with others previously reported for other mucosal tissues, such as mucous membrane from the human maxillary sinus [36], we see that our results are approximately 10 × less. Wondering why such difference occurs between our calculated and other published data for mucous tissues, we supposed that some pigment has accumulated in the mucosal tissues used in our study, leading to a reduced light penetration depth through increased absorption in the entire spectral range. Other tissue fragments that were retrieved from the same surgical specimens were analyzed at the Portuguese Oncology Institute of Porto, and consulting the clinical records of those tissues, we found some information that is vital to interpret our results. According to these records, as a result of a natural product that was administered to the patients in the two days before the surgical procedure, a lipofuscin-type pigment has accumulated in the colorectal mucosa. Lipofuscin presents a wavelength dependence that decreases in an exponential manner with increasing wavelength [37,38].
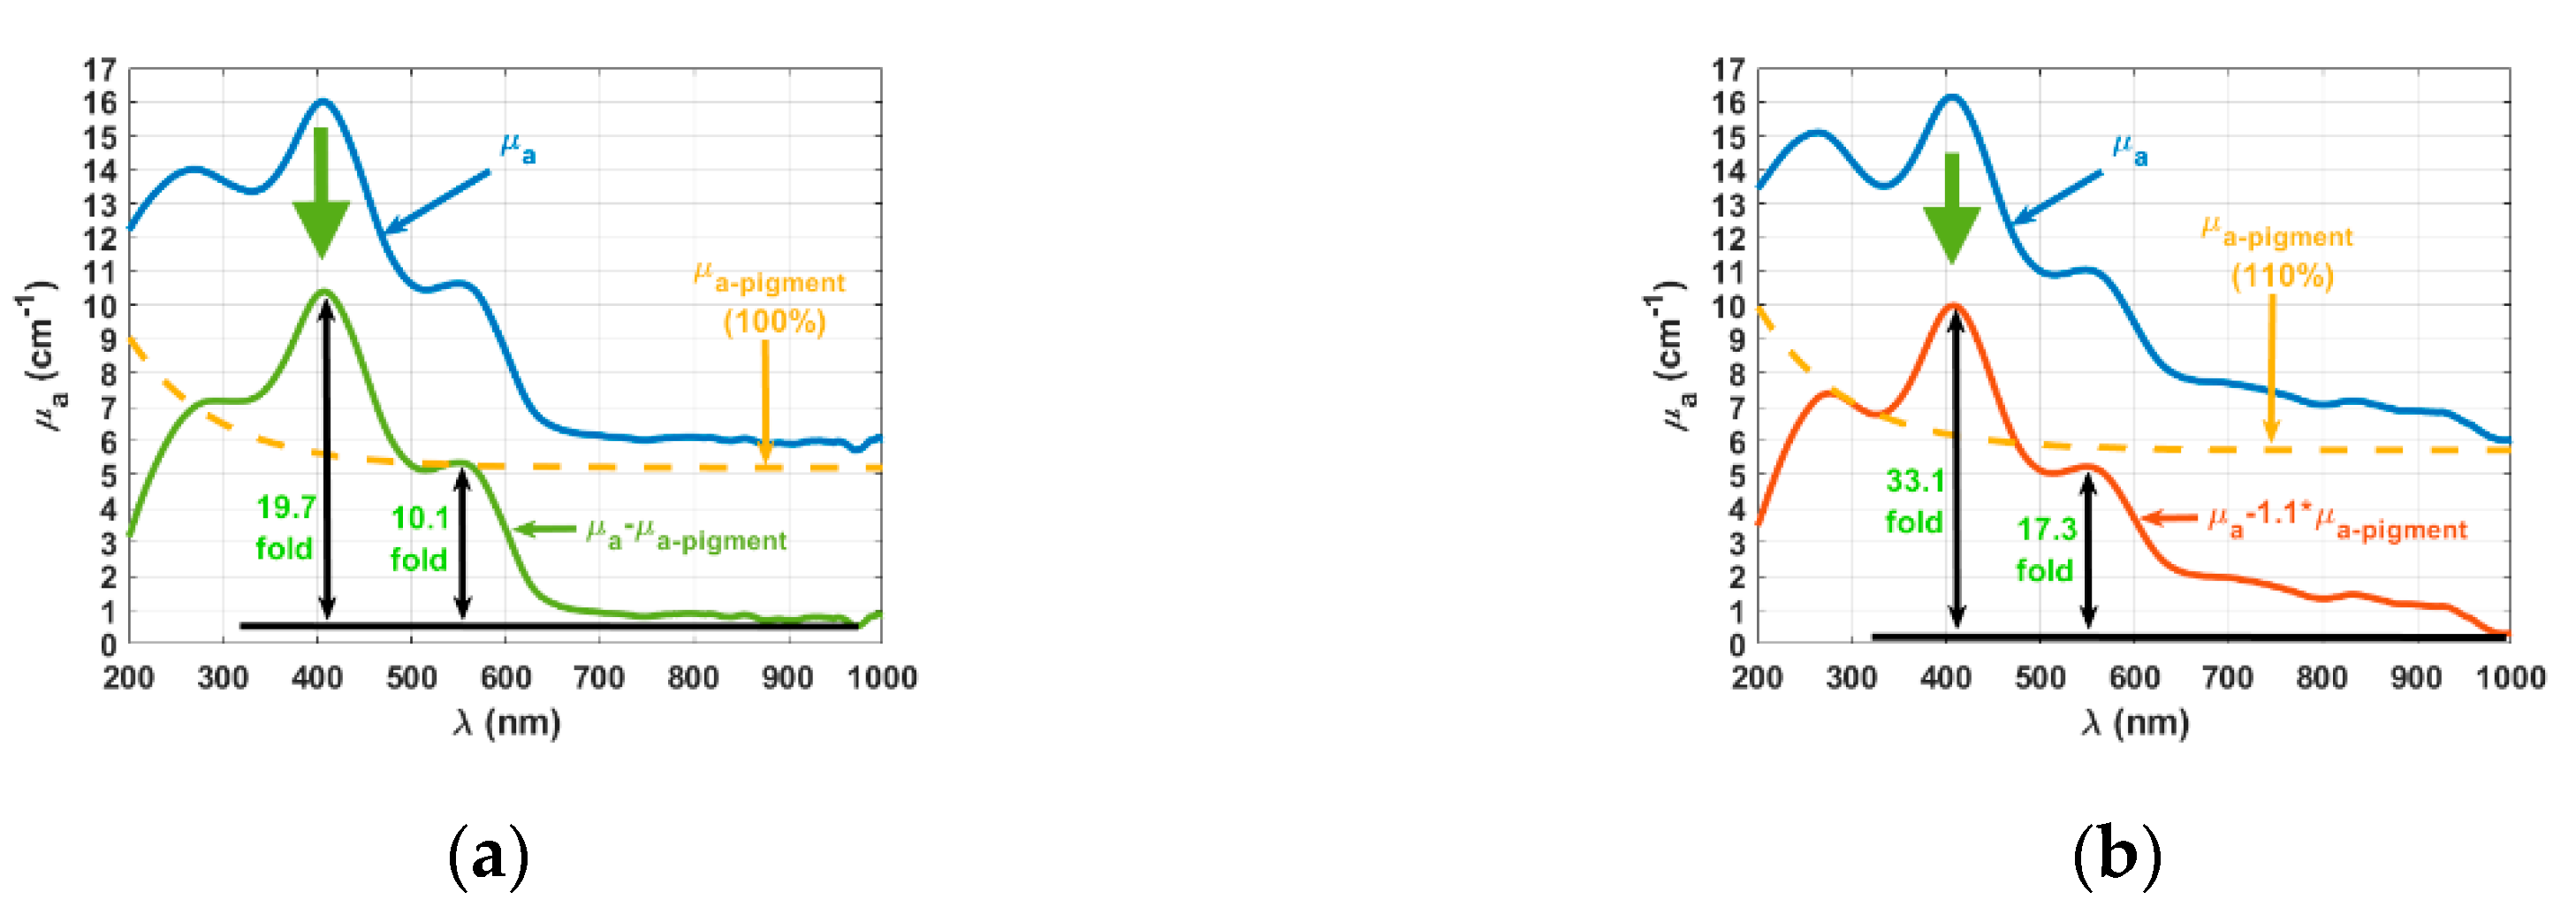
Trying to acquire additional information about this pigment that has accumulated in both tissues, we returned to the µa data presented in Figure 7. Considering the absorption peaks of hemoglobin in the visible range, we calculated the ratios between the µa values at those peaks and the ones from the baseline and found that both normal and pathological tissues present a 2.7-fold ratio at 415 and a 1.8-fold ratio at 550 nm. According to Bashkatov et al. [36], these ratios should be higher for the normal mucosa. On the other hand, they should also be different between normal and pathological mucosa due to a higher blood content in cancer tissues, as previously reported [17]. By obtaining such equal ratios at 415 and 550 nm for normal and pathological tissues, we get a confirmation that some absorber is hiding the true blood content in the mucosa tissues used in our study. To obtain the wavelength dependence for the µa of such pigment, we tried some curves that have an exponential decreasing behavior with increasing wavelength, similar to lipofuscin [37,38]. During these trials, we found that a curve described by Equation (19) can be subtracted to the µa(λ) of the normal mucosa to produce acceptable ratios at 415 nm (19.7-fold) and at 550 nm (10.1-fold), which resemble the ratios reported for other mucosal tissues [36].
μ a pigment ( λ ) = A × e ( 3.524 0.0187 . λ )
In this equation, µa-pigment is represented in cm−1 and λ in nm. A represents the percentage content of the pigment in the tissue, which in the case of normal mucosa assumes the value 1 (100%). Equation (19) has the same mathematical form as the one reported for lipofuscin in cerebral tissues [38], but its numerical factors needed to be adjusted to fit the wavelength dependence of the lipofuscin-type pigment in colorectal tissues. The similar curve was also subtracted to the µa graph of the pathological mucosa, but to obtain reasonable blood content in that tissue, we had to consider A = 1.1 in Equation (19), a 10% higher content of the pigment in the pathological tissue. Figure 13 presents the µa graphs for normal and pathological tissues, before and after subtracting the absorption of the pigment. The absorption of the pigment, as described by Equation (19), is also represented in graphs of Figure 13, considering 100% content in the normal and 110% in the pathological mucosa.
The results presented in the graphs of Figure 13 present two important results. The first one is that the lipofuscin-type pigment accumulates differently in the normal and pathological mucosa, since to obtain these results, we had to consider a 10% higher content of the pigment in the pathological tissue. The second result is that by subtracting the absorption of the pigment in the two tissues, the pathological mucosa presents higher blood content than the normal mucosa, as previously reported [17].

4. Conclusions

The present study consisted on calculating the wavelength dependencies for the optical properties of biological tissues, directly from spectral measurements. With the exception of µ′s, which needs to be estimated through IAD simulations, the method here introduced allows a fast evaluation of the basic optical properties of any biological tissue as a function of wavelength, provided that Tt, Rt and Tc spectra are collected. Such method is sensitive enough to detect spectral signatures in the calculated optical properties and to allow differentiation between normal and pathological tissues.
By using spectral measurements from human colorectal tissues, it was possible to verify that the proposed calculation method produces the expected wavelength dependencies for all optical properties. The use of K-K relations to obtain the real part of the RI of tissues has also been demonstrated effective and reliable, since the calculated dispersions match almost perfectly the previous calculated curves that fit experimental RI data between 400 and 1000 nm. Since the dispersions calculated through K-K relations are obtained from the spectral measurements, they also show spectral signatures, which were not obtained when fitting the experimental RI data. By comparing the magnitude of the calculated penetration depth values with previously reported data for other mucosal tissues, it was possible to identify the presence of an additional absorber both in normal and pathological mucosa tissues and to quantify a higher content in the pathological tissue. Such information may be used in the future in the development of noninvasive spectroscopic diagnostic procedures, based on Rd spectral measurements. It will be interesting to use this same methodology for the evaluation of the optical properties of other tissues, both in normal or pathological samples to obtain discriminating information that can be useful for the diagnostic of different diseases or other types of cancer.

Author Contributions

Conceptualization, V.T. and L.O.; methodology, V.T. and L.O.; investigation, S.C., I.C., R.H., and L.O.; writing—original draft preparation, S.C., I.C., and L.O.; writing—review and editing, R.H. and V.T.; project administration, V.T. and L.O. All authors have read and agreed to the published version of the manuscript.

Funding

This research was funded by the Portuguese Science Foundation, grant number FCT-UIDB/04730/2020 and VVT was funded by RFBR grant 18–29–02060 MK.

Conflicts of Interest

The authors declare no conflict of interest.

References

  1. Brenner, H.; Kloor, M.; Pox, C.P. Colorectal cancer. Lancet 2014, 383, 1490–1502. [Google Scholar] [CrossRef]
  2. Oliveira, L.M.; Tuchin, V.V. The Optical Clearing Method—A New Tool for Clinical Practice and Biomedical Engineering; SPRINGER: Cham, Switzerland, 2019; pp. 1–106. [Google Scholar]
  3. Sordillo, D.C.; Sordillo, L.A.; Sordillo, P.P.; Shi, L.; Alfano, R.R. Short wavelength infrared optical windows for evaluation of benign and malignant tissues. J. Biomed. Opt. 2017, 22. [Google Scholar] [CrossRef]
  4. Shi, L.; Sordillo, L.A.; Rodríguez-Contreras, A.; Alfano, R. Transmission in near-infrared optical windows for deep brain imaging. J. Biophotonics 2016, 9, 38–43. [Google Scholar] [CrossRef] [PubMed]
  5. Bashkatov, A.N.; Genina, E.A.; Kozintseva, M.D.; Kochubei, V.I.; Gorodkov, S.Y.; Tuchin, V.V. Optical properties of peritoneal biological tissues in the spectral range of 350-2500 nm. Opt. Spectrosc. 2016, 120, 6–14. [Google Scholar] [CrossRef]
  6. Carneiro, I.; Carvalho, S.; Henrique, R.; Oliveira, L.; Tuchin, V. Moving tissue spectral window to the deep-ultraviolet via optical clearing. J. Biophotonics 2019, 12. [Google Scholar] [CrossRef] [PubMed]
  7. Carneiro, I.; Carvalho, S.; Henrique, R.; Selifonov, S.; Oliveira, L.; Tuchin, V.V. Enhanced ultraviolet spectroscopy by optical clearing for biomedical applications. IEEE J. Sel. Top. Quant. Elect. 2021, 27. [Google Scholar] [CrossRef]
  8. Oliveira, L.M.; Zaytsev, K.I.; Tuchin, V.V. Improved biomedical imaging over a wide spectral range from UV to THz towards multimodality. In SPIE Proceedings of the Third International Conference on Biophotonics Riga 2020, Riga, Latvia, 24–25 August 2020; Spigulis, J., Ed.; SPIE: Bellingham, WA, USA, 2020; Volume 11585, p. 11585. [Google Scholar]
  9. Bashkatov, A.N.; Genina, E.A.; Kochubey, V.I.; Rubtsov, V.S.; Kolesnikova, E.A.; Tuchin, V.V. Optical properties of human colon tissues in the 350-2500 spectral range. Quant. Elect. 2014, 44, 779–784. [Google Scholar] [CrossRef] [Green Version]
  10. Tuchin, V.V. Tissue Optics: Light Scattering Methods and Instruments for Medical Diagnosis, 3rd ed.; SPIE Press: Bellingham, WA, USA, 2015; pp. 245–358. [Google Scholar]
  11. Vo-Dinh, T. Biomedical Photonics Handbook, 2nd ed.; CRC Press: Boca Raton, FL, USA, 2014; Volume 1, pp. 23–168. [Google Scholar]
  12. Bashkatov, A.N.; Genina, E.A.; Kochubey, V.I.; Tuchin, V.V. Optical properties of human skin, subcutaneous and mucous tissues in the wavelength range from 400 to 2000 nm. J. Phys. D Appl. Phys. 2005, 38, 2543. [Google Scholar] [CrossRef]
  13. Bashkatov, A.N.; Genina, E.A.; Kochubey, V.I.; Tuchin, V.V. Optical properties of the subcutaneous adipose tissue in the spectral range 400–2500 nm. Opt. Spectrosc. 2005, 99, 836–842. [Google Scholar] [CrossRef]
  14. Bashkatov, A.N.; Genina, E.A.; Kochubey, V.I.; Tuchin, V.V. Optical properties of human cranial bone in the spectral range from 800 to 2000 nm. In SPIE Proceedings of the Saratov Fall Meeting 2005: Optical Technologies in Biophysics and Medicine VII, Saratov, Russian, 27–30 September 2005; Tuchin, V.V., Ed.; SPIE: Bellingham, WA, USA, 2006; Volume 6163, p. 6163. [Google Scholar]
  15. Bashkatov, A.N.; Genina, E.A.; Kochubey, V.I.; Gavrilova, A.A.; Kapralov, S.V.; Grishaev, V.A.; Tuchin, V.V. Optical properties of human stomach mucosa in the spectral range from 400 to 2000 nm: Prognosis for gastroenterology. Med. Las. Appl. 2007, 22, 95–104. [Google Scholar] [CrossRef]
  16. Bashkatov, A.N.; Genina, E.A.; Kochubey, V.I.; Tuchin, V.V. Optical properties of human sclera in spectral range 370–2500 nm. Opt. Spectrosc. 2010, 109, 197–204. [Google Scholar] [CrossRef]
  17. Carvalho, S.; Gueiral, N.; Nogueira, E.; Henrique, R.; Oliveira, L.; Tuchin, V. Comparative study of the optical properties of colon mucosa and colon precancerous polyps between 400 and 1000 nm. In SPIE Proceedings of BIOS-Photonics West 2017: Dynamics and Fluctuations in Biomedical Photonics, San Francisco, CA, USA, 28 January–2 February 2017; Tuchin, V.V., Larin, K.V., Leahy, M.J., Wang, R.K., Eds.; SPIE: Bellingham, WA, USA, 2017; Volume 10063, p. 10063. [Google Scholar]
  18. Carneiro, I.; Carvalho, S.; Henrique, R.; Oliveira, L.; Tuchin, V.V. Optical properties of colorectal muscle in visible/NIR range. In SPIE Proceedings of Photonics Europe: Biophotonics—Photonic Solutions for Better Health Care VI, Strasbourg, France, 22–26 April 2018; Popp, J., Tuchin, V.V., Pavone, F.S., Eds.; SPIE: Bellingham, WA, USA, 2018; Volume 10685, p. 10685. [Google Scholar]
  19. Carneiro, I.; Carvalho, S.; Henrique, R.; Oliveira, L.; Tuchin, V.V. Measuring optical properties of human liver between 400 and 1000 nm. Quant. Electr. 2019, 49, 13–19. [Google Scholar] [CrossRef]
  20. Jacques, S.L. Optical properties of biological tissues: A review. Phys. Med. Biol. 2013, 58, R37–R61. [Google Scholar] [CrossRef] [PubMed]
  21. Carneiro, I.; Carvalho, S.; Silva, V.; Henrique, R.; Oliveira, L.; Tuchin, V.V. Kinetics of optical properties of human colorectal tissues during optical clearing: A comparative study between normal and pathological tissues. J. Biomed. Opt. 2018, 23. [Google Scholar] [CrossRef] [Green Version]
  22. Carneiro, I.; Carvalho, S.; Henrique, R.; Oliveira, L.; Tuchin, V.V. Kinetics of Optical Properties of Colorectal Muscle During Optical Clearing. IEEE J. Sel. Top. Quant. Elect. 2019, 25. [Google Scholar] [CrossRef]
  23. Prahl, S.A.; van Gemert, M.J.C.; Welch, A.J. Determining the optical properties of turbid media by using the adding-doubling method. Appl. Opt. 1993, 32, 559–568. [Google Scholar] [CrossRef] [PubMed]
  24. Wang, L.; Jacques, S.L.; Zheng, L. MCML-Monte Carlo modeling of light transport in multi-layered tissues. Comp. Method Prog. Biomed. 1995, 47, 131–146. [Google Scholar] [CrossRef]
  25. Ianina, I.Y.; Lazareva, E.N.; Tuchin, V.V. Refractive index of adipose tissue and lipid droplet measured in wide spectral and temperature ranges. Appl. Opt. 2018, 57, 4839–4848. [Google Scholar] [CrossRef]
  26. Lazareva, E.N.; Tuchin, V.V. Measurement of refractive index of hemoglobin in the visible/NIR spectral range. J. Biomed. Opt. 2018, 23. [Google Scholar] [CrossRef] [Green Version]
  27. Lazareva, E.N.; Tuchin, V.V. Blood refractive index modelling in the visible and near infrared spectral regions. J. Biomed. Photonics Eng. 2018, 4. [Google Scholar] [CrossRef] [Green Version]
  28. Carneiro, I.; Carvalho, S.; Henrique, R.; Oliveira, L.; Tuchin, V.V. Water content and scatterers dispersion evaluation in colorectal tissues. J. Biomed. Photonics Eng. 2017, 3, 40301. [Google Scholar] [CrossRef] [Green Version]
  29. Carneiro, I.; Carvalho, S.; Henrique, R.; Oliveira, L.; Tuchin, V.V. Simple multimodal technique for evaluation of free/bound water and dispersion of human liver tissue. J. Biomed. Opt. 2017, 22. [Google Scholar] [CrossRef]
  30. Sydoruk, O.; Zhernovaya, O.; Tuchin, V.V.; Douplik, A. Refractive index of solutions of human hemoglobin from the near-infrared to the ultraviolet range: Kramers-Kronig analysis. J. Biomed. Opt. 2012, 17. [Google Scholar] [CrossRef] [PubMed]
  31. Gienger, J.; Groβ, H.; Neukammer, J.; Bär, M. Determining the refractive index of human hemoglobin solutions by Kramers-Kronig relations with an improved absorption model. Appl. Opt. 2016, 55, 8951–8961. [Google Scholar] [CrossRef] [PubMed]
  32. Gomes, N.; Tuchin, V.V.; Oliveira, L.M. UV-NIR efficiency of the refractive index matching mechanism on colorectal muscle during treatment with different glycerol osmolarities. J. Biomed. Photonics Eng. 2020, 6, 20307. [Google Scholar] [CrossRef]
  33. Zhou, Y.; Yao, J.; Wang, L. Tutorial on photoacoustic tomography. J. Biomed. Opt. 2006, 6, 61007. [Google Scholar] [CrossRef] [Green Version]
  34. Carvalho, S.; Gueiral, N.; Nogueira, E.; Henrique, R.; Oliveira, L.; Tuchin, V.V. Wavelength dependence of the refractive index of human colorectal tissues: Comparison between healthy mucosa and cancer. J. Biomed. Photonics Eng. 2016, 2. [Google Scholar] [CrossRef] [Green Version]
  35. Peña-Llopis, S.; Brugarolas, J. Simultaneous isolation of high-quality DNA, RNA, miRNA and proteins from tissues for genomic applications. Nat. Protoc. 2017, 8, 2240–2255. [Google Scholar] [CrossRef] [Green Version]
  36. Bashkatov, A.N.; Genina, E.A.; Kochubey, V.I.; Tuchin, V.V.; Chikina, E.E.; Knyazev, A.B.; Mareev, O.V. Optical properties of mucous membrane in the spectral range 350–2000 nm. Opt. Spect. 2004, 97, 1043–1048. [Google Scholar] [CrossRef]
  37. Johansson, J.D. Spectroscopic method for determination of the absorption coefficient in brain tissue. J. Biomed. Opt. 2010, 15. [Google Scholar] [CrossRef] [Green Version]
  38. Johansson, J.D.; Wårdell, K. Intracerebral quantitative chromophore estimation from reflectance spectra captured during deep brain stimulation implantation. J. Biophotonics 2013, 6, 435–445. [Google Scholar] [CrossRef] [PubMed] [Green Version]
Figure 1. Surgical resection showing both normal and pathological areas of the colorectal mucosa.
Electronics 09 01805 g001
Figure 2. Schematic of the measurement setups to obtain Tt, Rt and Tc spectra.
Electronics 09 01805 g002
Figure 3. Calculation procedure to obtain the optical properties of a tissue from spectral measurements.
Electronics 09 01805 g003
Figure 4. Mean Tt spectra of the normal and pathological mucosa.
Electronics 09 01805 g004
Figure 5. Mean Rt spectra of the normal and pathological mucosa.
Electronics 09 01805 g005
Figure 6. Mean Tc spectra of the normal and pathological mucosa.
Electronics 09 01805 g006
Figure 7. Mean µa(λ) of the normal and pathological mucosa.
Electronics 09 01805 g007
Figure 8. Tissue dispersion calculated through K-K relations and by Cornu-fitting of experimental data for the normal and pathological mucosa.
Electronics 09 01805 g008
Figure 9. Estimated µ′s data and calculated fitting curve for the normal and pathological mucosa.
Electronics 09 01805 g009
Figure 10. Calculated µs(λ) curves for the normal and pathological mucosa.
Electronics 09 01805 g010
Figure 11. Calculated g(λ) curves for the normal and pathological mucosa.
Electronics 09 01805 g011
Figure 12. Calculated δ(λ) curves for the normal and pathological mucosa.
Electronics 09 01805 g012
Figure 13. Wavelength dependencies of µa for the pigment, for normal (a) and for pathological (b) mucosa, before and after subtracting the absorption of the pigment.
Electronics 09 01805 g013
Publisher’s Note: MDPI stays neutral with regard to jurisdictional claims in published maps and institutional affiliations.