Article

Spatially-Resolved Multiply-Excited Autofluorescence and Diffuse Reflectance Spectroscopy: SpectroLive Medical Device for Skin In Vivo Optical Biopsy

1
CNRS (the Research Center for Automatic Control), Université de Lorraine, CRAN, 54000 Nancy, France
2
Department of Plastic, Aesthetic and Reconstructive Surgery, Metz-Thionville Regional Hospital, 57530 Ars-Laquenexy, France
3
Département de Chirurgie, Institut de Cancérologie de Lorraine, 54519 Vandœuvre-lès-Nancy, France
4
SD Innovation® SAS, 48 Square Eugène Herzog, 54390 Frouard, France
*
Author to whom correspondence should be addressed.
Electronics 2021, 10(3), 243; https://doi.org/10.3390/electronics10030243
Submission received: 31 December 2020 / Revised: 15 January 2021 / Accepted: 17 January 2021 / Published: 21 January 2021
(This article belongs to the Special Issue Advanced Laser Technologies for Biophotonics)

Abstract

:
This contribution presents the development of an optical spectroscopy device, called SpectroLive, that allows spatially-resolved multiply-excited autofluorescence and diffuse reflectance measurements. Besides describing the device, this study aims at presenting the metrological and safety regulation validations performed towards its aimed application to skin carcinoma in vivo diagnosis. This device is made of six light sources and four spectrometers for detection of the back-scattered intensity spectra collected through an optical probe (made of several optical fibers) featuring four source-to-detector separations (from 400 to 1000 µm). In order to be allowed by the French authorities to be evaluated in clinics, the SpectroLive device was successfully checked for electromagnetic compatibility and electrical and photobiological safety. In order to process spectra, spectral correction and metrological calibration were implemented in the post-processing software. Finally, we characterized the device’s sensitivity to autofluorescence detection: excitation light irradiance at the optical probe tip in contact with skin surface ranges from 2 to 11 W/m², depending on the light source. Such irradiances combined to sensitive detectors allow the device to acquire a full spectroscopic sequence within 6 s which is a short enough duration to be compatible with optical-guided surgery. All these results about sensitivity and safety make the SpectroLive device mature enough to be evaluated through a clinical trial that aims at evaluating its diagnostic accuracy for skin carcinoma diagnosis.

1. Introduction

Currently, the gold standard method for skin cancer diagnosis is histo-pathology [1]. This method requires the microscopic examination of a tumor sample, called a ‘biopsy’, taken from its original organ through a surgical procedure. Once the biological sample is surgically resected, it is fixed (for 12–24 h in formalin most often), dehydrated (several baths of increasing concentrations of ethanol), included into paraffin, then cut into 5 µm-thick slices, colored (hematoxylin and eosin most often) and finally stuck on a glass slide for microscopic evaluation by a pathologist. This whole process has two drawbacks: it is invasive and time-consuming, i.e., two to five days are necessary from biopsy to diagnostic for regular procedures. Extemporaneous procedures allow diagnostic within an hour but depending on the hospital resources, they can only be used for a minority of all surgical procedures. Furthermore, extemporaneous procedure induces partial loss of the biological materials that is no longer available for further staining.
These past decades, research efforts have been focused on developing methods that may overcome those two drawbacks, i.e., achieving real-time (for guided-surgery) and in situ diagnosis of skin tissue states. Optical methods may reach such goals and display the other advantage of being non-traumatic, i.e., non-mutagenic (unlike X rays are for instance). Main interactions of optical waves with biological tissues such as (i) absorption (atomic non-radiative relaxation after incident photon energy absorption) due to intrinsic absorbers like melanin and hemoglobin, (ii) autofluorescence, that is intrinsic fluorescence (atomic radiative relaxation after the photon energy is absorbed and partially lost in vibrational relaxation) due to proteins like elastin and collagen or to intracellular cofactors (involved in cells metabolism), and (iii) diffuse scattering (photons propagation direction modification) due to multiple light reflections at interfaces between tissue constituents of various Refractive Indices (RI) with (Raman effect) or without (elastic scattering) loss of energy have long been exploited to provide complementary metabolic and structural information on the biological tissues and related to pathological states [2,3]. Such research efforts aim at reaching the ultimate goal of “optical biopsy” in order to provide reliable and accurate diagnostic information through an atraumatic and real-time procedure.
Such interactions are used for imaging tumors and surrounding tissues like it is the case for instance with dermoscopy, Reflectance Confocal Microscopy (RCM), and Optical Coherence Tomography (OCT) techniques. Among these methods, dermoscopy is currently the most commonly used in clinics because it is convenient although it requires the dermatologist to acquire additional skills and experience: dermoscopes are made of a 10 time-magnification lens surrounded by a ring of white-light emitting diodes (LEDs) [4]. Paraffin oil applied on skin surface or cross-polarization (to get rid of the specular reflection happening on the outer skin layer called the stratum corneum) allows the dermatologist to access crucial diagnostic information (e.g., pigmentation inhomogeneity [5]) from right underneath the stratum corneum but does not provide microscopic views at a cellular level like histology does. OCT and RCM [6,7] provide a morphological view of skin cells (spatial resolution is 1–3 µm) down to the dermis but as imaging methods, they still struggle to spread into clinical practices mainly because they still lack standardized diagnostic features extracted from their images. This implies long-learning curves for physicians who want to use such innovative devices in their daily practice. We acknowledge though the strong and astonishing research efforts ongoing to fill the gap from bench side to bedside [8]. To avoid such learning curves and therefore being more efficient in reaching clinical settings, several research groups worldwide, including ours [9,10,11,12,13] have been focusing their efforts over the last two decades on developing so-called “fibered” or “tissular” spectroscopic methods that are based on optical fibers in contact with biological tissues. In this case, the goal is to automatically process back-reflected intensity spectra affected by aforementioned interactions (absorption, fluorescence, scattering) with biological tissues in order to come up with some diagnostic orientation like a risk of malignancy expressed as a scalar that the physician may further include into his therapeutic strategy.
Light has a limited penetration depth into biological tissues that is mainly due to endogenous scatterers and absorbers. This penetration depth depends on the wavelength [14]: 37% of the incident 365 (635 resp.) nm-light propagates in skin down to a 60 (respectively 480 µm). Since epidermis average thickness is about 60 µm [15], it means that even near ultra-violet (UV) and violet light sources may be used to probe endogenous fluorophores such as NADH (excitation maximum: 350 nm) which is the reduced form of NAD (nicotinamide adenine dinucleotide) (excitation maximum 420 nm) that are intracellular cofactors implied into cells metabolism. Since cancer cells display impaired metabolism compared to healthy cells, using multiply-excited spectroscopy in the near-UV spectral range is of interest for skin cancer diagnostic [16]. Moreover, the longer the source-to-detector separation (SDS) is, the more the deepest-travelling photons can be detected [17]. It is therefore of interest to take advantage of spatial resolution (several SDS) in order to probe photons that travel both within the epidermis (where cancers develop) and down to the upper dermis (as dermis fibers such as collagen and elastin are also impaired during carcinogenesis [18]).
Optical spectroscopy has been thoroughly studied over the past years to characterize its diagnostic accuracy in diagnosing microcirculation disorders [19] or cancer on a wide variety of organs such as liver [20,21], breast [13], colon [9,22], skin [3,23,24], cervix [25,26], esophagus [27] or bronchi [28]. Those research teams decided either to use off-the shelf devices, or to develop their own devices. Borisova et al. [29] chose to focus on multiply-excited AF using the spectrofluorimeter FluoroLog 3 from the Horiba Jobin-Yvon company, combined with the fiber-optical module F-3000. Using several excitation peaks for AF spectroscopy allows to combine complementary information from several endogenous fluorophores found in skin: such endogenous fluorophores absorption peaks range from 200 to 500 nm [30]. Using this device, measurements of the fluorescence signals can be obtained in excitation-emission matrices (EEM) regime with excitation in the 280–440 nm spectral range and emission observed between 300 and 700 nm. In this study, a single SDS was used although any type of optical probe displaying several SDS could be adapted on the F-3000 module. Other teams had to develop their own device in order to combine DR and AF. Richards-Kortum et al. [25] developed their own spatially-resolved device combining DR and multiply-excited AF. They used a xenon arc lamp to provide broadband illumination, alone for DR, and combined with bandpass filters for AF spectroscopy. The spectroscopic acquisition sequence consisted in AF emission spectra from 16 different excitation wavelengths (in the 330–480 nm spectral range in 10 nm increments) and reflectance spectra acquired in approximately 2 min. Spatial resolution consisted in four different SDS: 250 µm, 1.1, 2.1, and 3.0 mm. Feld et al. [27] also combined multiply-excited AF (at 11 different excitation wavelengths on the 337–620 nm spectral range) and DR using a single SDS of 200 um. Tunnell et al. [31,32] combined Raman spectroscopy as a third modality of spectroscopy with DR and single-excitation AF (337 nm) measurements, at one single SDS of 200 µm. For this device, they used three light sources: a nitrogen laser for AF, a pulsed flash lamp for DR and an 830 nm-diode laser for Raman spectroscopy.
In previous studies using an optical bench developed to the level 3 of the TRL scale (TRL stands for Technological Readiness Level; this scale is described in the ISO 16290:2013 standard) and performed on a preclinical mouse skin cancer model [23,33,34], allowed us to validate the proof of concept: we demonstrated that the combination of information from AF and DR spectra acquired at three SDS allowed a 80%-rate of good classification when discriminating four histological classes (confusion matrix) whereas DR alone reached 65%, and AF alone 74%, of good classification rates respectively. These studies also demonstrated the interest of combining information from seven excitation peaks (on the 365–430 nm-spectral range) and from three SDS (271, 536 and 834 µm). The latter preclinical studies validated the diagnostic accuracy of the method, therefore encouraging us to develop and patent [35] a fully integrated device up to the level 7 of the TRL scale, compatible with clinical use and prone to industrial transfer.
In order to be tested in clinics, the so-called SpectroLive device underwent safety tests to ensure photobiological and electrical safety as well as electromagnetic compatibility. The safety checks process was supervised by the SD Innovation company which is certified by the GMED for ISO 13485:2016 (Medical devices—Quality management systems—Requirements for regulatory purposes). The GMED is one of the French notified and certification organizations in the field of health and medical devices. ISO stands for International Standard Organization.
The purpose of the current paper is to present the optical materials (some available off-the shelf and some specifically designed to match our expectations) used to make the SpectroLive device that allow the device to be sensitive enough to detect skin AF and be simple and fast enough to acquire a set of five AF and one DR spectra at four SDS in a clinically-compatible procedure. The following sections also describe the main optical features of the device, the type of calibration implemented into the software to allow spectra processing and the specific safety performances required to use the device in a clinical trial.

2. Materials and Methods

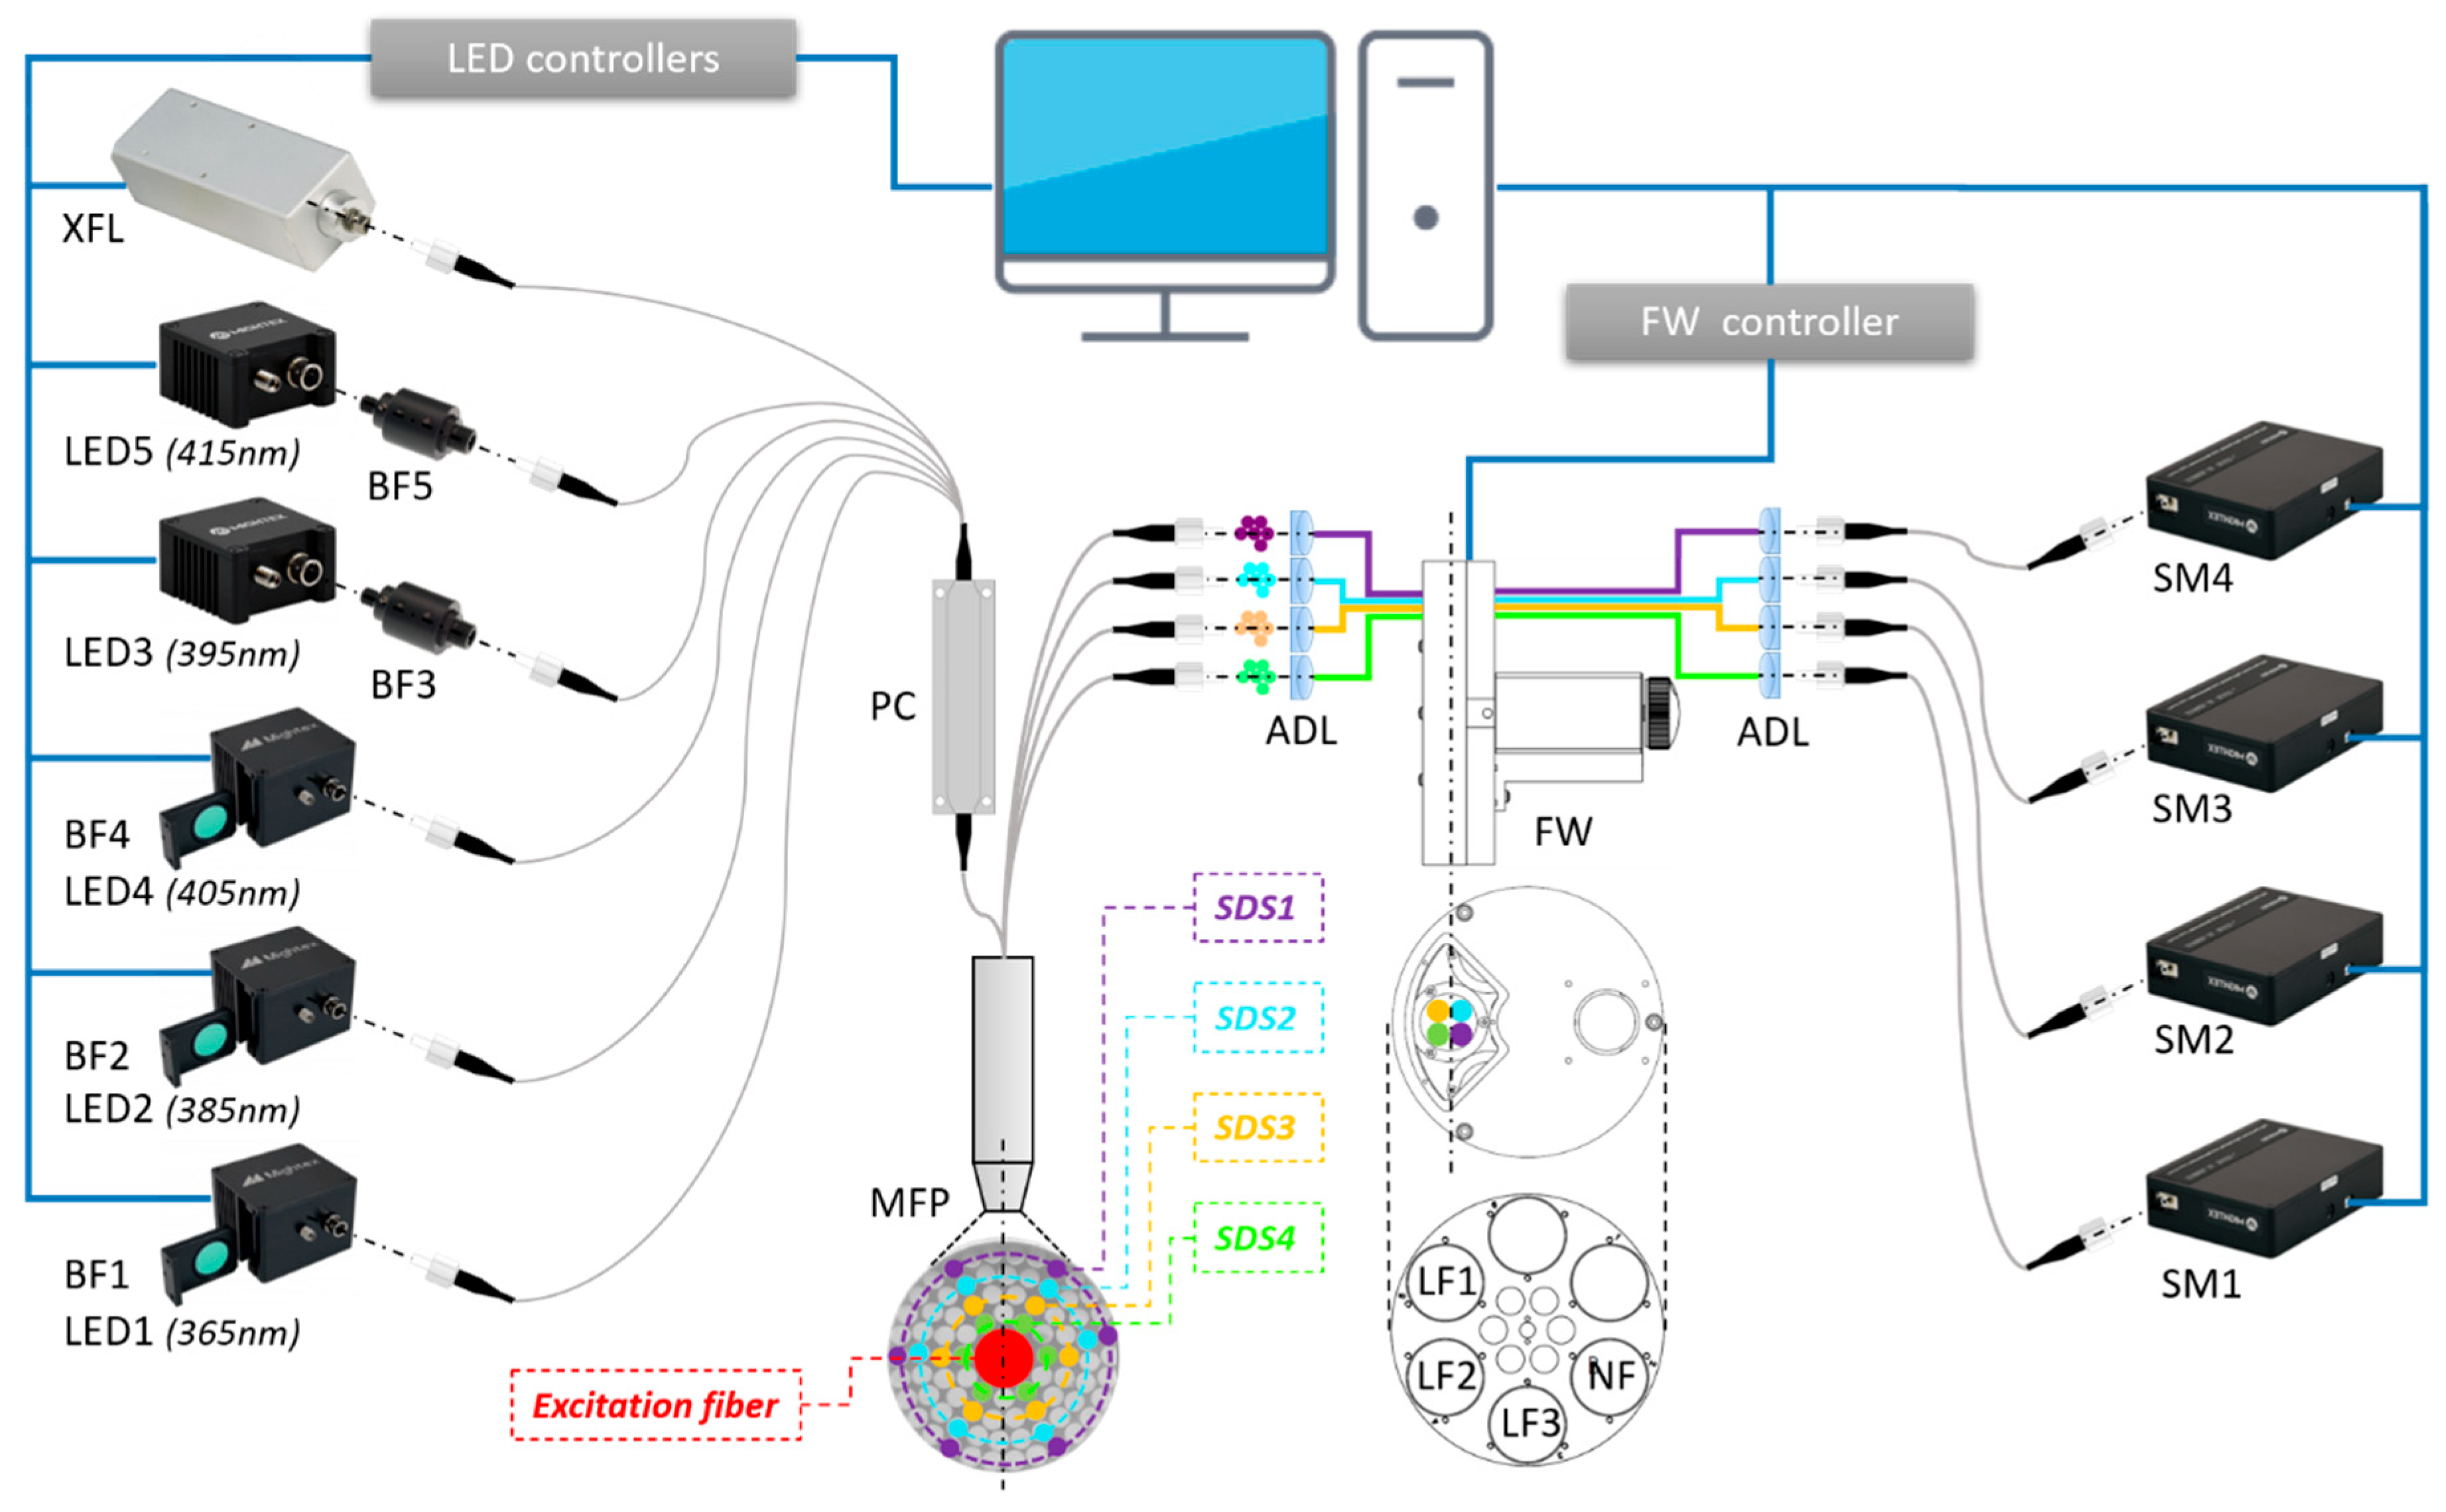
2.1. SpectroLive Spectroscopic Device

Figure 1 displays the general scheme of the SpectroLive device optical principle. Details and references of all constitutive components and materials are provided in the following sections.

2.1.1. Light Sources

Five High Power Fiber-Coupled (HPFC) LED modules (Mightex®) LEDi (i ∈ {1,..,5}) were used to deliver excitation peaks for AF measurements at excitation wavelengths: λexc = 365, 385, 395, 405, and 415 nm, respectively. Each of them was followed by an in-line band pass-excitation filter (BFi) in order to (i) block unwanted light at wavelengths away from the excitation wavelength λexc and (ii) ensure narrow-shaped peaks with Full Width at Mid-Height (FWMH) lower than 10 nm (Table 1). Three LED modules (LED1, LED2 and LED4) already included an integrated filter holder containing BF1 (FF01-365/2-25, Semrock®, Rochester, USA), BF2 (FF01-380/14-25, Semrock®, Rochester, USA), and BF4 (XHQA400, Asahi®, Woking, Great Britain), respectively. The two other LED modules (LED3 and LED5) were associated with an external in-line filter-holder (FH-INLINE, Avantes®, Apeldoorn, the Netherlands) on which BF3 (#65070, Edmund Optics®, Lyon, France) and BF5 (#65075, Edmund Optics®) were implemented. One 11035-14-01-xenon flash (Hamamatsu®, Massy, France) lamp was used to deliver broad-band (350–800 nm) white light for diffuse reflectance measurements.

2.1.2. Optical Probe

An optical probe (Figure 2) was bought from the SEDI-ATI®, Courcouronnes, France that was specifically designed to meet our requirements: all optical fibers are solarization-resistant optical fibers whose core is made of high-OH silica and numerical aperture is 0.22. Two hundred (200) µm-core diameter nude fibers are connected at one end to each of the six light sources: the six nude optical fibers are then merged at the other end into a single 600 µm-core diameter optical fiber by a power combiner (Alphanov®, Talence, France). Such a 600 µm-core diameter optical fiber is placed in the center of the probe tip (Figure 2b). Eighty-four (84) 200 µm-core diameter optical fibers are placed in fairly concentric rings around the excitation fiber; 60 of them are defined as “inactive fibers” used as wedges, while the other 24 are chosen as “active” fibers to conduct light from the skin to the spectrometers. The six fibers chosen on each ring are brought together in collection fibers connected to each spectrometer. The centers of the optical fibers of the first ring are placed at 400 µm from the center of the excitation fiber defined as SDS1. Second, third and fourth SDS rings correspond to SDS2 = 600 µm, SDS3 = 800 µm and SDS4 = 1000 µm, respectively. The total length of the probe is: 4.575 m for the excitation part (from the light sources to the optical probe tip) and 3.5 m from the optical probe tip to the spectrometers.

2.1.3. Detection Channels

Four HRS-BD1 spectrometers (Mightex®, Pleasanton, CA, USA) are used to acquire AF and DR intensity. The spectral resolution of the spectrometers depends on the spectral range of the spectrometer (Δλ = 317–789 nm), the slit width (Ws = 50, 100 or 200 µm), the number of pixels in the detector (n = 3648), and the pixel width (Wp = 8 µm). In order to deal with the decreasing amount of light entering the spectrometers while SDS increases, wider Ws were selected. The spectrometer SM1 to which the collection fiber corresponding to the shortest SDS (SDS1 = 400 µm) is equipped with a 50 µm-width slit resulting into a 1.7 nm-FWMH spectral resolution. Spectrometers corresponding to SDS2 and SDS3 are equipped with a 100 µm-width slit resulting in a 4.1 nm-FWMH resolution. The spectrometer corresponding to the longest distance SDS4 is equipped with a 200 µm-width slit (corresponding to a 9.7 nm FWHM-resolution). A high-speed motorized filter wheel (FW103, Thorlabs®, Maisons Laffitte, France) used with the T-Cube stepper motor controller (referred as FW controller in Figure 1, TST001, Thorlabs®) and the T-Cube 15 V power supply (TPS001, Thorlabs®, Maisons Laffitte, France) is placed on the optical path between the collection fibers and the spectrometers. The wheel was equipped with three long-pass filters (LFi) providing high-blocking (optical density greater than 6) of the excitation light:
  • LF1 (BLP01-364R-25, Semrock®) used to filter excitation from the 365 nm-LED;
  • LF2 (BLP01-405R-25, Semrock®) used to filter excitation from the 385, 395 and 405 nm LEDs;
  • LF3 (BLP01-442R-25, Semrock®) used to filter excitation from the 415 nm LED;
  • A neutral density filter (NF) is used for the diffuse reflectance measurement (using the white light source). The two remaining filter holder locations are left empty on the wheel.
As shown in Figure 3, all optical, electrical, and mechanical materials are integrated into a 600 × 647 × 1100 mm trolley (Norcan®) equipped with three trays (Figure 3b showing rear of the device) holding light sources (top shelf), spectrometers and filter wheel (second shelf), LEDs controllers (third shelf), computer (AMI311-970-3612, iBase®, Taipei, Taiwan) and electrical filter on the bottom shelf. Figure 3a displays the front view of the SpectroLive trolley showing tactile screen, keyboard and the pole holding the optical fiber probe. When it is not used, the optical probe end is set into a dedicated holder, placed on the right side of the trolley (Figure 3a). The holder contains the standard for diffuse reflectance calculation which is Spectralon target that, as a lambertian surface, isotropically reflects 99% of the incident light (SRS-99-010, Labsphere®, Poynton, Great Britain).

2.1.4. Spectra Acquisition Sequence

Before the spectroscopic acquisition sequence begins, the software controlling the acquisition spectroscopic sequence and the spectra recording requires to create a new file (or to open an already existing one) by specifying the name of the file. Once the file is created, additional information may be recorded like the patient’s gender and age, anatomical site of measurements, previous biopsy results, etc. Before starting the measurement on the patient’s skin surface, the software requires to acquire a spectrum using the white-light source on the reflection standard (SRS-99-010, Labsphere®, Poynton, Great Britain, UK): this reference spectrum is then used to calculate the DR spectra by performing the ratio of the spectra acquired on the skin surface (using the white-light source) by the reference spectra. Once such preliminary steps are done, the measurement on the patient’s skin surface may start.
The spectroscopic sequence 6 s-duration acquisition sequence allows to successively acquire six spectra, turning on alternatively the six light sources (LED controllers: SLC-CA04-MU, Mightex®, Pleasanton, CA, USA): LEDs emitting at 365, 385, 395, 405 and 415 nm then the white-light xenon flash lamp. The integrating time is set to one second (1 s) for each AF spectrum and 50 ms for the DR spectrum simultaneously recorded by the four spectrometers at the four SDS. The integration time was chosen as a trade-off between signal-to-noise ratio (SNR) and spectral resolution. A software option allows to acquire several sequences in a row. For our clinical study, this sequence is repeated three times in a row for each tissue site so as to improve the SNR by averaging these three spectra acquired in a row.

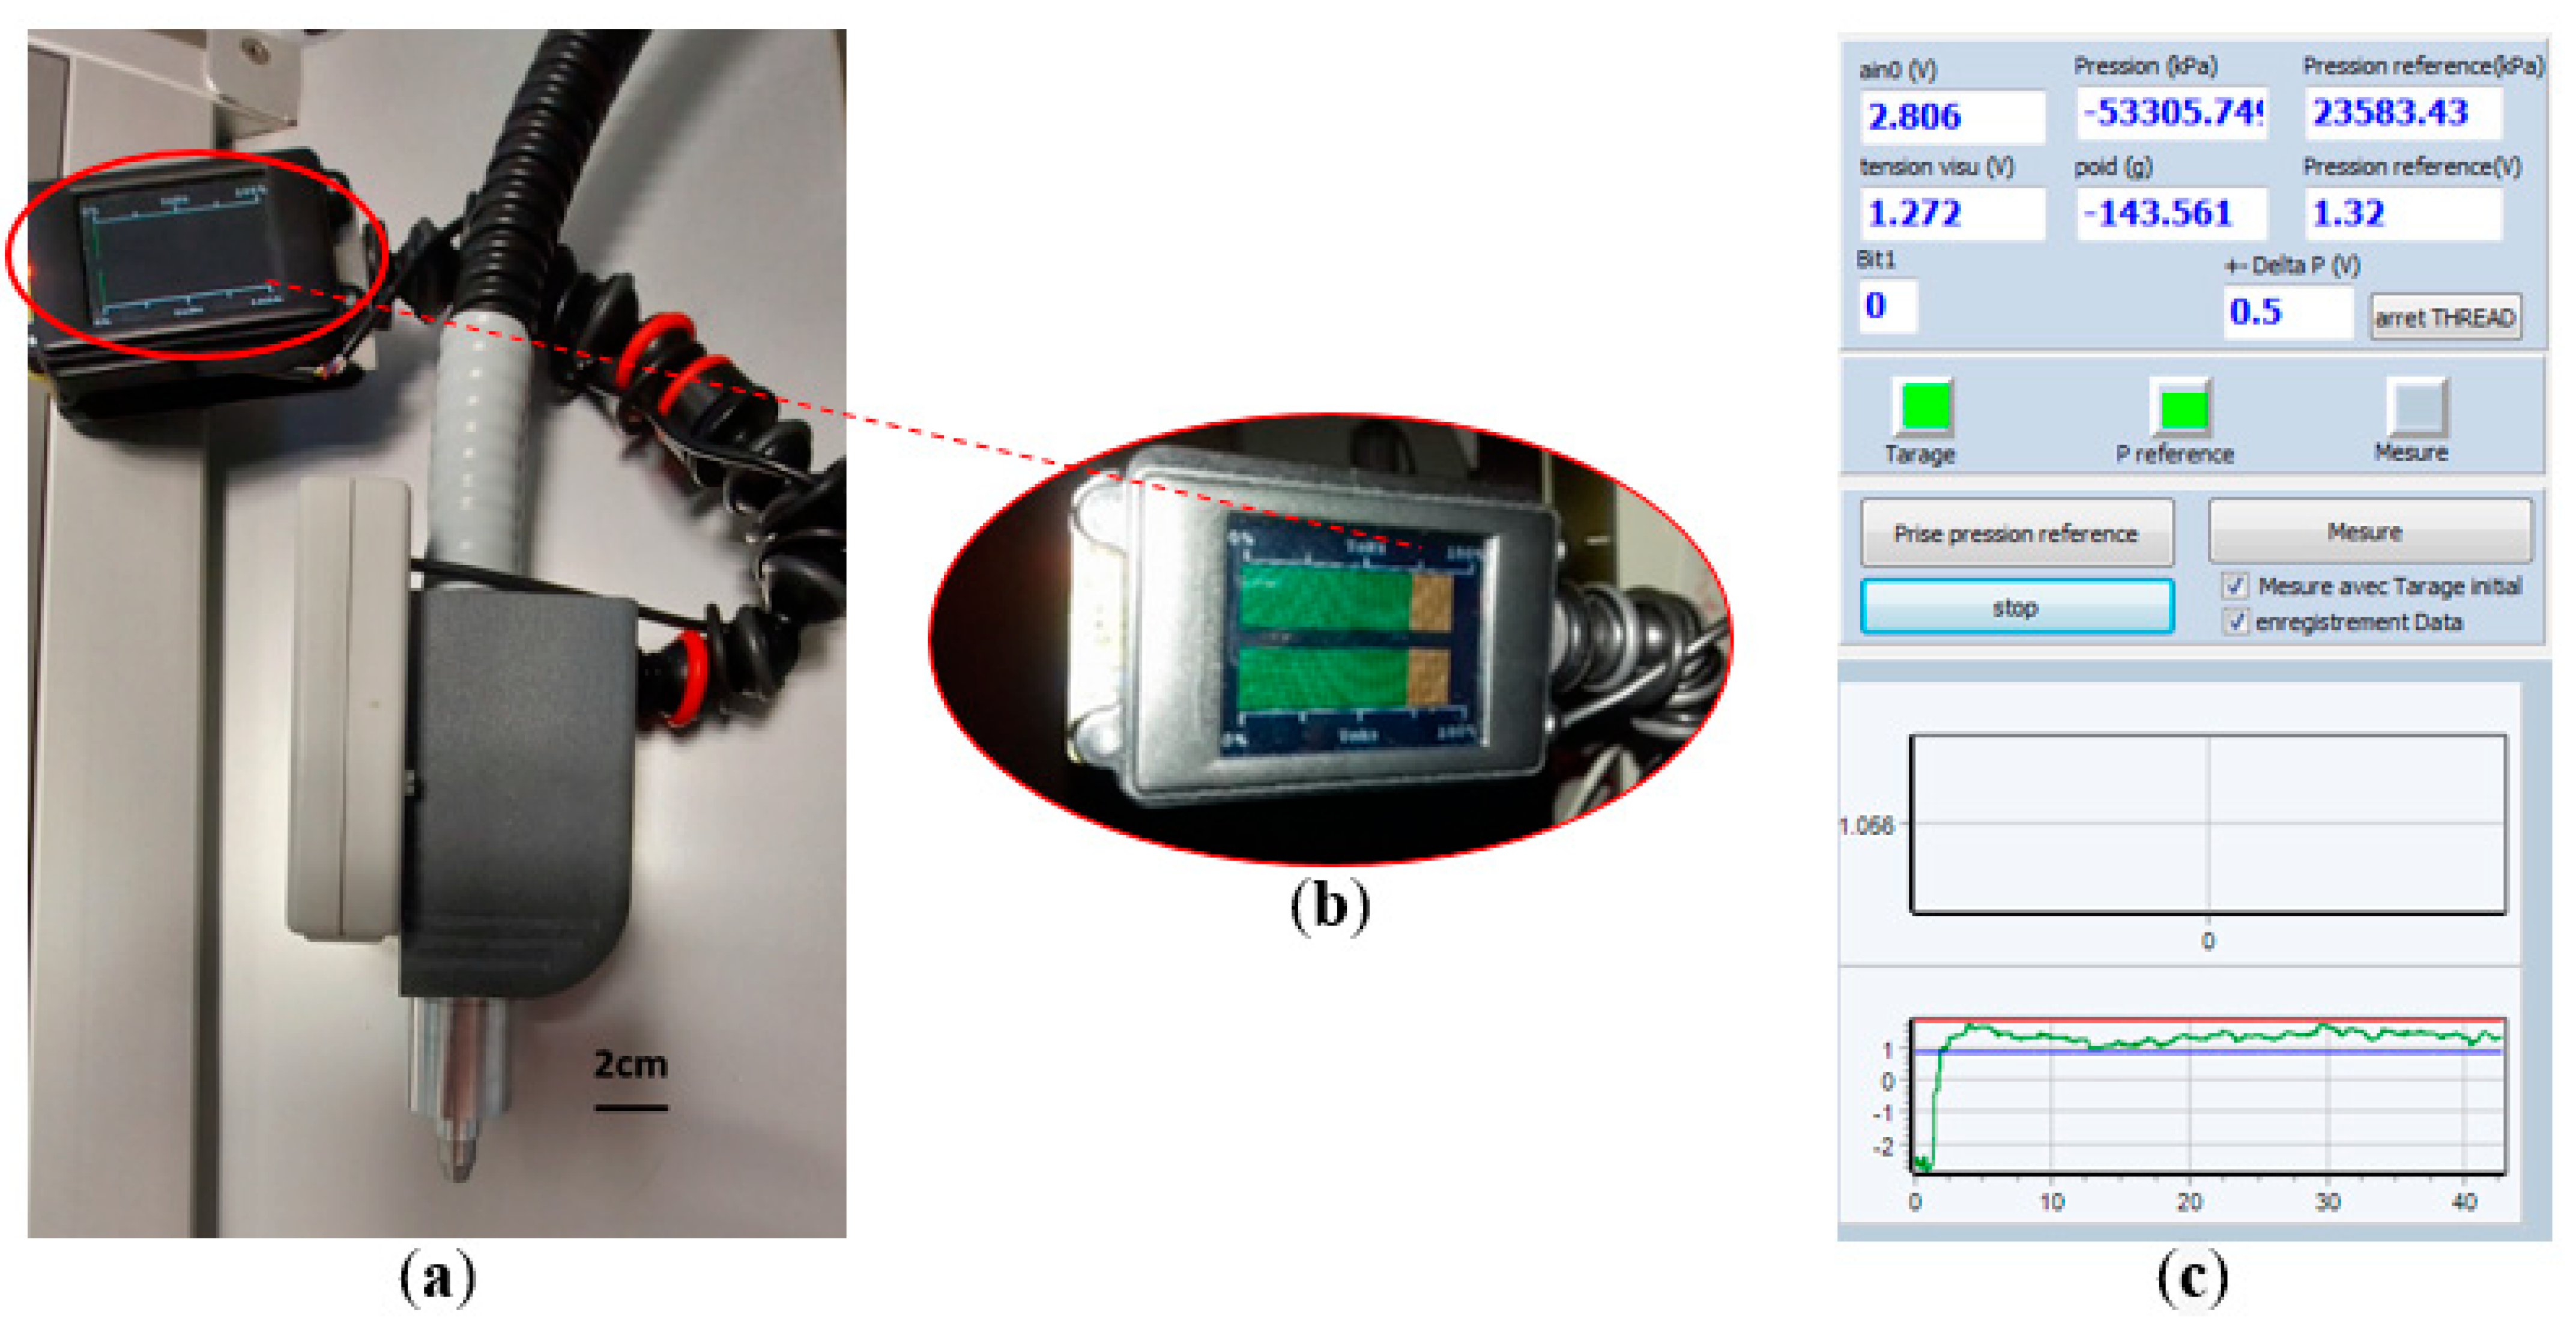
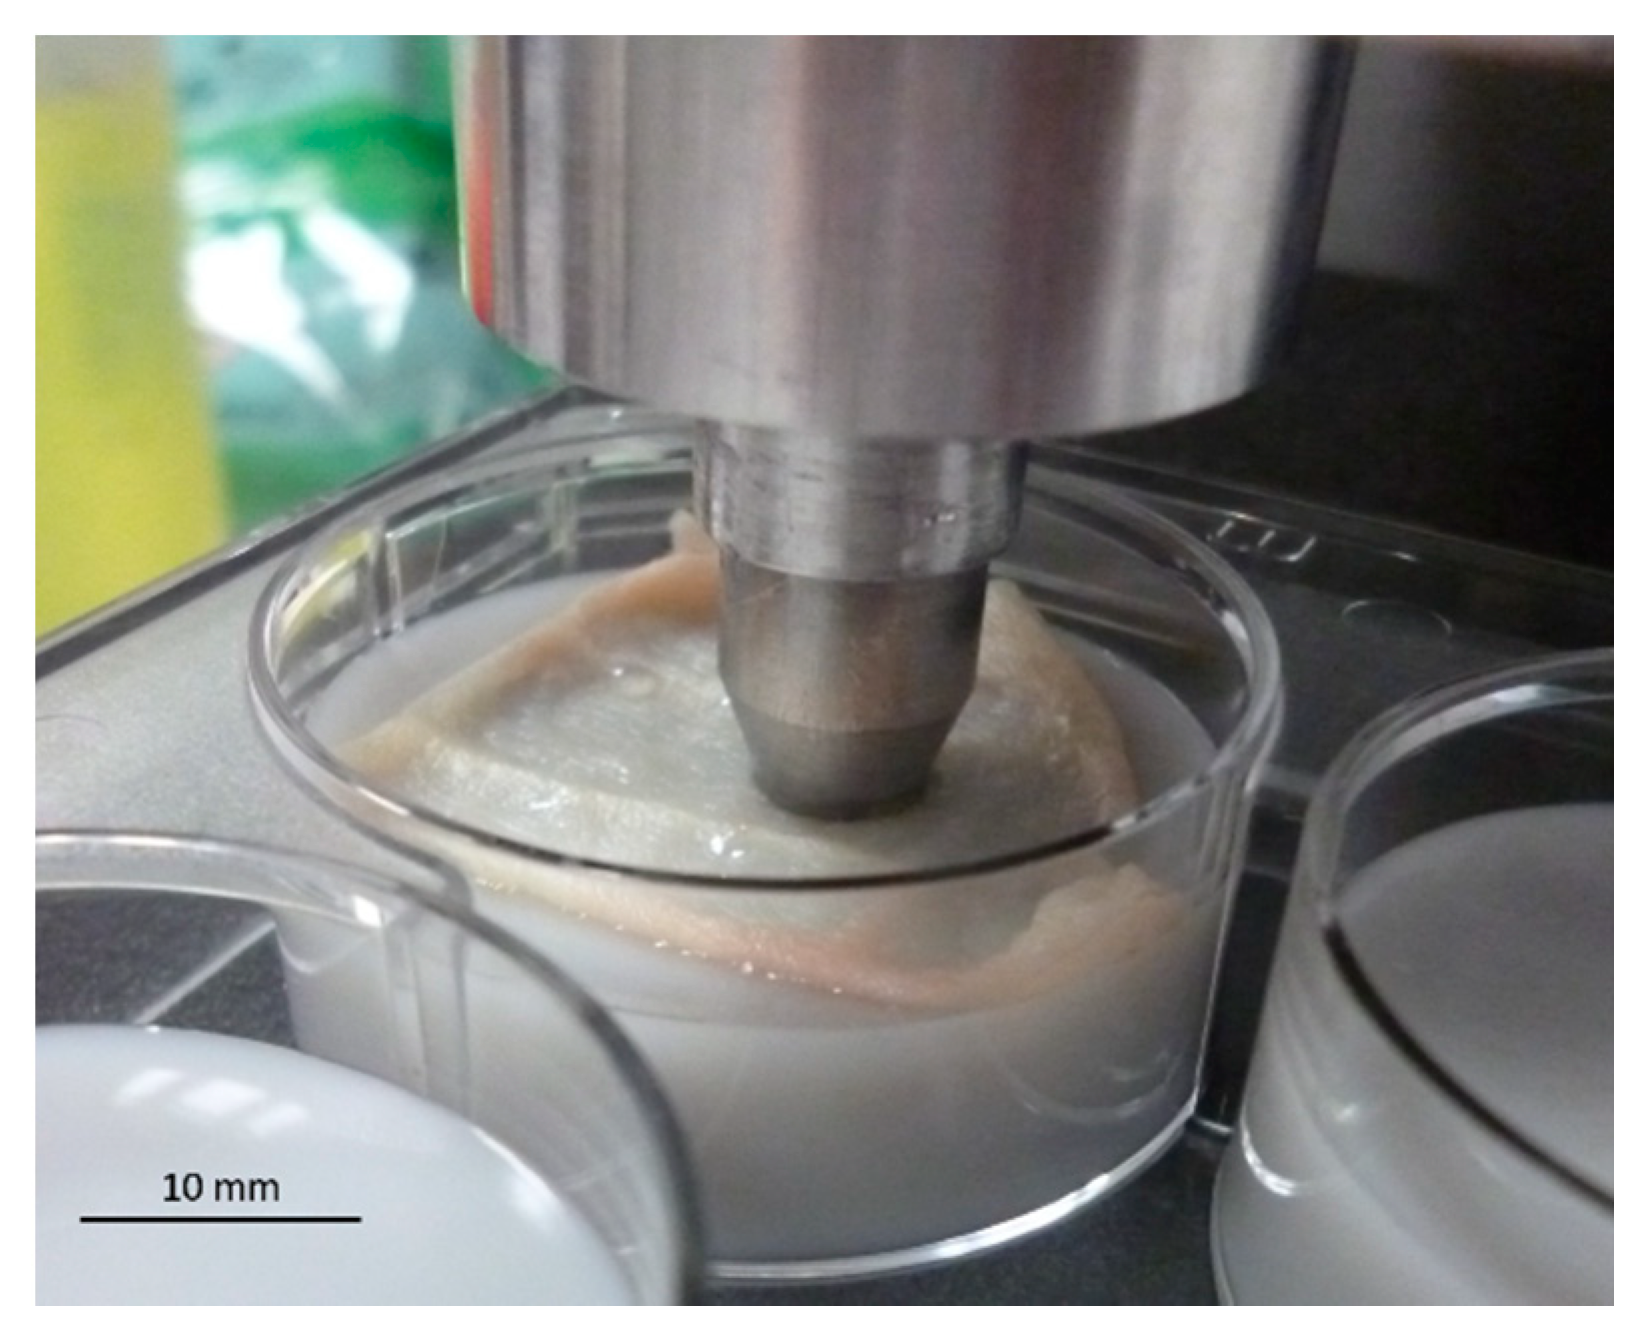
2.2. Probe Pressure Control Device

The impact on optical spectra intensity of (i) optical probe pressure and (ii) duration during such a pressure is applied on biological tissues has been investigated in the past few years on AF spectra alone [36], DR spectra alone [37,38] and on both types of measurements [39]. Although the range of pressure and durations investigated in these studies was rather broad, several key results can be recalled: (i) impact was meaningless when using low (lower than 3 N/cm²) pressure levels and short durations [36,37,38]; (ii) when high pressure levels [39] (0–4.8 N/cm² or 0–15.2 N/cm²) and long durations were applied, increased levels of intensity spectra was observed and mainly attributed to lower hemoglobin contribution to skin absorption. To check the impact of pressure and duration on the spectra intensity, we also developed our own device to and control the probe pressure during measurements on the skin surface.
In order to real-time monitor and record pressure levels applied at the probe tip on skin during the whole duration of spectra acquisition, a dedicated probe pressure control module (Figure 4a) was developed and implemented on the SpectroLive device. This device includes a force sensor with strain gauges (LSB200, FUTEK®, Irvine, CA, USA) featuring a measurement range of ±250 g and non-linearity <0.1% full scale.
The force sensor is sensitive to the weight of the entire device (ball trolley, measurement probe and cables associated), and a taring procedure is required for every measurement site depending on the orientation of the tissue/body. This phase consists of approaching the device as closely as possible to the measurement area by orienting the device in the same axis as the axis with which the measurement will be performed: if the cancerous lesion is on top of the patient’s head (vertex), the angle will be 0° (horizontal), on top of the patient’s forehead it will be 90° (vertical). The user validates the taring by pressing a validation pedal. The software allows the user to define a maximum (red line, Figure 4c) pressure and a minimum (blue line, Figure 4c) pressure not to be exceeded for the measurement to be validated. During the measurement phase, the user should apply the device with a pressure which must be within the pressure interval defined so that the measurement is validated. A screen (Figure 4b) fixed onto the probe pressure helps the user to check if the pressure remains with the correct interval (green bar graph, Figure 4b) or gets out of boundaries (see orange graph, Figure 4b).

2.3. Intensity and Spectral Corrections and Calibrations

2.3.1. Correction of the Spectral Attenuations throughout Optical Acquisition Channels

The back-reflected light which is collected by the optical probe at the tissue surface goes through all the optical components constitutive of each acquisition channel before being finally detected by the spectrometers. Hence, spectral attenuation results from the wavelength-dependent transmission features of the specific optical fibers, lenses, filters, and spectrometers composing each optical acquisition channels. The spectral attenuation (or spectral transfer function) needs to be identified then corrected for each optical acquisition channel. To do so, a calibration halogen-deuterium light source (DH 2000, Mikropack®, Ocean Optics®, Ostfildern, Germany) emitting an irradiance-calibrated intensity spectrum Ical(λ) was used to illuminate the multi-fiber optical probe tip. The corresponding intensity spectra Si(λ) were acquired with each SMi (i = 1, 2, 3, 4) corresponding to each SDS and therefore to each acquisition channel. The integration time was set to 50 ms for all spectrometers. Then, the spectral correction curves CSDSi(λ) for each acquisition channel SDSi were calculated as follows for every filter configuration of the filter wheel (FW = LFk, NF, empty):
C S D S i ( λ ) = S i ( λ ) I c a l ( λ ) | F W = L F k , N F , e m p t y
Once defined, these spectral correction curves were systematically applied in the preprocessing of every AF spectrum measured on tissues in order to provide spectrally fully corrected data sets.

2.3.2. Dark Noise and Background Noise Characterization and Correction

Dark-current refers to thermally generated electrons in the CCD array of each spectrometer, i.e., residual current observed in the absence of light. The latter leads to a positive offset of the measured intensity spectra which, is specific to each spectrometer. Consequently, this additional dark noise is to be measured then subtracted from the measured spectra. Background noise refers to residual photons collected by the spectrometers when SpectroLive excitation sources are all switched off, that originate from the surrounding external sources which could enter the optical acquisition channel (ambient light, signalization LEDs inside the device, etc.). Background noise is also to be corrected in the same way as for dark noise. Figure 5 shows the mean level of noise in photon counts (n = 5) characterizing each spectrometer used on the SpectroLive device. For each spectrometer, the level of noise was recorded when the entrance of the spectrometer was either “open” for background noise acquisition, i.e., each emission optical fiber was connected to its spectrometer, or “closed” for dark noise measurement, i.e., spectrometers entrances were blocked using black caps. The mean difference between background and dark noise over the four spectrometers is 364 counts (mean background noise is 1836 and mean dark noise is 1472). As expected, (the dark noise is included into the background noise) and as shown in Figure 5, for each spectrometer the background noise is statistically greater than the dark noise and more importantly for our data processing, the dark noise is statistically different from one spectrometer (minimum value is 1364 counts) to another one (maximum value is 1672 counts). This is taken into account for the data processing: the background noise is recorded before each spectroscopic acquisition on skin surface then subtracted from the raw spectra.

2.3.3. Light Sources Irradiance Characterization

In order to both (i) characterize the level of incident light required to detect AF and DR spectra within a clinically compatible time, and to (ii) post-process raw spectra, spectral irradiance of each excitation light source was measured at the optical probe tip using a spectroradiometer (Specbos 1211, Jeti®): the SpectroLive device optical probe tip was placed 2 mm away from the entrance diffusor screwed on the spectroradiometer. Five independent measurements were performed for each excitation light source: results shown in Table 1 are given as average values of such five measurements. Such measurements are complementary to the ones performed to check photobiological safety as described in the following section. Indeed, in the case of safety testing, measurements are performed in specific conditions as required by the EN 62471:2008 standard (e.g., at a 20 cm-distance from the light source) and provided on specific spectral ranges (near-UV, blue light, thermal).

2.4. Safety Tests

In order to allow clinical testing on humans, the French national agency for drug safety (Agence Nationale de Sécurité des Médicaments et des produits de santé, ANSM) and the ethical committee (Comité de Protection des Personnes, CPP) control that innovative medical devices respect the essential requirements from the 93/42 European directive. To do so, the SD Innovation company in charge of the safety controls of the SpectroLive device sent the device to the LCIE laboratory which is a CoFrAc-accredited laboratory to perform CE-marking tests (CoFrAc stands for Comité français d’accréditation, which means the French committee for accreditation). The LCIE laboratory performed three types of tests:
-
Electrical safety according to the EN60601-1:2007 standard entitled “Medical electrical equipment—Part 1: general requirements for basic safety and essential performance”,
-
Electromagnetic compatibility according to the EN60601-1-2:2007 standard entitled “Medical electrical equipment—Part 1-2: general requirements for basic safety and essential performance—Collateral standard: electromagnetic compatibility—Requirements and tests”.
-
Photobiological safety according to the EN 62471:2008 standard entitled “Photobiological safety of lamps and lamp systems”.

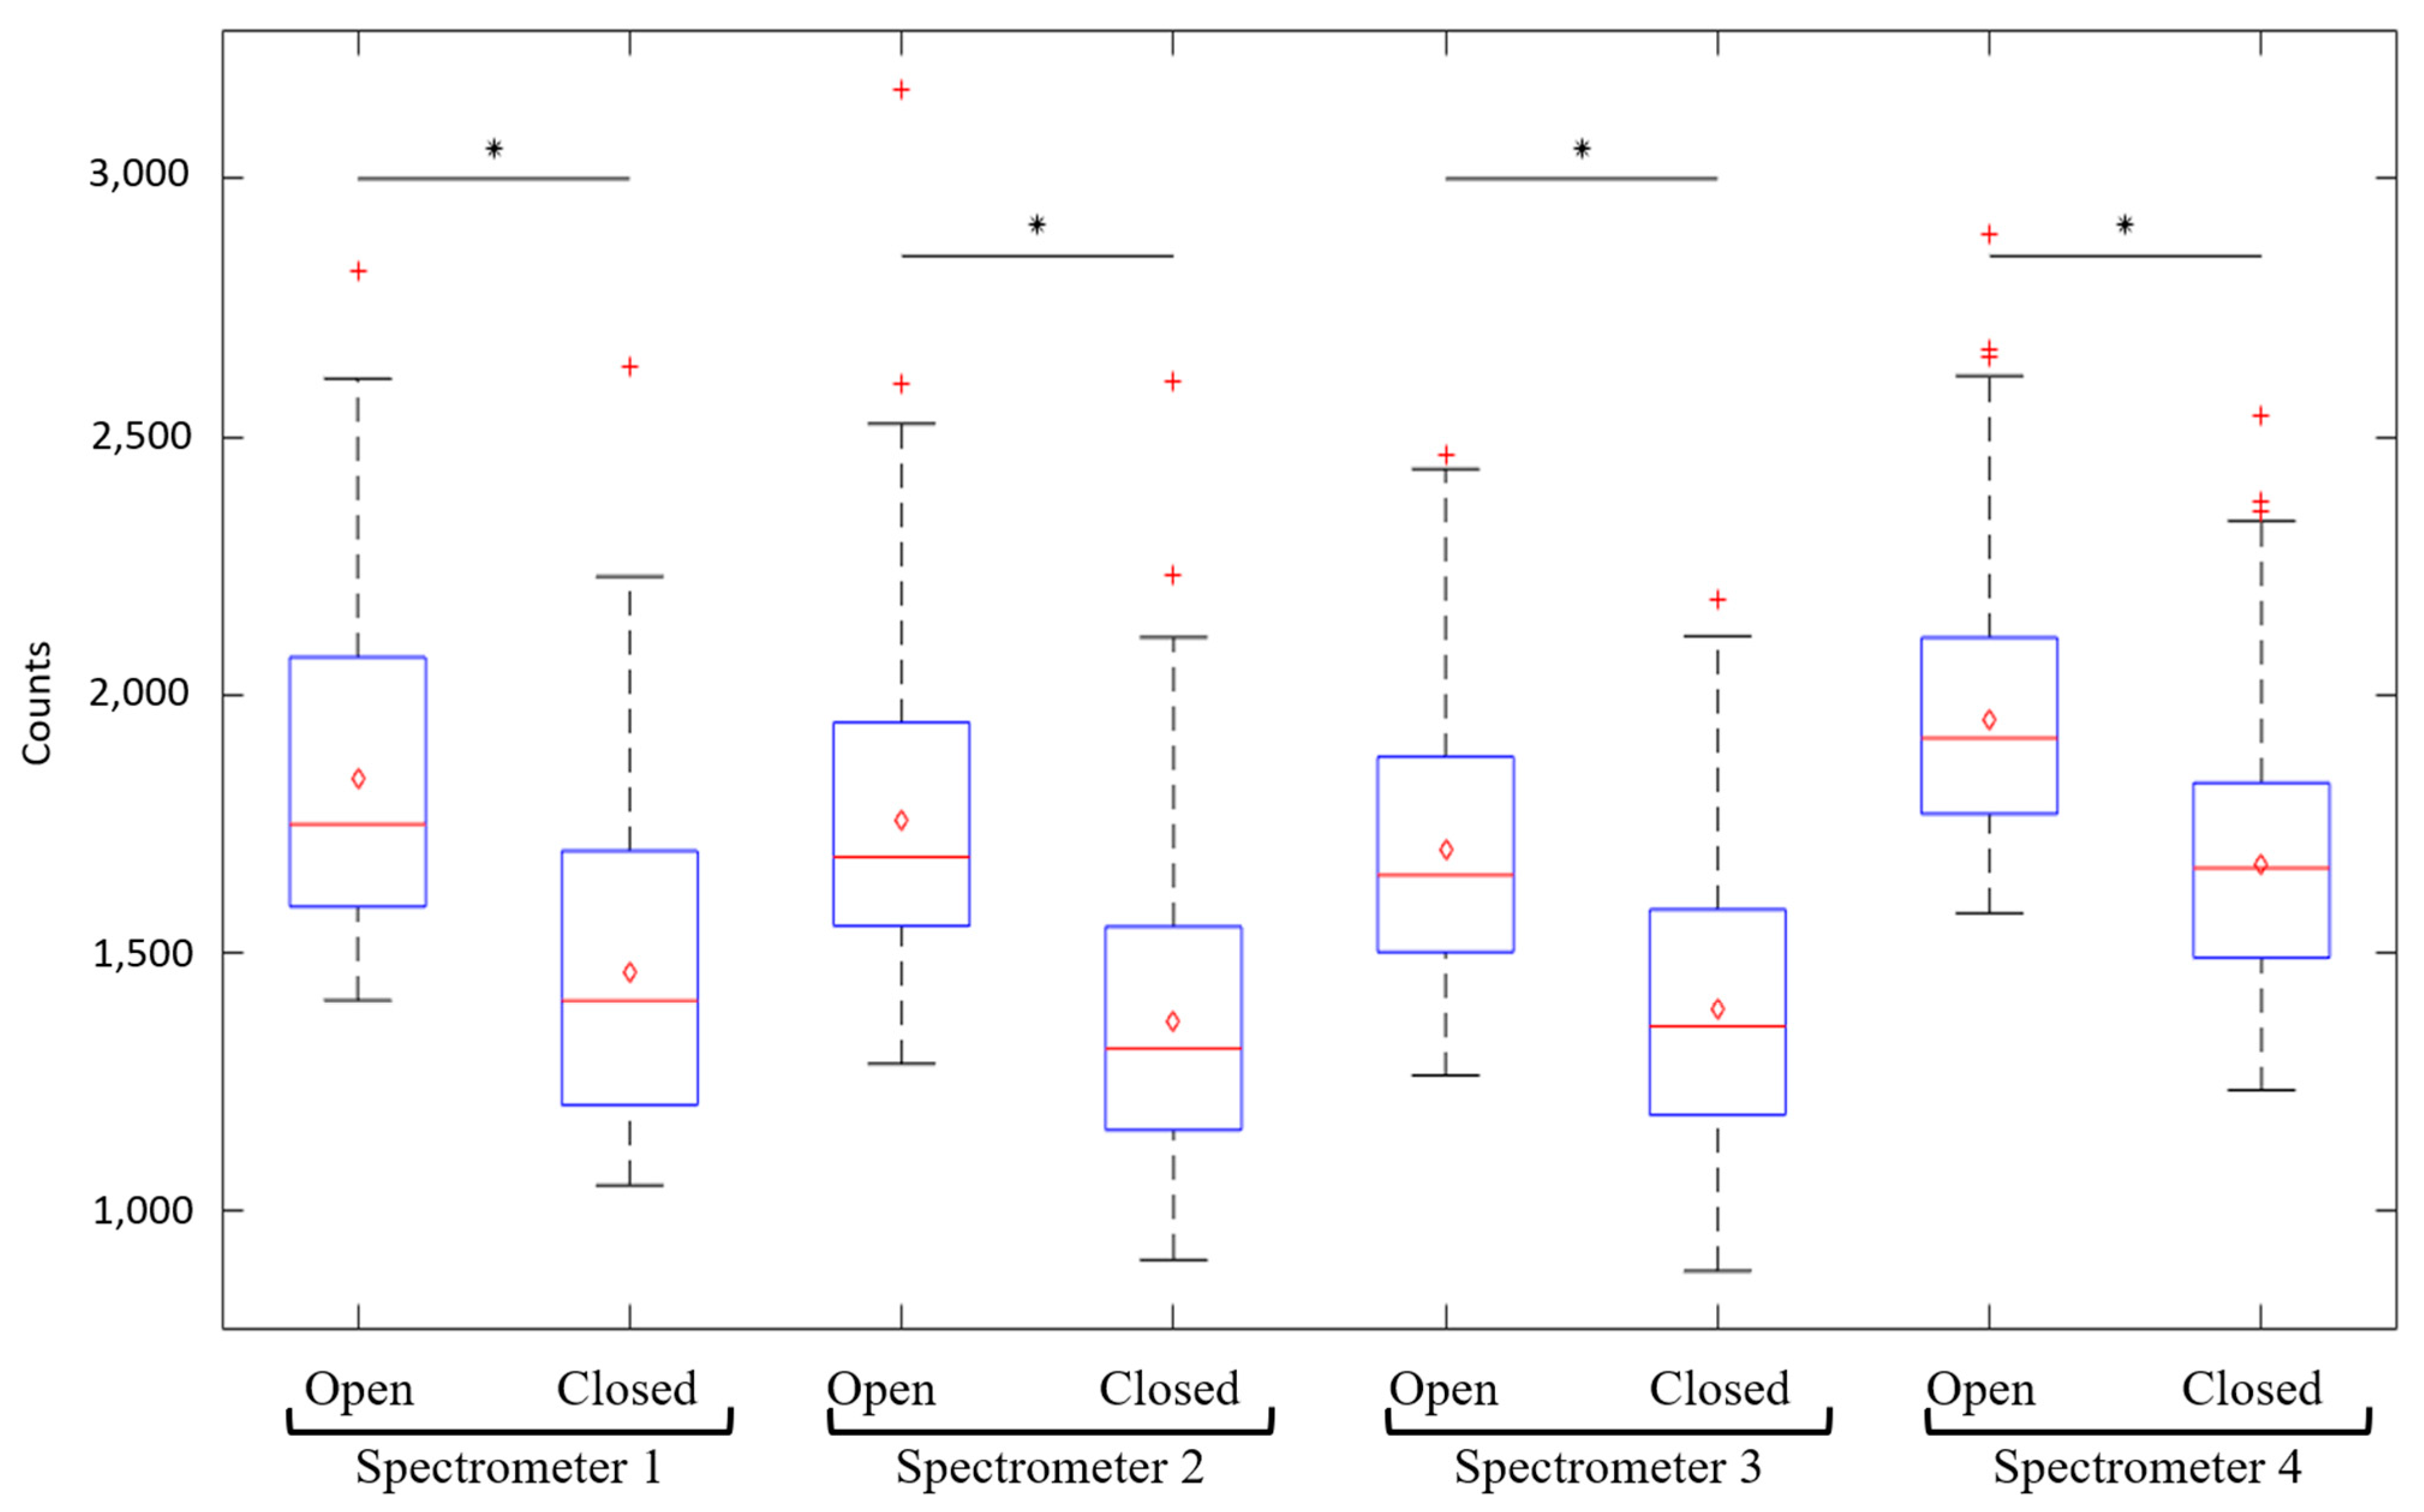
2.5. Depth Sensitivity Tests

Light propagation depth within biological tissues is a question often answered using simulation works [40,41,42]. We wanted to contribute to this issue from an experimental point of view and characterize the SpectroLive device more specifically not only from the photons propagation depth point of view but also from the device sensitivity to fluorophores buried at varying depths. To do so, we used an hybrid model first described by Vargas et al. [43]: fluorescent gels were made of agarose (1.5% weight/volume) enriched with 500 µM AGuIX® nanoparticles (NH TherAguix®, Meylan, France). AGuIX® nanoparticles are made of terbium (Tb) and porphyrin allowing high hydro-solubility of porphyrin in agarose. Porphyrin is a fluorescent molecule characterized by a maximum absorption at 405 nm and a double peak fluorescence emission at 660 nm and 725 nm. We chose this fluorophore because its fluorescence emission is outside of the skin autofluorescence spectral range (400–600 nm).
An ex vivo human skin sample was put on top of each of the ten gels made for this experiment. Skin samples were harvested ex vivo on skin wastes using an Acculan 3Ti Dermatome (Aesculap®, Chaumont, France) during aesthetic surgery (arm inner side lifting after massive body loss) and after agreement was obtained from the patient. Skin thickness was afterwards measured on histological slides using a conventional optical microscope. Authorization to use skin wastes for the current study was obtained from the INSERM Ethical committee, IRB 00003888 (opinion #17-400).
As shown in Figure 6, spectroscopic measurements were performed by putting the optical probe of the SpectroLive device in gentle contact with the skin sample on top of the fluorescent gel.

3. Results

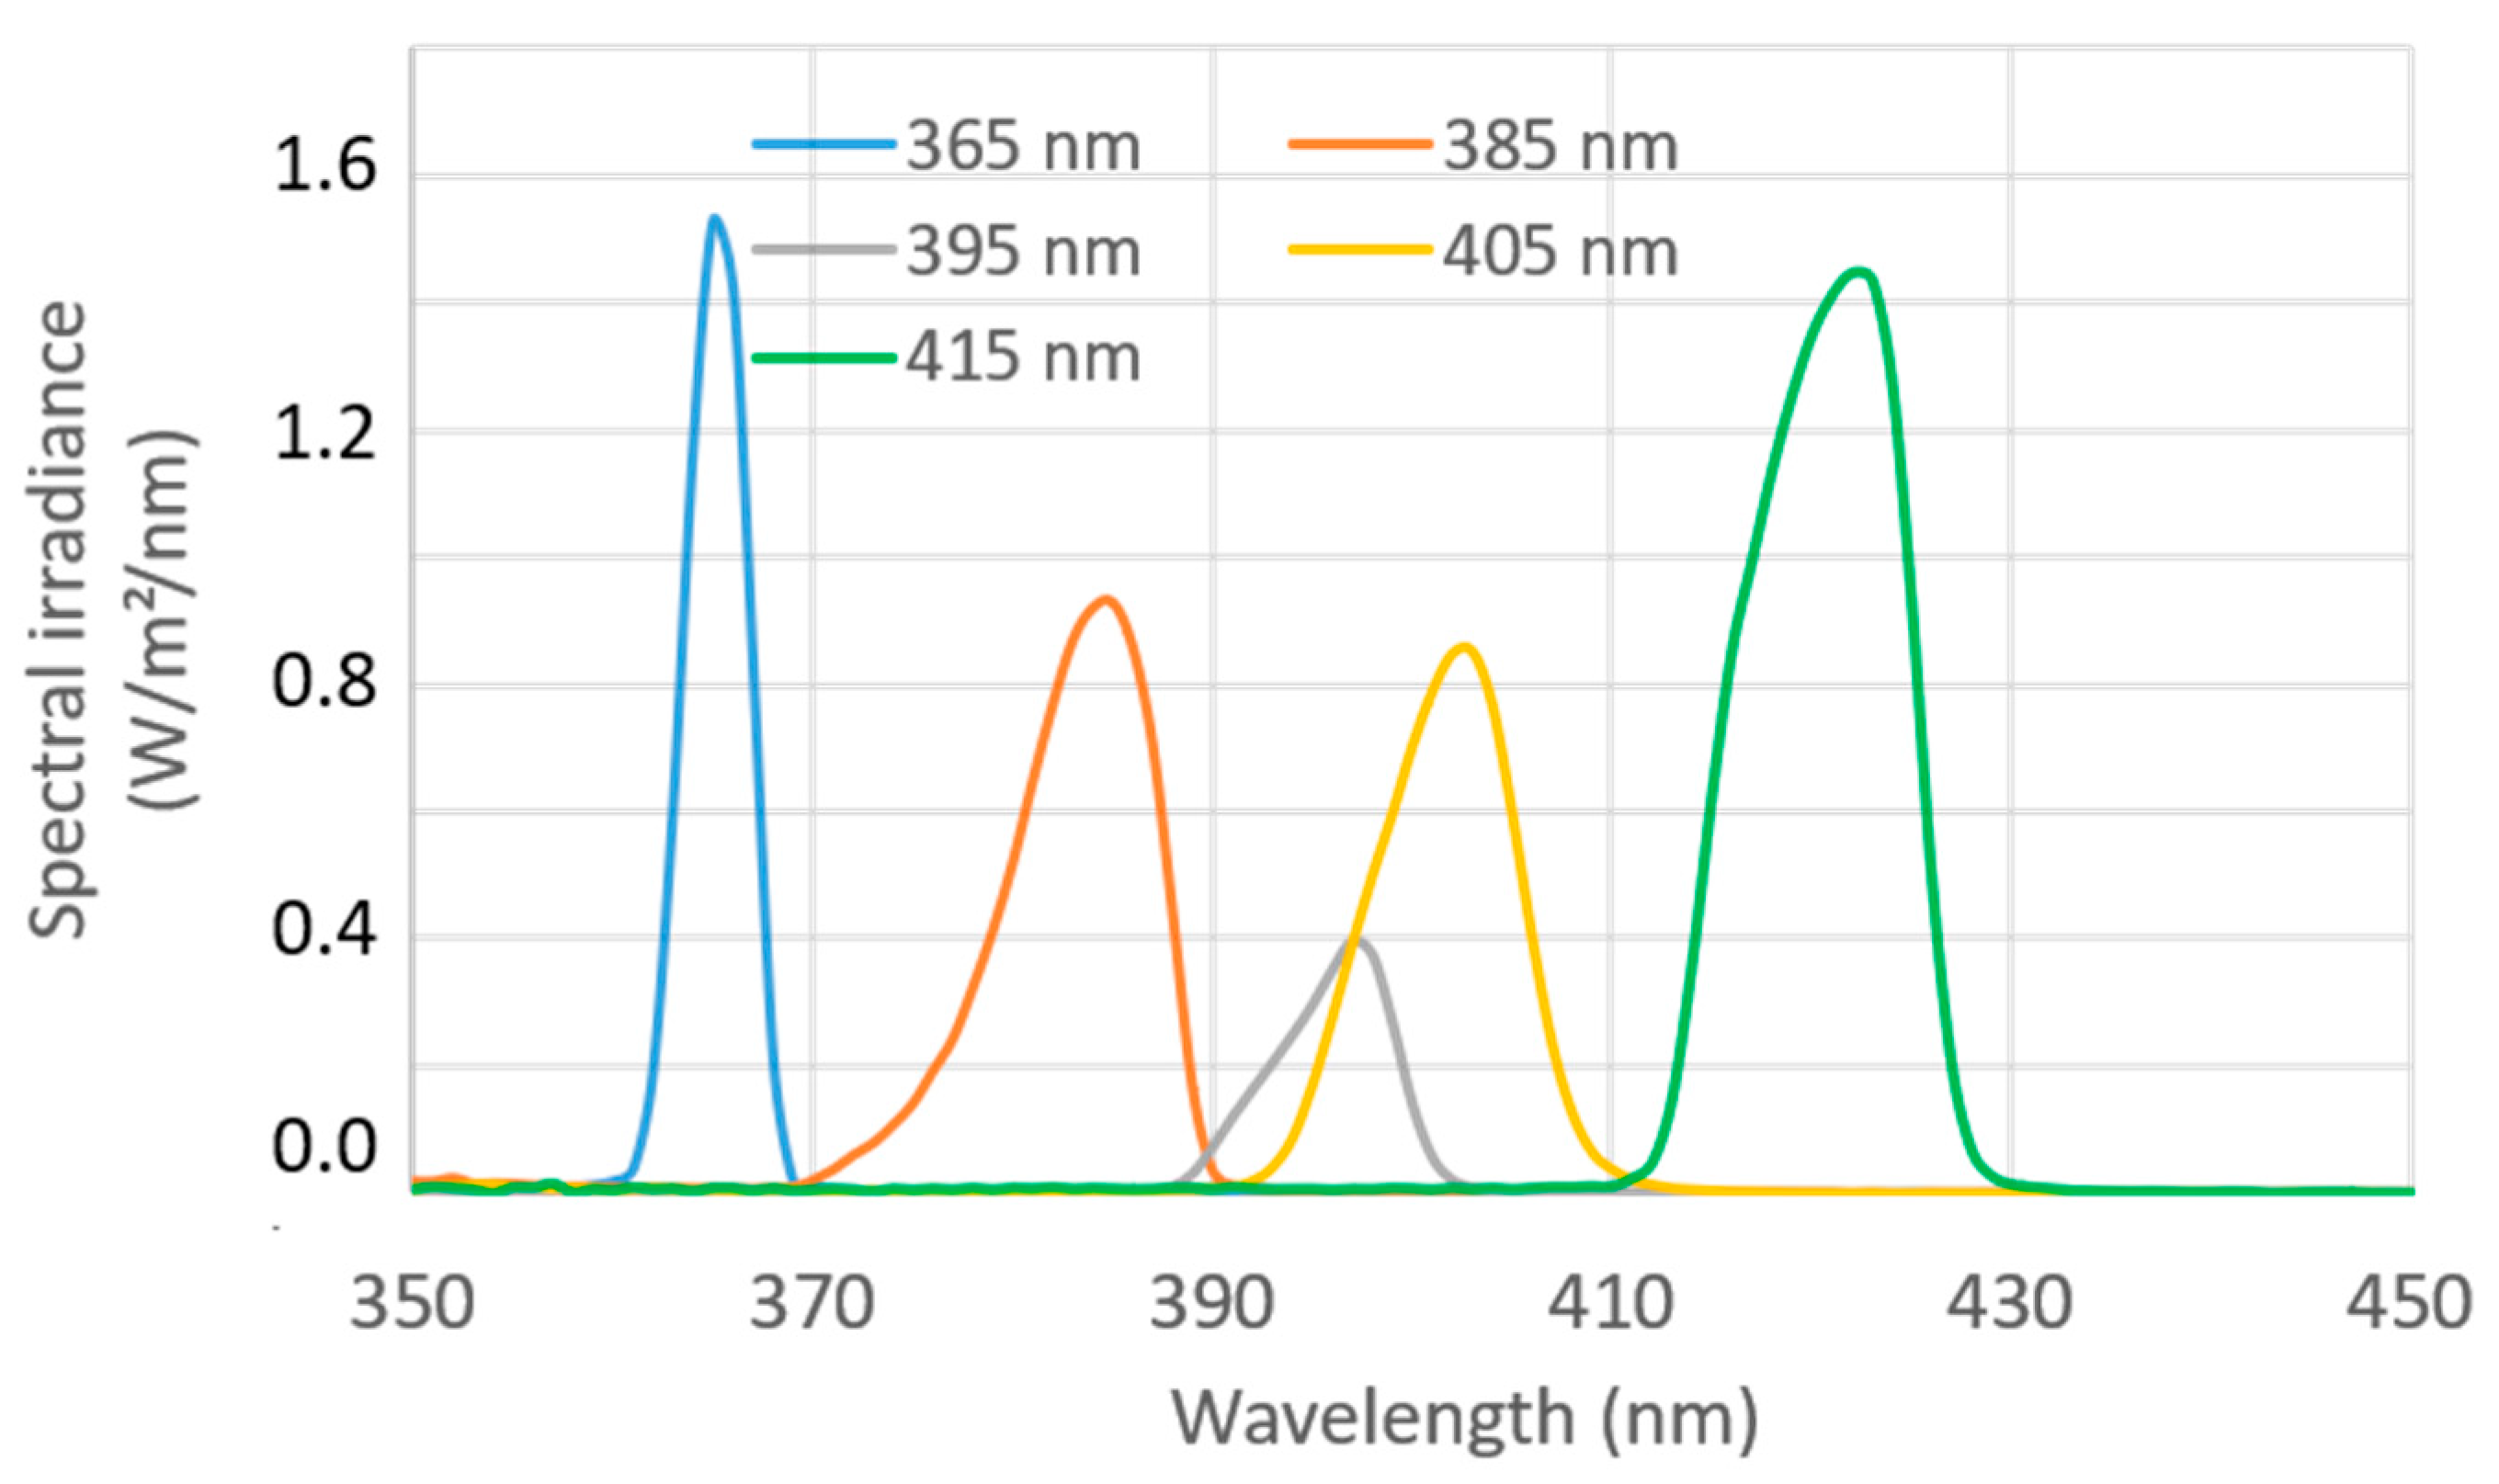
3.1. Excitation Spectral Irradiance of the SpectroLive Light Excitation Sources

Table 1 presents the values of the spectral irradiance measured at the optical probe tip for each light source used on the SpectroLive device. These values show that the irradiance of the light emitting from the optical probe tip of the SpectroLive device range from 2 to 11 W/m². Figure 7 displays the spectra of the LEDs used for endogenous fluorophores excitation. Such spectra show that the full width at half maximum (FWHM) ranges from 4 to 10 nm. Combined with the highly sensitive spectrometers that the SpectroLive device is equipped with, such irradiance levels are high-enough to excite endogenous fluorophores and detect their fluorescence emission and this, in a clinically-compatible duration time of 6 s for the entire spectroscopic sequence.

3.2. Safety Tests

3.2.1. Electrical Safety

The maximum impedance and current-carrying capability of protective earth connections measured on the SpectroLive device is 127 mΩ, which is below the maximum value of 200 mΩ. The leakage earth current also passed the test both in normal and single fault conditions: 1.750 and 1.8 mA, both below the maximum values authorized by the IEC60601-1 standard: 5 and 10 mA, respectively.

3.2.2. Electromagnetic Compatibility

The SpectroLive device displays levels of radiated and conducted electromagnetic emission conform to EN55011 limits: the measurements were performed in a semi-anechoic chamber. It also passed the tests of immunity to fast bursts. Immunity to electrostatic discharge was passed as well except for one single spot on the device shelf: the ethernet port. Even though this did not mean any hazard for the user nor for the patients, in order to make the device less vulnerable, we mechanically blocked the ethernet port.

3.2.3. Photobiological Safety

The IEC62471 standard provides a formula to calculate the time exposure limit for eye, skin or both in order to prevent burns and eye-injury. Then irradiance measurements were conducted by the LCIE laboratory in compliance with the specific procedures described in the standard text (e.g., at a 20 cm-distance). According to the irradiance measurements, each light source under test is then classified into a risk group from 0 (no risk, exempt group) to 3 (high-risk). Four LEDs (emitting at 365, 385, 395 and 405 nm) were classified as high-risk light sources (risk group 3), the LED emitting at 415 nm was classified in the low-risk group (risk group 1) and the xenon flash lamp in the exempt group (no risk, risk group 0). Knowing such irradiance levels, we then calculated the maximum irradiation time we can use on patients in order to avoid both mutagenic (actinic) and thermal (burns) effects. Because the user manual of the SpectroLive device mentions to avoid any eye exposure and to trigger light emission only when the probe tip is put in gentle contact with the skin surface, we took in account only the limits related to skin exposure. The maximum duration calculated for the LED that displays the maximum irradiance in the bandwidth called “actinic UV hazard for the skin and eye” (200–400 nm) is 30 s, which is way above the 1 s-exposure defined in our spectroscopic sequence.
The SpectroLive device has passed all security tests to allow safe spectroscopic measurements on patients in a clinical environment.

3.3. Spectral Correction and Intensity Relative Normalization

Figure 8 shows one example of a spectral correction curve (CSDSi for i = 1–4) for the DR measurement (FW = no filter) used to correct intensity raw spectra acquired by spectrometers SM1 (blue curve), SM2 (red curve), SM3 (yellow curve), and SM4 (purple).

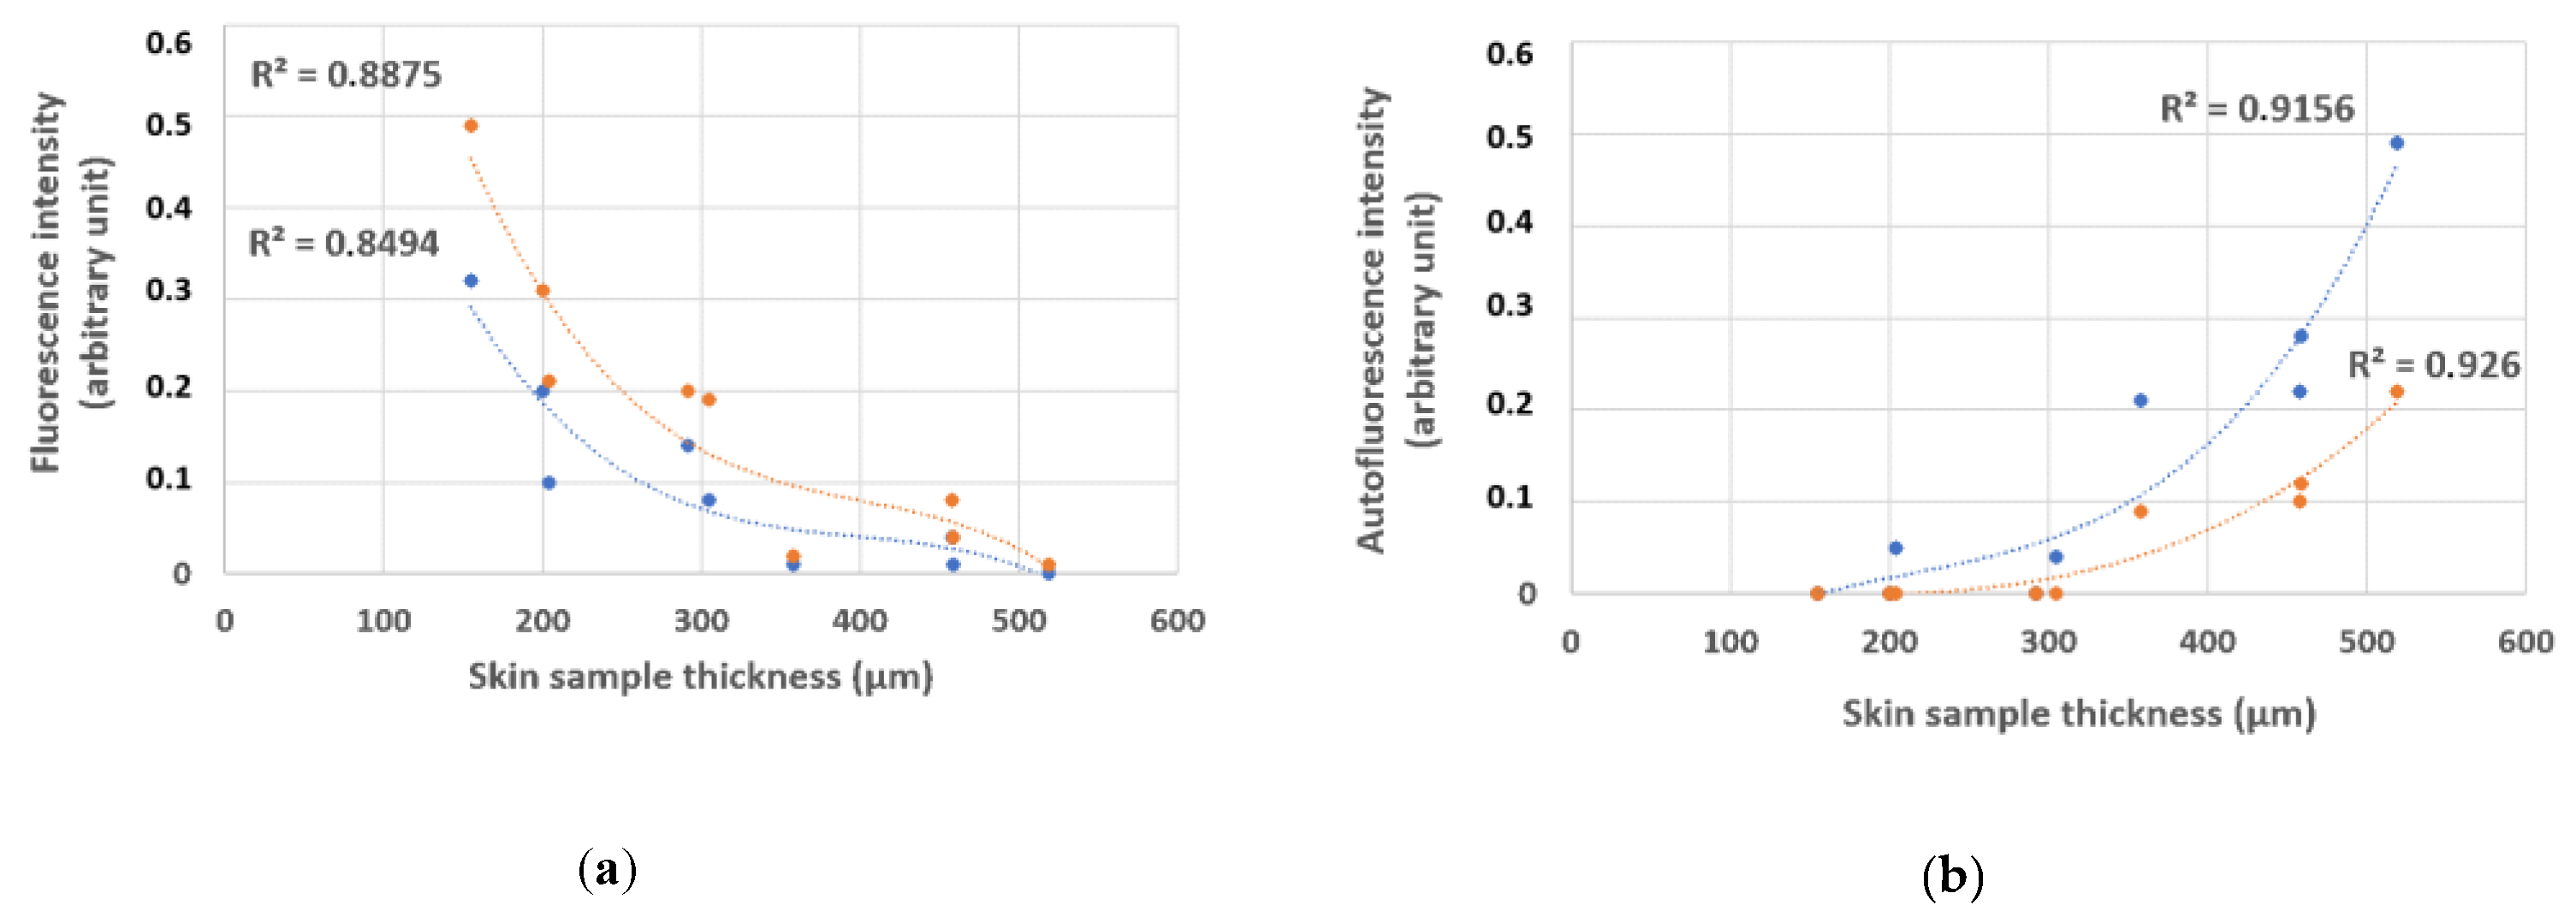
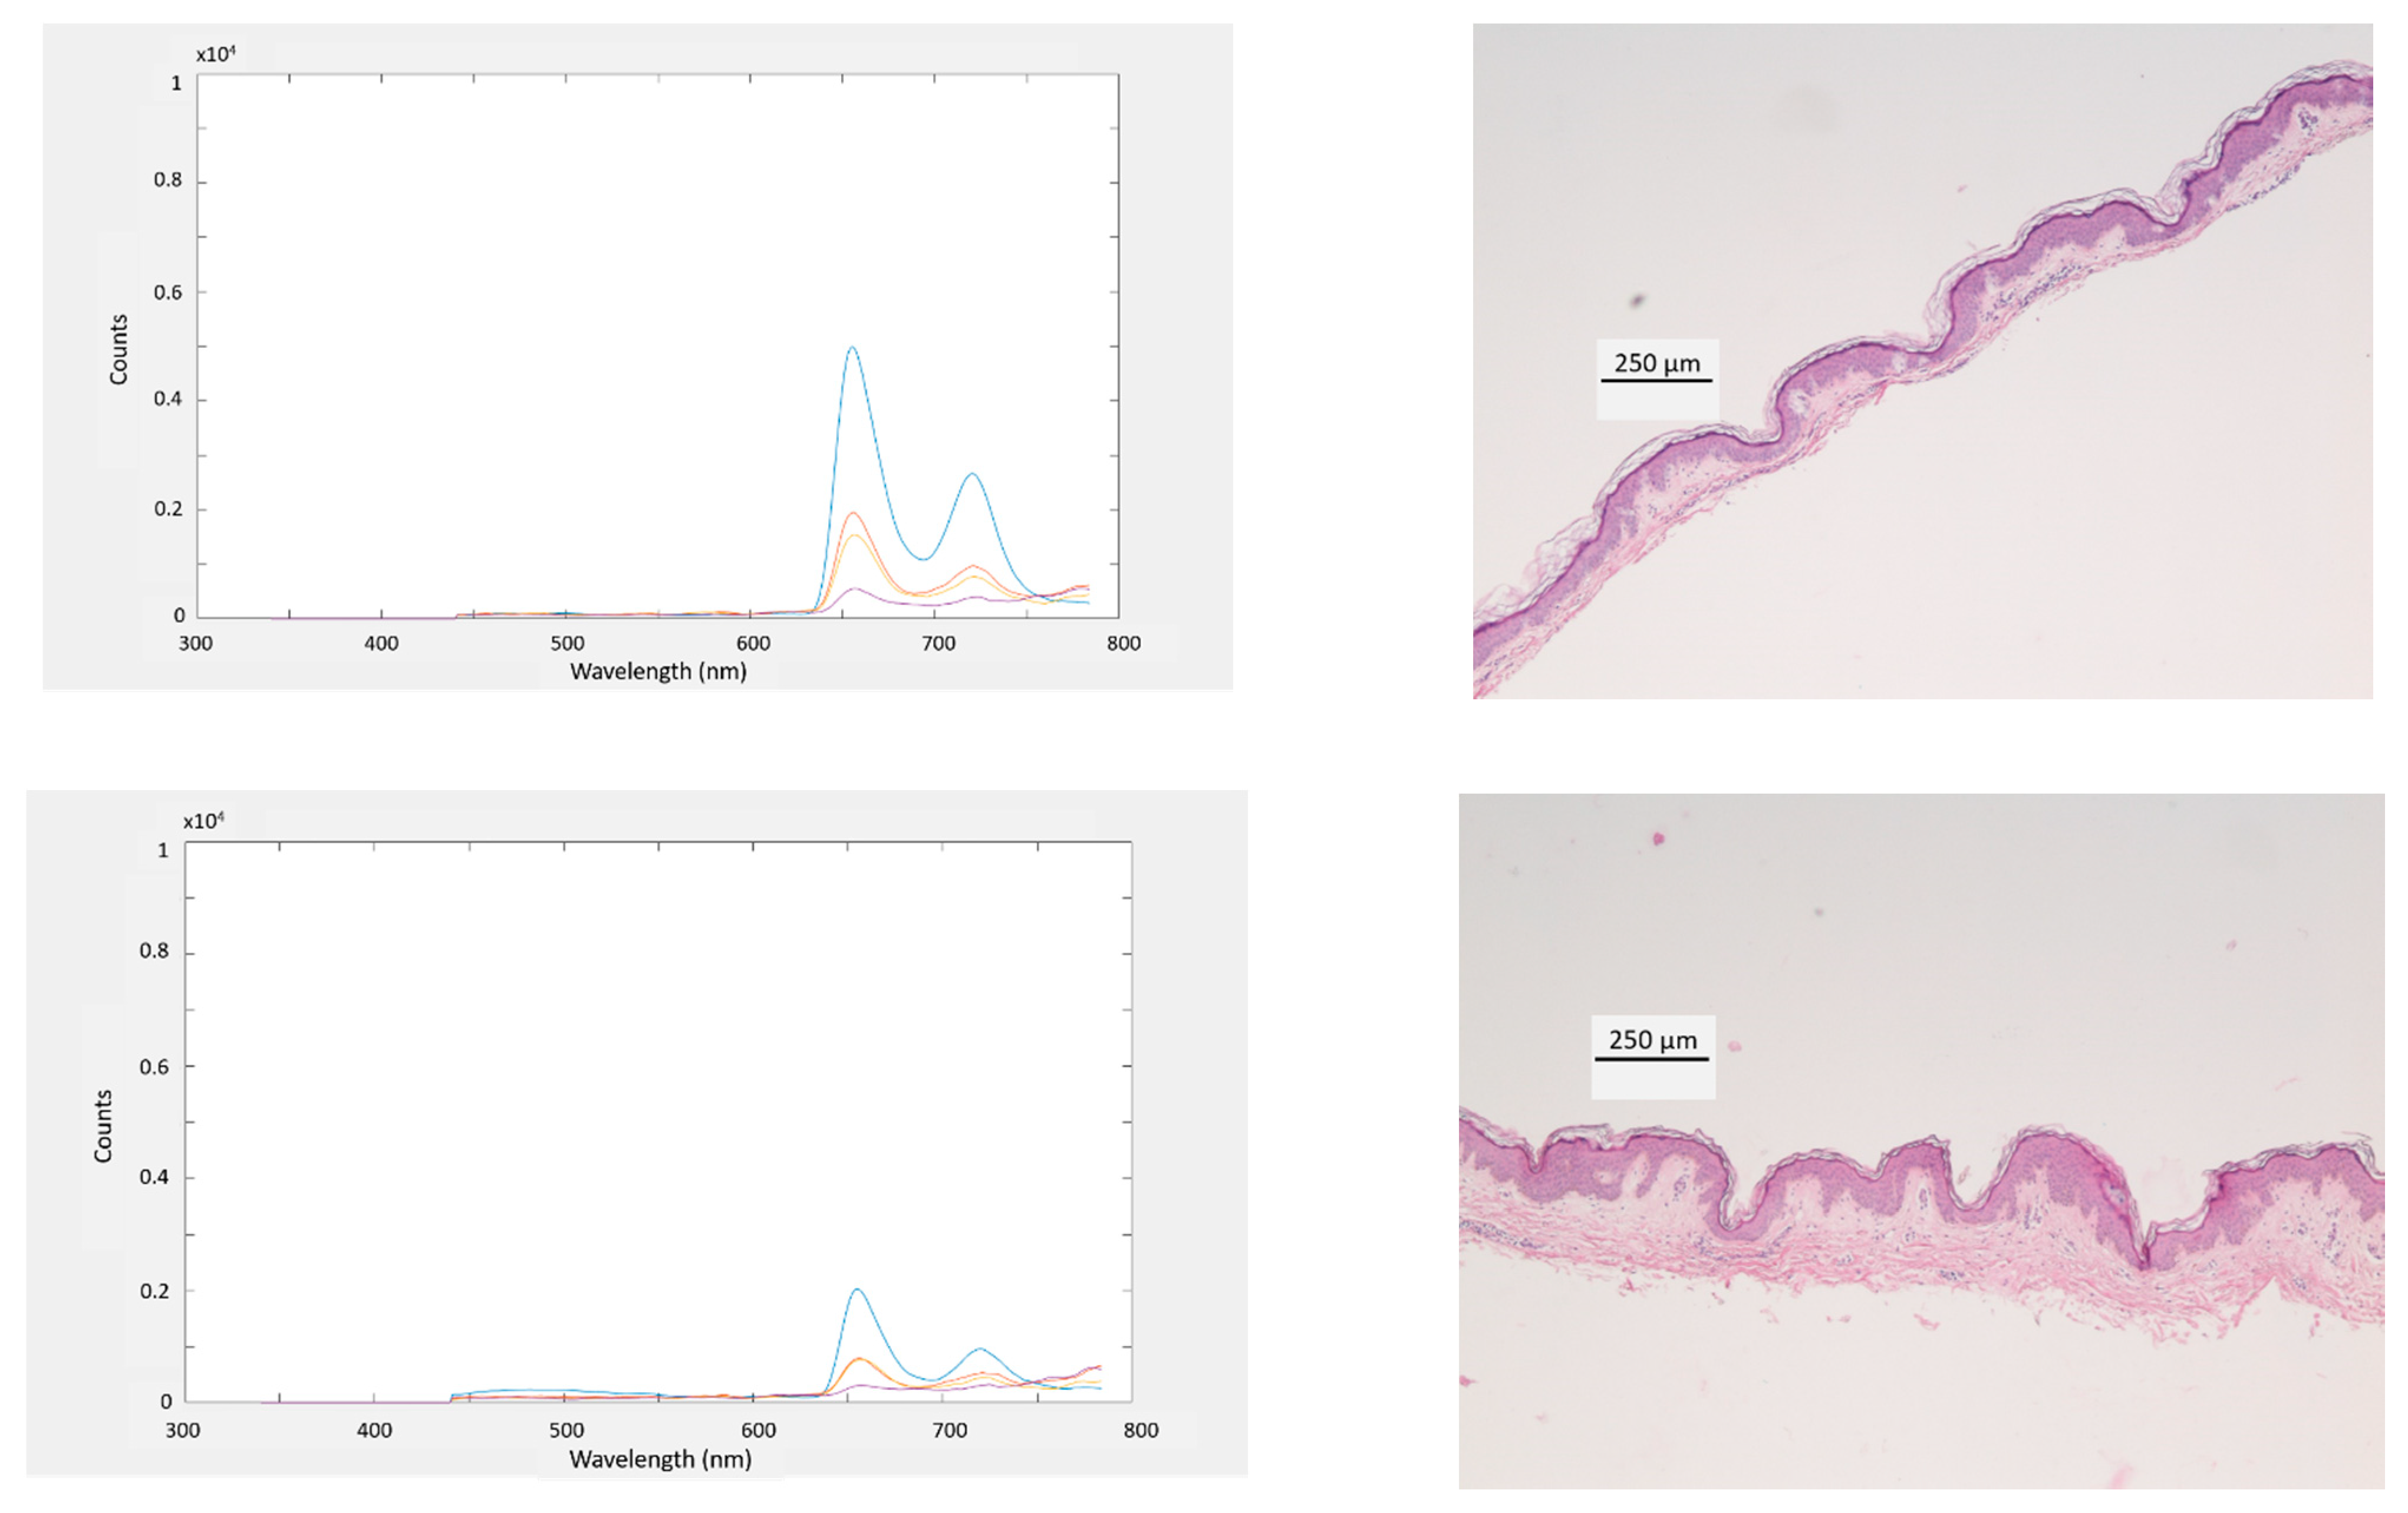
3.4. Depth Sensitivity of Fluorescence Measurement

Figure 9a displays the AGuIX nanoparticles fluorescence intensity measured by the SpectroLive device for two excitation wavelengths: 365 nm (bleu spots) and 405 nm (orange spots) according to the thickness of the nine different ex vivo human skin samples harvested for this experiment. Because the skin samples were manually harvested, the thicknesses are not evenly distributed: 155, 200, 204, 292, 305, 358, 458, 459 and 519 µm. Such thicknesses are mean values calculated from ten measurements made on pictures of histological slides taken with a conventional optical microscope. Corresponding spectra and histological slides pictures are shown for the 155, 305 and 519 µm-thick skin samples in Figure 10, first, second and third row, respectively.
We chose to display the results from two excitation wavelengths because the 405 nm excitation wavelength corresponds to the absorption maximum of the porphyrin fluorophore found in the AGuIX nanoparticles. Concerning the 365 nm excitation wavelength although it does not match with the porphyrin absorption maximum, we found interesting to display the corresponding results because it is the shortest wavelength that the SpectroLive device is equipped with and shorter wavelengths are supposed to probe biological tissues more superficially than longer ones. This way we could explore the minimum probing depth of the SpectroLive device.
The fluorescence intensity does not decrease linearly with the skin sample thickness: this may be due to the biological variability as melanin (which is a light absorber) is not exactly evenly distributed inside the skin cell layers and to the thickness measurement method. Although the mean thickness is calculated from ten measurements, the thickness varies along the skin sample.
Figure 9a shows that the fluorescence can be detected for thicknesses lower than 500 µm. For thicker skin samples, fluorescence from underneath the skin samples is no more detected. As expected, the fluorescence intensities measured for the 405 nm-excitation peak are greater than the ones measured for the 365 nm-excitation wavelength.
Although the skin autofluorescence measurements do not match the original goal of this experiment to quantify the SpectroLive device axial sensitivity, we chose to show the corresponding results (Figure 9b): although not linearly, the autofluorescence signal increases as the skin sample gets thicker.

4. Discussion

Because our research team was interested in transferring into clinics a spectroscopic device (in the form of a TRL3-optical bench) that had previously shown a good diagnostic accuracy on a preclinical mouse model for skin cancer differential diagnostic, we decided to develop the TRL7-SpectroLive device allowing to process spectral data recorded in vivo from six light excitations, at four SDS combining two spectroscopic modalities (AF and DR). Compared to the device developed by Tunnell et al. [24], the SpectroLive device does not propose Raman spectroscopy although it allows spatial and spectral resolutions whereas Tunnell’s device displays one single SDS and one single excitation peak for AF spectroscopy. Compared with the device developed by Richards-Kortum et al. [25], the SpectroLive device allows a shorter sequence acquisition duration (6 s for SpectroLive vs. 2 min) which makes it easier to be used for guided-surgery, especially if spectra must be acquired at several suspicious skin sites. Moreover, the SpectroLive device displays shorter SDS (four distances from 400 µm to 1 mm for the SpectroLive device vs. four distances from 250 µm to 3 mm) allowing a finer spatial resolution on the depth of interest: indeed, most cancers develop within epithelia, i.e., within the first 500 µm-depth lining biological tissues (skin, colon, esophagus, bladder, etc.). However, we do acknowledge the very interesting work performed by the Richards–Kortum team and their device finest spectral resolution displaying 16 excitation peaks for AF spectroscopy compared to the five excitation peaks available on the SpectroLive device.
Once the device was developed, we characterized its depth sensitivity by showing it could detect both skin AF (which is known to be a very weak optical signal) and fluorescence from a gel underneath a skin sample for a thickness up to 500 µm. The irradiance displayed at the tip of the SpectroLive optical probe ranges from 2 to 11 W/m², which is a good trade-off between photobiological safety and sensitivity to acquire a whole spectroscopic sequence within 6 s.
Several improvements will have to be performed on the SpectroLive device to optimize the spectroscopic measurements performed by the SpectroLive device. In order to improve the spatial resolution of the device, the next generation of the SpectroLive device should include a smaller core diameter excitation fiber (to replace the current one displaying a 600 µm-core diameter), into a smaller diameter-optical probe. This will cause problems to solve related to (i) injecting light from LEDs to smaller core-diameter optical fibers, and (ii) to merge fibers into a smaller one. Improving the current SpectroLive device will also imply to replace a few materials by up-to-date ones like spectrometers (i.e., more sensitive and more compact) recently released by the Hamamatsu® company to increase the signal-to-noise ratio on the longest (1 mm) SDS. Another improvement will be related to metrology and more specifically to light excitation checking to make sure light sources still emit at the same irradiance level and are not affected by peak wavelength shifting.
The work presented in this study aroused the interest of the medical community and of a plastic surgeon from the Metz-Thionville regional hospital especially. This surgeon agreed on evaluating its diagnostic accuracy on 140 patients with skin carcinomas or actinic keratoses. Because the device successfully passed safety tests, the French regulation authorities allowed the clinical trial to start. As the clinical trial is still ongoing, the first results should soon allow to evaluate its diagnostic accuracy.

5. Conclusions

Compared to the previous home-made-devices, the SpectroLive device allows a faster acquisition time of a full spectroscopic sequence composed of five AF spectra and of one DR spectrum all acquired simultaneously at four SDS which makes it convenient (fast enough) for clinical use. For the first time, our study (i) describes the safety performances of such a device allowing its clinical translation, and (ii) experimentally characterizes the depth sensitivity of the device (down to a 500 µm-depth), showing that it may be sensitive to dermis modifications (like elastosis [18]) due to carcinogenesis.
Besides providing details on the technical process for the SpectroLive device development and characterization, this paper aimed at giving details on the clinical translation of it. This made, if we want to see this innovative device spreading into clinical practices (both in private practices and in public hospitals), we have to combine two features: a high diagnostic accuracy on a precise medical indication and an acceptable cost. Medical devices that have proven diagnostic accuracy for skin carcinomas differential diagnosis whether they are based on optical spectroscopy (devices by DermDx, Verisante, MelaSciences or other companies) or on optical imaging (LC-OCT by Damae Medical, RCM by VivaScope or video-dermoscopy by Fotofinder, Horus or other companies) cost from EUR 50,000 to 100,000. Such high costs are partly responsible for the slow clinical spreading of optical devices. The final cost of the SpectroLive device will depend on its optimization in terms of optical components and on its target market (pharmacists, general practioners, dermatologists or surgeons) that will itself depend on its clinical indication. Such a clinical indication will be known after data from the current clinical trial are processed. It will depend on the type and on the number of histological classes it will accurately discriminate. The clinical aims to define the right indication and to reach a high diagnostic accuracy as well as the technical aim to lower the price of the device so it may spread into clinical practice are very challenging but very important to reach. Indeed, spreading to general population the improvement of diagnostic management of skin carcinomas that are increasingly prevalent [44] is at stake.

Author Contributions

Conceptualization, M.A. and W.B.; methodology, M.A., W.B., A.D. and G.K.; software, W.B. and A.D.; validation, M.A., W.B., A.D. and G.K.; formal analysis, M.A., W.B. and G.K.; investigation, G.K. and M.A.; resources, A.G. and F.M.; data curation, M.A. and W.B.; writing—original draft preparation, M.A.; writing—review and editing, M.A. and W.B.; supervision, M.A. and W.B.; project administration, M.A. and W.B.; funding acquisition, M.A. and W.B. All authors have read and agreed to the published version of the manuscript.

Funding

This research was funded by the Grand Est Region (SpectroLive project) and by the Metz-Thionville Regional hospital (2017 award for best clinical trial for the SpectroLive project).

Institutional Review Board Statement

Approval #17-400 from Comité d’Evaluation Ethique de l’INSERM (CEEI), Institutional Review Board 00003888.

Informed Consent Statement

Informed consent was obtained from all subjects involved in the study.

Data Availability Statement

The data presented in this study are available on request from the corresponding author. The data are not publicly available due to institutional privacy.

Acknowledgments

Authors acknowledge staff from the Metz-Thionville Regional Hospital for technical support: nurses from the Surgery room for the dermatome management used for skin samples resection and technicians from the Anatomopathological department for making histological slides. Authors also thank patients who gave their consent to allow the use of skin wastes resected from them during aesthetic surgeries. AGuIX® nanoparticles used for this experiment were given by the NH TherAguix® company (Pr. Olivier Tillement, ILM, Lyon1-CNRS) and kindly provided by Pr. Muriel Barberi-Heyob (CRAN).

Conflicts of Interest

The authors declare no conflict of interest.

References

  1. Stratigos, A.; Garbe, C.; Lebbe, C.; Malvehy, J.; del Marmol, V.; Pehamberger, H.; Peris, K.; Becker, J.C.; Zalaudek, I.; Saiag, P.; et al. Diagnosis and Treatment of Invasive Squamous Cell Carcinoma of the Skin: European Consensus-Based Interdisciplinary Guideline. Eur. J. Cancer 2015, 51, 1989–2007. [Google Scholar] [CrossRef]
  2. Grillone, G.A.; Wang, Z.; Krisciunas, G.P.; Tsai, A.C.; Kannabiran, V.R.; Pistey, R.W.; Zhao, Q.; Rodriguez-Diaz, E.; A’Amar, O.M.; Bigio, I.J. The Color of Cancer: Margin Guidance for Oral Cancer Resection Using Elastic Scattering Spectroscopy. Laryngoscope 2017, 127 (Suppl. 4), S1–S9. [Google Scholar] [CrossRef]
  3. Borisova, E.; Pavlova, P.; Pavlova, E.; Troyanova, P.; Avramov, L. Optical Biopsy of Human Skin - A Tool for Cutaneous Tumours’ Diagnosis. Int. J. Bioautomation 2012, 16, 53–72. [Google Scholar]
  4. Yaroslavsky, A.N.; Feng, X.; Yu, S.H.; Jermain, P.R.; Iorizzo, T.W.; Neel, V.A. Dual-Wavelength Optical Polarization Imaging for Detecting Skin Cancer Margins. J. Investig. Dermatol. 2020, 140, 1994–2000. [Google Scholar] [CrossRef]
  5. Cabrera, R.; Recule, F. Unusual Clinical Presentations of Malignant Melanoma: A Review of Clinical and Histologic Features with Special Emphasis on Dermatoscopic Findings. Am. J. Clin. Dermatol. 2018, 19, 15–23. [Google Scholar] [CrossRef] [Green Version]
  6. Dubois, A.; Levecq, O.; Azimani, H.; Siret, D.; Barut, A.; Suppa, M.; del Marmol, V.; Malvehy, J.; Cinotti, E.; Rubegni, P.; et al. Line-Field Confocal Optical Coherence Tomography for High-Resolution Noninvasive Imaging of Skin Tumors. J. Biomed. Opt. 2018, 23, 106007. [Google Scholar] [CrossRef] [Green Version]
  7. Fraga-Braghiroli, N.; Grant-Kels, J.M.; Oliviero, M.; Rabinovitz, H.; Ferenczi, K.; Scope, A. The Role of Reflectance Confocal Microscopy in Differentiating Melanoma in Situ from Dysplastic Nevi with Severe Atypia: A Cross-Sectional Study. J. Am. Acad. Dermatol. 2020, 83, 1035–1043. [Google Scholar] [CrossRef]
  8. Yélamos, O.; Manubens, E.; Jain, M.; Chavez-Bourgeois, M.; Pulijal, S.V.; Dusza, S.W.; Marchetti, M.A.; Barreiro, A.; Marino, M.L.; Malvehy, J.; et al. Improvement of Diagnostic Confidence and Management of Equivocal Skin Lesions by Integration of Reflectance Confocal Microscopy in Daily Practice: Prospective Study in 2 Referral Skin Cancer Centers. J. Am. Acad. Dermatol. 2020, 83, 1057–1063. [Google Scholar] [CrossRef]
  9. Bigio, I.J.; Mourant, J.R. Ultraviolet and Visible Spectroscopies for Tissue Diagnostics: Fluorescence Spectroscopy and Elastic-Scattering Spectroscopy. Phys. Med. Biol. 1997, 42, 803–814. [Google Scholar] [CrossRef]
  10. Goth, W.; Lesicko, J.; Sacks, M.S.; Tunnell, J.W. Optical-Based Analysis of Soft Tissue Structures. Annu. Rev. Biomed. Eng. 2016, 18, 357–385. [Google Scholar] [CrossRef] [Green Version]
  11. Drakaki, E.; Borisova, E.; Makropoulou, M.; Avramov, L.; Serafetinides, A.A.; Angelov, I. Laser Induced Autofluorescence Studies of Animal Skin Used in Modeling of Human Cutaneous Tissue Spectroscopic Measurements. Skin Res. Technol. 2007, 13, 350–359. [Google Scholar] [CrossRef] [PubMed]
  12. Basen-Engquist, K.; Shinn, E.H.; Warneke, C.; de Moor, C.; Le, T.; Richards-Kortum, R.; Follen, M. Patient Distress and Satisfaction with Optical Spectroscopy in Cervical Dysplasia Detection. Am. J. Obstet. Gynecol. 2003, 189, 1136–1142. [Google Scholar] [CrossRef] [Green Version]
  13. Volynskaya, Z.; Haka, A.S.; Bechtel, K.L.; Fitzmaurice, M.; Shenk, R.; Wang, N.; Nazemi, J.; Dasari, R.R.; Feld, M.S. Diagnosing Breast Cancer Using Diffuse Reflectance Spectroscopy and Intrinsic Fluorescence Spectroscopy. J. Biomed. Opt. 2008, 13, 024012. [Google Scholar] [CrossRef] [PubMed]
  14. Mustafa, F.H.; Jaafar, M.S. Comparison of Wavelength-Dependent Penetration Depths of Lasers in Different Types of Skin in Photodynamic Therapy. Indian J. Phys. 2013, 87, 203–209. [Google Scholar] [CrossRef]
  15. Robertson, K.; Rees, J.L. Variation in Epidermal Morphology in Human Skin at Different Body Sites as Measured by Reflectance Confocal Microscopy. Acta Derm. Venereol. 2010, 90, 368–373. [Google Scholar] [CrossRef] [PubMed] [Green Version]
  16. Hosseini, M.; Dousset, L.; Mahfouf, W.; Serrano-Sanchez, M.; Redonnet-Vernhet, I.; Mesli, S.; Kasraian, Z.; Obre, E.; Bonneu, M.; Claverol, S.; et al. Energy Metabolism Rewiring Precedes UVB-Induced Primary Skin Tumor Formation. Cell Rep. 2018, 23, 3621–3634. [Google Scholar] [CrossRef]
  17. Hennessy, R.; Goth, W.; Sharma, M.; Markey, M.K.; Tunnell, J.W. Effect of Probe Geometry and Optical Properties on the Sampling Depth for Diffuse Reflectance Spectroscopy. J. Biomed. Opt. 2014, 19. [Google Scholar] [CrossRef] [Green Version]
  18. Deonizio, J.; Werner, B.; Mulinari-Brenner, F.A. Histological Comparison of Two Cryopeeling Methods for Photodamaged Skin. ISRN Dermatol. 2014, 2014, 950754. [Google Scholar] [CrossRef]
  19. Zherebtsova, A.I.; Dremin, V.V.; Makovik, I.N.; Zherebtsov, E.A.; Dunaev, A.V.; Goltsov, A.; Sokolovski, S.G.; Rafailov, E.U. Multimodal Optical Diagnostics of the Microhaemodynamics in Upper and Lower Limbs. Front. Physiol. 2019, 10. [Google Scholar] [CrossRef]
  20. Papayan, G.V.; Petrishchev, N.N.; Zhurba, V.M.; Kishalov, A.A.; Galagudza, M.M. Fiber Fluorescence–Reflection Spectrometer with Multiwave Excitation. J. Opt. Technol. 2014, 81, 29–32. [Google Scholar] [CrossRef]
  21. Dremin, V.; Potapova, E.; Zherebtsov, E.; Kandurova, K.; Shupletsov, V.; Alekseyev, A.; Mamoshin, A.; Dunaev, A. Optical Percutaneous Needle Biopsy of the Liver: A Pilot Animal and Clinical Study. Sci. Rep. 2020, 10, 14200. [Google Scholar] [CrossRef] [PubMed]
  22. Ehlen, L.; Zabarylo, U.J.; Speichinger, F.; Bogomolov, A.; Belikova, V.; Bibikova, O.; Artyushenko, V.; Minet, O.; Beyer, K.; Kreis, M.E.; et al. Synergy of Fluorescence and Near-Infrared Spectroscopy in Detection of Colorectal Cancer. J. Surg. Res. 2019, 242, 349–356. [Google Scholar] [CrossRef] [PubMed] [Green Version]
  23. Amouroux, M.; Diaz-Ayil, G.; Blondel, W.C.P.M.; Bourg-Heckly, G.; Leroux, A.; Guillemin, F. Classification of Ultraviolet Irradiated Mouse Skin Histological Stages by Bimodal Spectroscopy: Multiple Excitation Autofluorescence and Diffuse Reflectance. J. Biomed. Opt. 2009, 14, 014011. [Google Scholar] [CrossRef] [PubMed]
  24. Lim, L.; Nichols, B.; Migden, M.R.; Rajaram, N.; Reichenberg, J.S.; Markey, M.K.; Ross, M.I.; Tunnell, J.W. Clinical Study of Noninvasive in vivo Melanoma and Nonmelanoma Skin Cancers Using Multimodal Spectral Diagnosis. J. Biomed. Opt. 2014, 19, 117003. [Google Scholar] [CrossRef] [PubMed]
  25. Chang, S.K.; Mirabal, Y.N.; Atkinson, E.N.; Cox, D.; Malpica, A.; Follen, M.; Richards-Kortum, R. Combined Reflectance and Fluorescence Spectroscopy for in vivo Detection of Cervical Pre-Cancer. J. Biomed. Opt. 2005, 10, 024031. [Google Scholar] [CrossRef] [PubMed]
  26. Hariri Tabrizi, S.; Aghamiri, S.M.R.; Farzaneh, F.; Sterenborg, H.J.C.M. The Use of Optical Spectroscopy for in vivo Detection of Cervical Pre-Cancer. Lasers Med. Sci. 2014, 29, 831–845. [Google Scholar] [CrossRef] [PubMed]
  27. Georgakoudi, I.; Jacobson, B.C.; Dam, J.V.; Backman, V.; Wallace, M.B.; Müller, M.G.; Zhang, Q.; Badizadegan, K.; Sun, D.; Thomas, G.A.; et al. Fluorescence, Reflectance, and Light-Scattering Spectroscopy for Evaluating Dysplasia in Patients with Barrett’s Esophagus. Gastroenterology 2001, 120, 1620–1629. [Google Scholar] [CrossRef] [Green Version]
  28. Bard, M.P.L.; Amelink, A.; Skurichina, M.; Noordhoek Hegt, V.; Duin, R.P.W.; Sterenborg, H.J.C.M.; Hoogsteden, H.C.; Aerts, J.G.J.V. Optical Spectroscopy for the Classification of Malignant Lesions of the Bronchial Tree. Chest 2006, 129, 995–1001. [Google Scholar] [CrossRef]
  29. Borisova, E.; Genova, T.; Bratashov, D.; Lomova, M.; Terziev, I.; Vladimirov, B.; Avramov, L.; Semyachkina-Glushkovskaya, O. Macroscopic and Microscopic Fluorescence Spectroscopy of Colorectal Benign and Malignant Lesions—Diagnostically Important Features. Biomed. Opt. Express 2019, 10, 3009–3017. [Google Scholar] [CrossRef]
  30. Wagnieres, G.A.; Star, W.M.; Wilson, B.C. In Vivo Fluorescence Spectroscopy and Imaging for Oncological Applications. Photochem. Photobiol. 1998, 68, 603–632. [Google Scholar] [CrossRef]
  31. Rajaram, N.; Aramil, T.J.; Lee, K.; Reichenberg, J.S.; Nguyen, T.H.; Tunnell, J.W. Design and Validation of a Clinical Instrument for Spectral Diagnosis of Cutaneous Malignancy. Appl. Opt. 2010, 49, 142–152. [Google Scholar] [CrossRef] [PubMed] [Green Version]
  32. Motz, J.T.; Gandhi, S.J.; Scepanovic, O.R.; Haka, A.S.; Kramer, J.R.; Dasari, R.R.; Feld, M.S. Real-Time Raman System for in vivo Disease Diagnosis. J. Biomed. Opt. 2005, 10, 031113. [Google Scholar] [CrossRef] [PubMed]
  33. Diaz-Ayil, G.; Amouroux, M.; Blondel, W.C.P.M.; Bourg-Heckly, G.; Leroux, A.; Guillemin, F.; Granjon, Y. Bimodal Spectroscopic Evaluation of Ultra Violet-Irradiated Mouse Skin Inflammatory and Precancerous Stages: Instrumentation, Spectral Feature Extraction/Selection and Classification (k-NN, LDA and SVM). Eur. Phys. J. Appl. Phys. 2009, 47, 12707. [Google Scholar] [CrossRef] [Green Version]
  34. Abdat, F.; Amouroux, M.; Guermeur, Y.; Blondel, W. Hybrid Feature Selection and SVM-Based Classification for Mouse Skin Precancerous Stages Diagnosis from Bimodal Spectroscopy. Opt. Express 2012, 20, 228–244. [Google Scholar] [CrossRef] [PubMed]
  35. Amouroux, M.; Blondel, W.; Delconte, A. Medical Device for Fibred Bimodal Optical Spectroscopy. U.S. Patent 10895503 (B2), 19 January 2021. [Google Scholar]
  36. Nath, A.; Rivoire, K.; Chang, S.; Cox, D.; Atkinson, E.N.; Follen, M.; Richards-Kortum, R. Effect of Probe Pressure on Cervical Fluorescence Spectroscopy Measurements. J. Biomed. Opt. 2004, 9, 523–533. [Google Scholar] [CrossRef] [PubMed]
  37. Cerussi, A.; Siavoshi, S.; Durkin, A.; Chen, C.; Tanamai, W.; Hsiang, D.; Tromberg, B.J. Effect of Contact Force on Breast Tissue Optical Property Measurements Using a Broadband Diffuse Optical Spectroscopy Handheld Probe. Appl. Opt. 2009, 48, 4270–4277. [Google Scholar] [CrossRef] [Green Version]
  38. Atencio, J.A.D.; Guillén, E.E.O.; y Montiel, S.V.; Rodríguez, M.C.; Ramos, J.C.; Gutiérrez, J.L.; Martínez, F. Influence of Probe Pressure on Human Skin Diffuse Reflectance Spectroscopy Measurements. Opt. Mem. Neural Netw. 2009, 18, 6–14. [Google Scholar] [CrossRef]
  39. Lim, L.; Nichols, B.; Rajaram, N.; Tunnell, J.W. Probe Pressure Effects on Human Skin Diffuse Reflectance and Fluorescence Spectroscopy Measurements. J. Biomed. Opt. 2011, 16. [Google Scholar] [CrossRef]
  40. Wang, L.; Jacques, S.L.; Zheng, L. MCML—Monte Carlo Modeling of Light Transport in Multi-Layered Tissues. Comput. Methods Programs Biomed. 1995, 47, 131–146. [Google Scholar] [CrossRef]
  41. Alerstam, E.; Lo, W.C.Y.; Han, T.D.; Rose, J.; Andersson-Engels, S.; Lilge, L. Next-Generation Acceleration and Code Optimization for Light Transport in Turbid Media Using GPUs. Biomed. Opt. Express 2010, 1, 658–675. [Google Scholar] [CrossRef] [Green Version]
  42. Asllanaj, F.; Contassot-Vivier, S.; Hohmann, A.; Kienle, A. Light Propagation in Biological Tissue. J. Quant. Spectrosc. Radiat. Transf. 2019, 224, 78–90. [Google Scholar] [CrossRef]
  43. Vargas, G.; Chan, K.F.; Thomsen, S.L.; Welch, A.J. Use of Osmotically Active Agents to Alter Optical Properties of Tissue: Effects on the Detected Fluorescence Signal Measured through Skin. Lasers Surg. Med. 2001, 29, 213–220. [Google Scholar] [CrossRef] [PubMed] [Green Version]
  44. Que, S.K.T.; Zwald, F.O.; Schmults, C.D. Cutaneous Squamous Cell Carcinoma: Incidence, Risk Factors, Diagnosis, and Staging. J. Am. Acad. Dermatol. 2018, 78, 237–247. [Google Scholar] [CrossRef] [PubMed] [Green Version]
Figure 1. General scheme of the SpectroLive device optical principle. XFL: xenon flash lamp for broadband diffuse reflectance (DR) measurements; LEDi (i ∈ {1,2,3,4,5}): light-emitting diodes for narrow band together with BFi excitation bandpass filters for narrow-band autofluorescence (AF) excitations; MFP: multiple fiber probe (see details in Figure 2); PC: power combiner; ADL: achromatic doublet lens; FW: filter wheel; SDSj (j ∈ {1,2,3,4}): source-to-detector separations; LFk (k ∈ {1,2,3}): emission long-pass filters; NF: neutral density filter; SMj: spectrometers.
Electronics 10 00243 g001
Figure 2. Optical probe used in the SpectroLive device. (a) General schematic of the entire probe including excitation fibers each connected to one of the six excitation light sources, merged into a single 600 µm-core diameter excitation fiber and collection optical fibers, each connected to a spectrometer, each corresponding to a specific source-to-detector separation (SDS). (b) Schematic of the optical probe showing the 84 optical fibers around the central excitation fiber (600 µm-core diameter): 60 grey optical fibers are inactive and used as wedges for the 24 active collection fibers shown in the figure as colored fibers. The green (respectively orange, blue and purple) ones correspond to first SDS1 (respectively SDS2, SDS3 and SDS4). For each colored ring, the six fibers are merged into the collection fibers. The diameter of the whole section is 3.5 mm. (c) Picture of the probe end: outer diameter ∅1 is 10 mm, tip diameter ∅2 is 6.5 mm, and fiber optics area measurement diameter ∅3 is 3.5 mm.
Electronics 10 00243 g002
Figure 3. SpectroLive device in a surgery room at the Metz-Thionville regional hospital. (a) Front view showing tactile screen, keyboard, the pole holding the optical fiber probe and its holder (right side). (b) Back view: top shelf, light sources; second shelf, spectrometers and filters wheel; 3rd shelf, LEDs controllers; bottom shelf, computer central unit and electrical filter.
Electronics 10 00243 g003
Figure 4. Probe pressure control module. (a) General view of the module fixed onto the optical probe of the SpectroLive device. (b) Screen fixed onto the optical probe so the user may see it while measuring, displaying the pressure level within (green graph) or outside (orange graph) pre-defined boundaries. (c) Human–machine Interface monitoring the probe pressure during the whole spectra acquisition duration: the red and blue lines respectively show the maximum and minimum pressure level previously defined by the user.
Electronics 10 00243 g004
Figure 5. Boxplot (n = 5) of the photon count values measured for background (spectrometer’s entrance left “open” connected to the collection fiber) and dark (spectrometer’s entrance “closed” with a black cap) noises for each of the four spectrometers used on the SpectroLive device. Stars indicate significant statistical differences.
Electronics 10 00243 g005
Figure 6. Optical probe of the SpectroLive device put in contact with an ex vivo human skin sample on top of a fluorescent gel made of agarose and AgUIX® nanoparticles (NH TherAguix®, Meylan, France).
Electronics 10 00243 g006
Figure 7. Emission spectra of LEDs used for autofluorescence excitation on the SpectroLive device measured using the Specbos 1211 (Jeti®) spectroradiometer.
Electronics 10 00243 g007
Figure 8. Spectral correction curve used to correct raw spectra. Here is the example of the correction curve for the diffuse reflectance configuration, i.e., no filter in the filter wheel and for each SDS: blue curve for SDS1, red curve for SDS2, yellow curve for SDS3 and purple curve for SDS4.
Electronics 10 00243 g008
Figure 9. AGuIX® nanoparticles fluorescence (a), and ex vivo human skin autofluorescence (b) peak intensity for two excitation wavelengths (blue: 365 nm, and orange: 405 nm) by the SpectroLive device.
Electronics 10 00243 g009
Figure 10. First column, autofluorescence and fluorescence spectra measured with the SpectroLive device and its optical probe put in gentle contact with an ex vivo skin sample put on top of a fluorescent gel for the 405-nm excitation wavelength at four source-to-detector separations (D1: blue, D2: red, D3: yellow and, D4: purple) for three ex vivo human skin samples of different thicknesses (first line: 155, second line: 305 and, third line: 519 µm). Second column: corresponding pictures of hematoxylin and eosin (H&E) stained-histological slides of human skin samples. Scale bar = 250 µm.
Electronics 10 00243 g010aElectronics 10 00243 g010b
Table 1. Mean values (n = 5) of irradiance and full width at half maximum (FWHM) measured at the SpectroLive optical probe tip using the Specbos 1211 (Jeti®, Jena, Germany) spectroradiometer for each light source.
Light SourceNarrow Band Excitation Peaks (nm)Broad Band Excitation (DR)
365385395405415Xenon Flash Lamp
Irradiance (W/m²)6939112
FWHM (nm)497910NA *
* Not applicable.
Publisher’s Note: MDPI stays neutral with regard to jurisdictional claims in published maps and institutional affiliations.

