Article

Multi-Sensor Validation Approach of an End-Effector-Based Robot for the Rehabilitation of the Upper and Lower Limb

1
Department of Mechanical and Industrial Engineering, University of Brescia, via Branze, 38, 25123 Brescia, Italy
2
Polibrixia s.r.l., via Branze, 45, 25123 Brescia, Italy
3
Domus Salutis Rehabilitation Clinic, Teresa Camplani Foundation, via Lazzaretto, 3, 25123 Brescia, Italy
*
Author to whom correspondence should be addressed.
Electronics 2020, 9(11), 1751; https://doi.org/10.3390/electronics9111751
Submission received: 18 September 2020 / Revised: 17 October 2020 / Accepted: 20 October 2020 / Published: 22 October 2020

Abstract

:
End-effector-based robots are widely adopted by physiotherapists and caregivers as support in the delivery of the rehabilitation training to the patient. The validation of these devices presents critical aspects, since the system performance must be assessed analyzing the movement performed by the subject limb, i.e., elements outside the device. This paper presents a multi-sensor approach for the validation of an innovative end-effector-based device, comparing different measurement strategies for evaluating the system effectiveness in imposing an expected training. The study was performed monitoring the movement induced by the device on the upper limb of a young male healthy subject during a set of fictitious rehabilitation sessions. The kinematic structure of the device is characterized by a compact differential mechanism with two degrees of freedom. A sequence of repetitions of a planar reaching pattern was analyzed as illustrative training task. A kinematic model of subject and system was developed, and the kinematics of a set of specific landmark points on the subject limb was evaluated. Data obtained from two measurement systems were compared: (1) an optoelectronic system with two cameras and eight skin passive markers, and (2) two triaxial accelerometers. Results were analyzed in MATLAB and R environment, revealing a high repeatability of the limb movement. Although both the measurement systems allow evaluating the acceleration of subject’s arm and forearm, accelerometers should be preferred for punctual analysis, like components optimizations, whereas optical markers provide a general overview of the system, particularly suitable for the functional design process.

1. Introduction

The motor skills reduction in subjects affected by neurologically based disorders, like stroke, spinal cord injuries and traumatic brain lesions, strongly influences the quality of life [1,2,3]. In particular, the ability of independently and self-sufficiently execute everyday motor tasks is greatly reduced by extremities functional limitations [4]. For this reason, more than restoring the capacity of realizing a task in the natural way, the primary aim of rehabilitation techniques is allowing the execution of the lost motor functions, re-educating the subjects to coordinate movements. Besides, motor and neuro-motor rehabilitation, combined with the use of orthoses and functional electrical stimulation, improves also the subject mental abilities and prevents secondary complications such as spasticity, muscle atrophy and osteoporosis [5].
The physical rehabilitation process begins with a preliminary analysis of the patient’s residual abilities, suitable for identifying the most effective rehabilitation protocol. According to literature, biofeedback and robot-assisted therapy, as well as virtual reality training, intensify the rehabilitation therapy allowing the accurate repetition of motor patterns [6]. Indeed, onset, intensity, duration and task-orientation of the training significantly affect the achievement of positive outcomes. As literature enlightens, repetitive training generates functional improvements which depend on patients inclusion criteria and time elapsed from the stroke, but also on the repetitions quantity [7]. In fact, scientific evidences suggest to extend the duration of training sessions, since longer sessions have better effects on motor functions [7,8].
In recent literature, many works deal with the use of robotic devices for rehabilitation purposes, offering a wide variety of solutions for the upper and lower limbs rehabilitation, both in clinical environments and at home [5,9,10,11]. Several devices may provide a different kind of motion assistance, like passive or active mobilization, as well as haptic assistance or coaching [9]. Active devices, presenting at least one actuator, can induce the movement of specific parts of the limb, performing active or passive exercises. Moreover, the device may support the subject, which actively performs the task by moving the limb; on the contrary, in passive exercises the patient movement is guided by the device during the rehabilitation session.
An alternative taxonomy classifies devices considering the mechanical design. Actually they can be (1) end-effector-based, i.e., the contact between machine and patient’s limb arises only at the end-effector level (e.g., MIT Manus [12]), or (2) exoskeleton-based, in which the mechanical configuration of the device mirrors the limb’s skeletal structure [13,14,15]; in those devices the contact between subject and system is distributed along the limb with multiple contact areas. Literature also presents many devices that combine these two structures, like the MIME-RiceWrist rehabilitation system [16].
Besides, some devices are characterized by specific and significant features. Among them, reconfigurability represents the capability of the system of changing its mechanical structure, adapting it to different use conditions, or the ability to follow the subject necessities (e.g., MUNDUS [6]). Back-drivability describes instead the possibility of the patient to induce the movement of the system when the device is in passive state (e.g., HWARD [17]). Mechanical structure of the system, as well as type, number and location of the actuators determine the allowed movements of the device and the degrees of freedom (DOFs) of the system consequently. As the literature reports, most of the devices allow three-dimensional movements [18], whereas only a restricted group of devices enable the movement on a specific plane (e.g., ARC-MIME [19]).
Focusing on the control of the devices, several signals may be evaluated, like externally imposed triggers [20], kinematic or dynamic signals from the device [21,22], as well as biomechanical signals from the subject, such as data derived from surface electromyography (sEMG [23,24]). Nonetheless, biomechanical systems can be considered characterized by low dynamics phenomena, and rehabilitation training even more, given the low velocities required for a correct training [25].
Literature provides numerous examples of multi-sensor validation in clinical or rehabilitative contexts when considering the human motion [26,27], whereas multiple units of the same sensor are generally used when validating devices [28].
Within this complex context, the validation process of new rehabilitation devices becomes critical, since the true analysis dimension for evaluating the system performance coincides with the analysis of the motion performed by the subject, referring therefore to elements outside the device. Hence, the system to monitor can include the device, but mainly focuses on the final user, i.e., the patient. We can describe some validation methods as device-oriented, meaning that the validation is pursued through the comparison of the performance, as recorded by the rehabilitation system, with those detected by the sensors located along the device. This is the typical condition for exoskeleton devices, in which the design of the system, with the distributed contact between machine and subject, justifies the hypothesis of negligible approximation errors between motion profile realized by device and movement of the patient limb. In this case, sensors like the inertial measurement unit (IMU) [29] or camera-based systems [30] are mostly used. Besides, according to the same rationale, other validation methods can be defined as user-oriented, since the analysis is performed detecting the patient movement, thanks to wearable sensors like EMG sensors [31] and optoelectronic systems [29] placed on significant landmarks of the testing subjects. This approach is necessary for end-effector based devices, since the process to monitor is partially independent from the device constraints, and differently from the device-oriented methods, it demands for the identification of a proper kinematic or dynamic model of the subject.
In this work a multi-sensor validation approach is investigated and an innovative rehabilitation device was considered for the study. The device is an end-effector-based robotic system that has been developed within the SIMeRiON (Innovative Mechatronics System for Orthopedic and Neurological Rehabilitation) project, funded by Regione Lombardia [32]. The device is back-drivable and reconfigurable, presents an electro-mechanical actuation system, and is able to provide passive, active and assisted rehabilitation [32,33]. The mechanical system is based on a compact differential system and is characterized by two DOFs; this allows implementing every kind of motion profile within a plane. The device performance is analyzed evaluating the movement induced by the device on the upper limb of a healthy subject in a sequence of repetitions. The movement characteristics are investigated monitoring specific landmark points of the subject’s limb, with the aim of verifying the system effectiveness in imposing the expected training. The kinematics of those points has been detected thanks to (1) an optical marker-based tracking system, and (2) an inertial sensor-based system. Acquired data have been compared to evaluate strength points and drawbacks of each measuring strategy for the proper tuning of the system model; in fact, the kinematic model of subject and system has been defined and used as reference for the interpretation of the collected data. In the next section, a synthetic description of the device is reported, and the adopted methods for the performed data treatment are described. Results are then presented and discussed in the following sections, whereas main strength points and limits of the work are finally described in the conclusions.

2. Materials and Methods

2.1. Methods

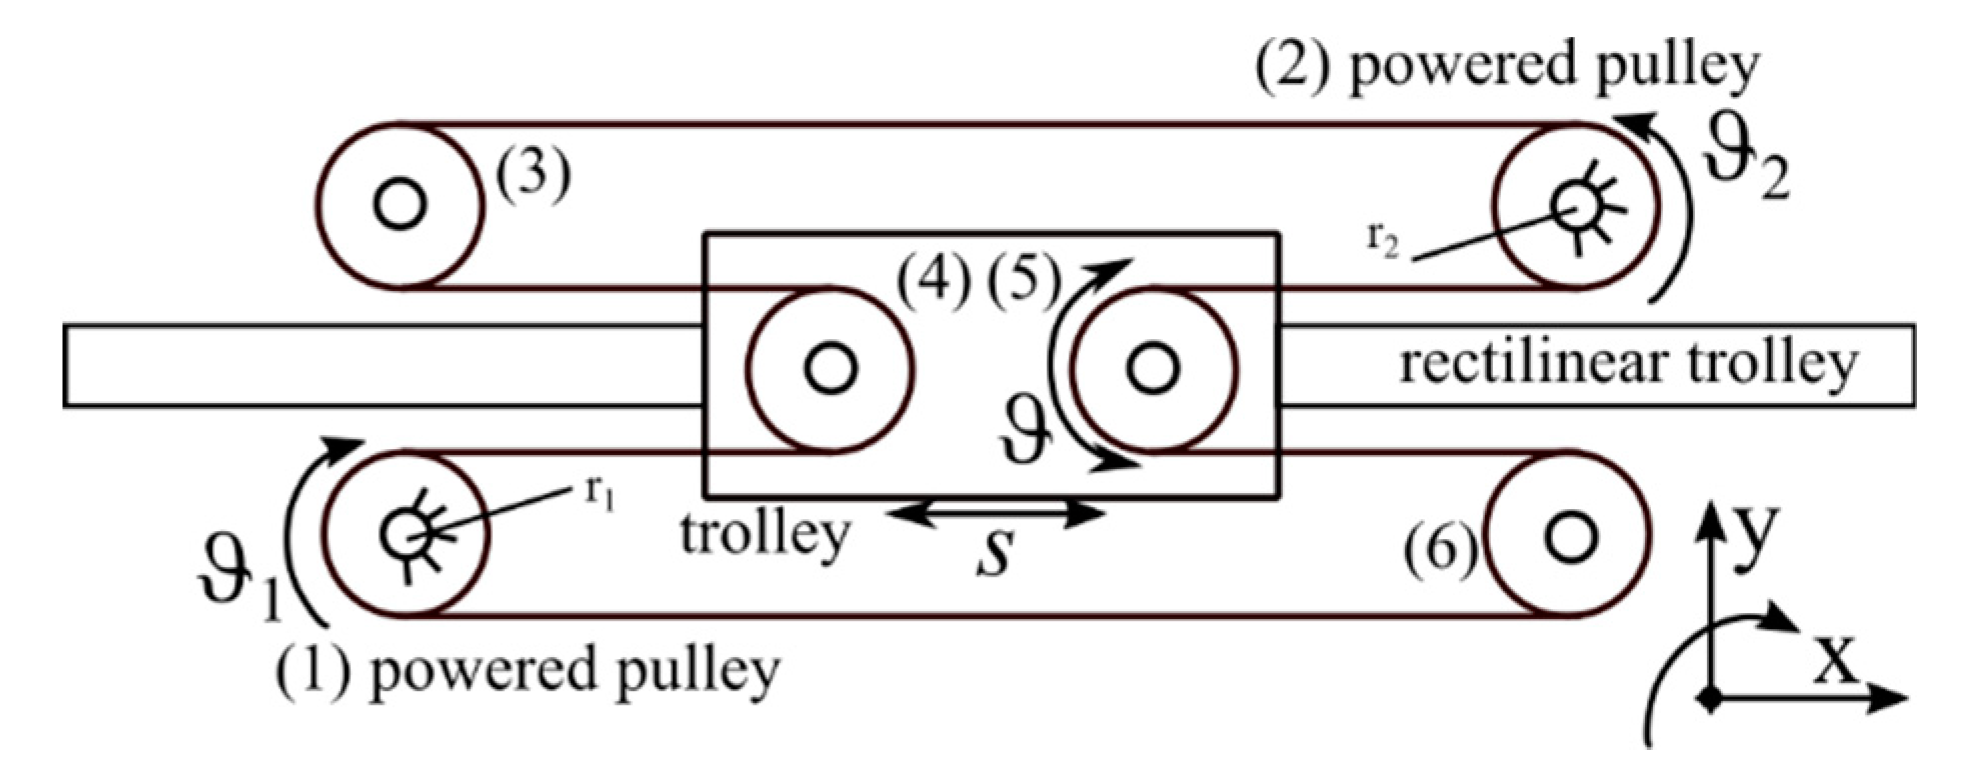
2.1.1. The Rehabilitation Device

The presented innovative device can perform both pre-set and custom exercises for the rehabilitation of the upper and lower limbs. The operator (e.g., the physiotherapist or the caregiver) can choose and define the most appropriate task and the amount of repetitions for the individual patient, and the device replicates it. The system is based on a single differential mechanism [32], and this assures two DOFs, i.e., simultaneous translation and rotation of the end effector within a plane. The kinematic scheme in Figure 1 depicts the belt-based differential mechanism [32,34] which presents six pulleys.
The sliding trolley can move along the x direction thanks to pulleys (4) and (5). Pulleys (3) and (6) are free spinning, whereas Pulleys (1) and (2) are actuated with brushless motors. Operating rationale of the system and theoretical framework are described in [33]. The relations reported in Equations (1) and (2) synthesize the kinematic behavior of the system in two operative conditions: when (1) only the ith mobile pulley can move, and when (2) both the mobile pulleys can move.
s i = ϑ i · r i 2   i = 1 ,   2
s = s 1 + s 2 = ϑ 1 · r 1 ϑ 2 · r 2 2
According to these characteristic equations, the two DOFs of the system can be expressed as the pure translation of the trolley (s), and the relative rotation (θ) between pulley (5) and belt. In this way, if an attachment like a handle is applied to the system as end-effector, the device actuates its roto-translation, enabling the realization of any movement within the actuation plane. This device allows the therapist to implement different rehabilitation strategies, like continuous passive motion (CPM), active rehabilitation, and assisted rehabilitation, provides the control of the movement speed and allows performing a warm up test before the actual exercise repetition, to check if the decided movement fits the appropriate rehabilitative task. Motion profiles can be provided through a three-dimensional mouse or a 15” touch-screen monitor. In order to limit the device cost, standard components have been chosen where possible (e.g., motors and belts), although some elements, like the control system, required the implementation of custom solutions. The final device is characterized by a maximum allowed horizontal stroke of 510 mm, a total mass of 45 kg, with an overall dimension of 890 mm × 1200 mm × 1250 mm (length × width × height). Finally, a vertical linear actuator assures a rotation stroke of the main body up to 65°. This further DOF allows the device to be suitable to sitting subjects, like patients using a wheelchair, as well as subjects lying in bed.

2.1.2. Acquisition Protocol

For this multi-sensor study of the device performance, a healthy male subject (aged 26) was recruited. The campaign consisted in monitoring a simulated rehabilitation session with two different measurement systems; tests were performed in the morning, in a constant temperature environment.
Beyond the innovative device, the experimental setup was composed of two independent acquisition systems: (1) two fixed optoelectronic cameras (DX-100, BTS Bioengineering, Quincy, MA, USA), with eight skin passive optical markers, and (2) two triaxial wireless accelerometers (BeanDevice WiLow AX-3D), located as close as possible to the center of gravity (CoG) of left arm and forearm, as Figure 2 depicts. The optical markers were placed by a trained operator on the landmark points of the subject corresponding to left acromion, left lateral humeral epicondyle, and left radial styloid process. One marker was placed on the device handle, two markers on the device cover, and two on the chair. Two different configurations were investigated for the accelerometers positioning, as Figure 3a schematizes: (1) on the medial radius, or the upper side of the subject’s forearm during the movement and (2) on the medial ulna, or beneath the forearm.
During the test, the subject was in a sitting position, grasping the handle with the left hand. In the starting condition, the subject’s left arm was extended near the trunk, and the left forearm was flexed, forming with the arm an angle of about 30 degrees, along the sagittal plane.
The performed task consisted in repeating for 9 cycles a unilateral reaching profile along the sagittal plane. The profile presented a maximum stroke of 0.285 m and 0.153 m in Z and X direction, respectively. The device performed the movement according to a passive rehabilitation strategy, i.e., the subject limb was completely moved by the system, without patient contribute and with the cycle time defined by the operator. Five tests were conducted, and dedicated software acquired markers positions and accelerometers signals. In the followings, three tests will be analyzed as representative of different accelerometer configurations: Acquisition A, with forearm accelerometer in medial radius position, Acquisition B, with forearm accelerometer in medial ulnar position, and Acquisition C, which repeats the exercise with the same conditions of B.

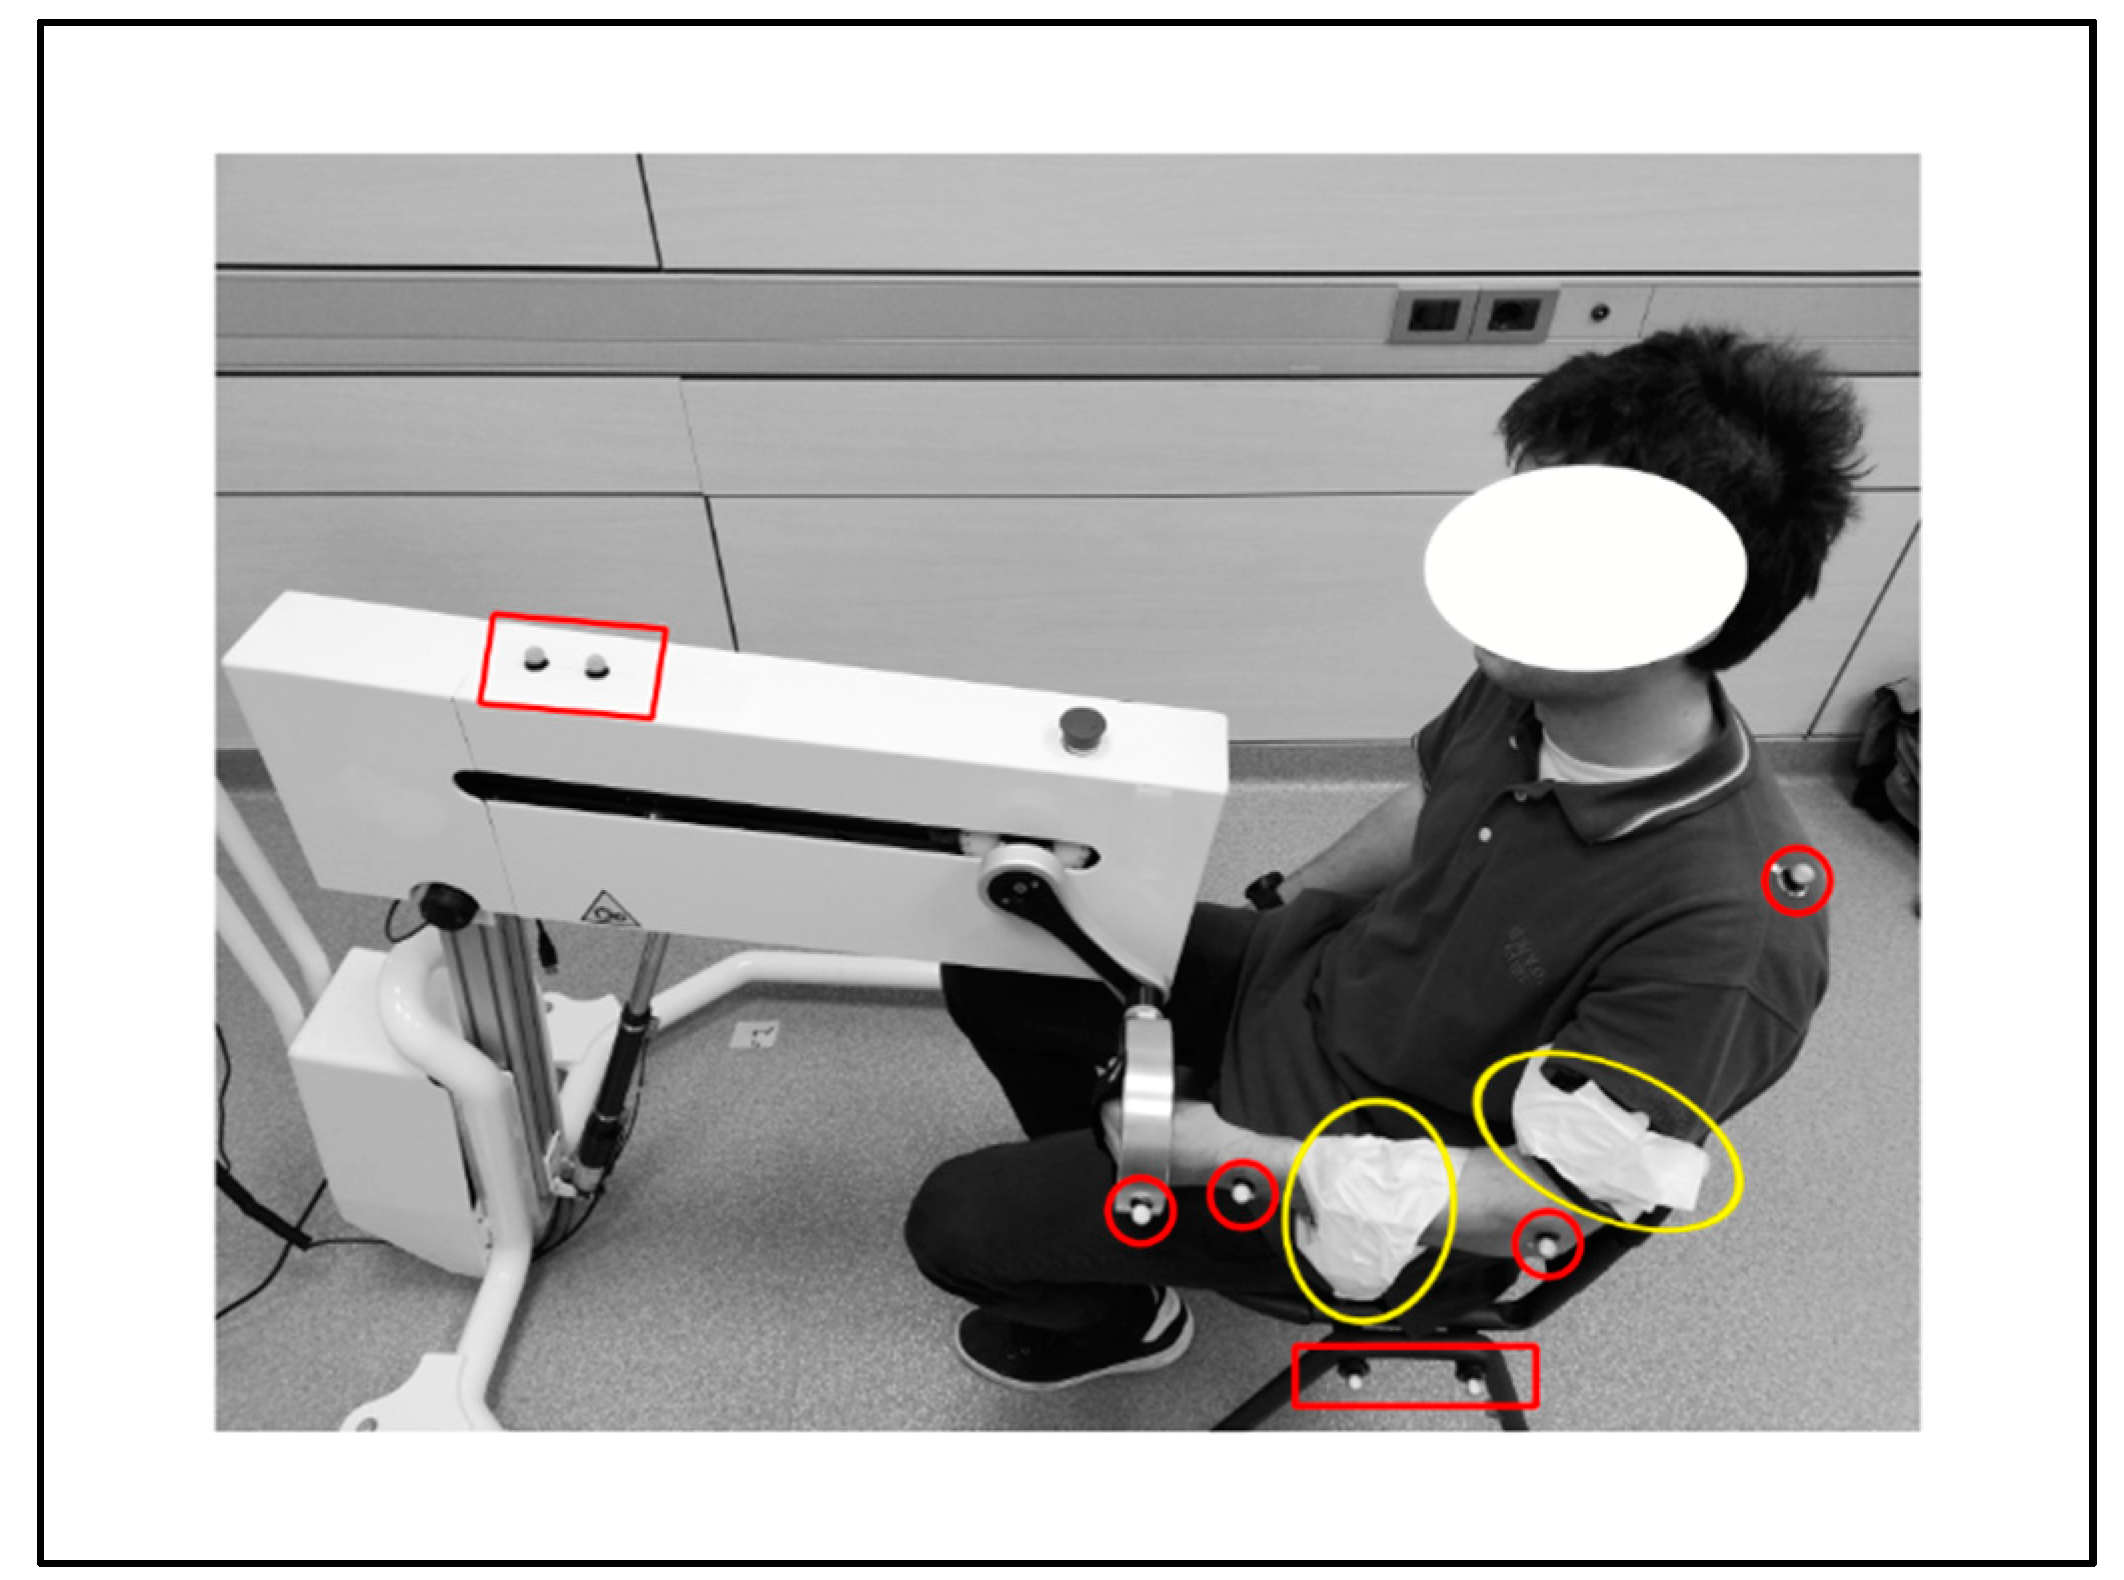
2.1.3. Experimental Settings

To synchronize accelerometers and optoelectronic cameras, a common trigger event was introduced on both the systems during the acquisitions, as a light blow to the arm of the subject before the start of the exercise.
Accelerometers frequency sample (fs) was set at 200 Hz, whereas markers displacements were acquired at a fs of 100 Hz. A calibration procedure assured a maximum residual error lower than 0.3 mm for the optoelectronic acquisition system.

2.1.4. Kinematic Models

Figure 3a depicts the kinematic model of system, developed to analyze the movement performed by the subject’s left upper limb during the rehabilitation session. The joints of the kinematic chain, i.e., wrist, elbow and shoulder, were approximated to ideal hinges, connected by rigid links. A Cartesian frame was defined on each joint, where the principal movement direction identifies the X axis, the Z axis runs orthogonally to the sagittal plane, and the Y axis is generated consequently.
This model represents a simplified chain, since for instance no frame is defined on the hand, but just the one on the handle of the device is considered. Besides the limb frames, the complete model should include local frames on the chair and on the device, according to the scheme in Figure 3b.
According to the homogeneous matrix approach of Legnani et al. [35,36], the relations in Equations (3) and (4) collect the characteristic equations of the system from the ground to the handle for the complete model, and for the simplified one, respectively. The latter is obtained under the hypotheses that the movements of chair (Frame 1) and device (Frame 8) are negligible, as well as the relative movement between hand (Frame 5) and handle (Frame 6). The complete model allows a decoupled description of the motion profile imposed by the device to the system, since the matrixes M(7)67 and M(8)78 describe independently the rotation of the crank and the translation of its pin.
{ M ( 0 ) 06 = M ( 0 ) 01 × M ( 0 ) 12 × M ( 0 ) 23 × M ( 0 ) 34 × M ( 0 ) 45 × M ( 0 ) 56 M ( 0 ) 06 = M ( 0 ) 08 × M ( 0 ) 87 × M ( 0 ) 76
M ( 0 ) 06 = M ( 0 ) 02 · M ( 0 ) 23 · M ( 0 ) 34 · M ( 0 ) 46

2.2. Data Analysis

Acquired data have been elaborated in MATLAB and R environment. The following paragraphs synthesize the procedure implemented to analyze and process the data obtained by optoelectronic system and accelerometers, respectively.

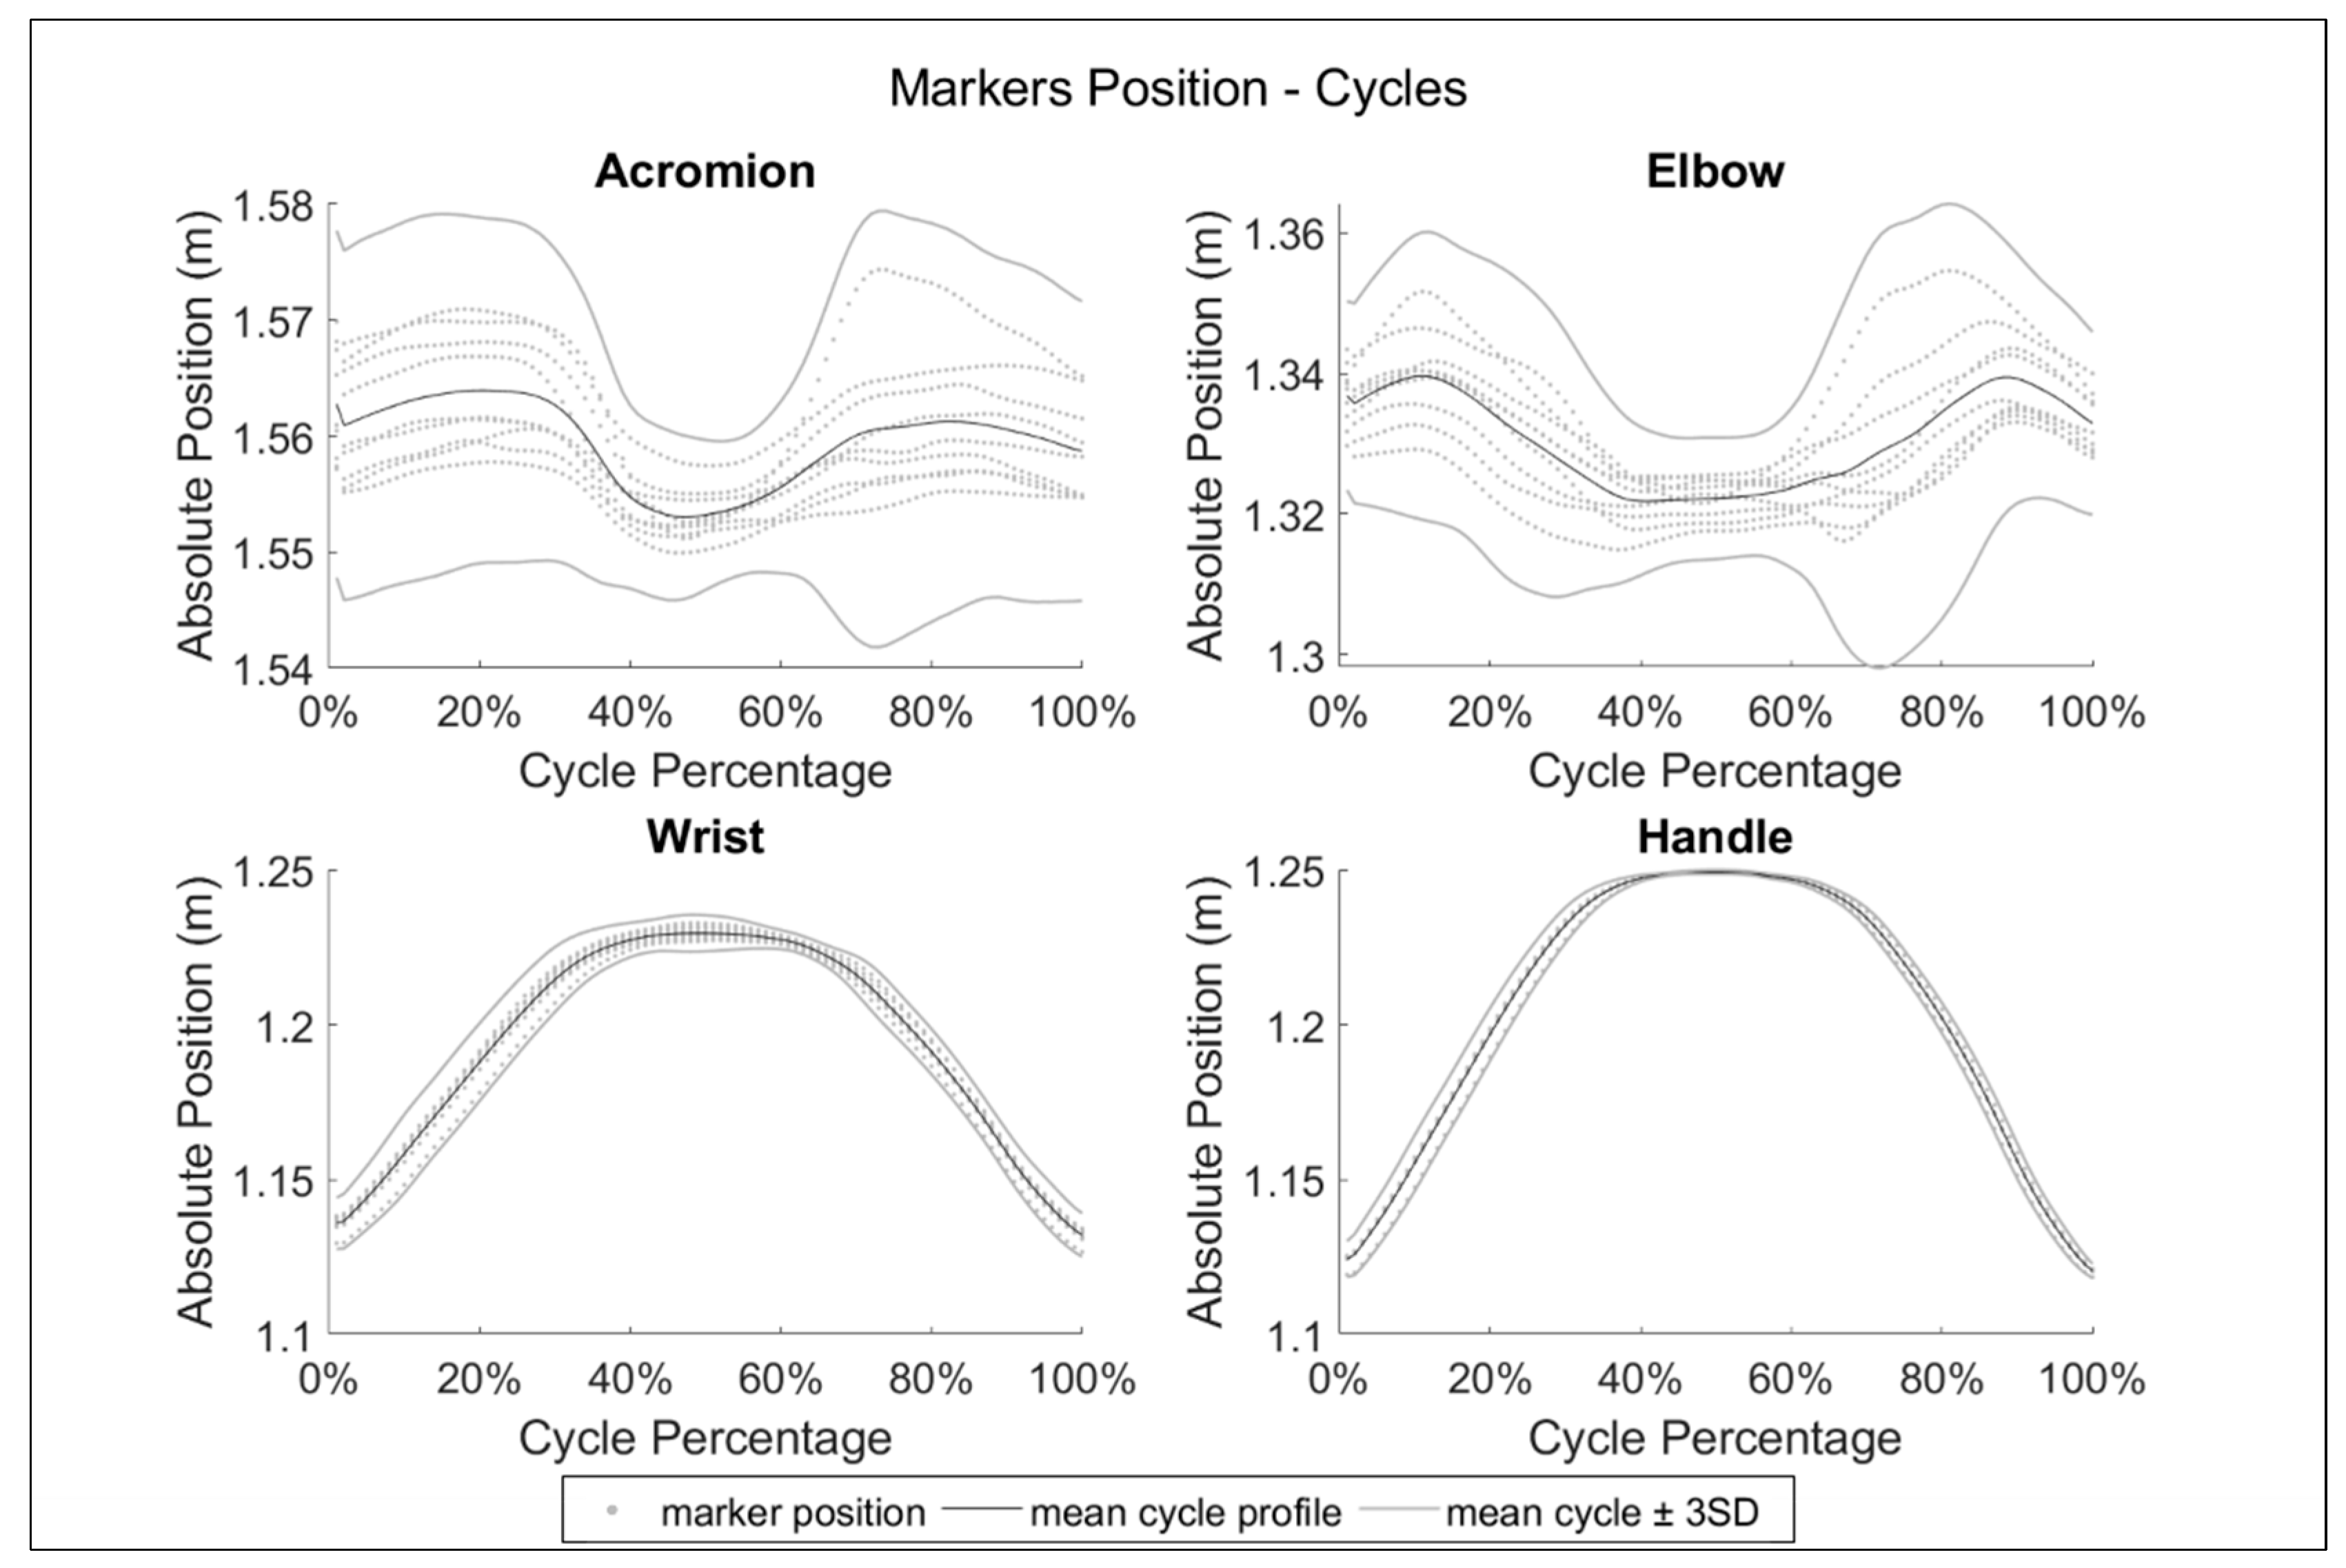
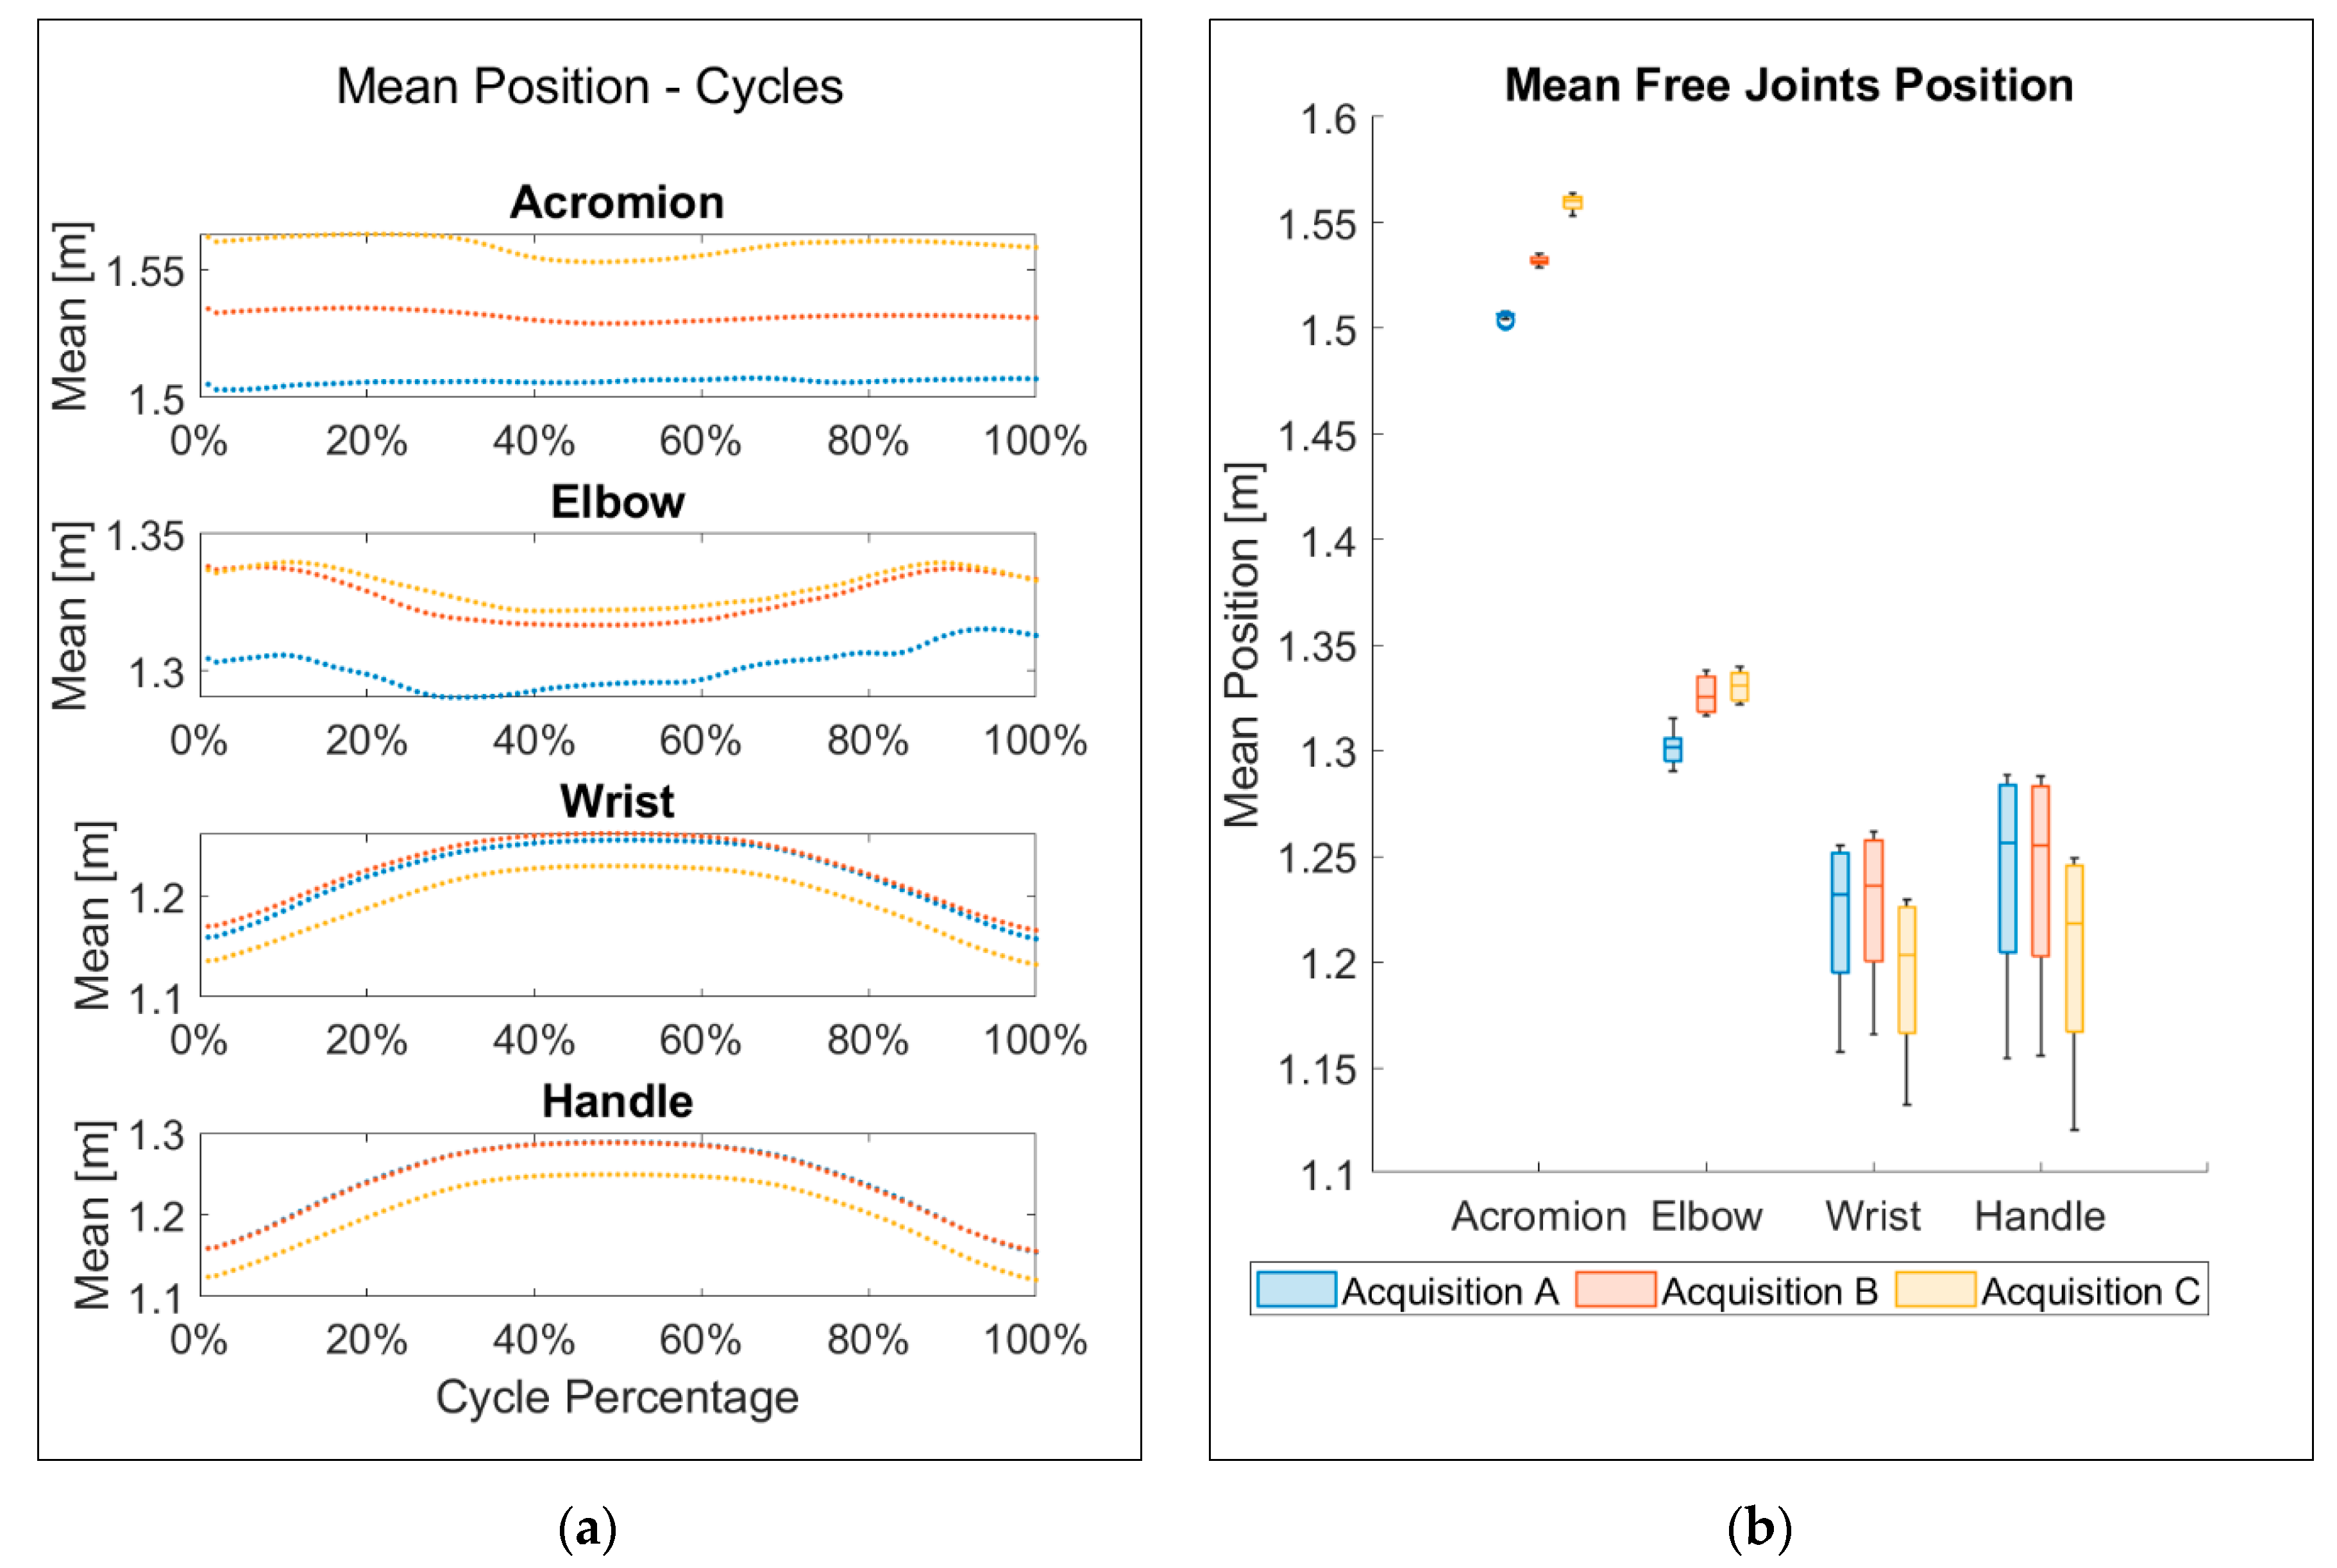
2.2.1. Optoelectronic Data

From a functional point of view, the marker positioning protocol is composed both of environmental markers, like those positioned on the device carter and on the chair, and of moving markers, like the ones on the handle and on the subject. For each marker, the displacement module R was defined according to Equation (5).
R 2 = X 2 + Y 2 + Z 2
R combines the spatial displacement components along the axes X, Y and Z, and represents therefore the absolute performed movement, including also the actions occurring out of the sagittal plane.
The environmental markers were analyzed checking for the sustainability of the hypothesis of negligible motion at the basis of the reduced kinematic model, and applying a fast Fourier transform (FFT), looking for low frequency components or hints of vibrations generated by the transmission system. The displacement signals of the moving markers were then filtered with a fourth order zero-phase low pass Butterworth filter, with a cutoff frequency (fc) of 1 Hz. The displacement of the handle marker was chosen as main reference for the identification of the cycles performed by the system during each session, since this marker was located on the device attachment. Considering the handle profile with respect to the time, each cycle is defined as the signal portion between two consecutive local minima, but the presence of potential non-idealities like noise or unexpected spikes may not allow a correct identification of those points. For this reason, a further procedure was applied to assure a robust identification of the cycles start and stop events on the handle marker profiles, according to the following rationale:
In signal processing, peaks can be detected easier than local minima. The filtered signal was therefore changed in sign, converting the analysis into a problem of local maxima evaluation;
Actual start/stop events are close to the maximum value. To be accepted as start/stop events, candidates must be above the 95% of the average value of the signal;
The operator imposed the repetition of the same motion profile 9 times, so cycles time is expected to be reasonably constant. Thus, only peaks at a certain distance from the previous and the following candidate can be chosen: this acceptability distance was defined as the range within the mean expected duration of the cycles, ±5%.
All the signal portions defined by the identified start/stop events were regularized into 100 elements arrays thanks to a single-pass moving average filter. To avoid edge effects on the normalized cycles, fictitious tails were added to each signal portion, assuring continuity of the signal. Those tails were removed after the regularization process, to obtain the 100 elements normalized cycles. The start/stop events were then reported on the other markers displacements, and the corresponding normalized cycles were then computed.
For each marker of the reduced kinematic model, the absolute acceleration was evaluated as the second time derivative of the displacement, using a custom combination of forward and backward Euler’s methods. The signal was then analyzed applying a FFT, and the acceleration was filtered with a low pass Butterworth filter (fourth order, zero-phase, fc of 1 Hz) to isolate the main components of the motion. Considering that the kinematic model equates subject’s arm and forearm with homogeneous rigid bodies, for each link the theoretical CoG is expected to be in the mean position, between the two extreme joints. Since both the links are performing a roto-translation, the acceleration of arm and forearm can be estimated as the acceleration amrk of the links CoGs, given the acceleration signals of the pairs shoulder and elbow, and elbow and wrist, respectively.

2.2.2. Accelerometers Data

For all the sessions, accelerometers data were synchronized on the common trigger event imposed to the subject. Each accelerometer detected acceleration components according to an internal Cartesian frame: to make data comparable among sensors, the absolute acceleration was evaluated, analogously to what described for the displacement module R in Equation (5), as the composition of the components along the three internal axes. The obtained acceleration signal was then cleared out of the constant gravitational acceleration, and a FFT analysis was performed to investigate the signals frequency spectrum. Finally, a low pass Butterworth filter (fourth order, zero-phase), was applied, with a fc of 1 Hz, and the acceleration signal aacc was then obtained.

2.2.3. Data Statistics

A basic descriptive analysis was performed on the collected data, with the primary aim of studying the repeatability potential of the motion induced by the device on the subject landmarks, with respect to different measurement setups. Mean value and standard deviation (SD) of the cycle lengths were investigated, and cycles mean lengths were tested with the Shapiro-Wilk normality test, to verify if data can be assumed as drawn from a normally distributed population.

2.2.4. Measurement Systems Comparison

Acceleration signals amrk and aacc of arm and forearm were compared adopting a fractal base analysis, with the aim of emphasizing strengths and limits of the two measurement systems for the current application.
According to the theory that Mandelbrot depicted in [37], and Ganea et al. applied to biomechanical problems in [38], signals can be reduced into the fractal dimension df, which represents a synthetic but significant parameter of the signal complexity. In fact, the more complex or irregular an object shape is, the higher value the fractal dimension assumes; in this sense, df has proved to be a good indicator of smoothness or instability for biomedical signals [39,40,41].
For the evaluation of df, the fast box-counting method was used; the method grounds on the evaluation of the number of boxes Nb of regular size which are required to cover the analyzed plot, with a recursive procedure. At each iteration, the algorithm divides each box in four sub-boxes, halving the length of the box side lb. The process starts with the maximum allowed side length of the box and stops when lb becomes equal to data resolution. The fractal dimension df is finally evaluated according to Equation (6), as the slop of the plot of Nb with respect to lb, in bi-logarithmic ten-base scale [42,43].
d f =   lim l 0 log 10 N b ( l b ) log 10 l b
In Equation (6), df is the fractal dimension, Nb is the number of regular size boxes, lb is the length of the box side and l is the generalized length of the box size that tents to zero.
In the current study, the fractal dimension analysis was performed on the combined plot of absolute arm acceleration with respect to absolute forearm acceleration. Those plots were evaluated for each measurement system and for each acquisition, independently; each plot comprised the only part of signal included between the start of the first cycle, and the stop of the last cycle. To make the images comparable, all the plots were scaled to the same axes limits, data were plotted as scatter graphs, and the final images were saved at high resolution (600 dpi) for the analysis.

3. Results and Discussion

The optical markers and the accelerometers allow assessing different characteristics of the system. For instance, the optoelectronic acquisition system collects information both on the device performance, through the environmental markers, and the subject experience, with the moving markers.
Results about the stability of the environmental markers located on the device during the different sessions are provided in Table 1. The mean profile of the displacements of these two markers was evaluated, and for each session the variation between maximum and minimum value remains always lower than the accuracy level of the optoelectronic measurement system obtained with the calibration process (0.3 mm). The analysis of the SD of the same mean signals reveals a detectable value only for the acquisition session B: nevertheless, the measured value is almost negligible. According to these results, the reduced kinematic model can be adopted for the motion analysis of the system.
Figure 4 depicts a comparison between the frequency spectrum of the same environmental device markers for Acquisitions B and C. Both the spectra present components between 3 and 6 Hz, reasonably related to vibrations generated at device level, since literature does not recognize human contributes within that frequency range [44].
Considering the moving markers, the overlapped normalized cycles provide information about the repeatability error of the subject movement within the same session, or the intra-subject error, as Figure 5 depicts at a glance. For all the markers, cycles were identified thanks to the start/stop events detected on the displacement signal of the handle marker; nonetheless, cycles seem not to be synchronous. This can be explained as the effect of the movement transmission along the kinematic chain of the limb; actually, the transmission generates a delay in the motion profile, which increases as the distance handle-to-joint increases.
Focusing on the mean values of the cycles lengths, the performed Shapiro-Wilk normality test supports the null hypothesis of a data sample assumed as drawn from a normally distributed population (W = 0.1255, p-value < 2.2 × 10⁻¹⁶, α = 0.05).
The descriptive analysis can be synthesized in Figure 6 and Figure 7: the former describes the mean position of the moving markers, corresponding to the model joints, for each acquisition, whereas Figure 7 presents the mean SD of the normalized cycles for the same acquisitions: A, B and C. Those figures provide an indication of the movement experience for the subject: the wider motion is performed by the handle and the wrist joints, whereas the displacement of the marker at shoulder level is almost negligible for all the acquisitions (Figure 6b). Elbow and wrist, the less constrained joints of the kinematic chain, realize less repetitive profiles, although with low SD values as well (Figure 7b). An exception is given by the SD values of the handle marker for the Acquisition B, presenting a dispersion higher than expected; this behavior is likely related to the specific attitude of the subject who, before the beginning of this session, changed the handle grasping trying to make himself more comfortable. The study of the maximum SD error investigates the inter-subject error, or the subject ability of repeating the same imposed movement along the session cycles. This aspect is strictly related to the functional characteristics of the device, and more in detail to the connection between device end-effector and distal part of the user limb. This connection represents a mechanical constraint for the limb kinematics; its contribute propagates along the kinematic chain of the limb, but weakens as the distance from the constraint increases. Therefore, the descriptive analysis can also provide indications to the designer about the optimization margins of the human-machine interface.
On the contrary, the accelerometers provided information on the subject only. The acquired signals result richer in details than the evaluated amrk, and quicker to detect variations of arm and forearm. Nonetheless, these data revealed to be very sensitive to sensors location, as the aacc signals of the forearm accelerometer in Figure 8 depicts: Acquisition A, corresponding to the medial radial sensor positioning (the upper position), presents a mean value notably different by the others, acquired both with the accelerometer in medial ulnar configuration.
Figure 9 allows comparing the information content provided by the two measurement systems at acceleration level, for the signal portion comprised between the start of the first cycle and the stop of the last cycle of each acquisition. Accelerometers generated more complex profiles than the accelerations obtained from the markers signals, as the results of the fractal dimension analysis in Table 2 confirm. Accelerometers data reveal the lowest df for the Acquisition A, corresponding to the medial radius configuration (the upper position) of the forearm sensor. Analogous result emerged in previous analyses performed on the signal of the forearm sensor only: in [45], the fractal dimension was evaluated on the profiles generated by the two acceleration components defining the sagittal plane (df = 1.332). That study revealed also significantly higher values for both Acquisitions B and C, but comparable one each other (1.353 and 1.352, respectively) [38,39,40,41]. On the contrary, the analysis of the absolute accelerations for both the accelerometers dampens the effect of different sensors configurations and introduces in the evaluation the handle grasping variability of the acquisition B. Comparing the df values among measurement systems, the amrk signals result always lower than the corresponding for aacc, in confirmation of simpler profiles. Nonetheless, the obtained differences among acquisitions for the markers data should be almost independent from the configuration of the forearm accelerometer: in this case, df values should be then interpreted more as indicators of the repeatability of the subject performance.
Finally, to properly compare the obtained results among measurement setups a functional evaluation should be also considered: accelerometers provide a very detailed information, but specific as well, at local level, whereas optical markers can be seen as a network of distributed observation units, providing a comprehensive but more generic description of the analyzed system. According to these considerations, accelerometers can be considered the most appropriate measurement tool for the qualitative analysis of a specific rigid body, like the fluency of the movement performed by an arm, or the smoothness of a device transmission. On the contrary, optoelectronic acquisition systems allow implementing complete models for the description of the motion of complex kinematic chains.
Indeed, the two measurement systems present common limits too: for instance, both are sensitive to positioning errors. To detect at best a rigid body kinematics, an accelerometer should be posed at the body CoG; when this condition cannot be satisfied, an artifact should be envisaged between detected and actual body motion. In the current analysis, an artefact due to the presence of bones and soft tissue is established, but further investigations should be performed to assess its contribute (for instance a campaign with a population stratified by body mass index). On the other hand, to detect the kinematics of a rigid body with an optoelectronic system, at least two optical markers should be located on the body, steadily in the same position during the motion. In addition, in this case, the presence of soft tissues introduces artefacts in the estimation of the body position; nevertheless, the choice of proper landmark points strongly reduces this error contribute [46,47], and according to literature the positioning of skin markers by trained operators allows negligible inter- and intra-operator errors [48,49].

4. Conclusions

This paper presents the analysis of a multi-sensor-based validation approach applied to a robotic end-effector-based device through a simulated rehabilitation session. The study was conducted comparing the data obtained through an optoelectronic acquisition system with eight passive optical markers and two triaxial accelerometers. The motion imposed by the device to the upper left limb of a healthy male subject was investigated during three test sessions, of nine cycles each.
The comparison among the two measuring setups and the analysis of the aacc and amrk fractal dimensions revealed that:
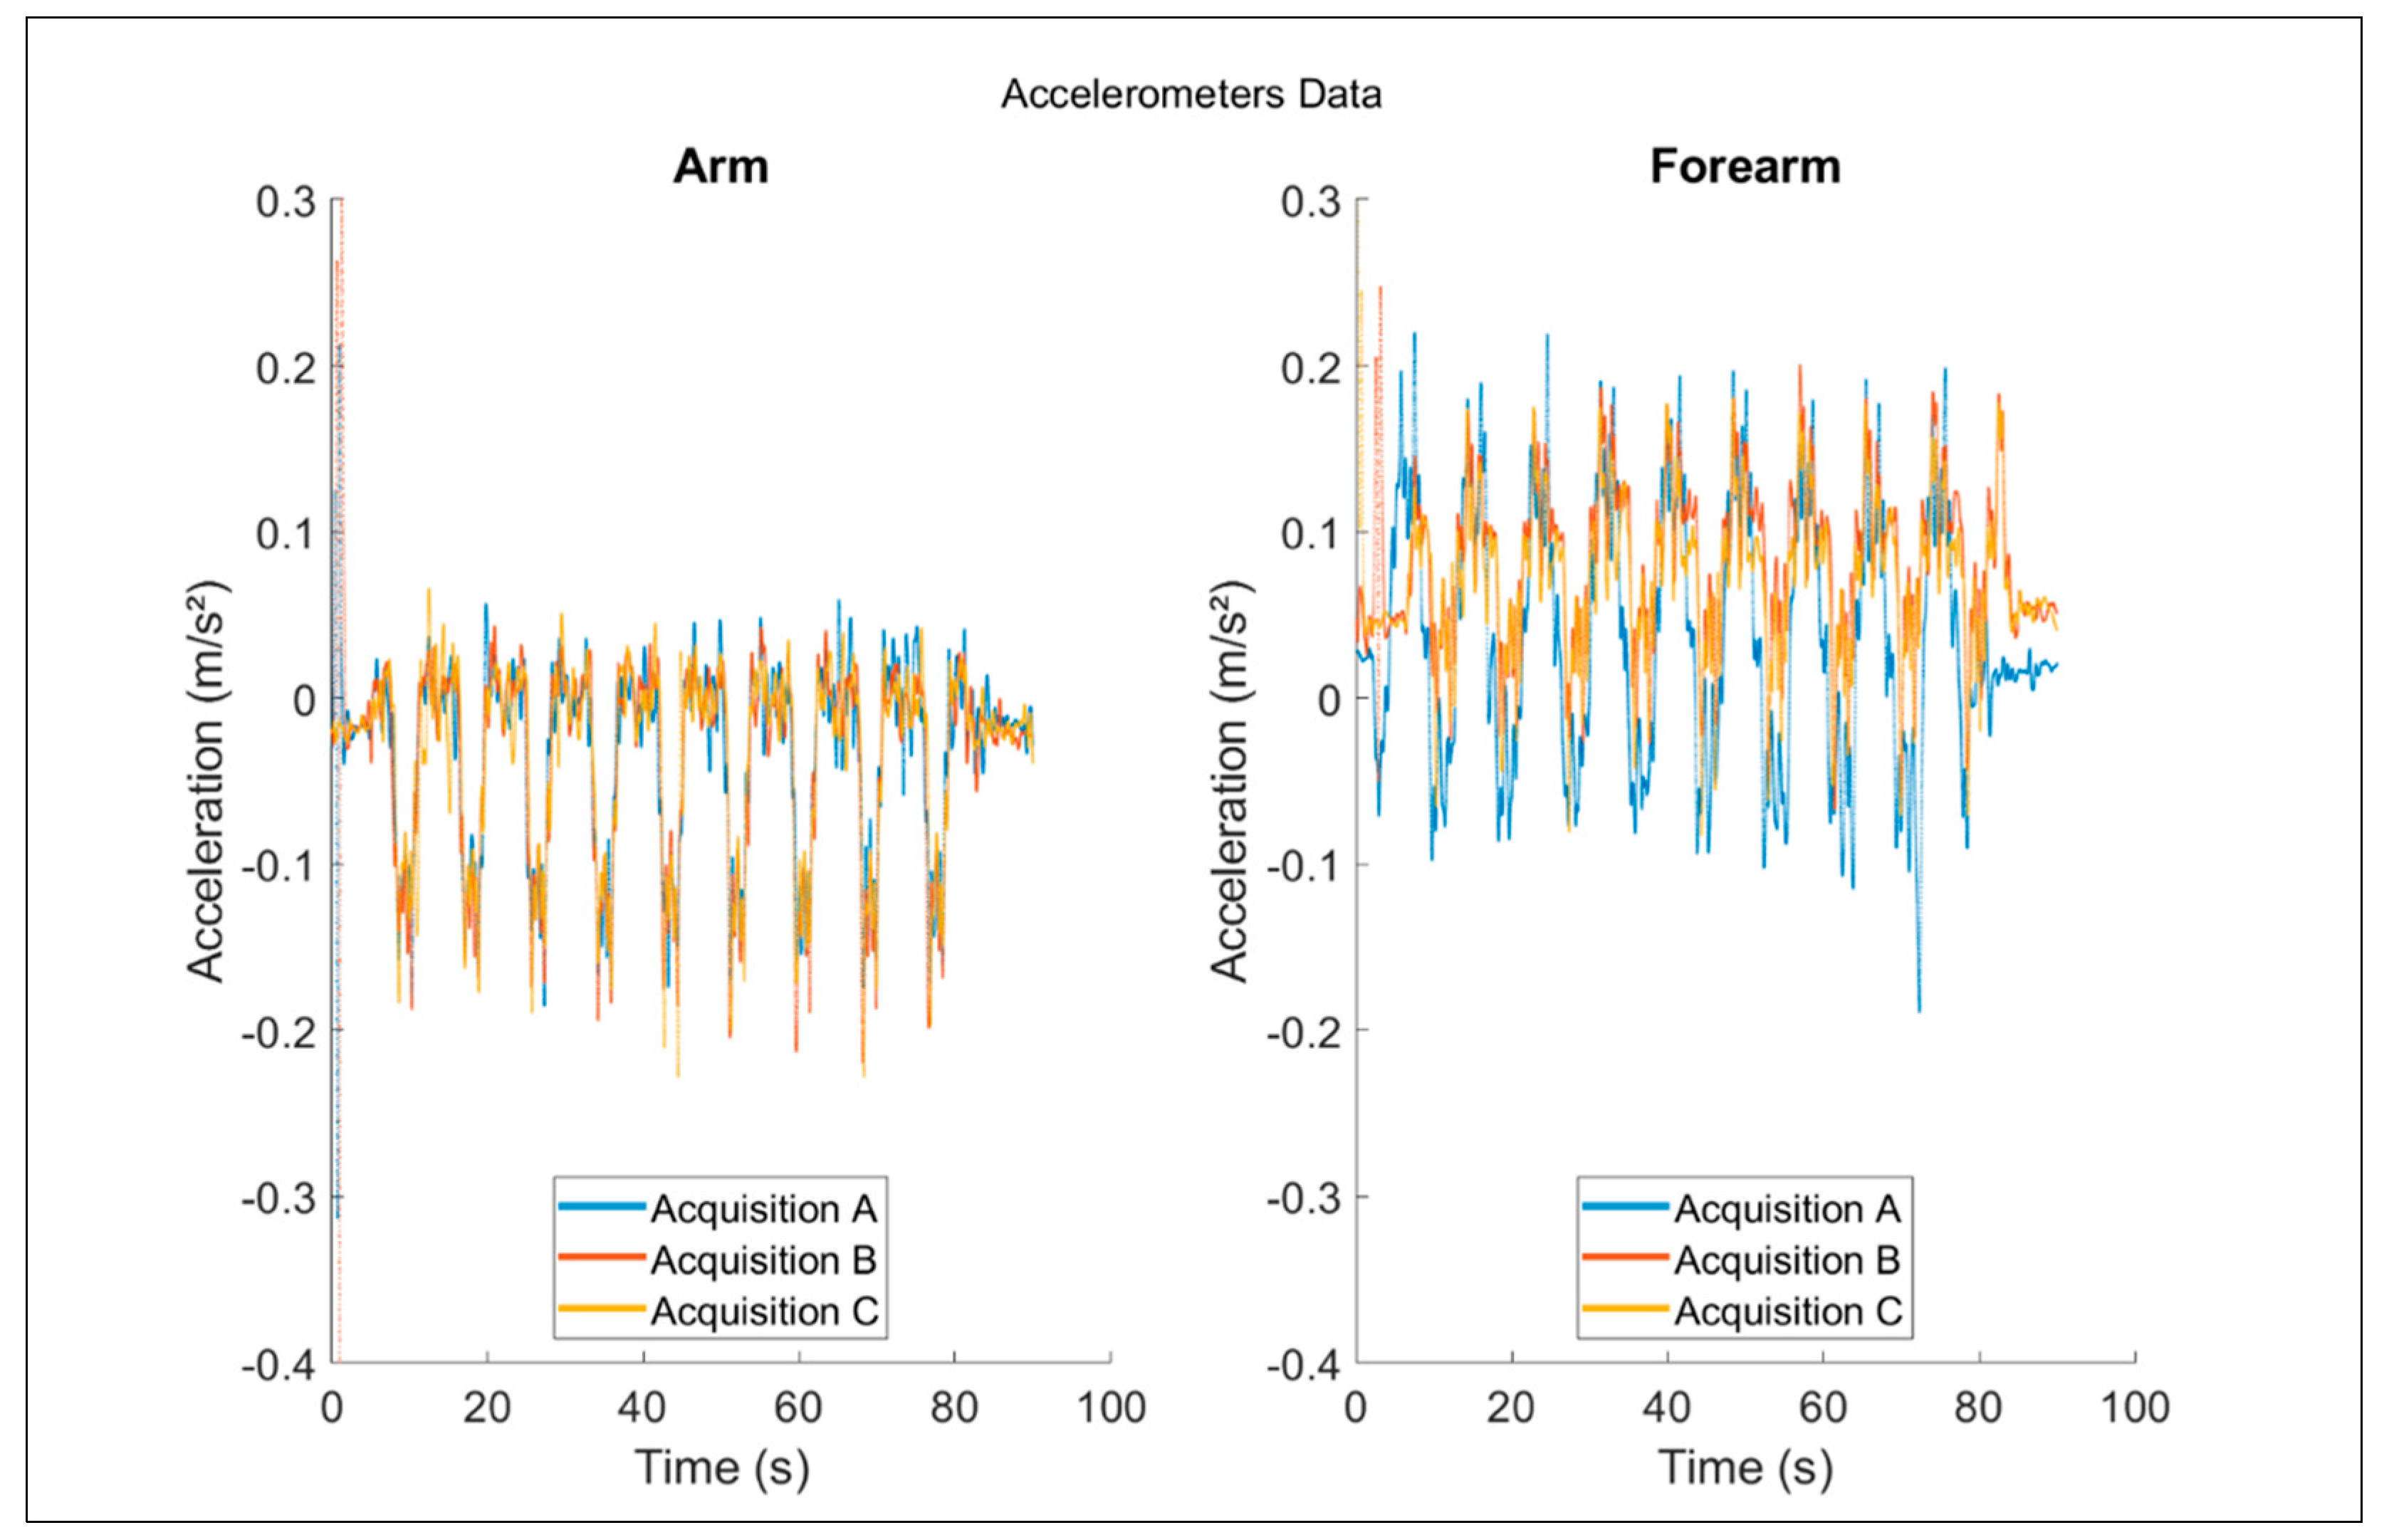
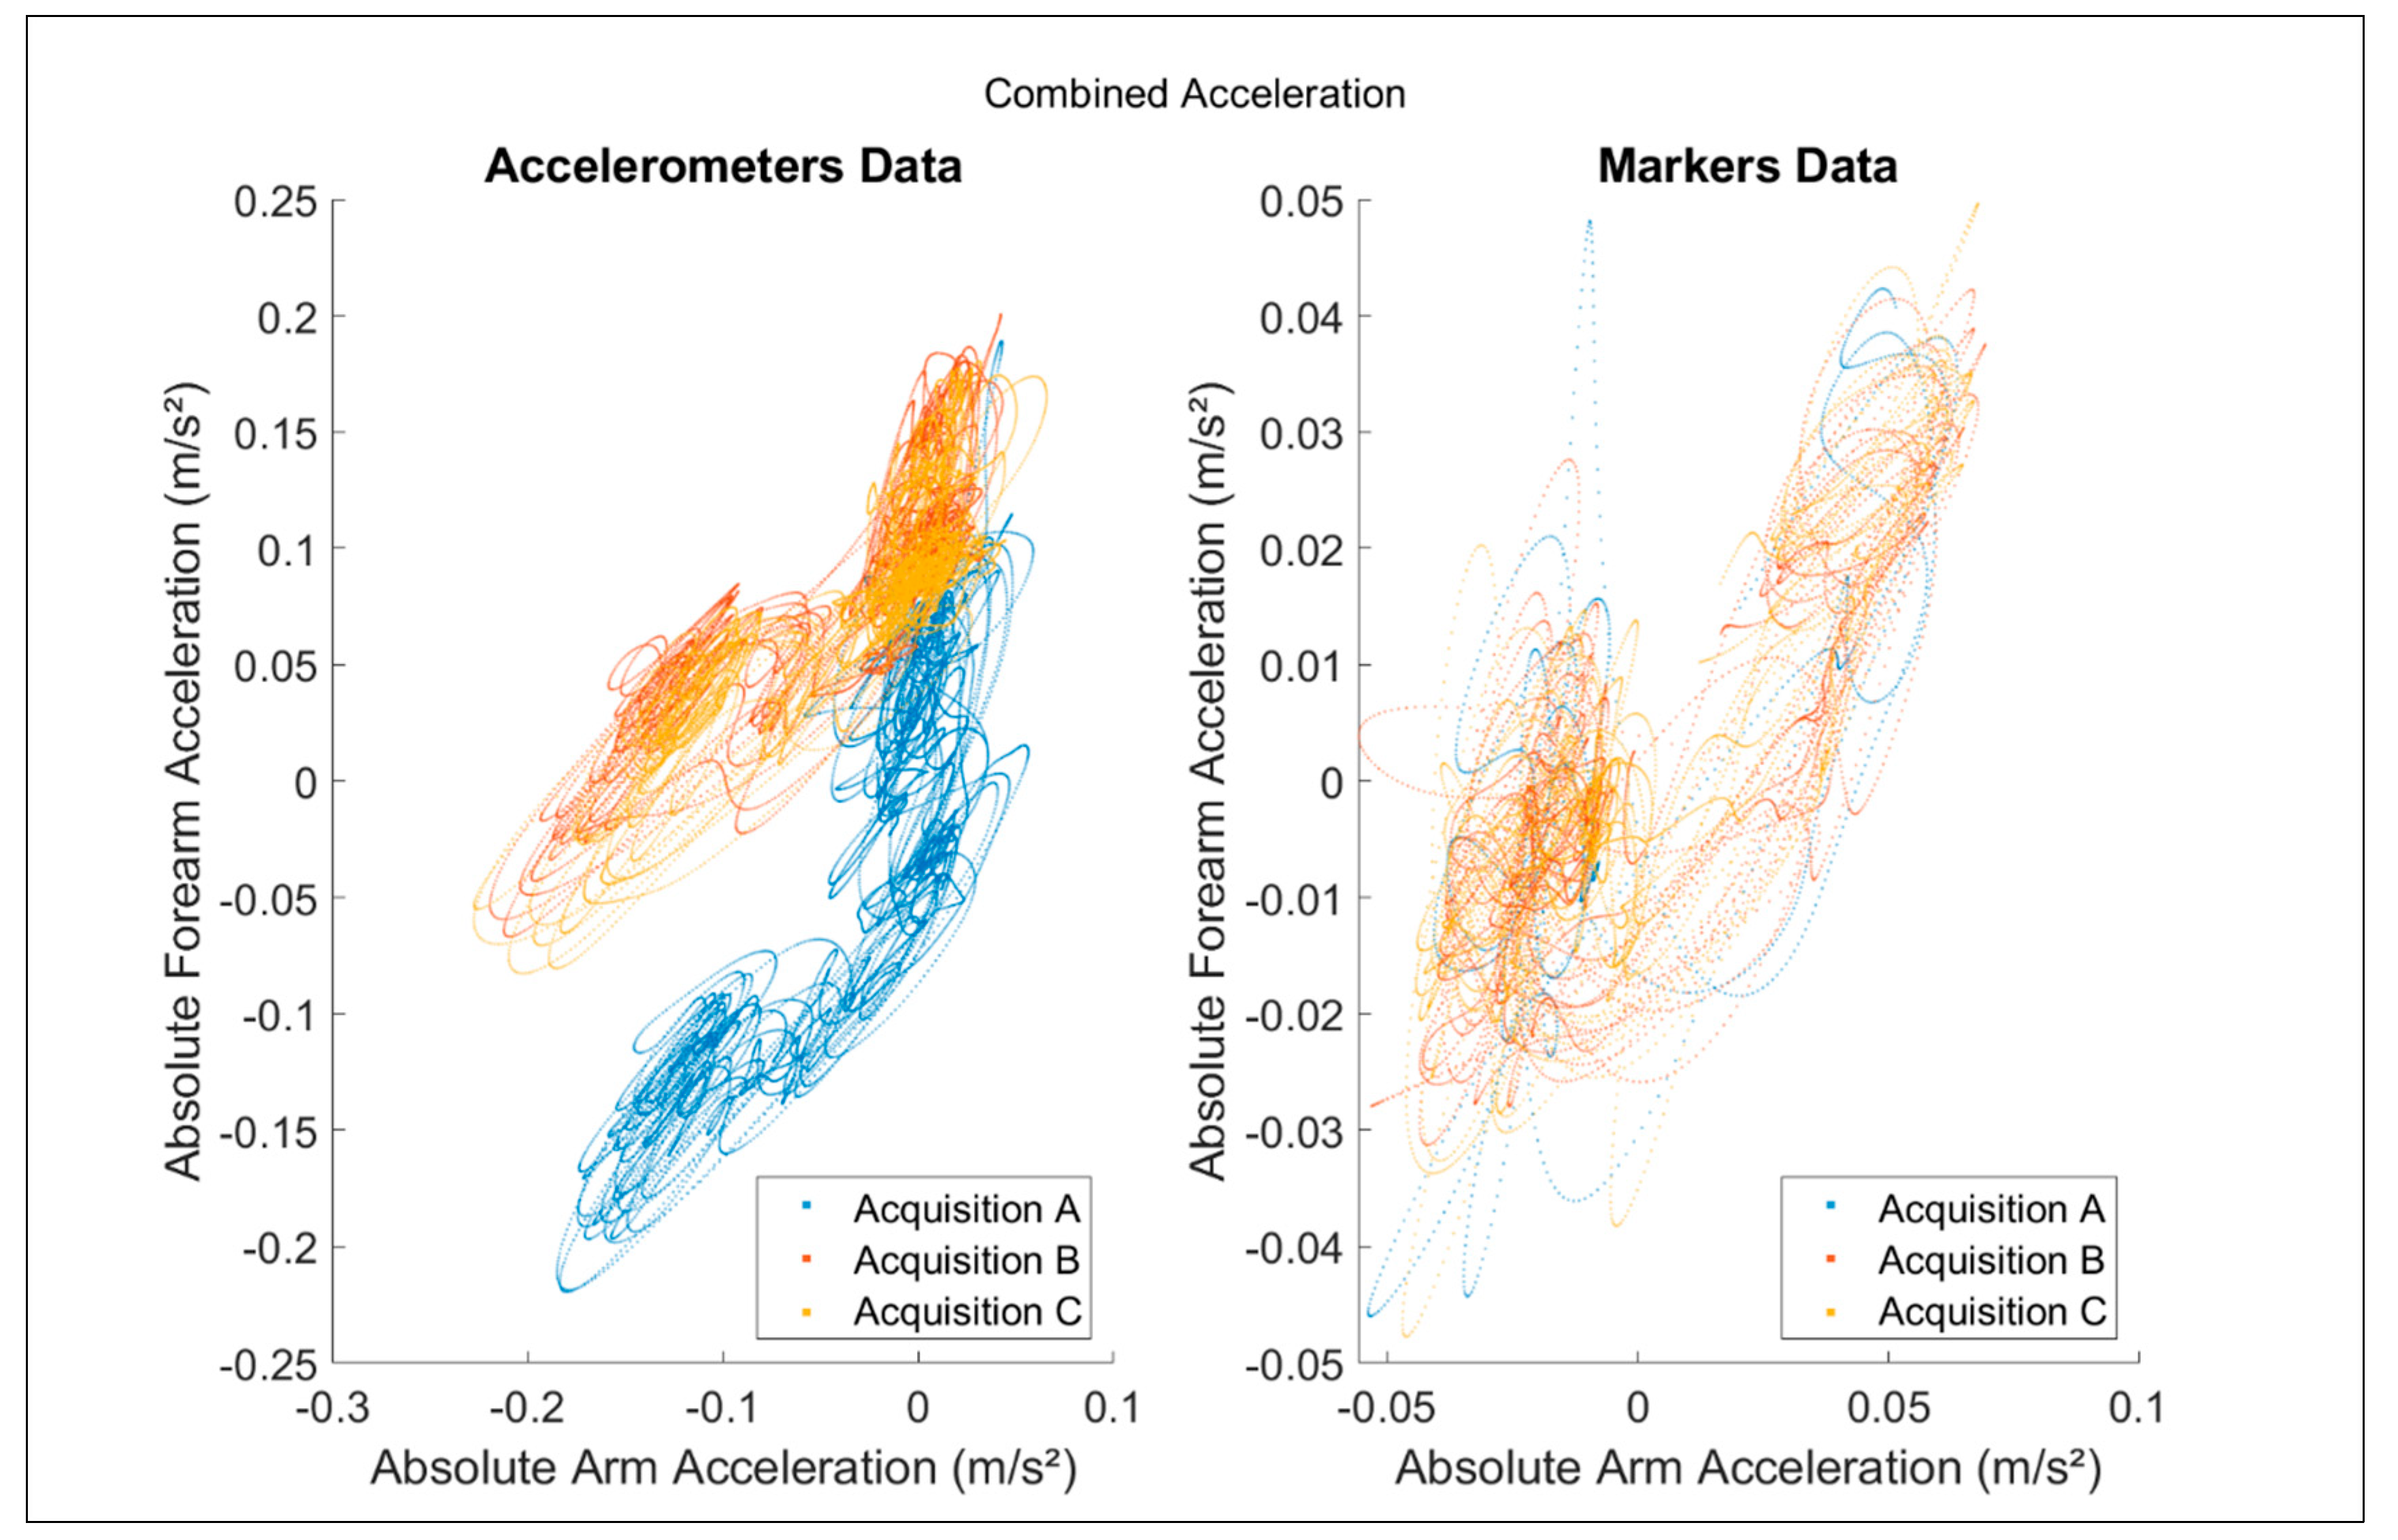
Accelerometers provide more complex information, and optical markers are more suitable for evaluating the repeatability of the subject performance;
Both the systems can be used to evaluate the acceleration of the subject’s arm and forearm, but they provide different information;
Optical markers should be preferred when analyzing the kinematic system as a whole, e.g., for the definition of the functional design of a system;
Accelerometers should be used when detailed information is needed at punctual level, like in the optimization process of a device component.
With regard to the results related to the preliminary validation of the innovative device, it can be stated that:
This preliminary analysis allowed assessing the effectiveness of the system as rehabilitation device;
Although the subject declared to experience a smooth actuation of his limb during the execution of the moment, the performed analyses revealed low frequencies vibrations of the device carter, suggesting future optimization margins for the transmission system;
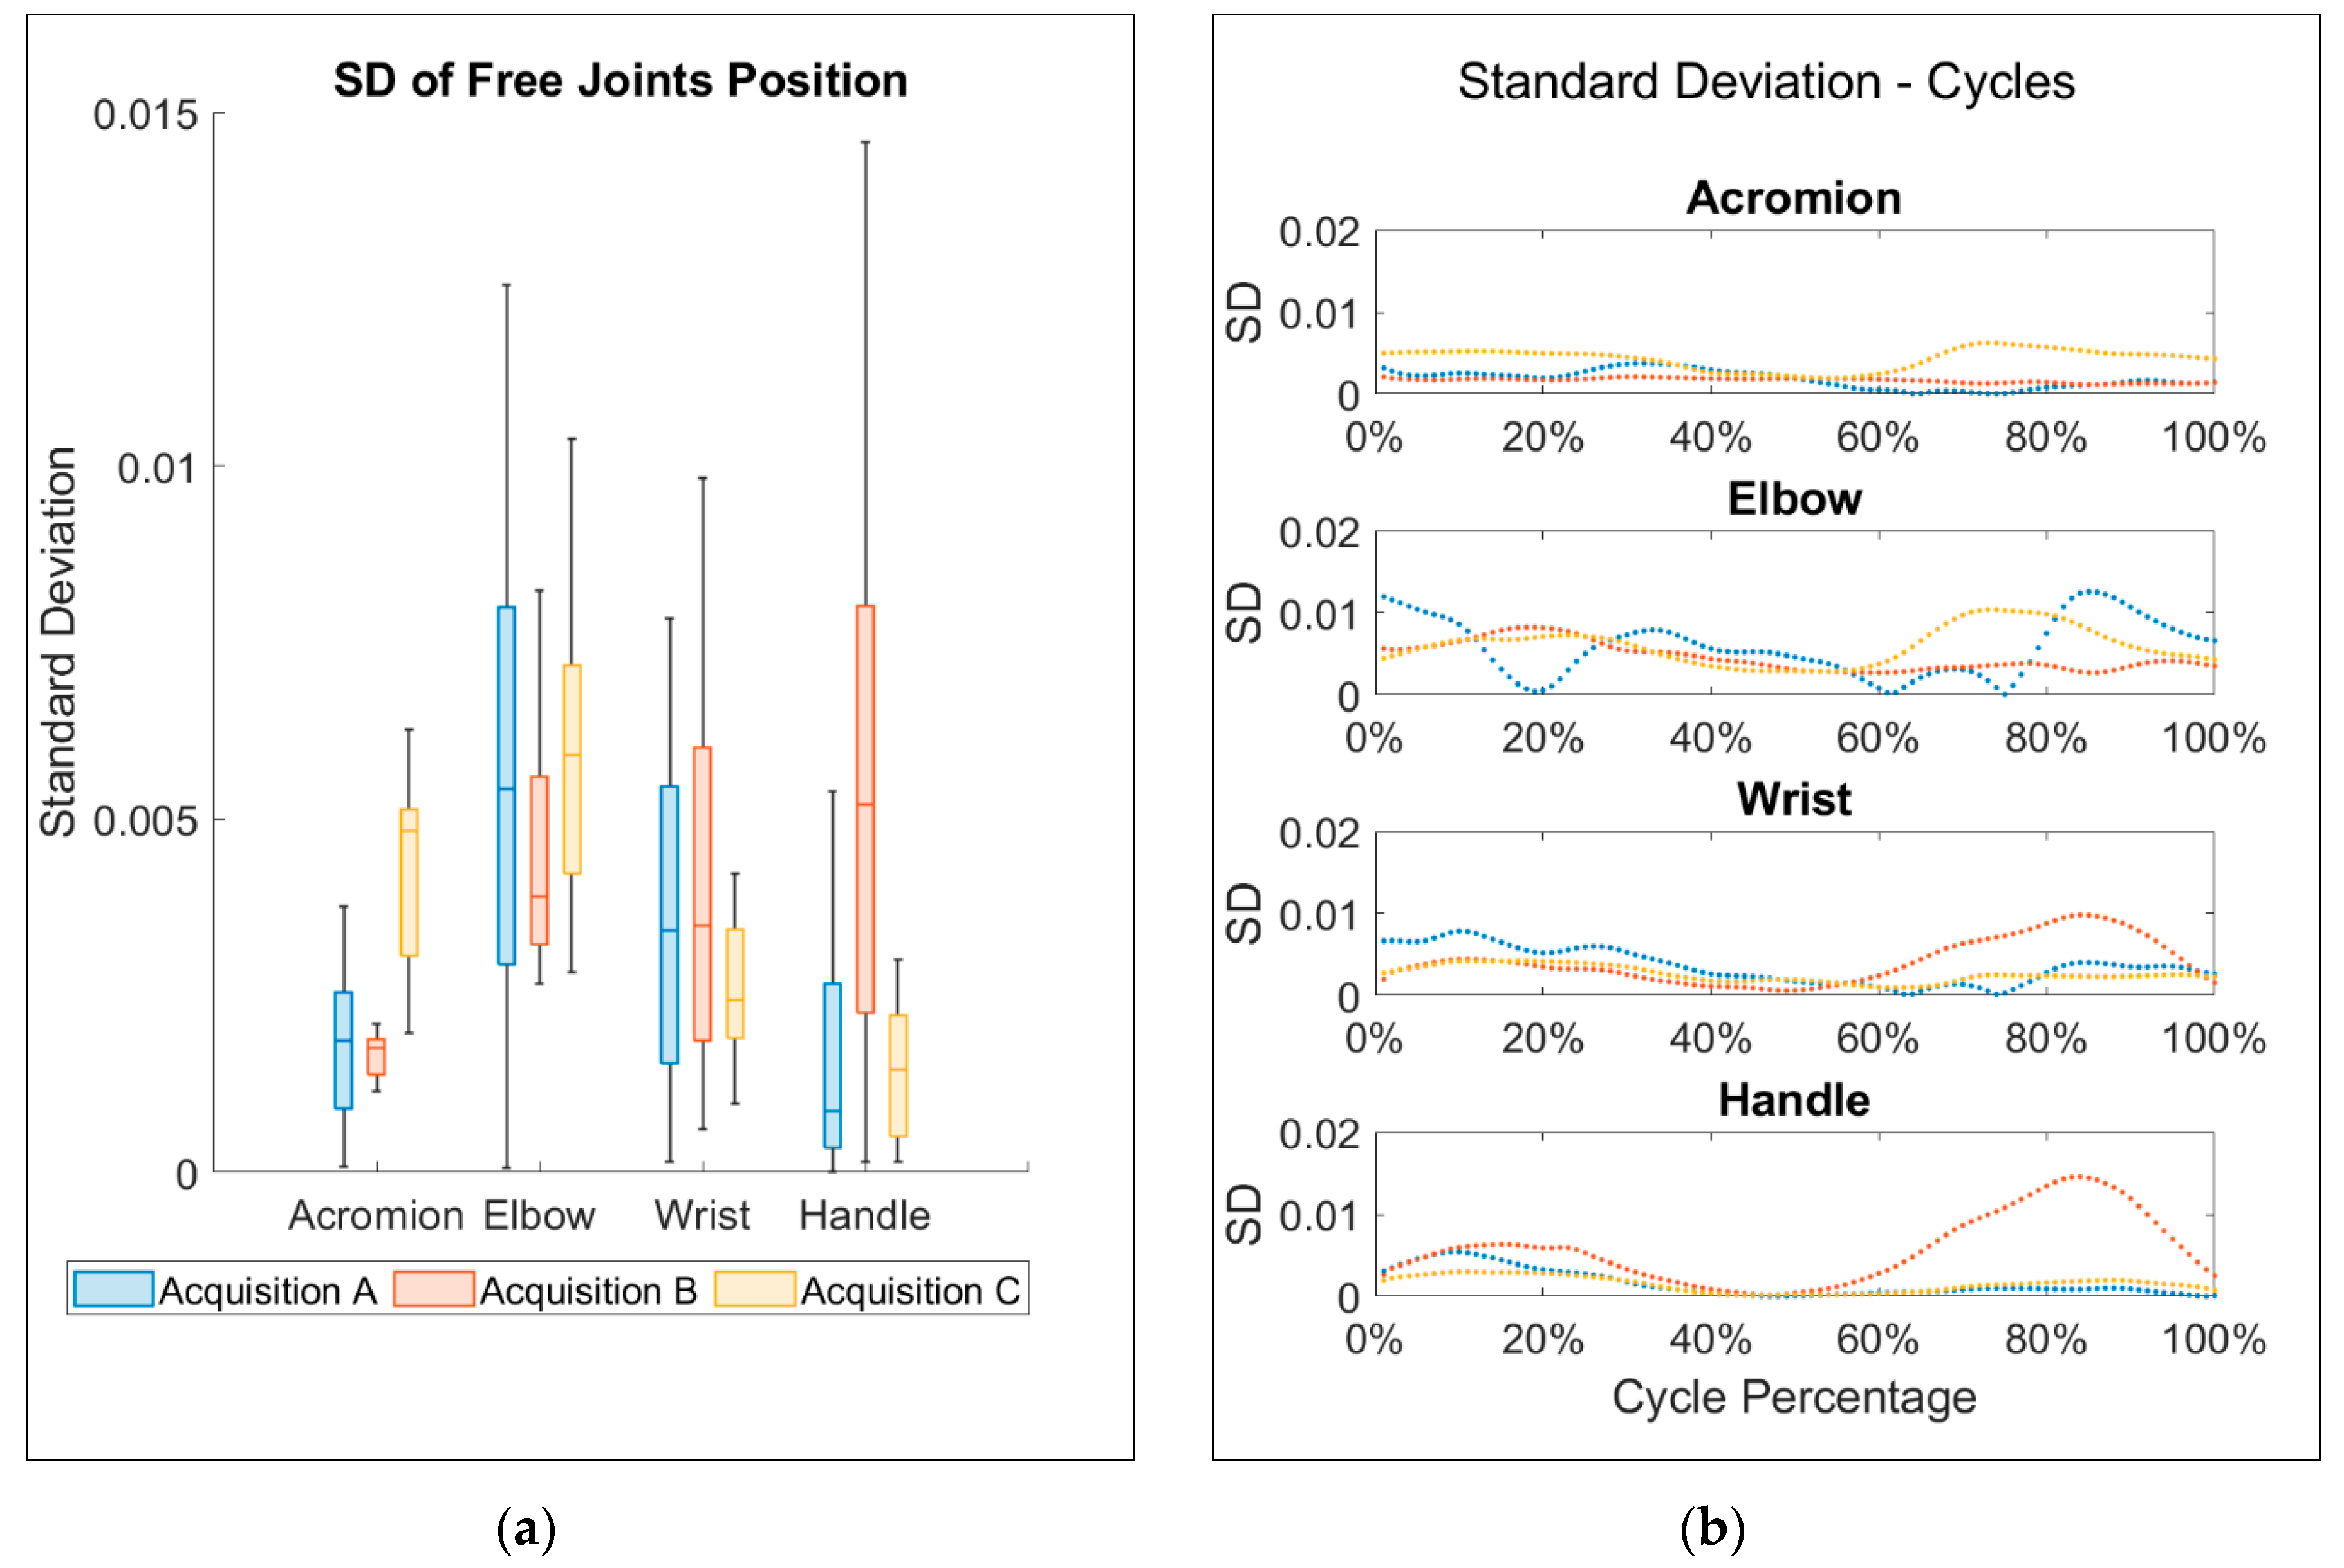
The system demonstrated a remarkable repetition accuracy: during the simulated rehabilitation sessions, the free joints of the reduced kinematic model, corresponding to the subject wrist, elbow and shoulder, presented low values of SD among cycles.

Author Contributions

Conceptualization, C.A., F.R., M.G. and M.T.; methodology, C.A., F.R. and M.G.; software, D.F. and M.T.; validation, D.F., L.B., M.G. and F.R.; formal analysis, C.A. and M.T.; data curation, F.R., M.G. and L.B.; writing—original draft preparation, C.A. and F.R.; writing—review and editing, M.G., M.T., D.F. and L.B.; funding acquisition, D.F. All authors have read and agreed to the published version of the manuscript.

Funding

This research was partially funded by Regione Lombardia (“Bando Linea R e S per aggregazioni”, 2017–2019), as part of the SIMeRiON (Innovative Mechatronics System for Orthopedic and Neurological Rehabilitation) project.

Acknowledgments

The research was supported by Polibrixia s.r.l., which provided the device, and Domus Salutis Rehabilitation Clinic, Teresa Camplani Foundation, which hosted the campaign. The authors would like to thank Federico Ceresoli and Paolo Gaffurini for the precious contribution in the data analysis and in the data acquisition process.

Conflicts of Interest

The authors declare no conflicts of interest. The funders had no role in the design of the study; in the collection, analyses, or interpretation of data, in the writing of the manuscript, or in the decision to publish the results.

References

  1. French, B.; Thomas, L.H.; Coupe, J.; McMahon, N.E.; Connell, L.; Harrison, J.; Sutton, C.J.; Tishkovskaya, S.; Watkins, C.L. Repetitive task training for improving functional ability after stroke. Cochrane Database Syst. Rev. 2016, 11, CD006073. [Google Scholar] [CrossRef] [PubMed] [Green Version]
  2. Mehrholz, J.; Pohl, M.; Platz, T.; Kugler, J.; Elsner, B. Electromechanical and robot-assisted arm training for improving activities of daily living, arm function, and arm muscle strength after stroke. Cochrane Database Syst. Rev. 2012, 13, CD006876. [Google Scholar] [CrossRef]
  3. Legg, L.A.; Lewis, S.R.; Schofield-Robinson, O.J.; Drummond, A.; Langhorne, P. Occupational therapy for adults with problems in activities of daily living after stroke. Cochrane Database Syst. Rev. 2017, 7. [Google Scholar] [CrossRef]
  4. Wolf, S.L.; Winstein, C.J.; Miller, J.P.; Taub, E.; Uswatte, G.; Morris, D.; Giuliani, C.; Light, K.E.; Nichols-Larsen, D. Effect of Constraint-Induced Movement Therapy on Upper Extremity Function 3 to 9 Months After Stroke. JAMA 2006, 296, 2095–2104. [Google Scholar] [CrossRef]
  5. Díaz, I.; Gil, J.J.; Sánchez, E. Lower-Limb Robotic Rehabilitation: Literature Review and Challenges. J. Robot. 2011, 2011, 1–11. [Google Scholar] [CrossRef]
  6. Pedrocchi, A.; Ferrante, S.; Ambrosini, E.; Gandolla, M.; Casellato, C.; Schauer, T.; Klauer, C.; Pascual, J.; Vidaurre, C.; Gföhler, M.; et al. MUNDUS project: MUltimodal Neuroprosthesis for daily Upper limb Support. J. Neuroeng. Rehabil. 2013, 10, 66. [Google Scholar] [CrossRef] [Green Version]
  7. Schröder, J.; Truijen, S.; Criekinge, T.; Saeys, W. Feasibility and effectiveness of repetitive gait training early after stroke: A systematic review and meta-analysis. J. Rehabil. Med. 2019, 51, 78–88. [Google Scholar] [CrossRef] [PubMed] [Green Version]
  8. Rosenstein, L.; Ridgel, A.L.; Thota, A.K.; Samame, B.; Alberts, J.L. Effects of combined robotic therapy and repetitive-task practice on upper-extremity function in a patient with chronic stroke. Am. J. Occup. Ther. 2008, 62, 28–35. [Google Scholar] [CrossRef] [Green Version]
  9. Maciejasz, P.; Eschweiler, J.; Gerlach-Hahn, K.; Jansen-Troy, A.; Leonhardt, S. A survey on robotic devices for upper limb rehabilitation. J. Neuroeng. Rehabil. 2014, 11, 3. [Google Scholar] [CrossRef] [Green Version]
  10. Pinto-Fernandez, D.; Etorricelli, D.; Sanchez-Villamanan, M.D.C.; Aller, F.; Mombaur, K.; Conti, R.; Vitiello, N.; Moreno, J.; Pons, J.L. Performance Evaluation of Lower Limb Exoskeletons: A Systematic Review. IEEE Trans. Neural Syst. Rehabil. Eng. 2020, 28, 1573–1583. [Google Scholar] [CrossRef] [PubMed]
  11. Ercolini, G.; Trigili, E.; Baldoni, A.; Crea, S.; Vitiello, N. A Novel Generation of Ergonomic Upper-Limb Wearable Robots: Design Challenges and Solutions. Robotica 2018, 37, 2056–2072. [Google Scholar] [CrossRef]
  12. Krebs, H.I.; Hogan, N.; Aisen, M.L.; Volpe, B.T. Robot-aided neurorehabilitation. IEEE Trans. Rehabil. Eng. 1998, 6, 75–87. [Google Scholar] [CrossRef] [PubMed] [Green Version]
  13. Schiele, A.; Van Der Helm, F.C.T. Kinematic Design to Improve Ergonomics in Human Machine Interaction. IEEE Trans. Neural Syst. Rehabil. Eng. 2006, 14, 456–469. [Google Scholar] [CrossRef] [PubMed]
  14. Xiong, C.-H.; Chen, W.-R.; Sun, B.-Y.; Liu, M.-J.; Yue, S. Design and Implementation of an Anthropomorphic Hand for Replicating Human Grasping Functions. IEEE Trans. Robot. 2016, 32, 652–671. [Google Scholar] [CrossRef]
  15. Welleweerd, M.K.; Siepel, F.J.; Groenhuis, V.; Veltman, J.; Stramigioli, S. Design of an end-effector for robot-assisted ultrasound-guided breast biopsies. Int. J. Comput. Assist. Radiol. Surg. 2020, 15, 681–690. [Google Scholar] [CrossRef] [Green Version]
  16. Gupta, A.; O’Malley, M.K.; Patoglu, V.; Burgar, C. Design, Control and Performance ofRiceWrist:A Force Feedback Wrist Exoskeleton for Rehabilitation and Training. Int. J. Robot. Res. 2008, 27, 233–251. [Google Scholar] [CrossRef]
  17. Lum, P.; Reinkensmeyer, D.; Mahoney, R.; Rymer, W.Z.; Burgar, C. Robotic Devices for Movement Therapy After Stroke: Current Status and Challenges to Clinical Acceptance. Top. Stroke Rehabil. 2002, 8, 40–53. [Google Scholar] [CrossRef]
  18. Rastegarpanah, A.; Saadat, M.; Borboni, A. Parallel Robot for Lower Limb Rehabilitation Exercises. Appl. Bionics Biomech. 2016, 2016, 1–10. [Google Scholar] [CrossRef] [Green Version]
  19. Takahashi, C.D.; Der-Yeghiaian, L.; Le, V.; Motiwala, R.R.; Cramer, S.C. Robot-based hand motor therapy after stroke. Brain 2008, 131, 425–437. [Google Scholar] [CrossRef]
  20. Nathan, D.E.; Johnson, M.J.; McGuire, J. Feasibility of integrating FES grasp assistance with a task-oriented robot-assisted therapy environment: A case study. In Proceedings of the 2008 2nd IEEE RAS & EMBS International Conference on Biomedical Robotics and Biomechatronics, Scottsdale, AZ, USA, 19–22 October 2008; pp. 807–812. [Google Scholar]
  21. Oda, K.; Isozumi, S.; Ohyama, Y.; Tamida, K.; Kikuchi, T.; Furusho, J. Development of isokinetic and iso-contractile exercise machine “MEM-MRB” using MR brake. In Proceedings of the 2009 IEEE International Conference on Rehabilitation Robotics, Kyoto, Japan, 23–26 June 2009; pp. 6–11. [Google Scholar]
  22. Kung, P.-C.; Ju, M.-S.; Lin, C.-C.K. Design of a forearm rehabilitation robot. In Proceedings of the 2007 IEEE 10th International Conference on Rehabilitation Robotics, Noordwijk, The Netherlands, 12–15 June 2007; ICORR: Morgan, UT, USA, 2007; pp. 228–233. [Google Scholar]
  23. Tiboni, M.; Legnani, G.; Lancini, M.; Serpelloni, M.; Gobbo, M.; Fausti, D. ERRSE: Elbow Robotic Rehabilitation System with an EMG-Based Force Control. In New Advances in Mechanism and Machine Science; Springer International Publishing: Basel, Switzerland, 2017; pp. 892–900. [Google Scholar]
  24. Tiboni, M.; Borboni, A.; Faglia, R.; Pellegrini, N. Robotics rehabilitation of the elbow based on surface electromyography signals. Adv. Mech. Eng. 2018, 10, 2. [Google Scholar] [CrossRef]
  25. Reiman, M.P.; Lorenz, D.S. Integration of Strength and Conditioning Principles into a Rehabilitation Program. Int. J. Sports Phys. Ther. 2011, 6, 241–253. Available online: http://www.ncbi.nlm.nih.gov/pubmed/21904701 (accessed on 16 May 2019). [PubMed]
  26. Gao, S.; Wang, Y.; Fang, C.; Xu, L. A Smart Terrain Identification Technique Based on Electromyography, Ground Reaction Force, and Machine Learning for Lower Limb Rehabilitation. Appl. Sci. 2020, 10, 2638. [Google Scholar] [CrossRef] [Green Version]
  27. Mezzina, G.; Aprigliano, F.; Micera, S.; Monaco, V.; De Venuto, D. EEG/EMG based Architecture for the Early Detection of Slip-induced Lack of Balance. In Proceedings of the 2019 IEEE 8th International Workshop on Advances in Sensors and Interfaces (IWASI), Otranto, Italy, 13–14 June 2019. [Google Scholar]
  28. Sonenblum, S.E.; Sprigle, S.; Caspall, J.; Lopez, R. Validation of an accelerometer-based method to measure the use of manual wheelchairs. Med. Eng. Phys. 2012, 34, 781–786. [Google Scholar] [CrossRef] [PubMed]
  29. Laidig, D.; Seel, T. Deriving kinematic quantities from accelerometer readings for assessment of functional upper limb motions. Curr. Dir. Biomed. Eng. 2017, 3, 573–576. [Google Scholar] [CrossRef]
  30. Daponte, P.; De Vito, L.; Sementa, C. Validation of a home rehabilitation system for range of motion measurements of limb functions. In Proceedings of the 2013 IEEE International Symposium on Medical Measurements and Applications (MeMeA), Gatineau, QC, Canada, 4–5 May 2013; pp. 288–293. [Google Scholar]
  31. Buongiorno, D.; Barsotti, M.; Barone, F.; Bevilacqua, V.; Frisoli, A. A Linear Approach to Optimize an EMG-Driven Neuromusculoskeletal Model for Movement Intention Detection in Myo-Control: A Case Study on Shoulder and Elbow Joints. Front. Neurorobotics 2018, 12, 1–12. [Google Scholar] [CrossRef]
  32. Faglia, R.; Fausti, D.; Antonini, M.; Petrogalli, G.; Mor, M.; Vertuan, A. Physical Exercise Machine. EP2865363A1, 29 April 2015. [Google Scholar]
  33. Ceresoli, F.; Aggogeri, F.; Amici, C.; Borboni, A.; Faglia, R.; Pellegrini, N.; Tiboni, M.; Antonini, M.; Fausti, D.; Mor, M.; et al. Differential system for limb rehabilitation. In Proceedings of the 6th International Workshop on New Trends in Medical and Service Robotics (MESROB 2018), Cassino, Italy, 4–6 July 2018; pp. 1–8. [Google Scholar]
  34. Bussola, R.; Faglia, R.; Incerti, G.; Biazzi, P.; Locatelli, V. Innovative mechanical devices as servo-system components for automation. In Proceedings of the IASTED International Conference on Modelling Identification and Control, Innsbruck, Austria, 10–13 February 2003; pp. 370–377. [Google Scholar]
  35. Legnani, G.; Casolo, F.; Righettini, P.; Zappa, B. A homogeneous matrix approach to 3D kinematics and dynamics—I. Theory. Mech. Mach. Theory 1996, 31, 573–587. [Google Scholar] [CrossRef]
  36. Legnani, G.; Casalo, F.; Righettini, P.; Zappa, B. A homogeneous matrix approach to 3D kinematics and dynamics—II. Applications to chains of rigid bodies and serial manipulators. Mech. Mach. Theory 1996, 31, 589–605. [Google Scholar] [CrossRef]
  37. Mandelbrot, B.B.; Wheeler, J.A. The Fractal Geometry of Nature. Am. J. Phys. 1983, 51, 286–287. [Google Scholar] [CrossRef]
  38. Ganea, R.; Paraschiv-Ionescu, A.; Büla, C.; Rochat, S.; Aminian, K. Multi-parametric evaluation of sit-to-stand and stand-to-sit transitions in elderly people. Med. Eng. Phys. 2011, 33, 1086–1093. [Google Scholar] [CrossRef]
  39. Błaszczyk, J.W.; Klonowski, W. Postural stability and fractal dynamics. Acta Neurobiol. Exp. 2001, 61, 105–112. [Google Scholar]
  40. Sekine, M.; Akay, M.; Tamura, T.; Higashi, Y.; Fujimoto, T. Fractal dynamics of body motion in patients with Parkinson’s disease. J. Neural Eng. 2004, 1, 8–15. [Google Scholar] [CrossRef] [PubMed]
  41. Akay, M.; Sekine, M.; Tamura, T.; Higashi, Y.; Fujimoto, T. Fractal dynamics of body motion in post-stroke hemiplegic patients during walking. J. Neural Eng. 2004, 1, 111–116. [Google Scholar] [CrossRef]
  42. Boshoff, H.F.V. A fast box counting algorithm for determining the fractal dimension of sampled continuous functions. In Proceedings of the 1992 South African Symposium on Communications and Signal Processing, Cape Town, South Africa, 11 September 1992; pp. 43–48. [Google Scholar]
  43. Nguyen, T.; Hausdorff (Box-Counting) Fractal Dimension with multi-resolution calculation. MATLAB Central File Exchange. Available online: https://www.mathworks.com/matlabcentral/fileexchange/58148-hausdorff-box-counting-fractal-dimension-with-multi-resolution-calculation (accessed on 16 May 2019).
  44. Bussmann, J.B.J.; Martens, W.L.J.; Tulen, J.H.M.; Schasfoort, F.C.; Berg-Emons, H.J.G.V.D.; Stam, H.J. Measuring daily behavior using ambulatory accelerometry: The Activity Monitor. Behav. Res. Methods Instrum. Comput. 2001, 33, 349–356. [Google Scholar] [CrossRef] [PubMed] [Green Version]
  45. Amici, C.; Ghidoni, M.; Ceresoli, F.; Gaffurini, P.; Bissolotti, L.; Mor, M.; Fausti, D.; Antonini, M.; Ragni, F.; Tiboni, M. Preliminary Validation of a Device for the Upper and Lower Limb Robotic Rehabilitation. In Proceedings of the 2019 23rd International Conference on Mechatronics Technology (ICMT), SALERNO, Italy, 23–26 October 2019; pp. 1–6. [Google Scholar] [CrossRef]
  46. Ragni, F.; Amici, C.; Borboni, A.; Faglia, R.; Cappellini, V.; Pedersini, P.; Villafañe, J.H. Effects of Soft Tissue Artifact in the Measurement of Hand Kinematics. Int. Rev. Mech. Eng. (IREME) 2020, 14, 230. [Google Scholar] [CrossRef]
  47. Negrini, S.; Serpelloni, M.; Amici, C.; Gobbo, M.; Silvestro, C.; Buraschi, R.; Borboni, A.; Crovato, D.; Lopomo, N. Use of Wearable Inertial Sensor in the Assessment of Timed-Up-and-Go Test: Influence of Device Placement on Temporal Variable Estimation. In Proceedings of the International Conference on Wireless Mobile Communication and Healthcare, Milan, Italy, 14–15 November 2016; pp. 310–317. [Google Scholar]
  48. Piovanelli, B.; Amici, C.; Cappellini, V.; Borboni, A.; Negrini, S. P106: Functional assessment of the spine through an optoelectronic system in spinal disorders. Gait Posture 2017, 57, 349–350. [Google Scholar] [CrossRef]
  49. Pedersini, P.; Villafañe, J.; Piovanelli, B.; Cappellini, V.; Buraschi, R.; Pollet, J.; Negrini, S. P 106—Intra- and inter-operator reliability of a novel hand protocol during grip movement in healthy subjects. Gait Posture 2018, 65, 409–410. [Google Scholar] [CrossRef]
Figure 1. Kinematic scheme of the device: the transmission of the motion is realized thanks to a belt-based differential mechanism. Among the six pulleys of the mechanism, two are powered (pulleys (1) and (2) of the figure).
Electronics 09 01751 g001
Figure 2. Positioning of accelerometers, indicated with the yellow frames, and of the markers, identified by the red frames. Circles are used for the markers of the moving elements, and square frames for the markers adopted for the environment analysis.
Electronics 09 01751 g002
Figure 3. From the left, (a) the simplified kinematic model, and (b) the complete kinematic model.
Electronics 09 01751 g003
Figure 4. Frequency spectrum of the displacement signals of distal and proximal device markers, and of their mean profile.
Electronics 09 01751 g004
Figure 5. Repeatability of the joints movement for the example Session C; from left to right, up to down, the displacement of the marker on acromion, elbow, wrist and handle.
Electronics 09 01751 g005
Figure 6. From the left, (a) mean position of the joints of the reduced kinematic model, with respect to the cycle percentage, and (b) boxplot comparison of the same mean signals. Colors refers to the three analyzed acquisitions: blue for A, red for B, and yellow for C.
Electronics 09 01751 g006
Figure 7. From the left, (a) standard deviation of the moving markers with respect to the cycle percentage, and (b) boxplot comparison of the same SD values. Blue for acquisition A, red for B, and yellow for C.
Electronics 09 01751 g007
Figure 8. From the left, aacc signals of arm and forearm with respect to time. Colors refer to the acquisitions: blue for Acquisition A, red for B, and yellow for C.
Electronics 09 01751 g008
Figure 9. From the left, the absolute accelerations aacc and amrk of the arm with respect to the forearm, for all the acquisitions: blue for Acquisition A, red for B, and yellow for C.
Electronics 09 01751 g009
Table 1. Values of the mean displacement signal for the two environmental markers located on the device during the three acquisition sessions.
Sessions
Session A
(Medial Radius)
Session B
(Medial Ulna)
Session C
(Medial Ulna)
DeviceSD (mm)<0.3000.518<0.300
Maximum variation (mm)<0.300<0.300<0.300
Table 2. Fractal dimension of the combined acceleration signals arm versus forearm for the two measurement systems, for the three acquisitions.
Arm Absolute Acceleration Vs Forearm Absolute AccelerationFractal Dimension
Session A (Medial Radius)Session B (Medial Ulna)Session C (Medial Ulna)
Accelerometers 1.40911.41131.4144
Optical Markers1.14871.19611.2264
Publisher’s Note: MDPI stays neutral with regard to jurisdictional claims in published maps and institutional affiliations.

