Article

Requirements for Validation of Dynamic Wind Turbine Models: An International Grid Code Review

by
Raquel Villena-Ruiz
1,
Andrés Honrubia-Escribano
1,
Francisco Jiménez-Buendía
2,
Ángel Molina-García
3 and
Emilio Gómez-Lázaro
1,*
1
Renewable Energy Research Institute and DIEEAC-ETSII-AB, Universidad de Castilla-La Mancha, 02071 Albacete, Spain
2
Siemens Gamesa Renewable Energy, S.A., 31621 Pamplona, Spain
3
Department of Electrical Engineering, Universidad Politécnica de Cartagena, 30202 Cartagena, Spain
*
Author to whom correspondence should be addressed.
Electronics 2020, 9(10), 1707; https://doi.org/10.3390/electronics9101707
Submission received: 21 September 2020 / Revised: 9 October 2020 / Accepted: 13 October 2020 / Published: 17 October 2020

Abstract

:
Wind power is positioned as one of the fastest-growing energy sources today, while also being a mature technology with a strong capacity for creating employment and guaranteeing environmental sustainability. However, the stochastic nature of wind may affect the integration of power plants into power systems and the availability of generation capacity. In this sense, as in the case of conventional power plants, wind power installations should be able to help maintain power system stability and reliability. To help achieve this objective, a significant number of countries have developed so-called grid interconnection agreements. These are designed to define the technical and behavioral requirements that wind power installations, as well as other power plants, must comply with when seeking connection to the national network. These documents also detail the tasks that should be conducted to certify such installations, so these can be commercially exploited. These certification processes allow countries to assess wind turbine and wind power plant simulation models. These models can then be used to estimate and simulate wind power performance under a variety of scenarios. Within this framework, and with a particular focus on the new Spanish grid code, the present paper addresses the validation process of dynamic wind turbine models followed in three countries—Spain, Germany and South Africa. In these three countries, and as a novel option, it has been proposed that these models form part of the commissioning and certification processes of wind power plants.

1. Introduction

Of all non-dispatchable Renewable Energy Sources (RES), wind power is the most significant in terms of electricity generation in current power systems. In 2019, the total wind power capacity installed worldwide was 651 GW [1], which is a 19% increase on the figure for 2018. China and the US top the list of countries in new wind power capacity installed during 2019, while Europe installed a total of 15.4 GW of wind capacity during the same year [2]. In line with this, approximately 76 GW of new wind power capacity is expected to be installed around the world during 2020 [1]. Thus, wind power is unquestionably one of the fastest-growing energy sources, and this is partly due to the maturity of this RES from a technological viewpoint.
Nevertheless, the importance of wind power does not only relate to its unstoppable growth, but also to its capacity to create employment and reduce emissions. Furthermore, wind power is a source of energy widely supported by society, represents an economic boost for countries, guarantees environmental sustainability and contributes to reducing energy prices. In Spain, approximately 24,000 people work in the wind power industry [3]. The sector creates five times more jobs than other conventional power technologies, and operates in more than 200 manufacturing locations [4]. Moreover, wind energy avoided the emission of 28 million tonnes of CO 2 , accounting for 0.31% of Spanish Gross Domestic Product (GDP) and reduced the price of the pool in Spain by 6.83 €/MWh in 2018 [3].
Unlike conventional power plants, which are able to support and contribute to the stability of the transmission system, the stochastic nature of renewable resources may affect the integration of renewable power plants into power systems. This introduces uncertainty and affects system stability and reliability. Moreover, the planning of electricity supply is often affected by RES. This is also due to RES-based power plants being decoupled from the grid by converters, which makes this type of source insensitive to voltage and frequency control. Thus, the increasing integration of electronics-based power plants leads to forecasting errors and notable uncertainties.
Therefore, in order to maintain the reliability and stability of power systems, Wind Power Plants (WPP) should also be able to contribute to both frequency and voltage regulation [5], and should be able to remain connected to the grid during faults [6]. In this sense, most countries have developed their own grid interconnection agreements, usually issued by their corresponding Transmission System Operators (TSO). These grid codes typically define the requirements that WPPs must comply with under grid disturbances [7], detailing the main steps that must be followed to certify their performance. For instance, these requirements are especially strict in countries with islanding power systems, such as Ireland and the UK [8]. The different grid codes, which are increasingly more restrictive and demanding, are also a challenge for Wind Turbine (WT) manufacturers because they must be able to develop and adapt their technology and machines to the new requirements.
The majority of grid codes concerning WPPs collect information on the necessary requirements for Fault Ride-Through (FRT) capability [9,10], active power regulation and frequency control [11], as well as reactive power–voltage regulation. Likewise, they establish the limits of grid voltage and frequency. Works such as [12] provide an interesting overview of the technical requirements addressed by different national grid codes, discussing their common criteria in detail. There are other interesting works addressing national technical specifications, such as [13], which compares China and US wind power integration grid codes, or [14], which compares the grid code in Bangladesh with those defined in other countries. In [15], the requirements for offshore generation of wind power are reviewed. A comparative analysis of different grid codes concerning offshore installations is conducted in [16]. Sourkounis et al. [17] describes the requirements for Low-Voltage-Ride-Through (LVRT) and active and reactive power control in several European countries, while the Turkish grid code is described in [18]. Finally, [19] performs a review of the grid codes implemented by different countries, with a particular focus on the adaptation of the Indonesian grid code towards the integration of renewables. In this line, one of the most comprehensive studies addressing the requirements established by a significant number of different grid codes is found in [20]. This work reviews the requirements for wind power integration in 12 countries, providing updated information and covering subjects from reactive power and frequency issues to power forecasting.
In view of the above, there is clearly sufficient information about the technical requirements to be complied with by WPPs when connected to the grid in different countries, and comparative studies on this topic can also be found in the scientific literature. However, the behavioral validation of dynamic WT simulation models as part of the certification processes of wind power installations is an increasingly important aspect that has not yet been addressed in any scientific publication. This is because it is a new feature not included in all grid codes. WT simulation models are representations of actual WTs. Therefore, model validation is required to assess the quality and accuracy of the dynamic model, and this is done by comparing the simulation results with field measurements conducted on the actual WT. WT model validation is a four-step process: (i) WT model definition; (ii) field measurements; (iii) model simulation of measured grid events; and (iv) comparison of simulated and measured results. Finally, the dynamic WT simulation model is considered validated with regard to the actual WT if the deviation between both data series is kept within the limits defined in the validation guidelines considered.
Therefore, the present paper addresses the validation processes of WT models detailed in three grid codes, namely the Spanish, German and South African grid codes. These countries were chosen since they use dynamic WT models as a novel option to verify the behavior of a WPP. We focus particularly in the case of Spain. Our paper thus provides information on when a WT simulation model can be considered validated and ready to be used as part of the WPP certification process in those countries, in addition to reviewing the most important international guidelines defining dynamic WT simulation models and their validation process. Moreover, aiming to demonstrate the practical applicability of these national validation guidelines, the present paper includes three application examples consisting of four voltage dip tests. On the one hand, a detailed dynamic WT model is validated according to the previous Spanish guidelines, and, on the other hand, the generic Doubly-Fed Induction Generator (DFIG) WT model defined by the International Electrotechnical Commission (IEC) is validated according to the new Spanish guidelines and the German ones. In this respect, it should be noted that, to the best of the authors’ knowledge, it is the first time in the scientific literature that the new Spanish guidelines have been followed to validate the performance of a WT simulation model.
The paper is structured as follows: Section 2 presents the Spanish grid code, describing, with a particular focus on the validation criteria of dynamic WT simulation models, the previous guidelines and the new ones issued for such purpose. Section 3 reviews the other two existing sets of guidelines in reference to the validation of dynamic WT models following national grid codes, issued by Germany and South Africa. Section 4 presents two application examples of the previous Spanish validation guidelines. In addition, it describes two other application examples of compliance with both the new Spanish and German guidelines, which currently share the same validation criteria for WT models. Finally, Section 5 summarizes the main conclusions obtained.

2. Spanish Grid Code: Use of Dynamic WT Simulation Models

Transient stability analyses are needed to determine whether a power system will respond adequately after a grid disturbance, being essential to ensuring the stability of the system after any type of event [21]. Load changes, connection and disconnection of generators and faults are merely a few examples of grid disturbances. These transient analyses also help Distribution System Operators (DSO) and TSOs to plan network operation effectively, guaranteeing power supply and forecasting eventual power compensations from conventional power plants. In this way, they also significantly enhance network security and reliability.
With regard to wind energy, two international entities, the IEC and the Western Electricity Coordinating Council (WECC), through Standard IEC 61400-27-1 [22] and the WECC Second Generation of Wind Turbine Models [23], defined what are known as generic—or standard—WT simulation models for transient stability analyses. These generic WT simulation models cover the four main types of WT technologies available in the market [24]. The variety of WT models developed by different manufacturers and the complexity and diversity of parameters of their corresponding simulation models prompted the development of alternative generic, publicly available and simplified WT simulation models. These were devised in order to obtain a generalized response, employing a reduced number of parameters and obtaining reliable responses [25]. In addition to the development of dynamic WT simulation models, the IEC also developed its own set of validation guidelines to evaluate the simulations using field measurements of actual WTs. Works such as [26] comprehensively describe the validation process of generic WT simulation models in the framework of Standard IEC 61400-27-1. In this sense, the importance of the IEC validation procedure and its relationship with the Spanish and German grid codes is discussed in Section 2.2 and Section 3.1.
In July 2019, Red Eléctrica de España (REE), the Spanish TSO, published the new technical supervision standard, ‘Norma Técnica de Supervisión’(NTS) [27], for commissioning and grid integration of RES-based power plants. This standard makes it possible to assess the conformity of these renewable power plants in accordance with such new technical requirements. However, until that date, the certification of Spanish renewable power plants, and in particular wind power installations, had been carried out according to Operation Procedure 12.3 (PO 12.3) for FRT capability, which detailed how WPPs should behave under grid disturbances [28]. In line with this, the so-called Procedure for Verification, Validation and Certification (PVVC) [29] detailed the steps that should be followed to certify a Spanish WPP and make it comply with the technical requirements specified in PO 12.3. Moreover, the PVVC included the characteristics of the tests.

2.1. Po 12.3: Procedure for Verification, PVVC

Following the general verification procedure [30,31,32] detailed in the PVVC document [29], the dynamic WT model to be validated should be provided by the manufacturer and should represent the model of the actual WT that formed part of the WPP. Thus, after conducting the specified tests at the actual WT [33], the field tests and the simulated responses of the WT model were compared and submitted to the validation criteria.
According to the PVVC, a WT dynamic model was validated if the following statement was complied with (see Equations (1) and (2)) [29]: the absolute value of the difference between the field tests’ active and reactive power measured values ( P m e a and Q m e a ) and the active and reactive power simulation values ( P s i m and Q s i m ) did not exceed the nominal values ( P n o m and Q n o m ) by 10% in at least 85% of the data series analyzed.
Δ P ( % ) = | P m e a P s i m P n o m | · 100 10 %
Δ Q ( % ) = | Q m e a Q s i m Q n o m | · 100 10 %

2.2. Spanish New Technical Supervision Standard: NTS

Edition 1 of the new guidelines issued to make new power generation units comply with the Spanish grid code, the NTS, was published on 18 July 2019. A year later, in July 2020, after several meetings, analyses and comments, the working group responsible for the monitoring of compliance of the generation sources with the Spanish grid code, coordinated by REE, released the draft document of the NTS Second Edition for its supervision. During this process, the Spanish Wind Energy Association, ‘Asociación Empresarial Eólica’ (AEE), played a decisive role, defending the advantages of wind power.
In order to facilitate understanding of the way to proceed, the NTS defines three main types of power units: (i) power generation modules, ‘Módulos de Generación de Electricidad’ (MGE); (ii) power generation units, ‘Unidades de Generación de Electricidad’ (UGE); and (iii) additional MGE components, ‘Componentes Adicionales del MGE’ (CAMGE), such as Flexible Alternating Current Transmission Systems (FACTS). MGEs are composed of UGEs and CAMGEs. Moreover, the NTS defines a list of technical requirements to be complied with by MGEs, such as FRT capability, active power recovery after faults and power-frequency control, among others.
Prior to the commercial operation of the power plant and the issuance of a final operation notification, there are three different ways to proceed in order to obtain the final certificate of the MGE:
  • Conformity assessment procedure through equipment certificates. This consists of first obtaining the equipment certificates, i.e., obtaining certificates for the UGE and CAMGE units. These certificates shall then be provided to the power plants’ owners to obtain the final certificate of the MGE.
  • Conformity assessment procedure through testing. This procedure may be followed with two objectives: (1) to obtain conformity with the technical requirement considered through directly testing the MGE, or (2) to certify the UGEs and CAMGEs for this requirement through testing.
  • Conformity assessment procedure through simulation. This procedure may be followed with two objectives: (1) to obtain conformity with the technical requirement considered through directly simulating the MGE, or (2) to certify the UGEs and CAMGEs for this requirement through simulation.
Further information regarding the procedures described above to obtain the final MGE certificate is explained in greater detail in [27]. However, since this paper focuses on the simulation and validation of dynamic WT models as part of the WPP certification processes, the conformity assessment procedure through simulationis discussed in detail:
  • Having a dynamic simulation model of MGE, UGE and/or CAMGE validated by an authorized certification entity, according to the validation guidelines described below.
  • Conducting the simulation of the validated dynamic models according to the technical requirements, which is conducted by an accredited entity.
  • Assessment of the simulation results by an authorized certification entity, and issuance of an equipment certificate for the UGE, CAMGE and/or MGE when the evaluation is positive.
The main objective of dynamic simulation models is to represent the electrical behavior of actual devices in a precise manner, using a simulation software tool. Let us assume that the dynamic simulation model considered in this case, i.e., the dynamic simulation model of the UGE under consideration, is a WT. The use of both RMS and Electromagnetic Transient (EMT) models is considered acceptable for the purposes described [34,35]. However, the WT manufacturer, together with the accredited and the authorized certification entities, determine which model—RMS or EMT—is more appropriate to use [27]. This decision depends on the technical requirement to be assessed and the typical frequency of the electrical phenomenon under consideration. Figure 1 shows the general scheme to validate a dynamic WT model to be employed in the conformity assessment procedure through simulation, adapted to the specific technical requirements of FRT capability.
A dynamic WT simulation model is considered validated and suitable to be used as part of the Spanish WPP certification process after following the steps depicted in Figure 1. In other words, the dynamic model, once validated according to the guidelines which the paper are focused on (and once obtained the certificate of ‘validated model’, as shown in Figure 1), is demonstrated to behave in a sufficiently accurate manner and therefore is ready to be used for simulating the whole set of technical requirements that the generation units and/or the installation must comply with. Finally, if every requirement established in the grid code is fulfilled, the corresponding entity will give the final certificate to commission the wind power plant.
Thus, according to Figure 1a competent accredited entity proceeds with the simulations. These must be consistent with the voltage dip tests conducted by an accredited entity equipped to carry out the required tests in laboratories (LAB), or by an Authorized Certifier (AC). The dynamic WT model is provided by the manufacturer (MAN). The testing report and the simulation results are then provided to an AC, who proceeds to issue a validated model certificate if the errors between the simulated responses of the model and the measurements are within the limits established. It is especially important to underline that the WT simulation model must be validated against measurements corresponding to all the technical requirements defined in the NTS [27]. The acceptance criteria of the simulation model, together with the validation procedure, are described below.
According to Equation (3), in the particular case of voltage dips, the error time series ( x E ( n ) ) are calculated as the difference between the simulated time series ( x s i m ( n ) ) and the measured time series ( x m e a ( n ) ) for the time window defined in [36].
x E ( n ) = x s i m ( n ) x m e a ( n )
Three validation errors or validation performance indicators are now calculated for each of the variables considered during each of the time windows defined within the whole voltage dip window, and based on the error time series ( x E ( n ) ) (see [26,36] for more information about the so-called quasi-steady state sub-windows): (i) pre-fault window, which starts 1 s before the start of the voltage dip; (ii) fault window, which starts when the fault occurs and ends when the fault is cleared; and (iii) post-fault window, which is extended 5 s from voltage dip clearance. The validation errors are:
  • Mean Error (ME). ME is defined as the mean value of the error over the corresponding time window. It is related to the steady-state performance of the model (see Equation (4)).
    x M E = n = 1 N x E ( n ) N
  • Mean Absolute Error (MAE). MAE is the mean value of the absolute error. It is also concerned with the steady-state performance of the model, albeit based on the mean deviation (see Equation (5)).
    x M A E = n = 1 N | x E ( n ) | N
  • Maximum Absolute Error (MXE). MXE is the maximum value of the absolute error. It focuses on giving information about the transient performance of the model (see Equation (6)).
    x M X E = m a x ( | x E ( n ) | )
In Equations (3)–(6), x represents the variable to be compared (for instance, active power), n is the indices of the vectors and N is the total number of samples used. In this sense, it should be noted that the integration time step defined during the simulation will determine the number of samples used. IEC generic models use integration time steps in the order of 1 ms to 10 ms. Thus, for instance, during the validation process of a generic WT model executed with a simulation time step of 5 ms and a time window for comparison of 6.6 s, the total number of samples considered will be 1320.
After these calculations, the simulation results are provided to the AC, and the model is subsequently validated. Table 1 summarizes the variables and results required, corresponding to positive sequence components. The table also includes the acceptable limits.
As was discussed in Section 2, Standard IEC 61400-27-2 is closely related to the Spanish NTS. This is because the NTS based its validation guidelines for WT dynamic models on the validation guidelines issued by the IEC, developed to validate the behavior of generic WT simulation models [36].

3. International Grid Codes: Overview of WT Models Validation

To the best of the authors’ knowledge, Germany and South Africa are the only other two countries where dynamic simulation models are used during the commissioning and certification process of RES-based power plants. In addition, it should be noted that these simulation models are also used in Brazil. However, the document that details the requirements to be complied with by these models has not yet been officially published in the Brazilian case.

3.1. German Grid Code

Part 4 of the German technical guidelines for power generating units and systems is entitled ‘Demands on Modeling and Validating Simulation Models of the Electrical Characteristics of Power Generating Units and Systems, Storage Systems as well as their Components’ (TG 4) [37]. These guidelines describe the requirements for modeling and validating dynamic simulation models of the electrical characteristics of the Power Generating Units (PGU) and Power Generating Systems (PGS). These electrical characteristics must be measured in accordance with Part 3 ‘Determination of the Electrical Characteristics of Power Generating Units in Medium-, High- and Extra-High Voltage Grids’ (TG 3) [38]. Finally, the PGUs and PGSs require certification in accordance with Part 8 of the ‘Certification of the Electrical Characteristics of Power Generating Units, Systems and Storage Systems as well as their Components on the Grid’ (TG 8) [39].
In line with the Spanish grid code, dynamic WT simulation models used as part of the certification process of German power installations must be accurate enough to represent the performance of actual WTs and WPPs. Therefore, [37] describes the requirements for model accuracy and defines how these models must be validated. Such dynamic models, which must include relevant protection devices, allow grid faults to be simulated and the models’ response to be studied, particularly in terms of their active and reactive power performance. RMS models are preferred by the German grid code to perform the simulations. This is due to EMT models requiring a significant computational time cost and RMS models are already able to represent three phasors for the positive, negative and zero phase sequence system.
As defined by [37], a PGS may consist of one or more PGUs, control functions such as PGS controllers, additional components for reactive power compensation and grid elements, including lines or transformers. Therefore, PGU simulation models form the basis for PGS simulation models. The PGS model should accurately represent the electrical response of one or more PGUs when measuring at any point of connection to the grid where these PGUs are connected. In this sense, the response of a PGS model can only be verified based on: (i) a PGU model that forms part of the PGS, the responses of which were previously verified following the guidelines in [37]; (ii) measurements directly conducted on the PGS in accordance with the requirements provided in [38].
The dynamic models can be simulated and tested under both steady-state and transient analyses, depending on the planning task established. The steady-state analyses are usually conducted to provide general information on the PGS characteristics and their impact on grid operations. Transient simulation analyses allow, for instance, the performance of the models to be studied under faults. In this sense, depending on the task or electrical characteristic to be analyzed, simulation parameters such as time step or simulation time, may differ [37].
Once the required measurements from testing the actual PGUs and/or PGSs are performed, the validation of the simulation models may start. These tests for the validation process are specified in [38]. In this sense, the German guidelines refer back to the methodology developed in [36] to perform the validation of all PGU models, regardless of the technology employed. Since [36] was directly developed to test the accuracy of generic WT simulation models, the same calculations and performance indicators as those described in Section 2.2 for the new Spanish NTS—MXE, ME and MAE—can be directly obtained for the German case. The allowable thresholds are also the same as for the Spanish NTS (see Table 1). Therefore, the model is regarded as successfully validated if the value of the validation performance indicators calculated is smaller than, or equal to, those thresholds. More information about two-phase faults in the positive and negative phase sequence system following the German guidelines can be found in [37].

3.2. South African Grid Connection Code

Version 3.0 of the grid connection code for renewable power plants connected to the electricity transmission system or the distribution system in South Africa was published in August 2019, and was approved by the National Energy Regulator of South Africa (NERSA) [40]. Its main objective is to specify technical and design grid connection requirements for renewable power plants connected or seeking connection to the grid in South Africa, including WPPs [41]. Therefore, the power plants are required to demonstrate compliance with these technical and design requirements before starting to operate commercially, and during both normal and abnormal operating conditions [42].
Within this context, particularly in the case of WPPs, the System Operator (SO) of South Africa, Transmission Network Service Providers (TNSP) and distributors require sufficiently accurate and suitable dynamic WT simulation models to assess in advance the impacts of the integration of the WPP proposed. These impacts may concern the security, stability or dynamic performance of the power system. In this sense, the dynamic WT models should be able to operate using both RMS and EMT analyses. Likewise, the models should be able to replicate the performance of the installation regarding WPP impact on network voltage stability, WPP switching transients impact on network performance, and WPP FRT capability for different types of faults, among other aspects.
The South African grid connection code also states that generic WT dynamic models, instead of detailed EMT models, can be accepted if they are able to accurately represent the WPP performance within a frequency spectrum of 0 to 1 kHz. Moreover, when providing the dynamic WT simulation model, all parameters required for EMT simulations must be incorporated. Such parameters include positive, negative and zero sequence impedance values for all the elements that form part of the WPP, magnetizing curves and voltage/current characteristics. The WPP data exchange between the WPP owner and the SO, distributor and/or TNSP is a time-based process consisting of three stages, as detailed in [40]. This process allows compliance with the grid connection code requirements to be assessed for the renewable power plant under consideration. During the second stage, before commissioning the WPP, the power plant owner shall provide information on the dynamic modeling data. Likewise, a validated WPP or WT electrical dynamic simulation model using measurements shall be provided during the third stage, after commissioning the WPP.
The accuracy of the simulation model is assessed by comparing measured signals of voltages and currents at the Point of Coupling (POC) with simulated values of the same voltages and currents. According to the South African grid code, a dynamic WT simulation model can thus be considered validated if the requirements defined in Table 2 are complied with. In this sense, several concepts should be specified:
  • Sample-by-sample error, calculated as a percentage ratio of the difference between the measured and simulated values, once the samples have been synchronized, and the maximum peak value of measured voltage or current in any of the three phases.
  • Average error, calculated as the average of the error values obtained during a certain period.
  • Average absolute error, calculated as the average of the absolute error values obtained over a certain period.
  • Error band. A permissible error band is defined in each case. In all cases, at least 90% of the sample-by-sample error values must be within this band. Therefore, only 10% of errors may be higher than this band.
The previous indicators are estimated over the fault duration window, also including one 50 Hz cycle after the fault clearance [40].
Moreover, the validation requirements for current include fulfilling the following statement when considering one-cycle Fourier Transform: the average error values of all three symmetrical components—positive, negative and zero sequence—shall not exceed 20% [40].
A dynamic WT model is then suitable according to the South African grid code if the value of the different types of errors estimated, described above, are smaller than or equal to the thresholds established, shown in Table 2.

4. Validating Detailed and Generic WT Simulation Models Following PVVC NTS and TG 4 Guidelines: Application Examples

First, Section 4.1 shows the results obtained when applying the validation criteria established in the guidelines of the previous Spanish grid code, the PVVC (see Section 2.1), to the detailed WT simulation model corresponding to the G52 Siemens Gamesa WT. Subsequently, Section 4.2 shows the results obtained when applying the validation criteria commonly established in the guidelines of the new Spanish grid code (the NTS, see Section 2.2), and the German one (TG 4, see Section 3.1), to the IEC 61400-27-1 generic DFIG WT simulation model—or Type 3 WT [22].

4.1. PVVC Validation Criteria Applied to the Detailed G52 WT Simulation Model

A detailed WT simulation model provided by the manufacturer Siemens Gamesa, corresponding to an operating G52 WT of 850 kW rated power, is submitted to a measured voltage dip. PSCAD/EMTDC is the software tool employed to simulate the detailed WT model, and a time step of 10 μ s is used to conduct the analyses. The actual electrical, electronic and mechanical subsystems of the WT are therefore simulated through the dynamic sub-models that define their behavior. In this sense, it should be noted that the G52 commercial WT is equipped with a break chopper, which is a protection device that burns the excess of active power coming from the rotor of the generator to the Direct Current (DC) link of the power converter. Although the DC bus voltage and the rotor current are not variables to be validated, an accurate representation of these signals is also required because of their influence in the evolution of the active and reactive power responses. A schematic representation of the actual G52 DFIG WT, together with the equipment used to generate the voltage dip, can be found in [31].
Regarding the voltage dip modeling, the latest editions of the PVVC establish that a voltage-dependent source is required to set the voltage data measured as the input signal to that voltage source. This method, followed in the present study, is the so-called playback validation approach [43,44], which allows the voltage data values measured at the actual WT model to be replicated in the dynamic WT simulation model. Thus, the detailed G52 WT modeled in PSCAD is electrically connected to a three-phase voltage source that plays back the waveform of the voltage measurements in the detailed WT simulation model. These measurements are taken at the point of connection of the WT to the test system, which generates the voltage dip at 20 kV rated voltage. In addition, a constant wind speed value is also another input to the model. This wind speed value is adjusted in order to get the same power in the WT model as that obtained during the measurements. This is done because the wind speed measured by the anemometer at the actual WT is disturbed by the WT rotor and wind speed variability. The reactive power setpoint is also an input to the detailed G52 WT model. It is set at a constant value equal to the value measured at the actual WT. Finally, the WT model outputs are the three-phase instantaneous currents injected into the power system.
The residual voltage of the measured voltage dip is: (i) 19.66% for phase A; (ii) 17.75% for phase B; (iii) 19.91% for phase C. The voltage dip duration is 0.5705 s. Figure 2a,b show the active and reactive power responses, respectively, of both the detailed model and the actual WT (field measurements) under the voltage dip conducted. In this case, the WT operates at full load conditions. Figure 3a,b show similar results when the WT operates at partial load conditions of 0.20 pu.
Following the process detailed in Section 2.1 for the application of the PVVC validation criteria, the dynamic WT simulation model is validated if the difference in both active and reactive powers between the simulated and the measured data do not exceed 10% in at least 85% of the data series analyzed for each single-phase. The results of such compliance are shown in Table 3. As can be seen from this table, the active and reactive power responses fulfill the PVVC validation criteria under both full and partial load conditions. Of the data series analyzed, 89% and 92% are below the maximum deviation allowed (0.10 pu) for the active and reactive powers in the full load case, while these values increase to 99% in the partial load case for both powers.
In general, it can be affirmed that there exists an excellent correlation between the active and reactive power responses of the detailed model and the field measurements in both the full and the partial load test cases, showing some differences at around 2.8 s in the active power response of the WT model operating at full load (Figure 2a). Therefore, it can be observed how the error time series obtained, shown as red dotted lines, are at around 0% except when strong electromagnetic transients take place in voltage inception and recovery. This good performance is mainly due to the accurate models used to represent the converter and generator of the actual WT. Finally, it can be affirmed that the detailed WT simulation model is validated according to the previous Spanish PVVC guidelines. More information on such validation results can be found in [30,33].

4.2. NTS and TG 4 Validation Criteria Applied to the Generic IEC DFIG WT Simulation Model

DIgSILENT PowerFactory (PF) is employed to implement and simulate the generic IEC DFIG WT model, since it is one of the most powerful software tools in the field of power systems analysis. Specifically, the DIgSILENT Simulation Language (DSL) is the feature used. DSL is a language which allows dynamic and control models to be implemented and simulated, permitting interaction between these models and different electrical devices. The time step used to perform the simulations is 10 ms. This value is in line with the integration time steps established for IEC WT models, as indicated in Section 2.2.
Standard IEC 61400-27-1 has defined two models of the Type 3 or DFIG WT, depending on the protection system implemented against faults: Type 3A and Type 3B WTs. The main difference between them is that the generic Type 3B model includes a crowbar device to protect the WT against over-voltages and over-currents [22]. In the present paper, the IEC Type 3B WT is the model implemented, since the field measurements used to perform the validation correspond to an actual DFIG WT equipped with a crowbar protection system. Finally, it should also be noted that Standard IEC 61400-27-1 states that the generic models are not intended for investigation of the fluctuations originating from wind speed variability and do not include phenomena such as turbulence, tower shadow, wind shear and wakes. This is mainly due to these generic models being employed for transient stability studies in which the different WT models are aggregated into an aggregated WPP model. Therefore, wind speed fluctuations, which are not of interest in these types of studies, are disregarded because of the compensation of different WTs.
The main dynamic and control models that form part of the modular structure of the IEC generic Type 3B WT model are shown in Figure 4. This modular structure consists of a generator control model that actuates so that the active and reactive power setpoints defined by the user ( p W T r e f and x W T r e f ) can be reached. These setpoints are two of the input signals to the model. Thus, the generator control model provides the generator system with the active and reactive current limits ( i p m a x , i q m a x and i q m i n ), as well as the active and reactive current commands ( i p c m d and i q c m d ). Some control models also require the active power ( p W T ), reactive power ( q W T ) and voltage ( u W T , u ̲ g e n ) signals to be measured at the Wind Turbine Terminals (WTT). The aerodynamic model provides the mechanical model with the aerodynamic power ( p a e r o ), which depends on the wind speed value—assumed to be constant during the simulation—that must be set by the user ( p i n i t ) at the beginning of the simulation. This is the third input signal to the model. The mechanical model represents the WT drive train (basically, low-speed axis, gearbox and high-speed axis), and estimates the WT rotor and generator rotational speeds ( ω W T R and ω g e n ), while the pitch control estimates the position angle of the WT blades ( θ ). Finally, the generator system provides the final active and reactive current values to be injected into the grid ( i ̲ g e n ).
Wind speed ( p i n i t ) is set at 1 pu during the simulations. The active power setpoint ( p W T r e f ) is set at 1 pu in the full load test case and 0.27 pu in the partial load test case, as indicated below. The reactive power setpoint ( x W T r e f ) is set at 0 pu in both test cases. Thus, the IEC generic DFIG WT simulation model is submitted to two different measured voltage dips under two load conditions [24]:
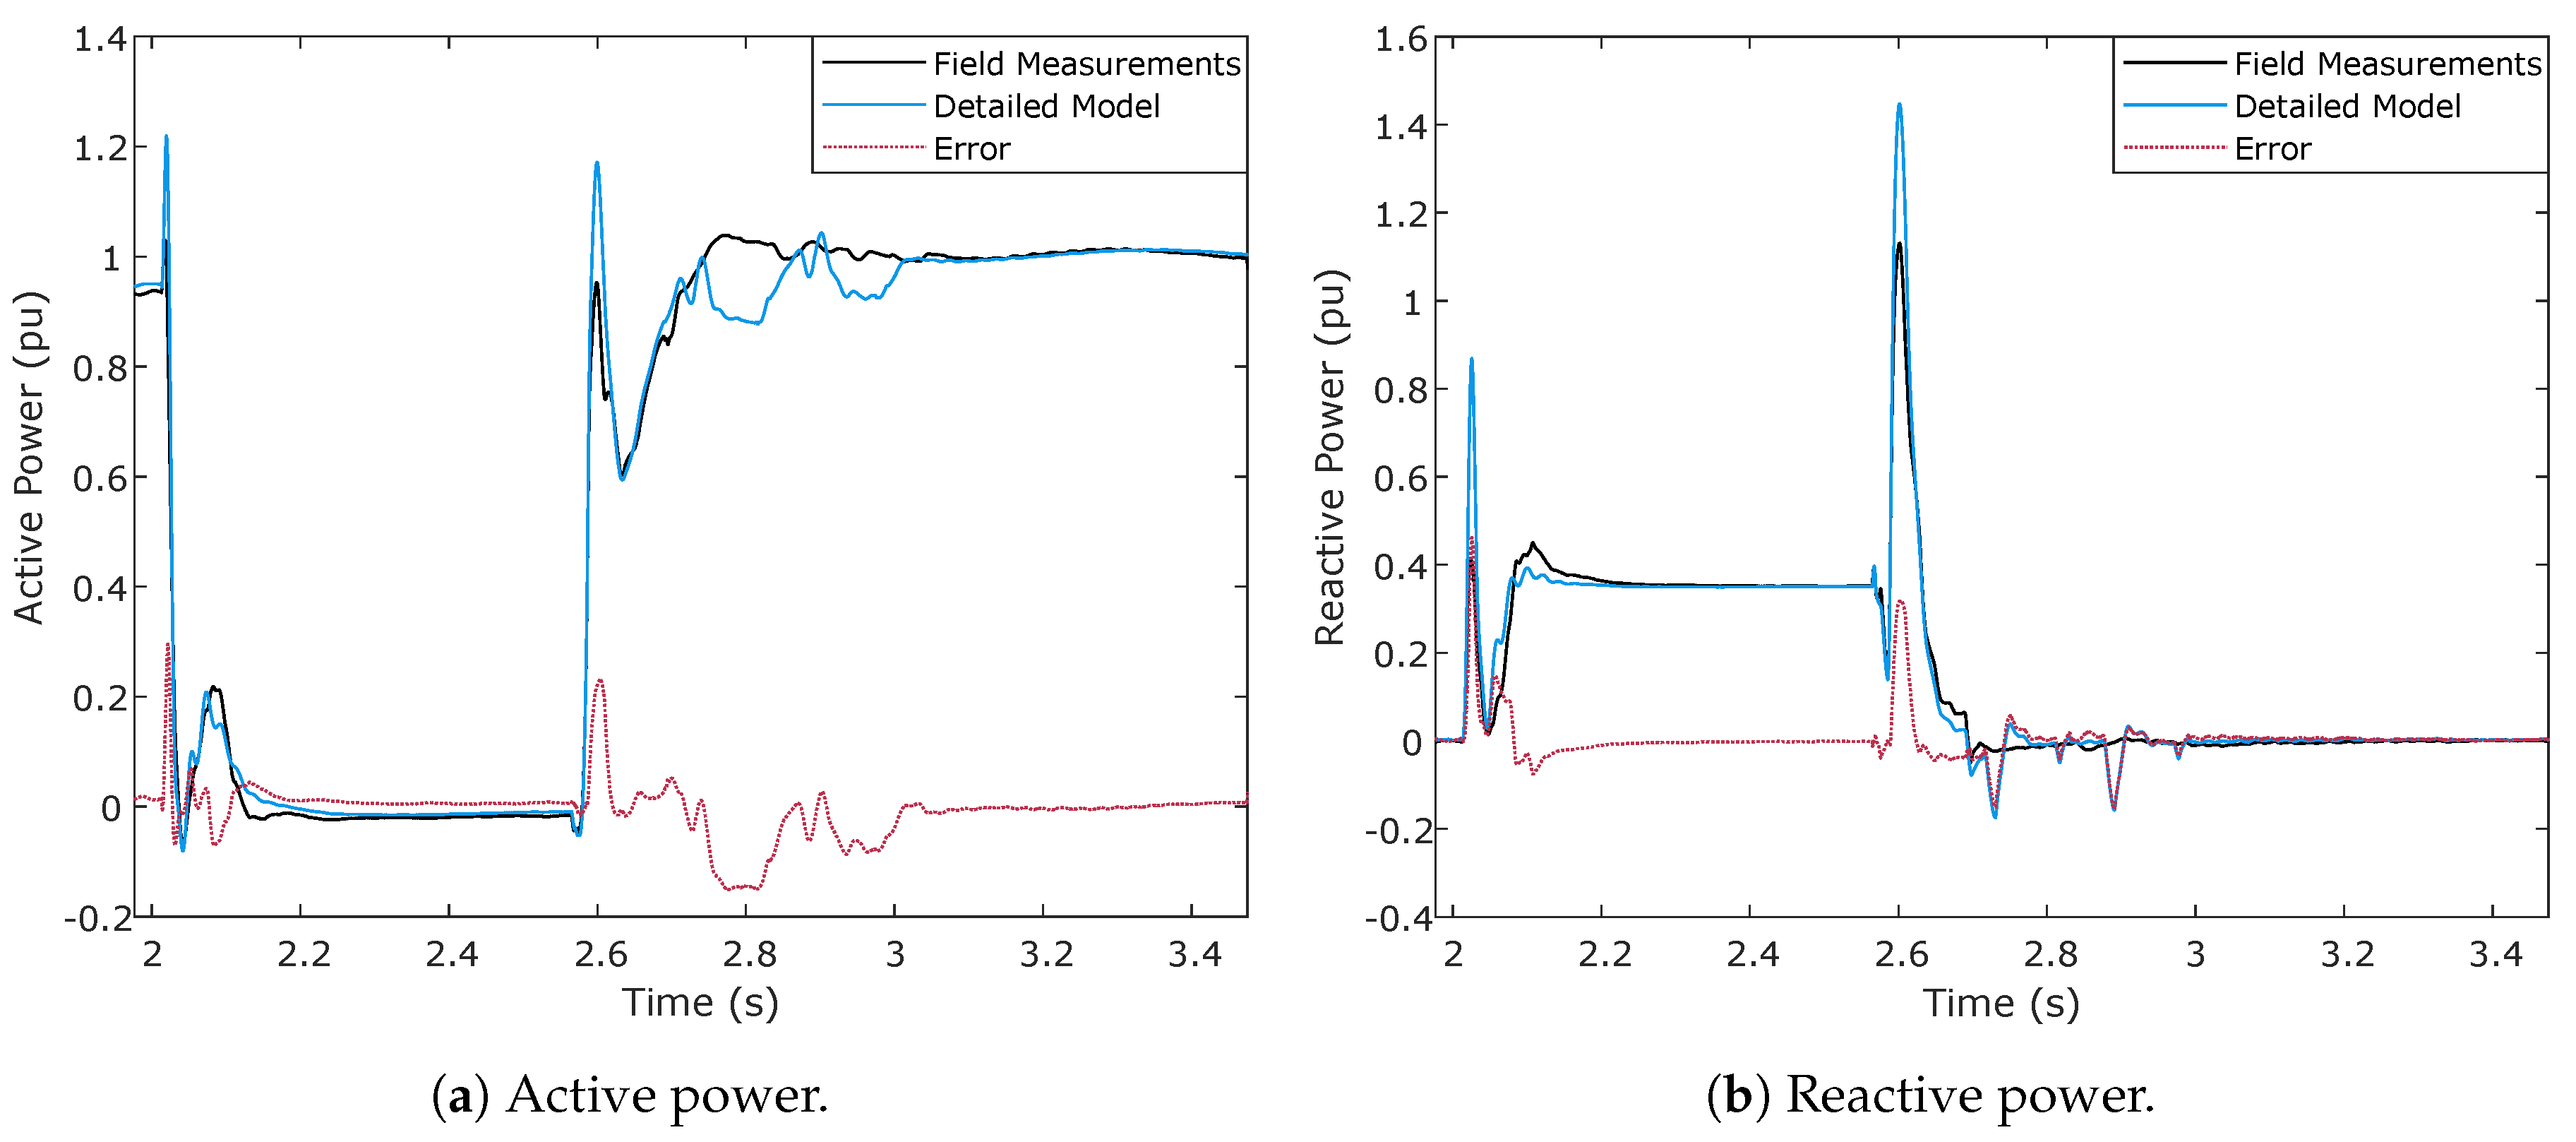
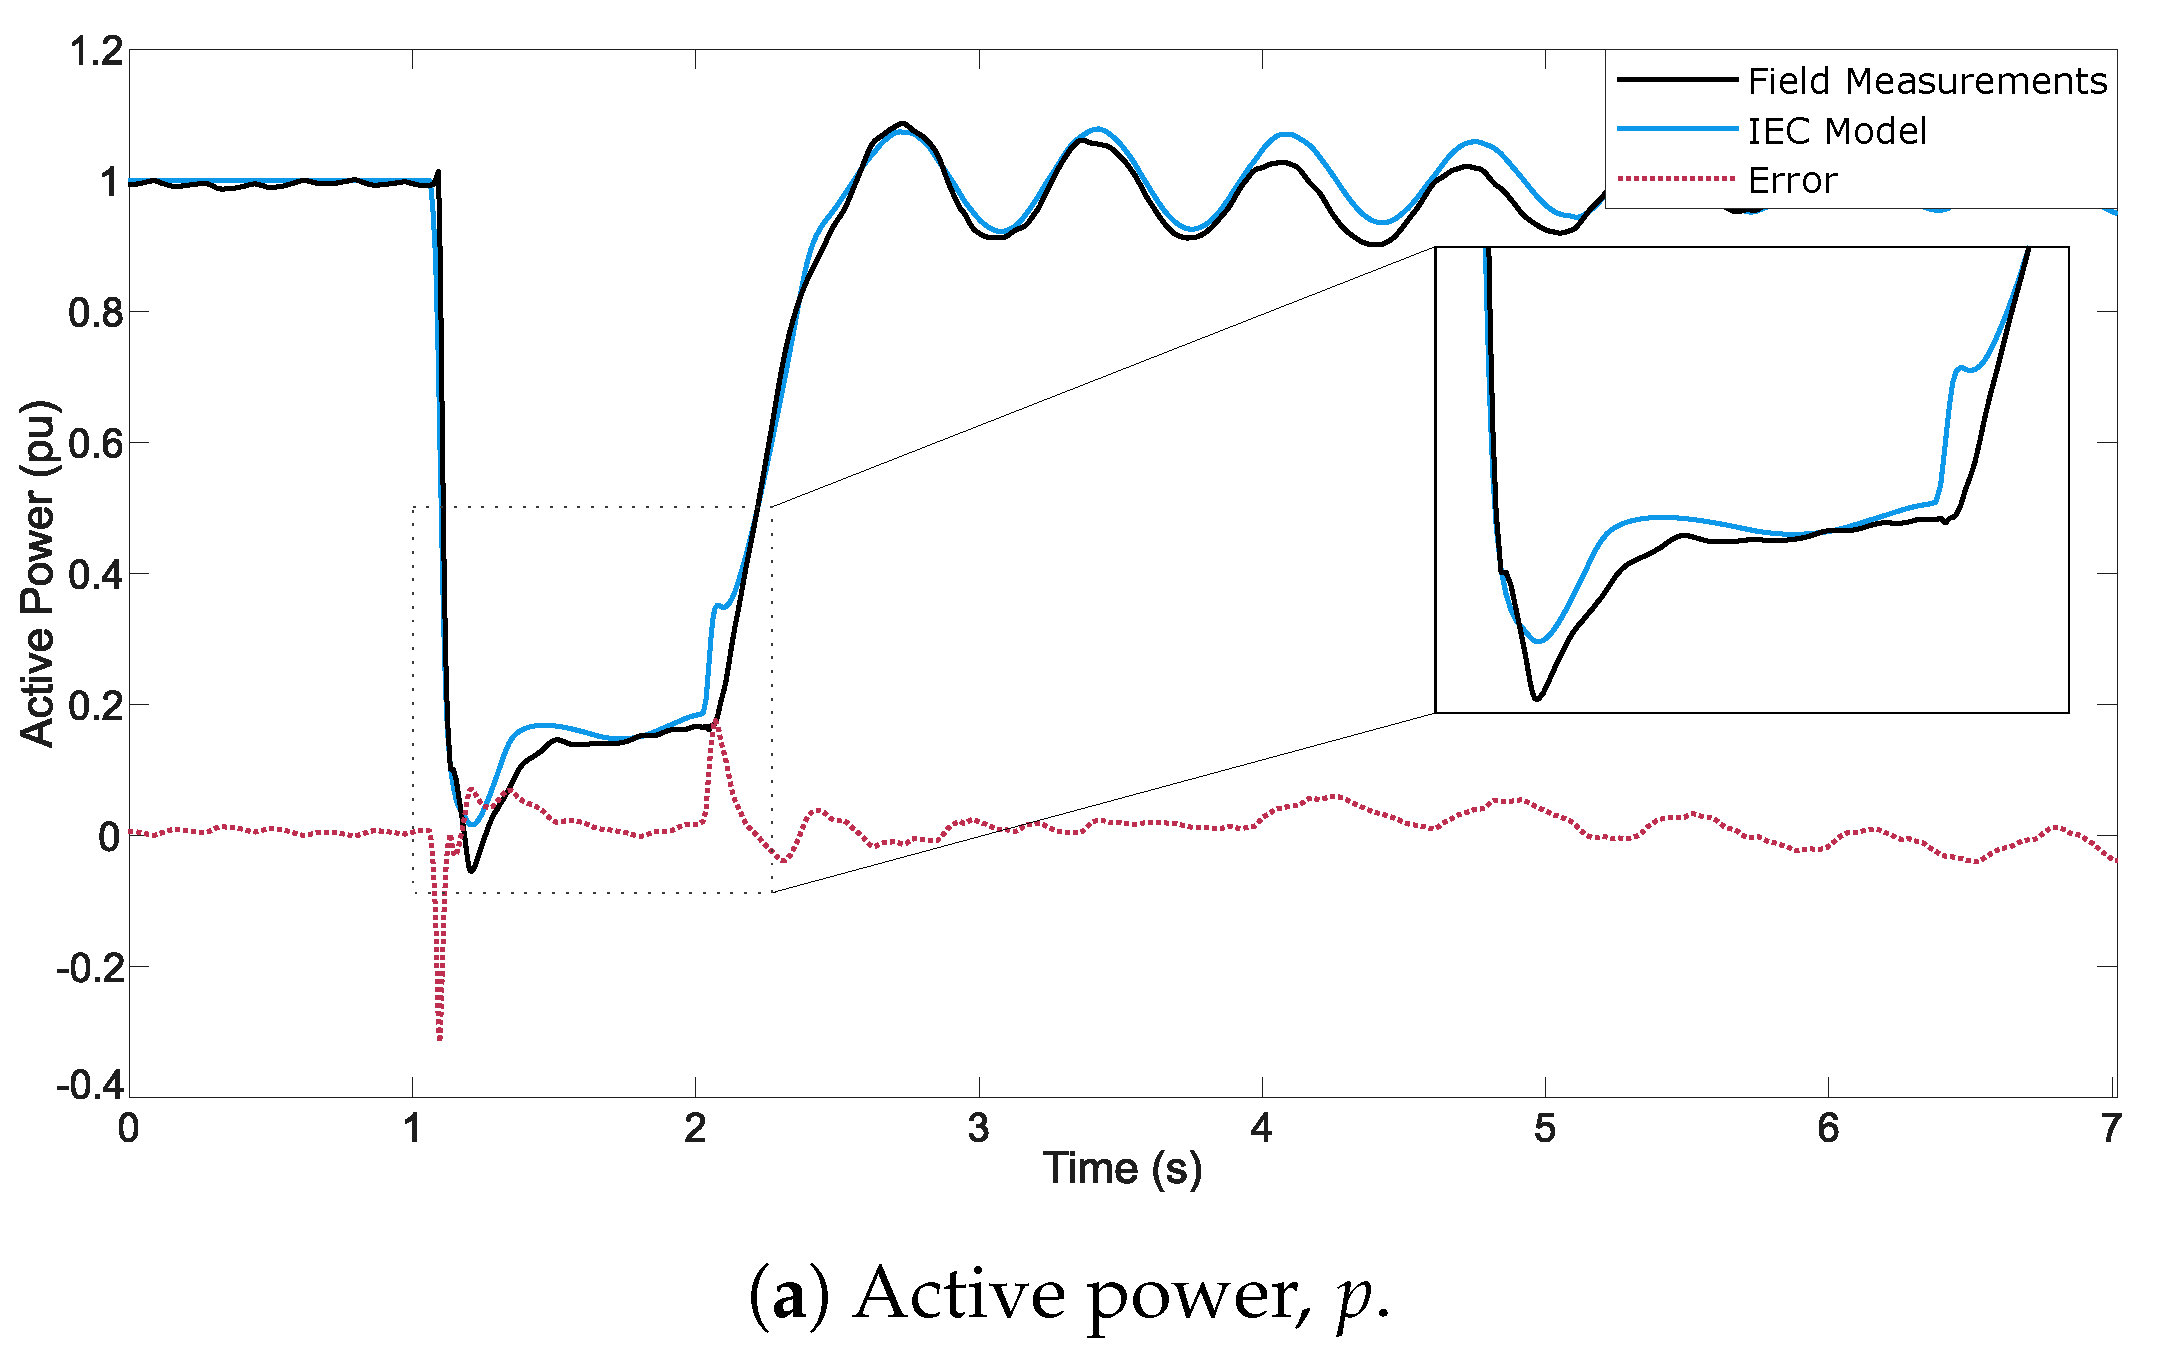
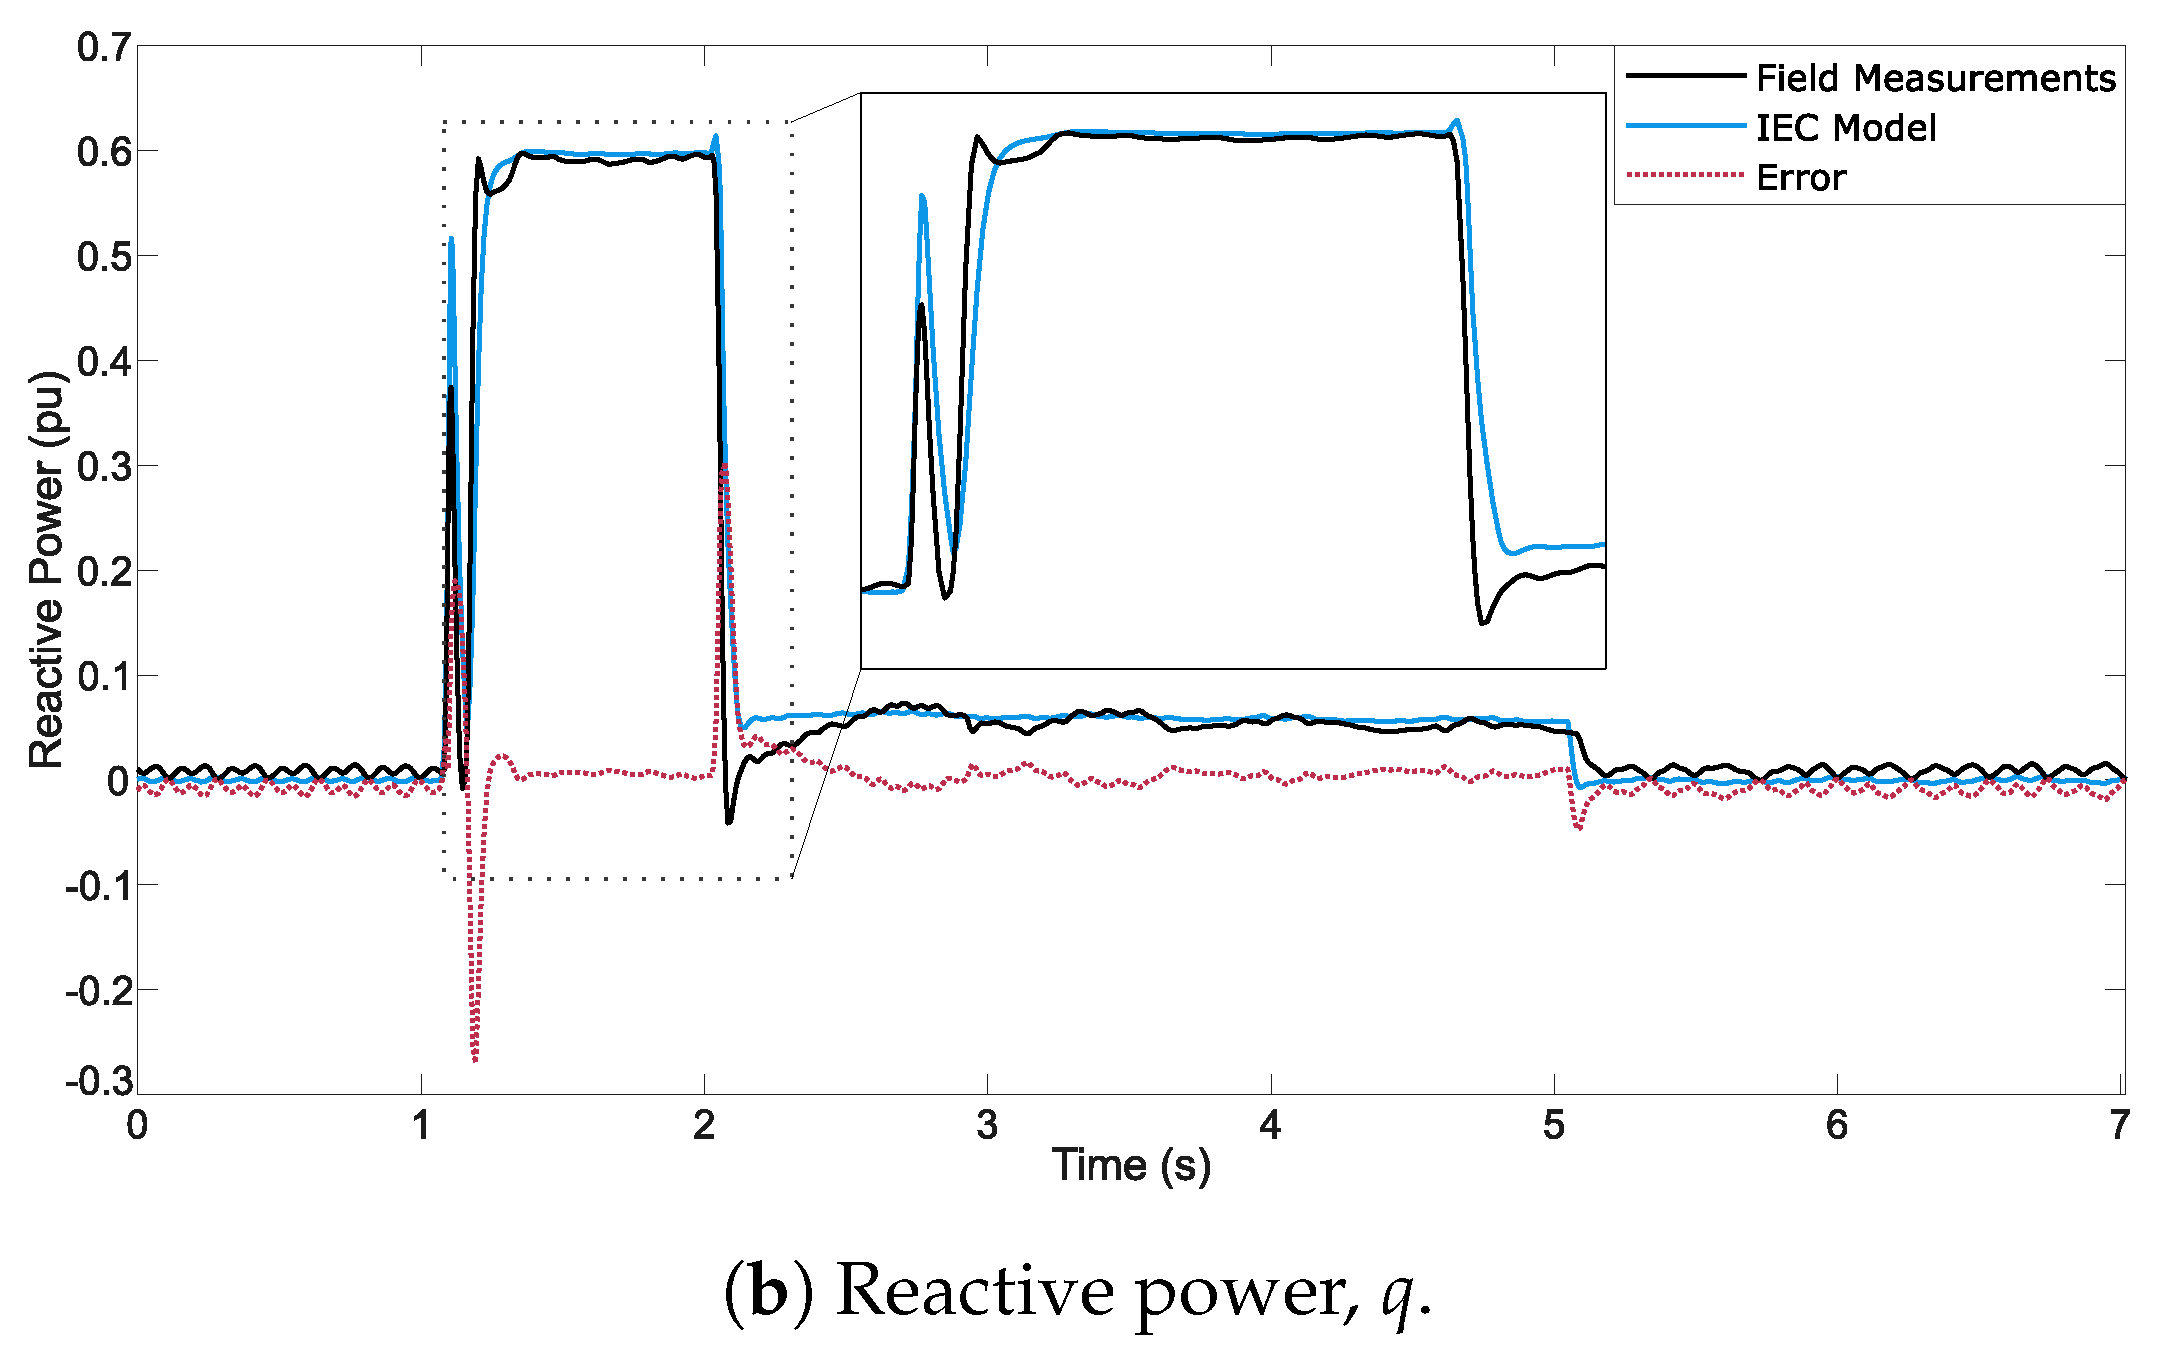
  • Test case 1 (TC1), WT operating at full load conditions: Residual voltage of u = 0.50 pu and dip duration of t = 920 ms. The active and reactive power responses of this test are shown in Figure 5.
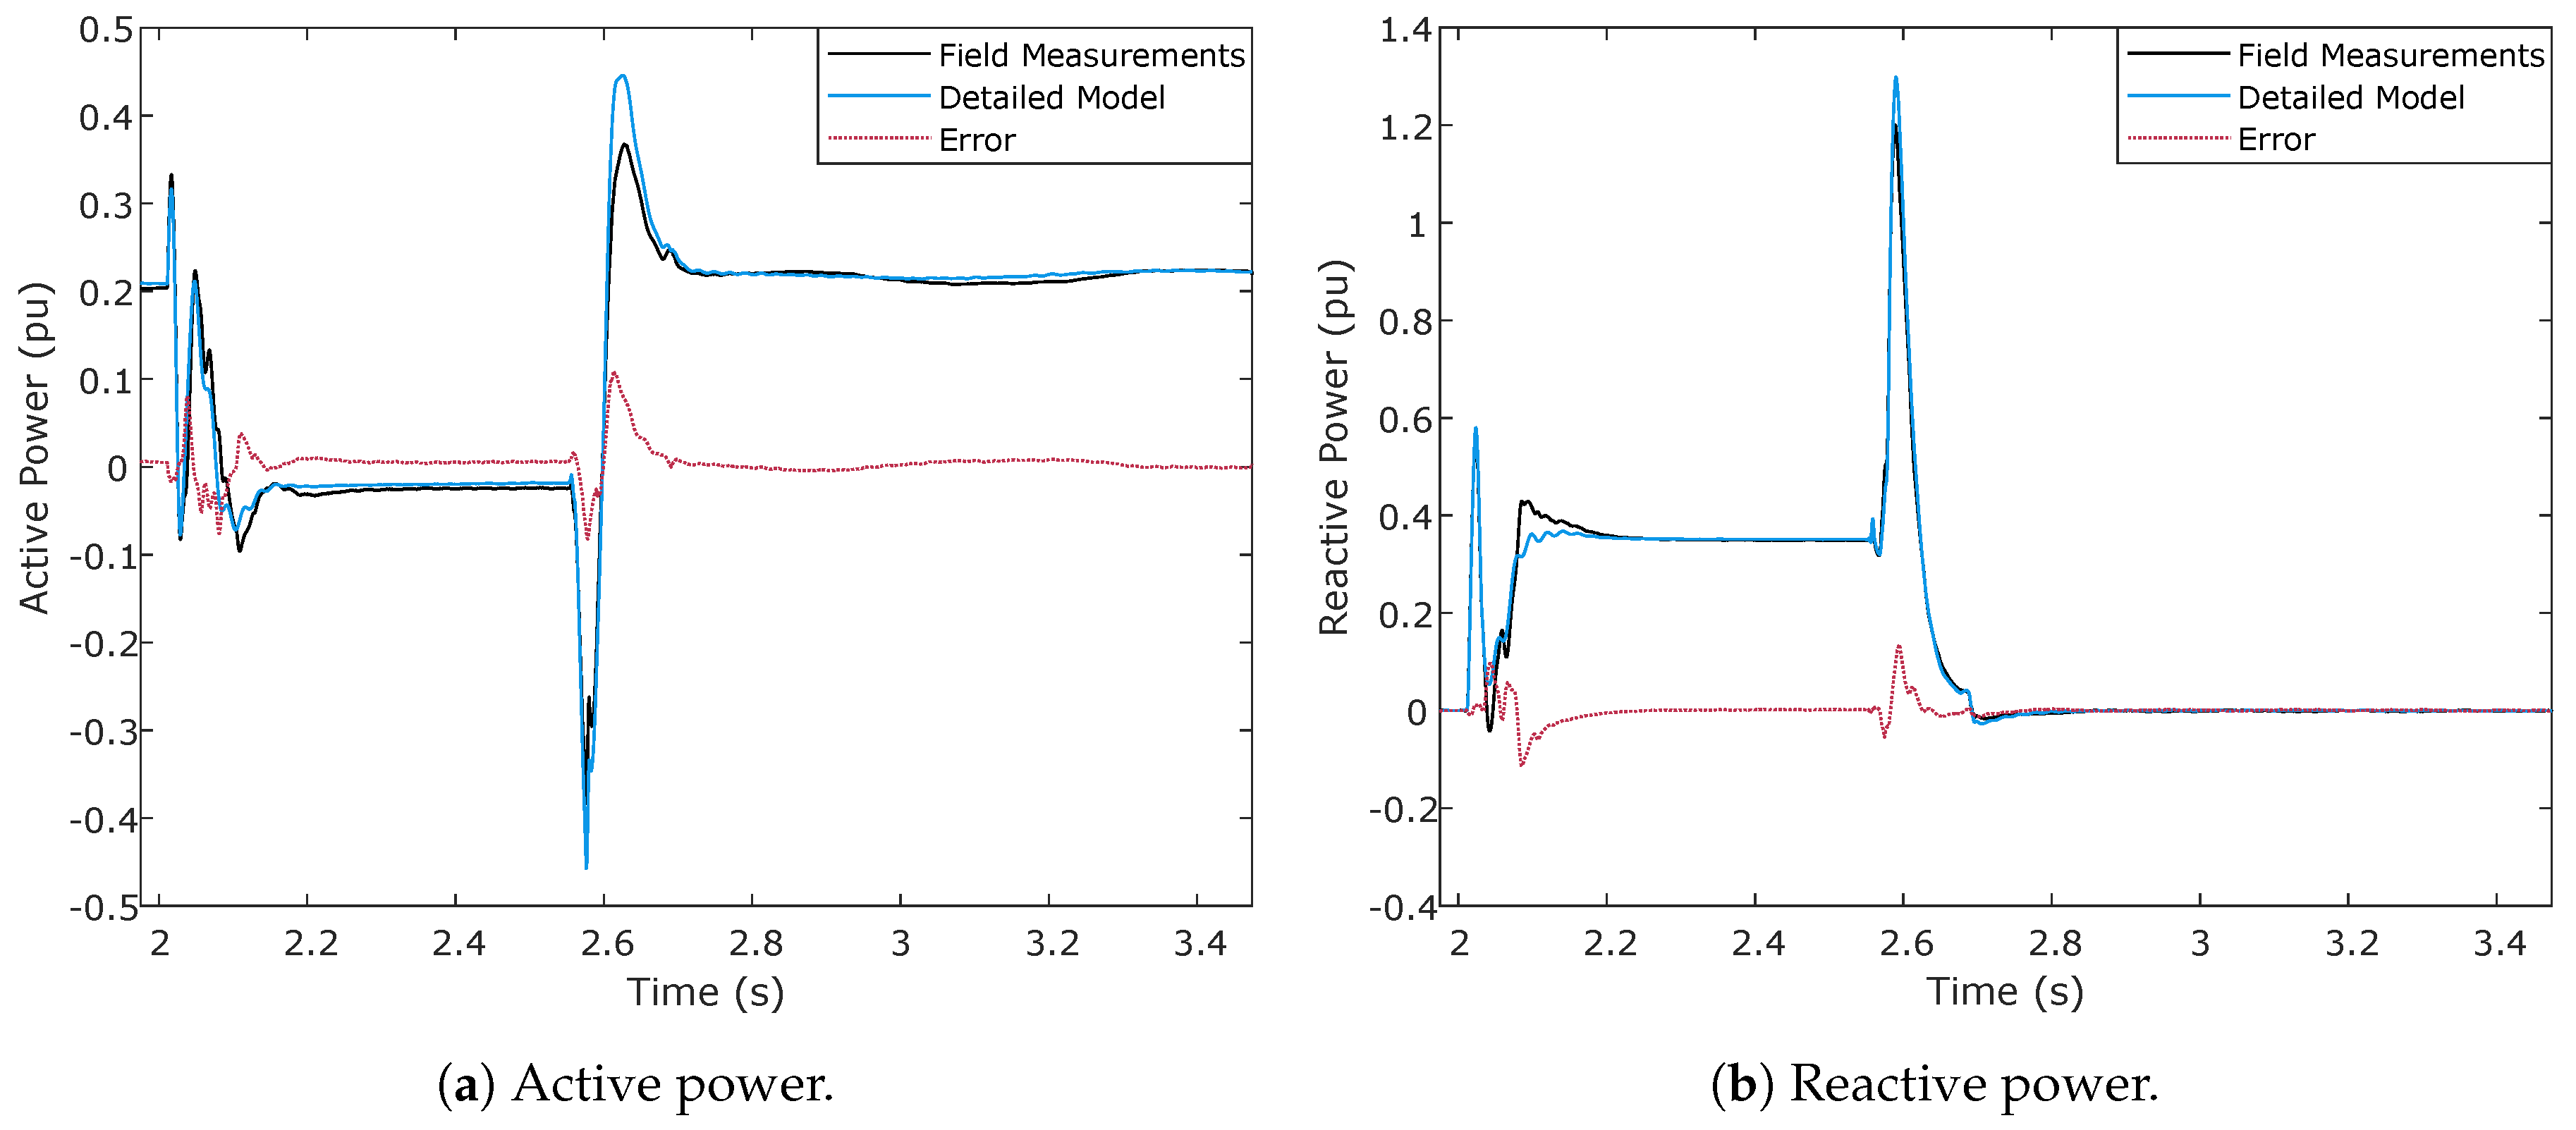
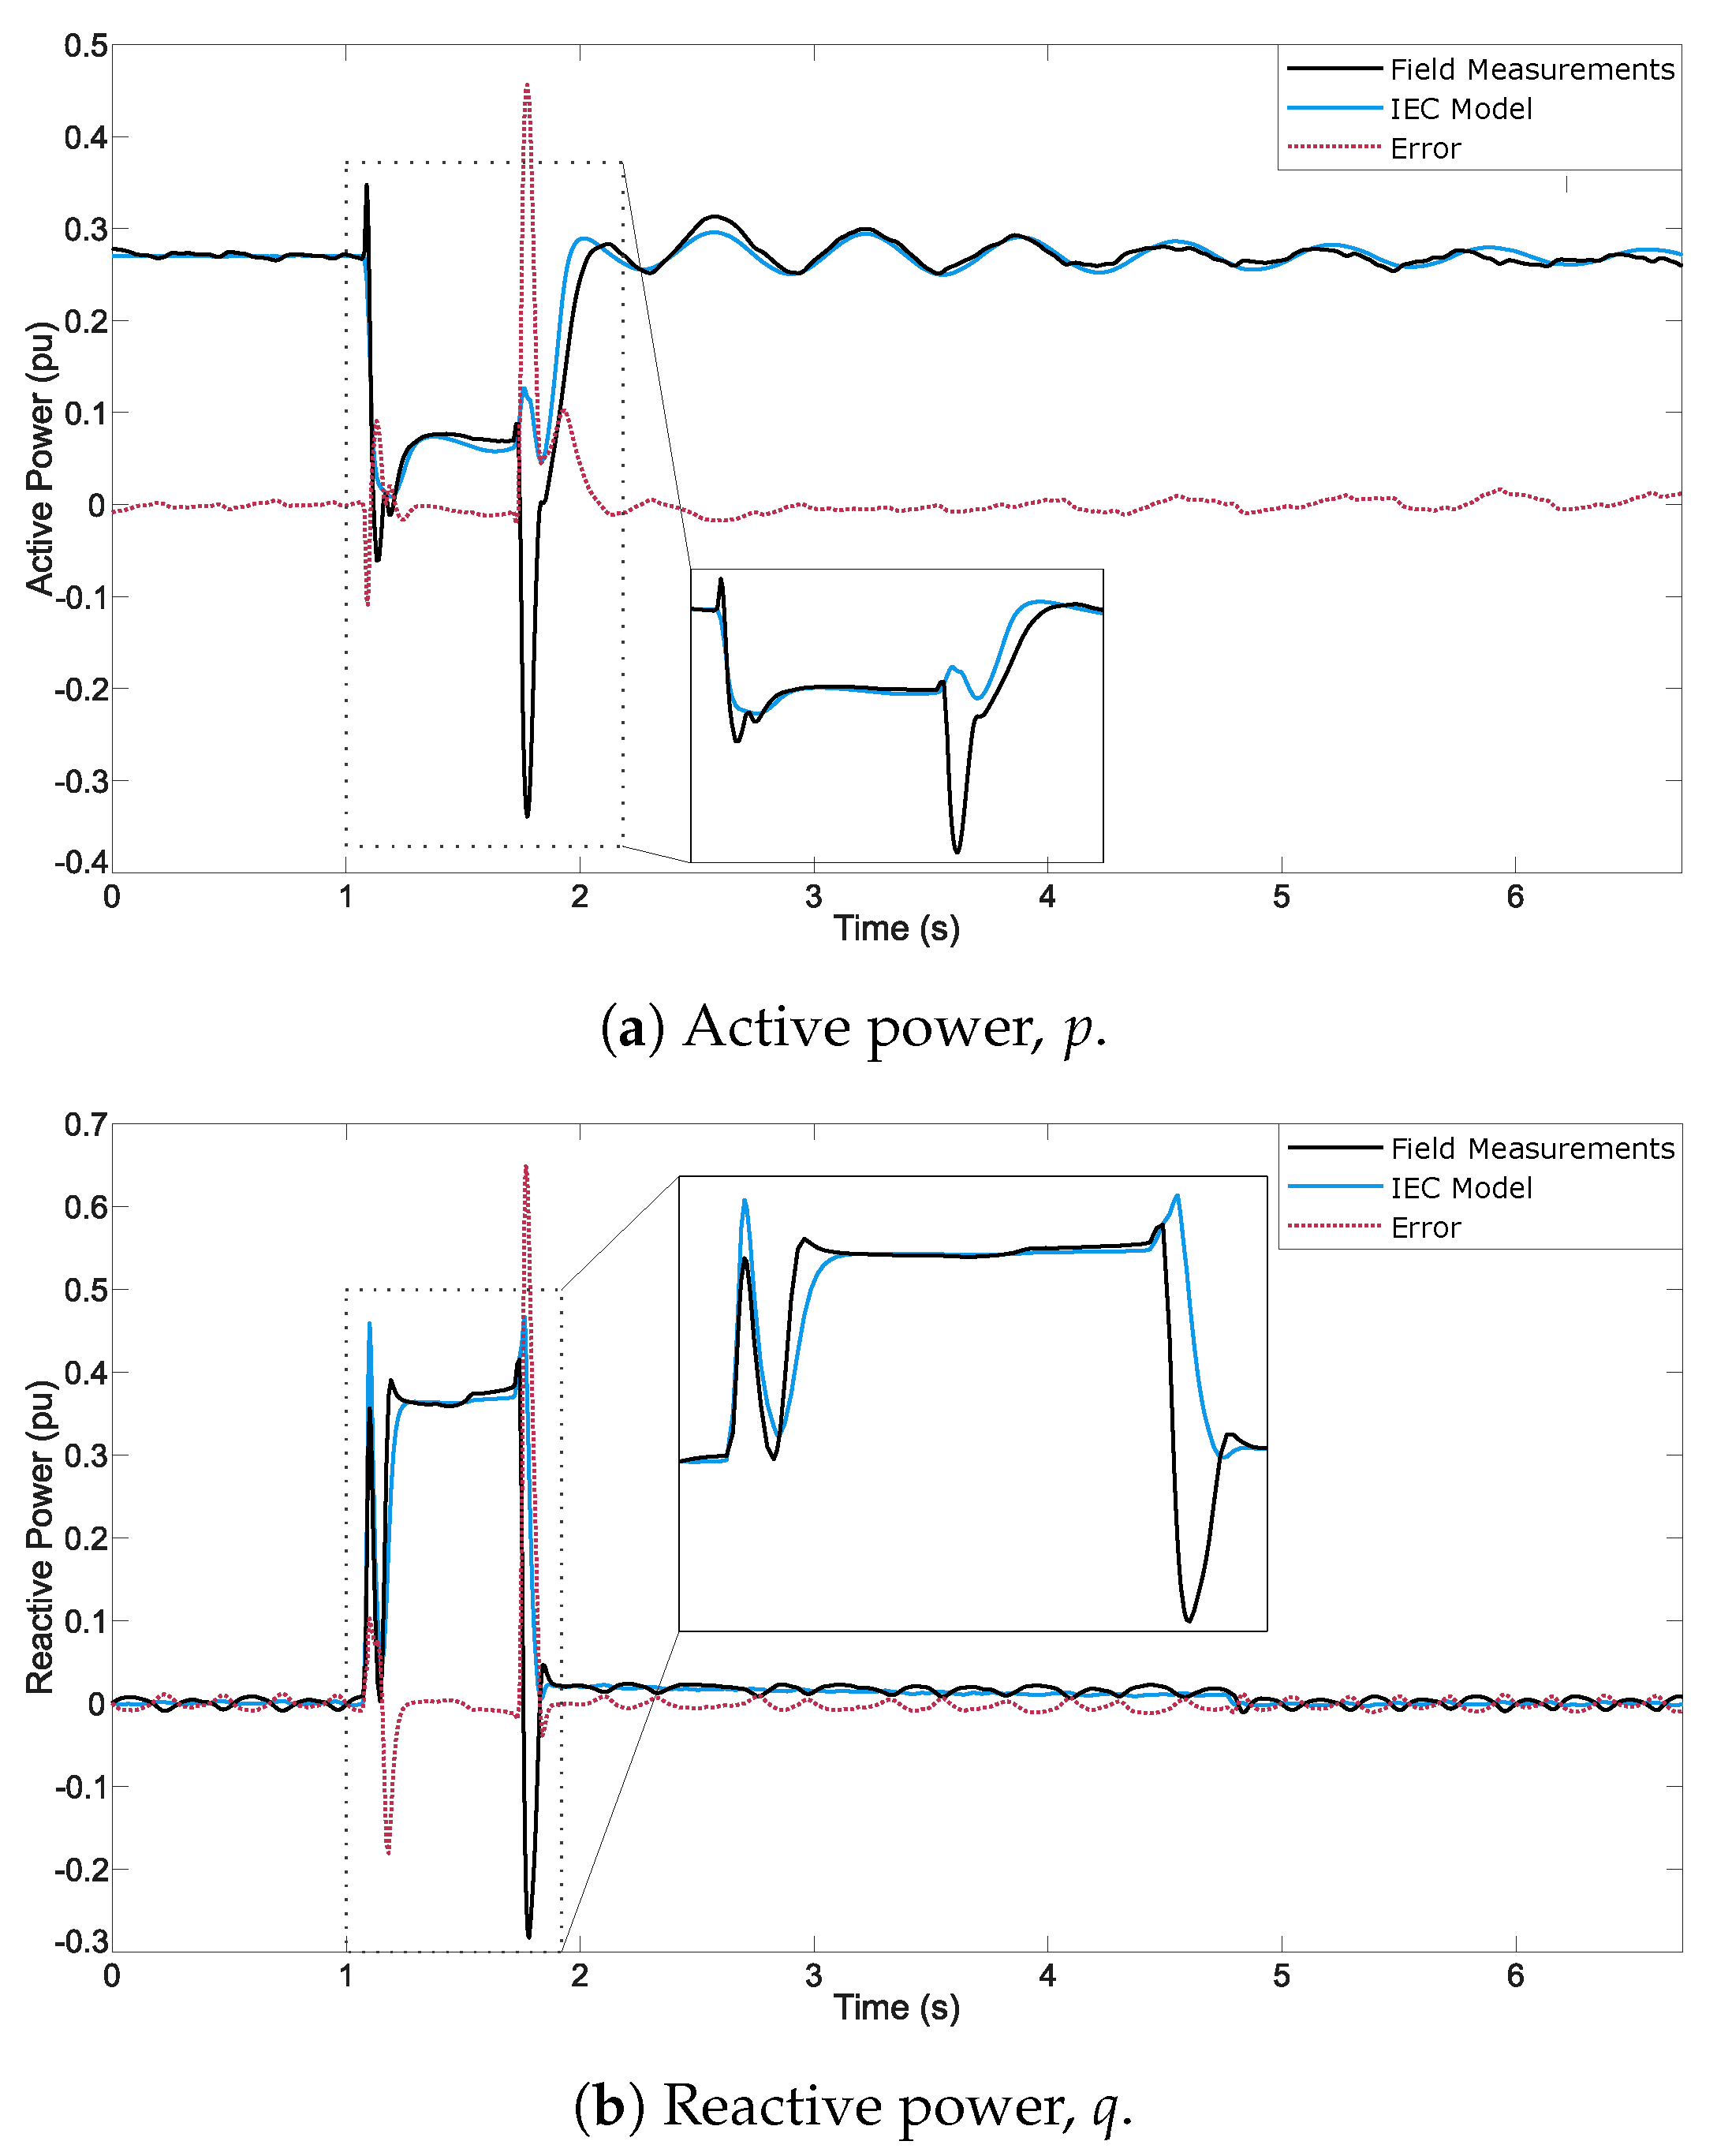
  • Test case 2 (TC2), WT operating at partial load conditions of p = 0.27 pu: residual voltage of u = 0.25 pu and dip duration of t = 625 ms. The active and reactive power responses of this test are shown in Figure 6.
As in the case of the detailed WT simulation model (see Section 4.1), the playback validation approach is also followed in this case to reproduce the voltage dip measured at the actual WT in the generic WT model. Therefore, the IEC DFIG WT simulation model can be considered validated according to both the NTS and the TG 4 guidelines if the validation errors listed in Section 2.2 are below their corresponding thresholds, depicted in Table 1. Partly because the playback validation approach was followed [24], the simulation results and the field tests are usually very similar during the pre-fault period. Therefore, of the three time windows defined within the voltage dip window for comparison [22,26], the pre-fault is the least critical and is not assessed in this case.
Table 4 and Table 5 show, for the full and partial load conditions, respectively, the validation results obtained for the active and reactive power responses of the IEC DFIG WT simulation model under voltage dips. As can be observed from these tables, the IEC generic DFIG WT simulation model fulfills both the NTS and TG 4 validation criteria, since the performance indicators are below the thresholds established in all cases.
It can be affirmed that both the simulated active and reactive powers of the IEC model fit quite well to the measured active and reactive powers in both TC1 and TC2 (see Figure 5 and Figure 6, respectively). Low errors are obtained in all cases (see Table 4 and Table 5), in which maximum errors of M X E f a u l t = 0.0698 p u and M X E f a u l t = 0.0471 p u are found in the active and reactive powers, respectively, and correspond to TC1. Mean errors are also low in all cases, reaching a minimum of M E f a u l t = 0.0000 p u in the reactive power in TC2.
As observed in Figure 5 and Figure 6, larger differences between the simulated and measured data are found when the fault occurs and when it is later cleared. This is mainly due to the difficulties encountered when modeling a generic crowbar model that can be adapted to the actual crowbar models developed by the manufacturers. This is because, at the simulation level, the operation of the crowbar protection system multiplies the current by zero in case of a voltage dip, i.e., when the voltage drop is above a specific threshold, and this happens at the start and clearance of the fault. Regarding the active power response of the IEC model after the voltage dip clearance in both TC1 and TC2 (Figure 5a and Figure 6a, respectively), it can be observed that there exists a highly accurate correlation in the amplitude and the phase shift between the measured and the simulated data series. This is because the two-mass model mechanical parameters were adjusted optimally. The minor differences found during this post-fault periods are associated with the complexity of the actual drive train models included in the actual WTs. Regarding the reactive power behavior of the WTs (Figure 5b and Figure 6b), it can be observed how the IEC model accurately emulates the post-fault reactive power injection period to stabilize the voltage.
Finally, there is an aspect that concerns TC2, since the WT is operating at partial load in this case, which is the sub-synchronous operation of the generator. When a severe voltage dip occurs and the WT operates at partial load, the crowbar protection system is activated and there is a sudden consumption of active power, which can be observed in Figure 6a when the fault is cleared. This consumption causes the induction machine of the actual WT to operate in a sub-synchronous mode. However, the generic IEC WT simulation model is unable to represent this active power consumption because its generator system is a simplified model.
Despite the differences observed, it can be concluded that the IEC DFIG WT model provides a sufficiently satisfactory response, offering accurate results that allow these simplified models to fulfill the objective they were developed to. Therefore, it can be stated that the generic Type 3—or DFIG—WT model is validated according to both the Spanish NTS and the German TG 4 guidelines. More information about the implementation and simulation of this DFIG WT model and the appliance of the IEC validation guidelines (the same as those adopted by the NTS and the TG 4), can be found in [24].

5. Conclusions

A number of countries include the use of dynamic WT simulation models as part of the WPPs certification process. These WT models are used either to determine in advance the behavior of the new wind power installations seeking connection to the grid, or are directly used as a key element in the process of the WPP obtaining the certificate of compliance with the specified technical requirements. In this sense, only three countries are known to include these WT simulation models in their grid codes as part of the commissioning of WPPs: Spain, Germany and South Africa. This work conducts a review of the requirements established in these grid codes to validate the behavior of dynamic WT models. In particular, the study evaluates the accuracy of these models’ required responses when subjected to voltage dips, which allows the FRT capability of WPPs to be assessed.
In the case of the Spanish grid code, both the previous and the new validation guidelines are reviewed. According to the previous ones, the PVVC, dynamic WT simulation models can be used during the so-called general verification procedure of WPPs. During the second stage of this process, ‘wind turbine model simulation and validation’, the WT model provided by the manufacturer and representing the actual WT model that forms part of the installation must be subjected to the same voltage dip as that measured at the actual WT. The field tests and the simulated responses of the WT model can then be compared. The model can thus be considered validated if the absolute value of the difference between the values of active and reactive power obtained in the field tests and the active and reactive power simulation values do not exceed the nominal values by 10% in at least 85% of the data series analyzed.
However, the validation criteria considered by the Spanish grid code were changed. In 2019, a new grid code was issued in Spain: the NTS. A new working structure was defined, and new validation criteria for dynamic WT models were adopted. Following the so-called ’conformity assessment procedure through simulation’, dynamic simulation models of power generation modules and/or units can be used to obtain a positive equipment certificate as long as these models are validated according to the new validation guidelines. These new guidelines involve estimating an error times series, obtained as the difference between the simulated and the measured data. Three validation errors or validation performance indicators must also be estimated. Therefore, the dynamic model is considered validated if such validation errors are below the thresholds established for this purpose. At this point, two aspects must be highlighted: (i) the German and Spanish grid codes follow the same validation procedure and criteria; (ii) both grid codes are based on the guidelines issued by the IEC. This IEC validation procedure was developed to test the accuracy of the responses of the so-called generic or standard WT simulation models, also defined by this international entity.
The South African grid code, the latest version of which was issued in 2019, establishes that the national SO and TNSPs can require accurate dynamic WT simulation models to assess in advance the impact of the integration of WPPs on the stability, security and dynamic performance of the national network. During this assessment process, the WPP owner shall provide information on the dynamic modeling data. Moreover, after commissioning the wind power installation, WPP or WT electrical simulation models validated with field measurements shall be provided by the owner to these entities. In this sense, the South African grid code, approved by the NERSA, defines several types of errors. In addition, it also defines acceptable limits of voltage and current deviation for assessment of the simulation models’ accuracy, so that these can be validated with field measurements.
Finally, our application examples consisted of the validation of a detailed WT simulation model according to the previous Spanish PVVC, and the validation of the generic IEC DFIG or Type 3 WT model according to the criteria shared by the Spanish NTS and the German TG 4. These examples successfully demonstrated the practical applicability of the guidelines. Indeed, the simulation models comply with the criteria established in all cases, which means they are suitable for use as part of the certification and commissioning process of WPPs.

Author Contributions

Conceptualization, R.V.-R., A.H.-E. and E.G.-L.; investigation, R.V.-R. and F.J.-B.; methodology, R.V.-R., A.H.-E. and F.J.-B.; project administration, E.G.-L.; supervision, A.H.-E., F.J.-B., Á.M.-G. and E.G.-L.; writing—original draft, R.V.-R.; writing—review and editing, Á.M.-G. All authors have read and agreed to the published version of the manuscript.

Funding

This research was partially funded by the Spanish Ministry of the Economy and Competitiveness and the European Union FEDER (ENE2016-78214-C2-1-R), and by the Council of Communities of Castilla-La Mancha (SBPLY/19/180501/000287).

Acknowledgments

The authors would also like to express their gratitude to the wind turbine manufacturer Siemens Gamesa Renewable Energy for the technical support received.

Conflicts of Interest

The authors declare no conflict of interest. The funders had no role in the design of the study; in the collection, analyses, or interpretation of data; in the writing of the manuscript, or in the decision to publish the results.

Abbreviations

The following abbreviations are used in this manuscript:
ACAuthorized Certifier
AEEAsociación Empresarial Eólica—Spanish wind energy association
CAMGEComponentes Adicionales del MGE—Additional MGE components
DCDirect Current
DFIGDoubly-Fed Induction Generator
DSLDIgSILENT Simulation Language
DSODistribution System Operators
EMTElectromagnetic Transients
FRTFault Ride-Through
GDPGross Domestic Product
IECInternational Electrotechnical Commission
LABLaboratories
LVRTLow-Voltage-Ride-Through
MAEMean Absolute Error
MANManufacturer
MEMean Error
MGEMódulos de Generación de Electricidad—Power generation modules
MXEMaximum Absolute Error
NERSANational Energy Regulator of South Africa
NTSNorma Técnica de Supervisión—Technical supervision standard
PFDIgSILENT PowerFactory
PGSPower Generating Systems
PGUPower Generating Units
POCPoint of Coupling
PO 12.3Operation Procedure 12.3
PVVCProcedure for Verification, Validation and Certification
REERed Eléctrica de España
RESRenewable Energy Sources
RMSRoot Mean Square
SOSystem Operator
TNSPTransmission Network Service Providers
TSOTransmission System Operators
UGEUnidades de Generación de Electricidad—Power generation units
WECCWestern Electricity Coordinating Council
WPPWind Power Plants
WTWind Turbine
WTTWind Turbine Terminals

References

  1. Global Wind Energy Council, GWEC. Global Wind Report 2019; GWEC: Brussels, Belgium, 2020. [Google Scholar]
  2. WindEurope. Wind in Power: 2019 European Statistics; Wind Europe: Brussels, Belgium, 2019. [Google Scholar]
  3. Asociación Empresarial Eólica (Spanish Wind Energy Association). What is Wind Energy? 2020. Available online: https://www.aeeolica.org/en/about-wind-energy/what-is-wind-energy (accessed on 8 March 2020).
  4. Asociación Empresarial Eólica (Spanish Wind Energy Association). Mapa de Instalaciones eóLicas. 2020. Available online: https://www.aeeolica.org/sobre-la-eolica/la-eolica-espana/mapa-de-instalaciones-eolicas (accessed on 9 January 2020).
  5. Yongning, C.; Yan, L.; Zhen, L.; Ziyu, C.; Hongzhi, L. Study on Grid-connected Renewable Energy Grid Code Compliance. In Proceedings of the 2019 IEEE Sustainable Power and Energy Conference (iSPEC), Beijing, China, 21–23 November 2019; pp. 72–75. [Google Scholar]
  6. Ayodele, T.R.; Jimoh, A.; Munda, J.L.; Agee, J. Challenges of Grid Integration of Wind Power on Power System Grid Integrity: A Review. Int. J. Renew. Energy Res. 2012, 2, 9. [Google Scholar]
  7. Islam, M.M.; Hossain, E.; Padmanaban, S.; Brice, C.W. A New Perspective of Wind Power Grid Codes Under Unbalanced and Distorted Grid Conditions. IEEE Access 2020, 8, 15931–15944. [Google Scholar] [CrossRef]
  8. Díaz-González, F.; Hau, M.; Sumper, A.; Gomis-Bellmunt, O. Participation of wind power plants in system frequency control: Review of grid code requirements and control methods. Renew. Sustain. Energy Rev. 2014, 34, 551–564. [Google Scholar] [CrossRef]
  9. Tarafdar Hagh, M.; Khalili, T. A review of fault ride through of PV and wind renewable energies in grid codes. Int. J. Energy Res. 2019, 43, 1342–1356. [Google Scholar] [CrossRef]
  10. Hiremath, R.; Moger, T. Comprehensive review on low voltage ride through capability of wind turbine generators. Int. Trans. Electr. Energy Syst. 2020, e12524. [Google Scholar] [CrossRef]
  11. Karbouj, H.; Rather, Z.H. A Comparative Study on the Impact of Grid Code Regulations on Stability of Wind Integrated Power Systems. In Proceedings of the 2019 1st Global Power, Energy and Communication Conference (GPECOM), Nevsehir, Turkey, 12–15 June 2019; pp. 342–347. [Google Scholar]
  12. Tsili, M.; Patsiouras, C.; Papathanassiou, S. Grid code requirements for large wind farms: A review of technical regulations and available wind turbine technologies. In Proceedings of the EWEC, Brussels, Belgium, 31 March–3 April 2008; pp. 1–10. [Google Scholar]
  13. Gao, D.W.; Muljadi, E.; Tian, T.; Miller, M.; Wang, W. Comparison of Standards and Technical Requirements of Grid-Connected Wind Power Plants in China and the United States; Technical Report; National Renewable Energy Lab. (NREL): Golden, CO, USA, 2016. [Google Scholar]
  14. Chowdhury, A.H.; Mannan, T.I.; Irfan, N.; Zuhaira, A. A Comparative Study of Bangladesh Grid Code. In Proceedings of the 2019 IEEE Asia Power and Energy Engineering Conference (APEEC), Chengdu, China, 29–31 March 2019; pp. 161–166. [Google Scholar]
  15. Endegnanew, A.; Tedeschi, E.; Marvik, J.; Torres-Olguin, R.; d’Arco, S. Marinet deliverable 2.26—Collation of European grid codes. Mar. Renew. Infrastruct. Netw. Tech. Rep. Mar. 2013, 1–39. [Google Scholar]
  16. Robles, E.; Haro-Larrode, M.; Santos-Mugica, M.; Etxegarai, A.; Tedeschi, E. Comparative analysis of European grid codes relevant to offshore renewable energy installations. Renew. Sustain. Energy Rev. 2019, 102, 171–185. [Google Scholar] [CrossRef]
  17. Sourkounis, C.; Tourou, P. Grid code requirements for wind power integration in Europe. In Conference Papers in Energy; Hindawi: Cairo, Egypt, 2013; Volume 2013. [Google Scholar]
  18. Rona, B.; Güler, Ö. Power system integration of wind farms and analysis of grid code requirements. Renew. Sustain. Energy Rev. 2015, 49, 100–107. [Google Scholar] [CrossRef]
  19. Barus, D.H.; Dalimi, R. A review of Indonesia grid code adaptation toward variable renewable energy penetration. In Proceedings of the AIP Conference, Padang, Indonesia, 22–24 July 2019; AIP Publishing LLC: Melville, NY, USA, 2020; Volume 2230, p. 050009. [Google Scholar]
  20. Wu, Y.K.; Chang, S.M.; Mandal, P. Grid-connected wind power plants: A survey on the integration requirements in modern grid codes. IEEE Trans. Ind. Appl. 2019, 55, 5584–5593. [Google Scholar] [CrossRef]
  21. Kundur, P.; Paserba, J.; Ajjarapu, V.; Andersson, G.; Bose, A.; Canizares, C.; Hatziargyriou, N.; Hill, D.; Stankovic, A.; Taylor, C.; et al. Definition and classification of power system stability IEEE/CIGRE joint task force on stability terms and definitions. IEEE Trans. Power Syst. 2004, 19, 1387–1401. [Google Scholar]
  22. IEC 61400-27-1 Ed. 2. Wind turbines—Part 27-1: Electrical Simulation Models for Wind Power Generation—Wind Turbines; International Electrotechnical Commission: Geneva, Switzerland, 2020.
  23. WECC REMTF. WECC Second Generation of Wind Turbine Models Guidelines; Technical Report; WECC: Salt Lake City, UT, USA, 2014. [Google Scholar]
  24. Villena-Ruiz, R.; Honrubia-Escribano, A.; Fortmann, J.; Gómez-Lázaro, E. Field validation of a standard Type 3 wind turbine model implemented in DIgSILENT-PowerFactory following IEC 61400-27-1 guidelines. Int. J. Electr. Power Energy Syst. 2020, 116, 105553. [Google Scholar] [CrossRef]
  25. Lorenzo-Bonache, A.; Villena-Ruiz, R.; Honrubia-Escribano, A.; Gómez-Lázaro, E. Operation of active and reactive control systems of a generic Type 3 WT model. In Proceedings of the 11th IEEE International Conference on Compatibility, Power Electronics and Power Engineering (CPE-POWERENG), Cadiz, Spain, 4–6 April 2017; pp. 606–610. [Google Scholar]
  26. Villena-Ruiz, R.; Lorenzo-Bonache, A.; Honrubia-Escribano, A.; Jiménez-Buendía, F.; Gómez-Lázaro, E. Implementation of IEC 61400-27-1 Type 3 Model: Performance Analysis under Different Modeling Approaches. Energies 2019, 12, 2690. [Google Scholar] [CrossRef] [Green Version]
  27. Red Eléctrica de España. Norma TéCnica de Supervisión de la Conformidad de los MóDulos de Generación de Electricidad Según el Reglamento UE 2016/631; Technical Report; Red Eléctrica de España: Madrid, Spain, 2019. [Google Scholar]
  28. Ministerio de Industria, Comercio y Turismo. P.O. 12.3. Requisitos de Respuesta Frente a Huecos de Tensión de las Instalaciones Eólicas; Technical Report; Ministerio de Industria, Comercio y Turismo: Madrid, Spain, 2006.
  29. AEE. Procedimientos de Verificación, Validación y Certificación de los Requisitos del PO 12.3 Sobre la Respuesta de las Instalaciones Eólicas y Fotovoltaicas ante Huecos de Tensión (in Spanish), 11th ed.; Asociación Empresarial Eólica: Madrid, Spain, 2012. [Google Scholar]
  30. Villena-Ruiz, R.; Jiménez-Buendía, F.; Honrubia-Escribano, A.; Molina-García, Á.; Gómez-Lázaro, E. Compliance of a Generic Type 3 WT Model with the Spanish Grid Code. Energies 2019, 12, 1631. [Google Scholar] [CrossRef] [Green Version]
  31. Jiménez, F.; Gómez-Lázaro, E.; Fuentes, J.A.; Molina-García, A.; Vigueras-Rodríguez, A. Validation of a double fed induction generator wind turbine model and wind farm verification following the Spanish grid code. Wind Energy 2012, 15, 645–659. [Google Scholar] [CrossRef]
  32. Jiménez, F.; Gómez-Lázaro, E.; Fuentes, J.A.; Molina-García, A.; Vigueras-Rodríguez, A. Validation of a DFIG wind turbine model submitted to two-phase voltage dips following the Spanish grid code. Renew. Energy 2013, 57, 27–34. [Google Scholar] [CrossRef]
  33. Jiménez-Buendía, F.; Villena-Ruiz, R.; Honrubia-Escribano, A.; Molina-García, Á.; Gómez-Lázaro, E. Submission of a WECC DFIG wind turbine model to Spanish operation procedure 12.3. Energies 2019, 12, 3749. [Google Scholar] [CrossRef] [Green Version]
  34. Steinhaeuser, L.; Coumont, M.; Weck, S.; Hanson, J. Comparison of RMS and EMT Models of Converter-Interfaced Distributed Generation Units Regarding Analysis of Short-Term Voltage Stability. In Proceedings of the NEIS 2019, Conference on Sustainable Energy Supply and Energy Storage Systems, Hamburg, Deutschland, 19–20 September 2019; pp. 1–6. [Google Scholar]
  35. Honrubia-Escribano, A.; Gómez-Lázaro, E.; Fortmann, J.; Sørensen, P.; Martín-Martínez, S. Generic dynamic wind turbine models for power system stability analysis: A comprehensive review. Renew. Sustain. Energy Rev. 2018, 81, 1939–1952. [Google Scholar] [CrossRef]
  36. IEC 61400-27-2 Ed. 1. Wind Energy Generation Systems—Part 27-2: Electrical Simulation Models—Model Validation; International Electrotechnical Commission: Geneva, Switzerland, 2020.
  37. FGW, e.V. TG 4—Demands on Modelling and Validating Simulation Models of the Electrical Characteristics of Power Generating Units and Systems, Storage Systems as Well as their Components; Technical Report; Fördergesellschaft Windenergie und andere Dezentrale Energien (FGW e.V.): Berlin, Germany, 2019. [Google Scholar]
  38. FGW, e.V. TG 3—Determination of the Electrical Characteristics of Power Generating Units in Medium-, High- and Extra-High Voltage Grids; Technical Report; Fördergesellschaft Windenergie und andere Dezentrale Energien (FGW e.V.): Berlin, Germany, 2019. [Google Scholar]
  39. FGW, e.V. TG 8—Certification of the Electrical Characteristics of Power Generating Units, Systems and Storage Systems as well as their Components on the Grid; Technical Report; Fördergesellschaft Windenergie und andere Dezentrale Energien (FGW e.V.): Berlin, Germany, 2019. [Google Scholar]
  40. NERSA. Grid Connection Code for Renewable Power Plants (RPPs) Connected to the Electricity Transmission System (TS) or the Distribution System (DS) in South Africa; Technical Report; National Energy Regulator of South Africa (NERSA): Pretoria, South Africa, 2019. [Google Scholar]
  41. Nobela, O.N.; Bansal, R.C.; Justo, J.J. A review of power quality compatibility of wind energy conversion systems with the South African utility grid. Renew. Energy Focus 2019, 31, 63–72. [Google Scholar] [CrossRef]
  42. Nhlapo, B.; Awodele, K. Review and comparison of the South African grid code requirements for wind generation with the European countries’ grid codes. In Proceedings of the 2020 International SAUPEC/RobMech/PRASA Conference, Cape Town, South Africa, 29–31 January 2020; pp. 1–6. [Google Scholar]
  43. Asmine, M.; Brochu, J.; Fortmann, J.; Gagnon, R.; Kazachkov, Y.; Langlois, C.E.; Larose, C.; Muljadi, E.; MacDowell, J.; Pourbeik, P.; et al. Model validation for wind turbine generator models. IEEE Trans. Power Syst. 2010, 26, 1769–1782. [Google Scholar] [CrossRef]
  44. Honrubia-Escribano, A.; Jiménez-Buendía, F.; Gómez-Lázaro, E.; Fortmann, J. Validation of generic models for variable speed operation wind turbines following the recent guidelines issued by IEC 61400-27. Energies 2016, 9, 1048. [Google Scholar] [CrossRef] [Green Version]
Figure 1. WT model validation flowchart under voltage dips, following NTS guidelines.
Electronics 09 01707 g001
Figure 2. Active and reactive power comparison between the field measurements and the simulation responses of a Siemens Gamesa G52 WT under a voltage dip with WT operating at full load conditions.
Electronics 09 01707 g002
Figure 3. Active and reactive power comparison between the field measurements and the simulation responses of a Siemens Gamesa G52 WT under a voltage dip with WT operating at partial load conditions.
Electronics 09 01707 g003
Figure 4. Modular structure of the IEC generic Type 3B WT model adapted from [22].
Electronics 09 01707 g004
Figure 5. Active and reactive power comparison between the field measurements and the simulation responses of a DFIG Siemens Gamesa WT under a voltage dip. TC1, WT operating at full load conditions.
Electronics 09 01707 g005aElectronics 09 01707 g005b
Figure 6. Active and reactive power comparison between the field measurements and the simulation responses of a DFIG Siemens Gamesa WT under a voltage dip. TC2, WT operating at partial load conditions.
Electronics 09 01707 g006
Table 1. Acceptable limits for validation of dynamic WT simulation models as part of the WPP certification process following Spanish NTS and German TG 4 guidelines (see Section 3.1).
Time WindowActive PowerReactive PowerActive CurrentReactive Current
MXEMEMAEMXEMEMAEMXEMEMAEMXEMEMAE
Threshold (pu)Pre-fault0.150±0.1000.1200.150±0.1000.1200.150±0.1000.1200.150±0.1000.120
Fault0.170±0.1500.1700.170±0.1500.1700.500±0.3000.4000.170±0.1500.170
Post-fault0.170±0.1500.1700.170±0.1500.1700.170±0.1500.1700.170±0.1500.170
Table 2. Acceptable voltage and current deviation limits for validation of dynamic WT simulation models as part of the WPP commissioning process following the South African grid connection code.
Variable to ValidatePhasesAverage Absolute Error of Sample-by-Sample EvaluationError Band in Sample-by-Sample EvaluationAverage Error of One Cycle RMS Values
VoltageA, B, C≤5%≤±10%-
CurrentA, B, C≤15%≤±20%≤15%
Table 3. Verification of the Procedure for Verification, Validation and Certification (PVVC) validation criteria applied to the manufacturer detailed WT simulation model.
Load ConditionsMagnitudeMax. Deviation (pu)Mandatory Points below 0.1 pu (%)Points below 0.1 pu (%)Compliance
Full loadActive Power, P0.108589
Reactive Power, Q 0.108592
Partial loadActive Power, P0.108599
Reactive Power, Q0.108599
Table 4. Verification of the NTS and TG 4 validation criteria applied to the generic WT simulation model under voltage dips: WT operating at full load conditions, TC1, u = 0.50  pu, t = 920  ms.
Active Power, PReactive Power, Q
ThresholdsModel Validation ResultsComplianceThresholdsModel Validation ResultsCompliance
(pu)(pu) (pu)(pu)
M E f a u l t ±0.1500.0048±0.1500.0054
M A E f a u l t 0.1700.02500.1700.0069
M X E f a u l t 0.1700.06980.1700.0231
M E p o s t ±0.1500.0138±0.1500.0052
M A E p o s t 0.1700.02350.1700.0144
M X E p o s t 0.1700.06000.1700.0471
Table 5. Verification of the NTS and TG 4 validation criteria applied to the generic WT simulation model under voltage dips: WT operating at partial load conditions, TC2, p = 0.27  pu, u = 0.25  pu, t = 625  ms.
Active Power, PReactive Power, Q
ThresholdsModel validation resultsComplianceThresholdsModel validation resultsCompliance
(pu)(pu) (pu)(pu)
M E f a u l t ±0.150−0.0051±0.1500.0000
M A E f a u l t 0.1700.00770.1700.0065
M X E f a u l t 0.1700.01620.1700.0460
M E p o s t ±0.1500.0153±0.1500.0131
M A E p o s t 0.1700.02200.1700.0207
M X E p o s t 0.1700.01750.1700.0122
Publisher’s Note: MDPI stays neutral with regard to jurisdictional claims in published maps and institutional affiliations.

