Article

An Adaptive Current Limiting Controller for a Wireless Power Transmission System Energized by a PV Generator

1
Department of Electrical and Electronic Engineering, University of Kerbala, Karbala 56001, Iraq
2
College of Electrical Engineering, Zhejiang University, Hangzhou 310027, China
3
School of Electric Power Engineering, South China University of Technology, Guangzhou 510640, China
*
Authors to whom correspondence should be addressed.
Electronics 2020, 9(10), 1648; https://doi.org/10.3390/electronics9101648
Submission received: 2 September 2020 / Revised: 29 September 2020 / Accepted: 3 October 2020 / Published: 10 October 2020
(This article belongs to the Special Issue Advances in Wireless Power Transfer and Applications)

Abstract

:
The use of a wireless power transmission system (WPTS) in modern applications, such as consumer electronics, renewable energy sources (RESs) and electric vehicles (EVs), can significantly increase the safety and convenience of the power supply. However, low efficiency is a major hurdle to the use of a WPTS in these applications. In this article, an adaptive virtual impedance controller (AVIC) is presented to enhance the wireless power transfer (WPT) efficiency of a photovoltaic generator (PVG) to the load. In the proposed controller, a unique method is employed to adaptively estimate the coefficient of coupling and resonant frequency of the WPTS coils as a function of the distance between the coils. Moreover, a modified incremental conductance (IC) based maximum power tracking (MIC-MPPT) technique is presented to operate the PVG at MPPT mode. The proposed MIC-MPPT is tested via a hardware prototype and the controller validation is carried out in the MATLAB/SIMULINK environment under various uncertainties, such as intermittent irradiance, variable load, and the distance between transmitter (Tx) and receiver (Rx) coils. Finally, a comparative analysis between the proposed controller and the conventional non-adaptive and adaptive resonant frequency controller is presented which confirms the superiority of the proposed controller.

1. Introduction

Currently, renewable energy resources (RESs), particularly photovoltaic (PV) and wind energy, are being increasingly employed in a significant number of applications, including charging of electric vehicles (EVs), grid integration, islanded power generation, and heating systems [1]. The reduction in the cost of RESs and associated environmental benefits are the obvious reasons for this progressive rise. Various innovative ideas have been introduced in the literature to ensure a more economical, safe, and convenient transfer of power from RESs to load. For this reason, the pursuit of wireless transmission was initiated by Nikola Tesla in 1889 [2].
Short-distance wireless power transmission systems (WPTSs) can be classified into two methods: inductive coupling and capacitive coupling. In these methods, the transmitting electrical energy remains oriented in the magnetic field for inductive coupling, and the electric field for capacitive coupling, of the transmitter (Tx) coil. The current study investigated WPTS based on inductive coupling. If the receiver (Rx) coil is misaligned or distant from the range of the magnetic field of the Tx coil, the output power reduces to zero [3]. Although the principle operation of the WPTS using inductive/capacitive coupling involves the generation of strong electromagnetic fields, these magnetic fields may cause diseases in humans. For such cases, the European Council of Recommendation (ECR) recommended that magnetic fields should be less than 5 μT at a resonant frequency of less than 100 kHz [4]. For operation of WPTSs, a transmitter device is used to generate a time-varying electromagnetic field to transmit power to a receiving-end device. This receiver extracts power from the field and supplies it to an electrical appliance. In this manner, power is transmitted without the use of wires. Wireless transmission of power replaces the use of wires, thus increasing mobility, convenience, and safety. The WPTS is useful in applications in which the connections of wires are inconvenient, hazardous, or not possible due to their location [5].
The principle of spaced-mutual induction can be understood by the operation of a transformer that has no contact between primary and secondary windings. Power is transmitted over the electromagnetic spaced-coupling between the two coils. Here, the transmission depends on the mutual induction principle determined by the distance between sending and receiving devices [5]. In this article, the resonant inductive coupling strategy is applied to transmit power within a mid-range distance. Although resonant coupling operates based on the same principles of inductive coupling, it uses the additional feature of resonance to increase the range at which the energy transfer can efficiently take place. In this article, adaptive resonant frequency is used, and can maximize the amplitude of the waves being sent from the sending end coils. More details about the resonant frequency in inductive coupling are given in [6].
In the proposed work, parameters such as the geometry of the Tx and Rx coils, and the distance between them, are varied to achieve the resonant frequency which consequently affects the gain of voltage produced within the coils [7]. Moreover, the mutual inductance between the coils is also calculated with a new empirical formula to improve the efficiency of the overall WPTS. In Figure 1, the block diagram of the proposed system is provided, and includes the following parts: a photovoltaic generator (PVG) as the input power source; a boost converter for implementing the modified maximum power tracking (MPPT) controller (MIC-MPPT); an H-bridge inverter, which is controlled by the proposed adaptive virtual impedance controller (AVIC) for maximum power transfer for the PVG to the load; oscillating circuits connecting with Tx and Rx coils; and variable resistive load.
The proposed WPTS is generally applicable to the interior wheel motor (IWM) in EVs (as shown in Figure 1 [8]), charging of EVs in a solar PV parking garage [9,10], building integrated photovoltaics (BIPV) [11], and biomedical uses such as implants [12]. The proposed study is particularly suited to the application of an IWM. The power and control cables of an IWM are vulnerable to difficult environmental conditions. Due to these conditions, the connections of the power and control cables may degrade over time and are likely to be disconnected due to EV vibration. Therefore, a WPTS can reduce the vulnerability due to power and control cable failures and consequently improve the performance of the IWM [8]. Moreover, integrating RESs in WPTS applications with higher efficiency can substantially enhance the portability of the electronic devices.
To tackle these industrial problems, various studies have been described in the literature using different aspects of WPTSs. The authors in [6] reported a WPTS technique for a PVG, however, neither a quantitative study nor experiment-based results were presented. In [10], an experimental setup was used to evaluate a WPTS with a PVG as a source of energy, however, the study did not provide any data for improving the accuracy of evaluating mutual inductance. The focus of the proposed strategy was to facilitate the design procedure of a WPTS by introducing a new empirical expression which provides flexibility in choosing the coils’ dimensions. In [8], a detailed study on the theoretical and mathematical analysis of WPTS applications for an IWM was proposed. However, the main focus of the paper was based on designing a control system for improved performance under the condition of misalignment of the wheel and vehicle. The authors in [13] thoroughly investigated the effect of mutual inductive-coupling on a WPTS’s efficiency. In this paper, the relationship between the transfer distance and the coils’ size was investigated and demonstrated using a Class-E amplifier circuit.
Currently, several companies offer wireless battery charging systems for EVs. This research topic has been highly investigated by researchers to improve the efficiency of power transfer from hybrid power resources. In [14], an integration topology for a WPTS with a 3 kW power rating was developed based on double-sided LCC compensation topology. In [15], a WPTS for charging a cell phone was designed and implemented using a hardware prototype. The power supply considered was a 3.6 W PV panel and the maximum achieved efficiency was 69.4% at a fixed 241 kHz. In [16], the WPTS’s efficiency was improved by changing the size of the capacitor used in the oscillation circuits. The efficiency improvement was 25% compared to classical methods. In [16], a study was presented for improving the power transfer efficiency of a WPTS energized by a 240 W PVG by enhancing the quality factor of three types of Tx and Rx coils. In this paper, the maximum efficiency (e.g., at 2 cm) was about 83%. In [17], a design scheme for a WPTS was demonstrated based on improvement in the receiving voltage according to the variations of the load and the resonant frequency. The authors in [18] demonstrated that a constant load power can be obtained using a series LLC resonance circuit, which verifies the over-coupling operation. In [19], the design of a closed-loop controller for a WPTS was presented using the following steps: (i) calculating the efficiency of each stage of the WPTS, and consequently computing the entire WPTS’s efficiency; (ii) improving the coupling coefficient by matching the impedance between adjacent stages from the source to load under the variation of the distance between Tx and Rx coils; and (iii) tracking optimal load resistances by adjusting the mutual inductance. In this paper, the entire efficiency of the WPTS (i.e., from the power source to the load) achieved was about 70% under various resistive loads. The authors in [20] presented a hysteresis-based current control (HCC) using power control of the secondary side of a WPTS. An important advancement in this study was that the proposed approach did not require knowledge of the precise information of mutual inductance between the coils. However, the authors claimed that the conduction ratio did not go beyond 70%.
The above literature suggests that the low efficiency of the WPTS demands more research. The wireless BIPV is a more recent application of WPTS, and is still in an early research phase. The challenges and technical aspects of wireless WPTS are given in [11]. Unlike previous research, in the current study, an adaptive virtual impedance controller (AVIC) was developed to enhance the WPTS efficiency under variable loads supplied by a PVG. In the proposed controller, a unique method is employed to adaptively estimate the coefficient of coupling and resonant frequency of the WPTS coils as a function of the distance between the coils. Moreover, the proposed modified incremental conductance based maximum power point tracking (MIC-MPPT) algorithm was practically tested for a PVG under real ambient irradiances. Another purpose of these practical tests was to estimate the maximum DC current value which was used as a constraint for the proposed controller. The proposed controller was also tested under various uncertainties such as (i) the variation of WPTS impedance with the distance between Tx and Rx coils, and (ii) the influence of the adaptive resonant frequency on the efficiency of the WPTS. It is important to mention that the inductive coupling method was applied in this study because it is a suitable technique for near field WPTS applications, and particularly for charging EVs.
Major contributions of this work are summarized as follows: (i) Developing a MIC-MPPT technique to optimally operate the PVG (connected to a WPTS) in MPPT mode. The challenge is to limit the DC current of the PVG to close to the maximum power point (MPP) current under dynamic WPT impedance, which changes according to the distance between the Tx and Rx coils. (ii) Developing an estimator for accurately computing the coefficient of coupling based on practical tests. (iii) Deriving an AVIC for increasing the efficiency of the WPTS by adopting the adaptive resonant frequency to improve the receiving end voltage and to maintain the DC current close to the MPP current. (iv) A comparative analysis between the proposed AVIC and conventional controllers including the non-adaptive PID and adaptive resonant frequency-based HCC.
This manuscript is organized as follows: Section 2 presents the prototype design of the WTPS. In Section 3, the coefficient of coupling and AVIC derivation is presented. Results and discussion are given in Section 4 and conclusions are presented in Section 5.

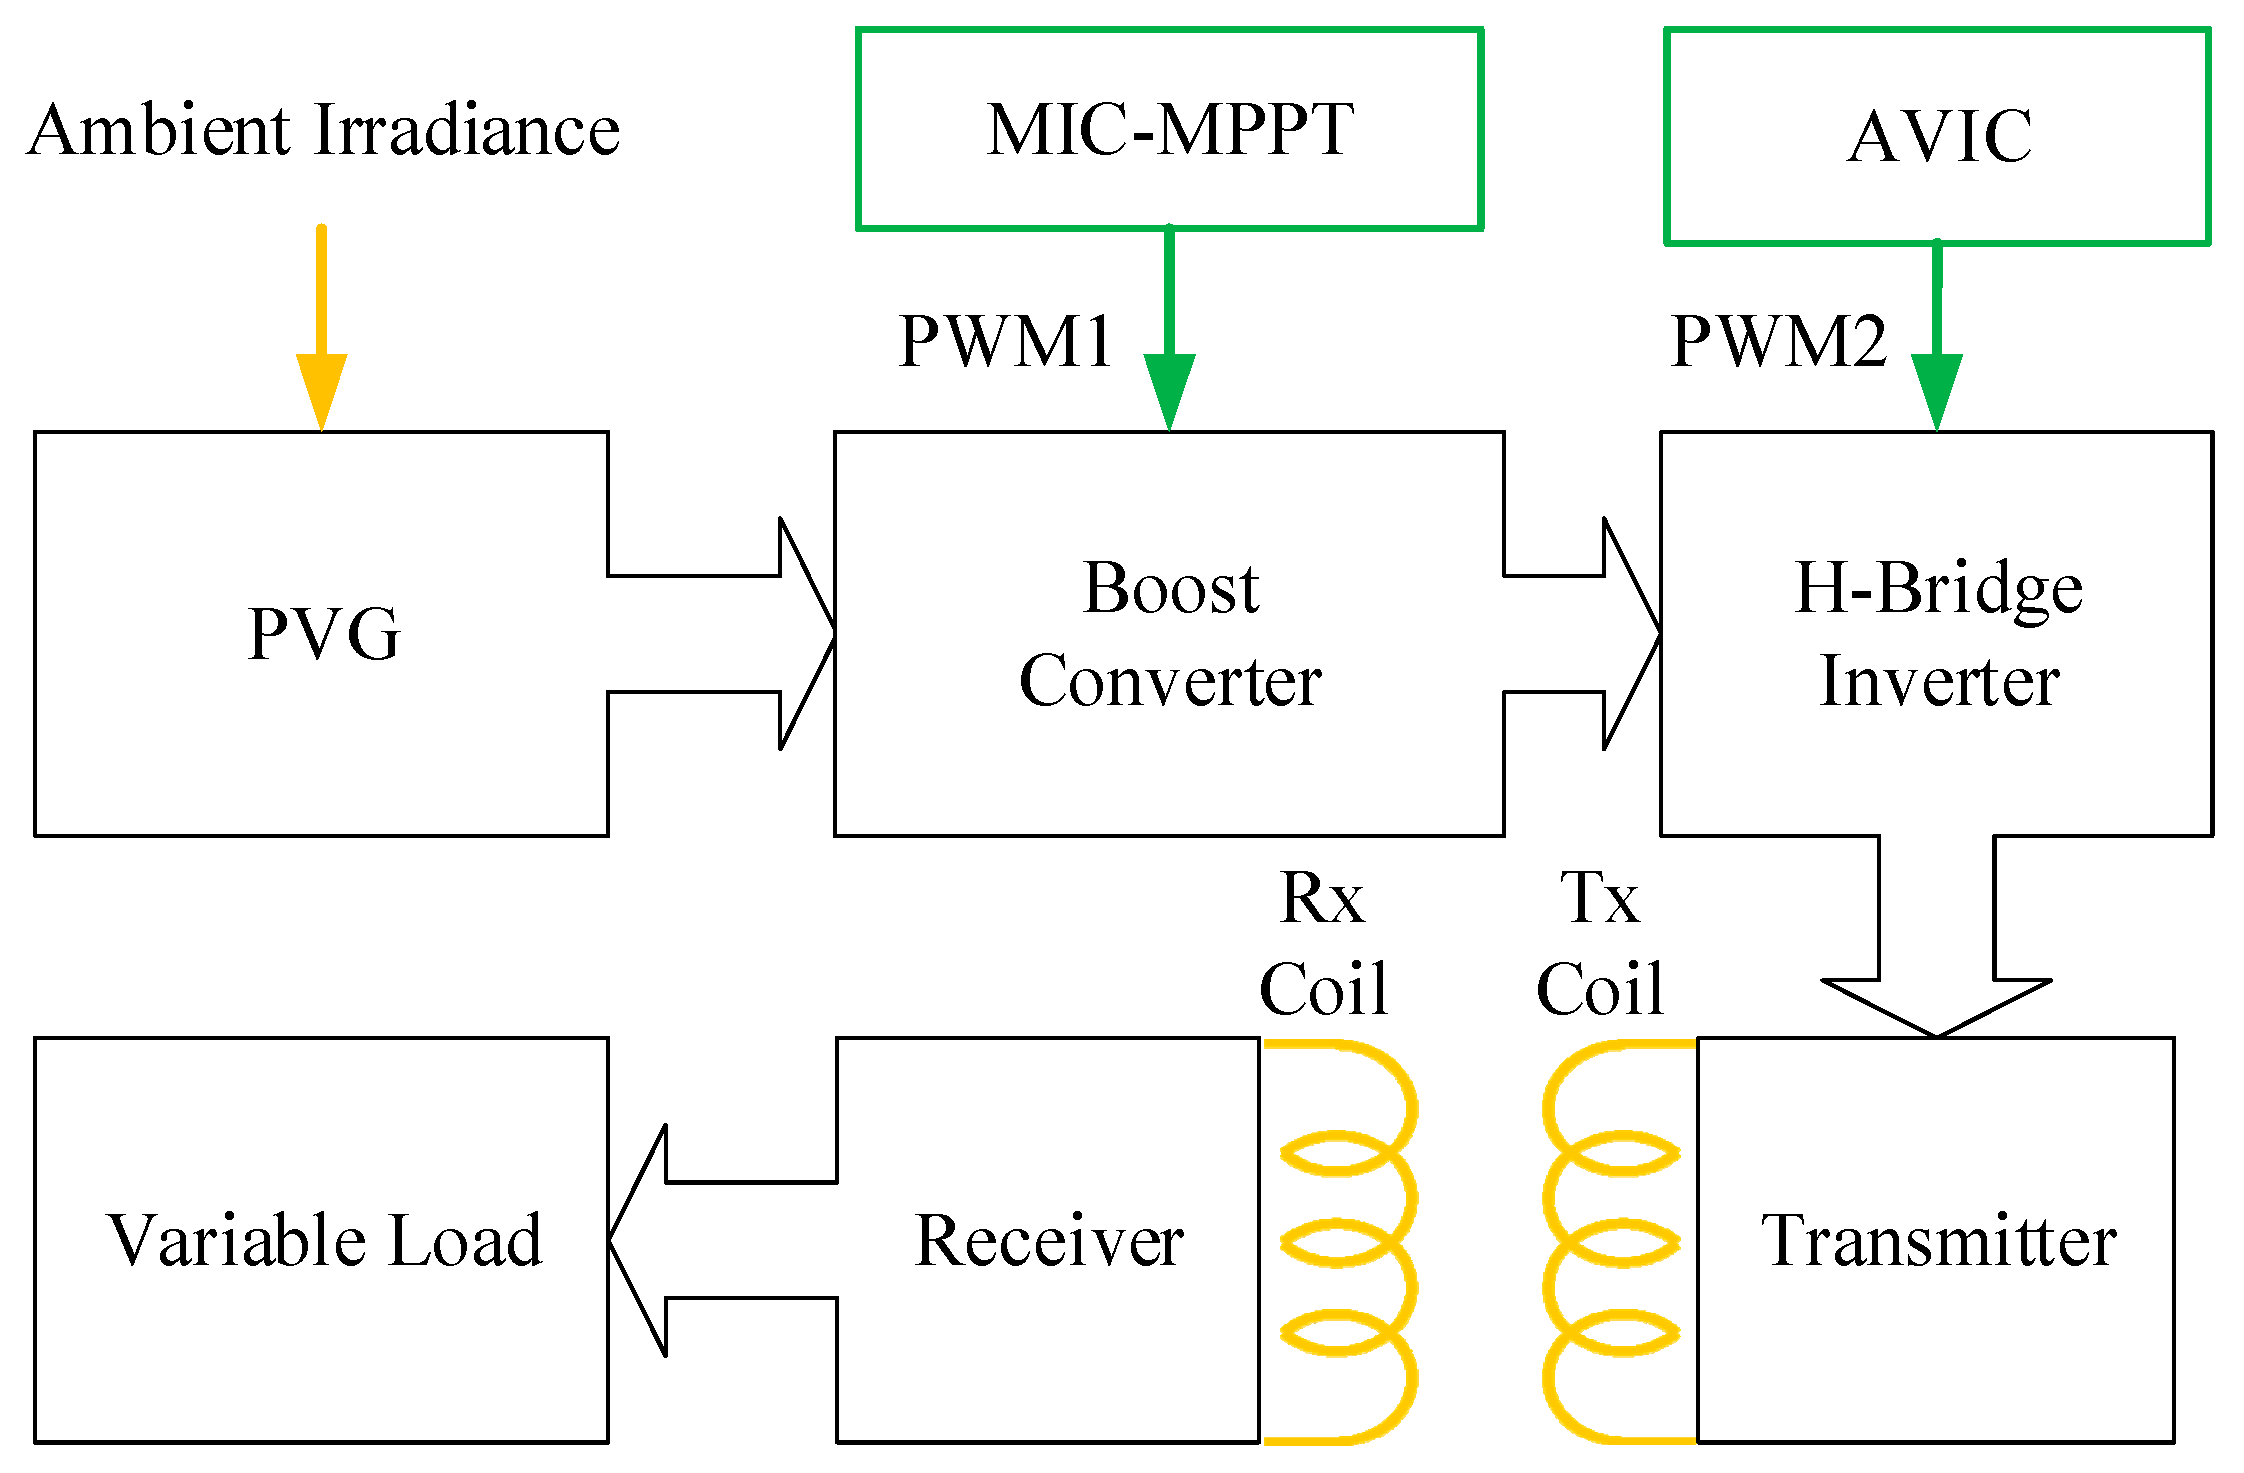
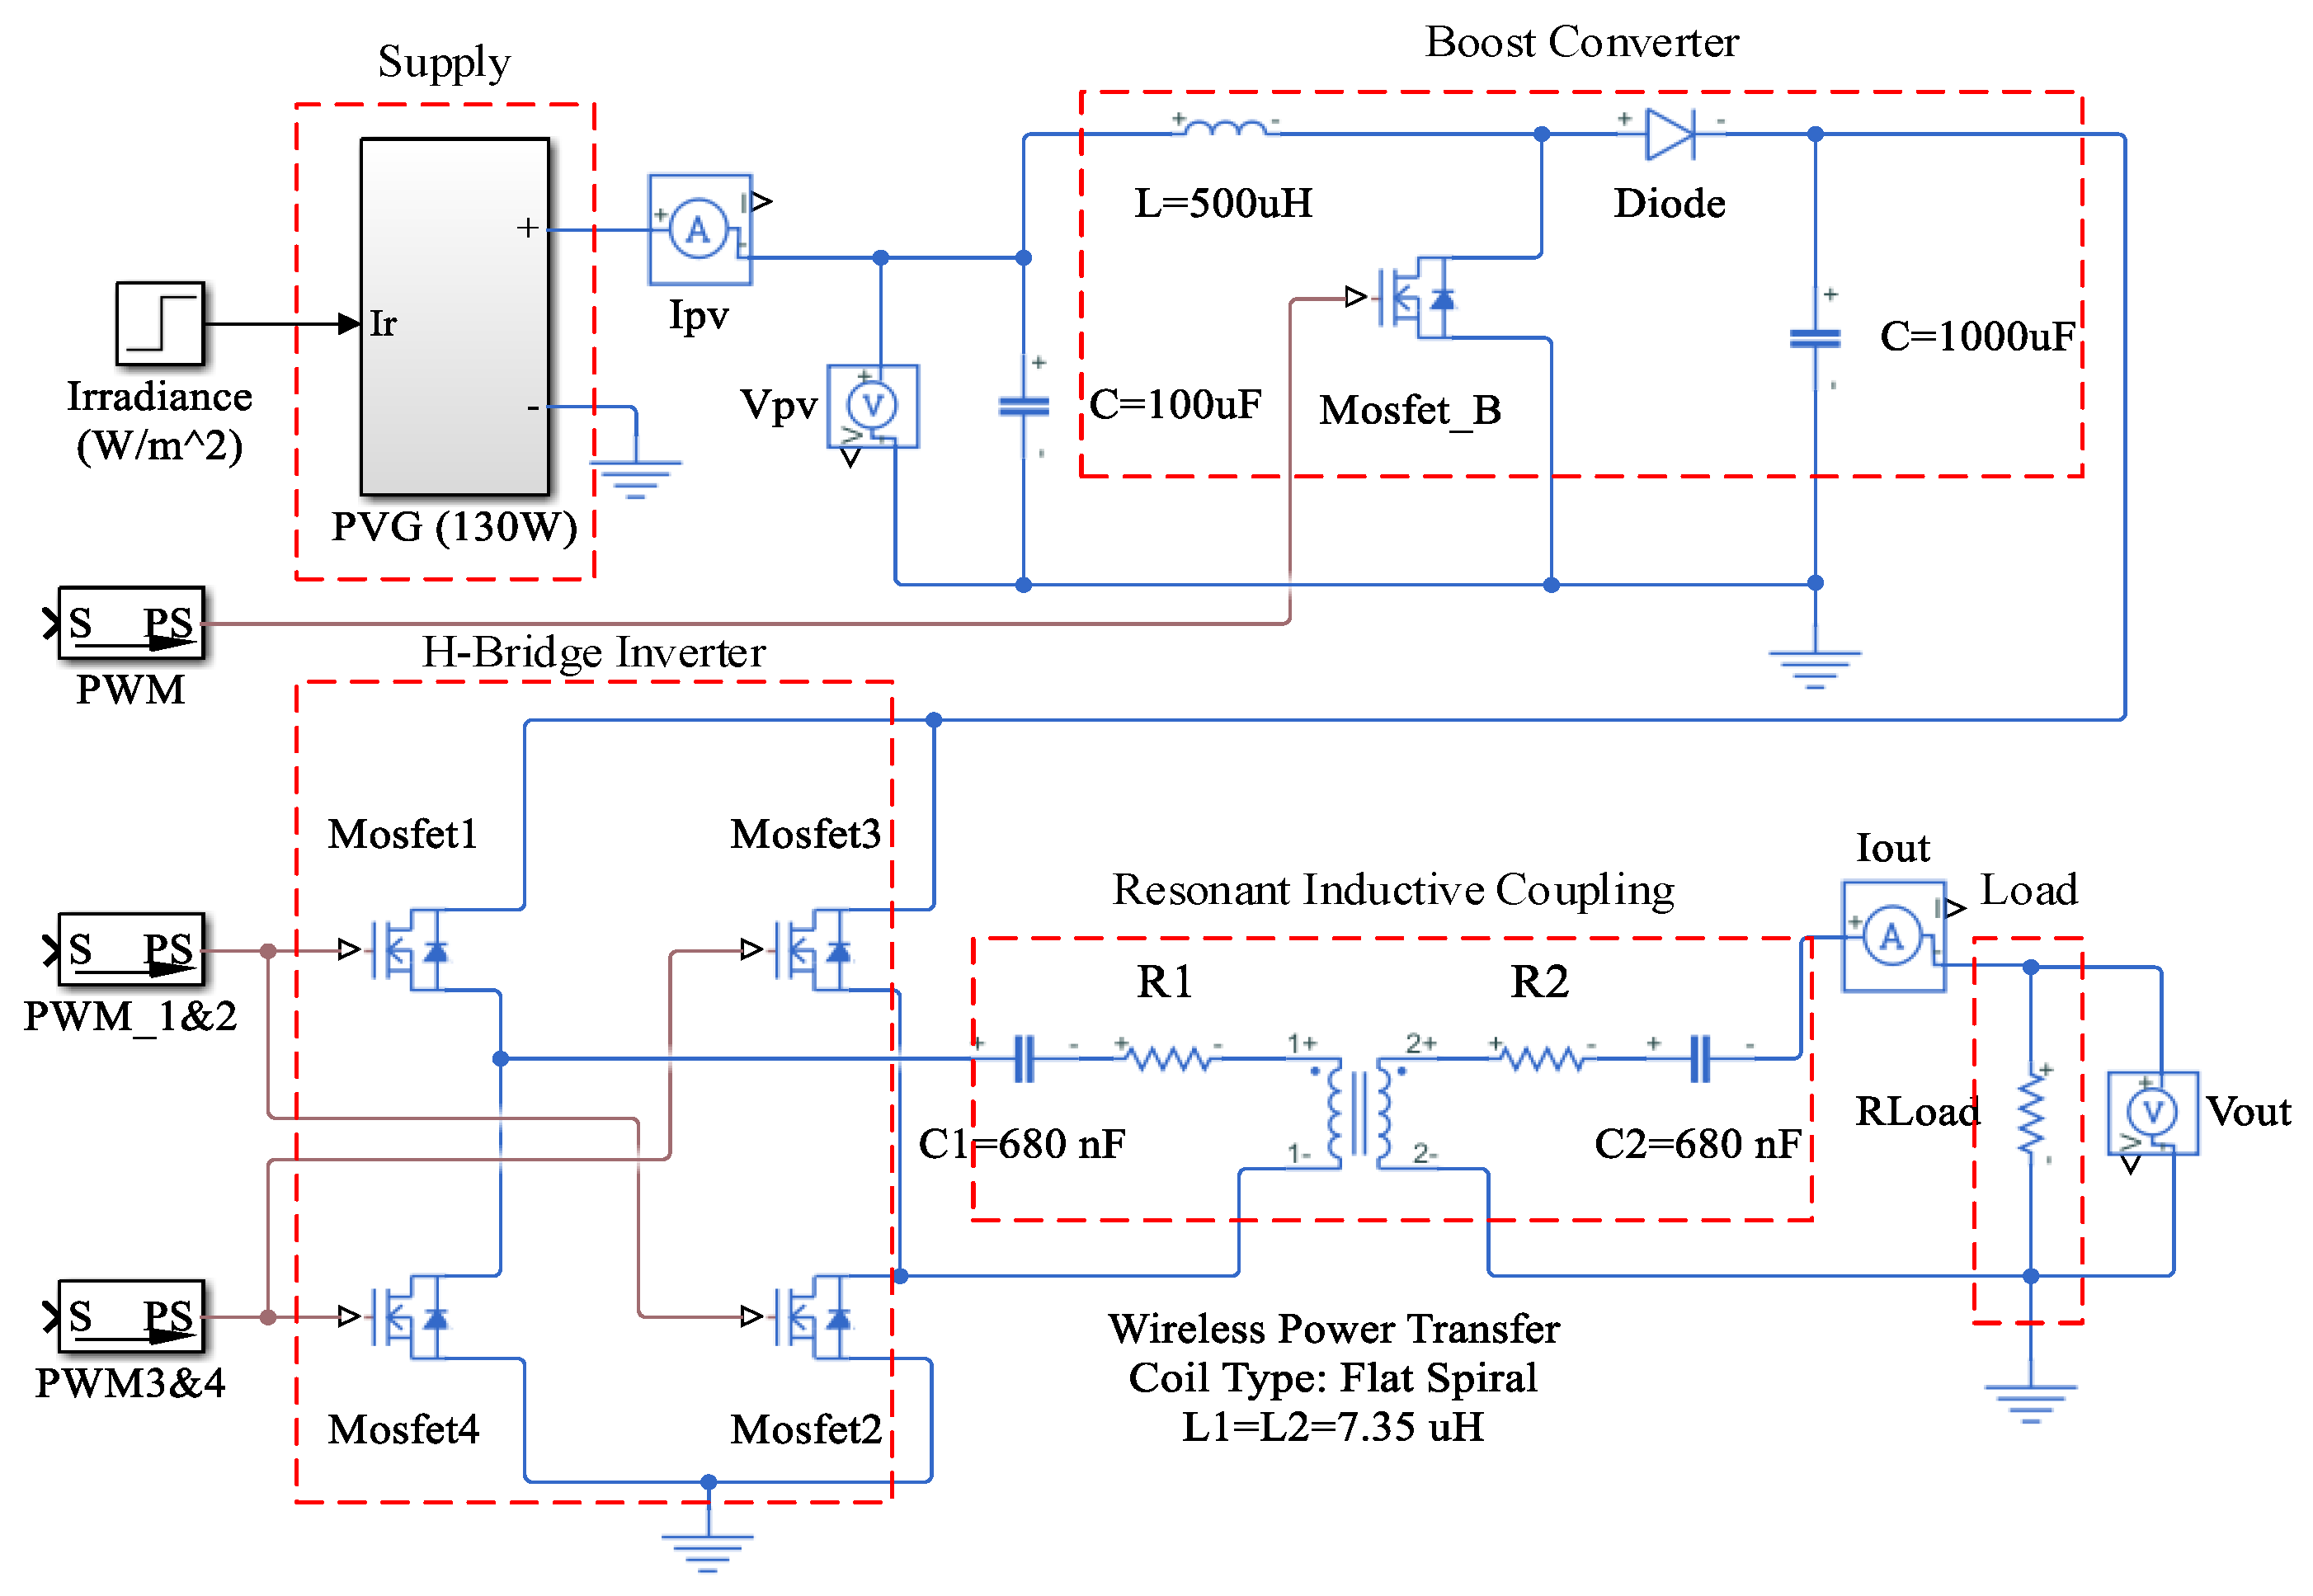
2. Prototype Design of a WPTS

In this study, the PVG is the only source of energy for the entire system. To boost the voltage of the PVG and implement MPPT, a boost converter is used. The output of the boost converter is fed to an inverter for AC power supply to the WPTS. The WPTS is based on Tx and Rx inductive coils which are used to feed the power received from the inverter to the load. All of the elements of the proposed prototype are shown in Figure 2. A detailed mathematical modeling of the proposed system is given in the subsections below.

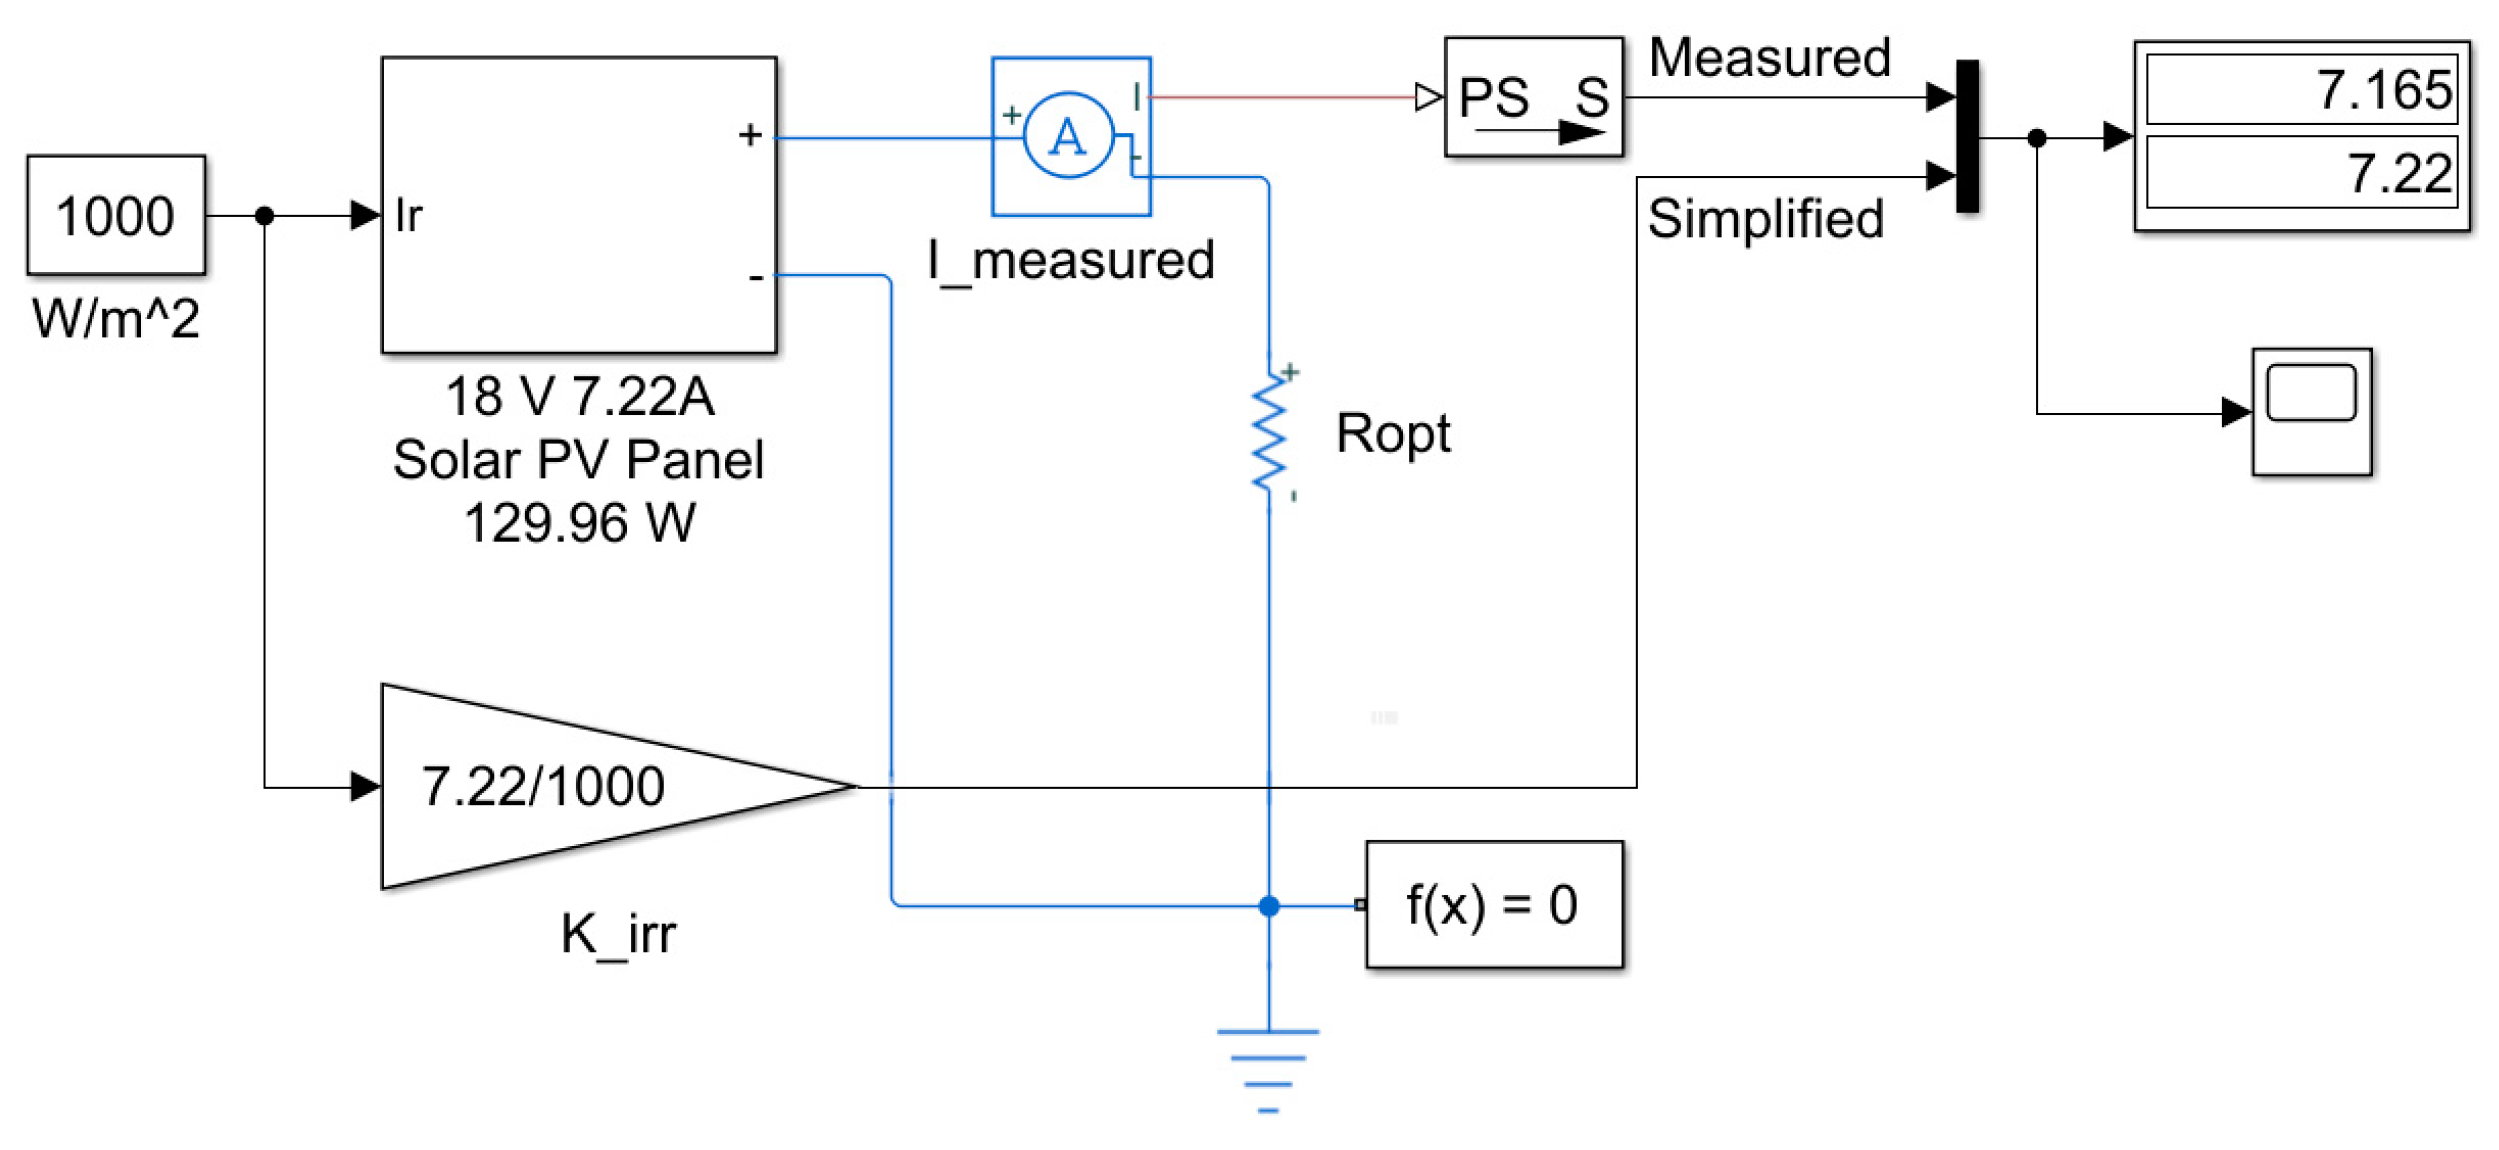
2.1. Modelling of the PVG
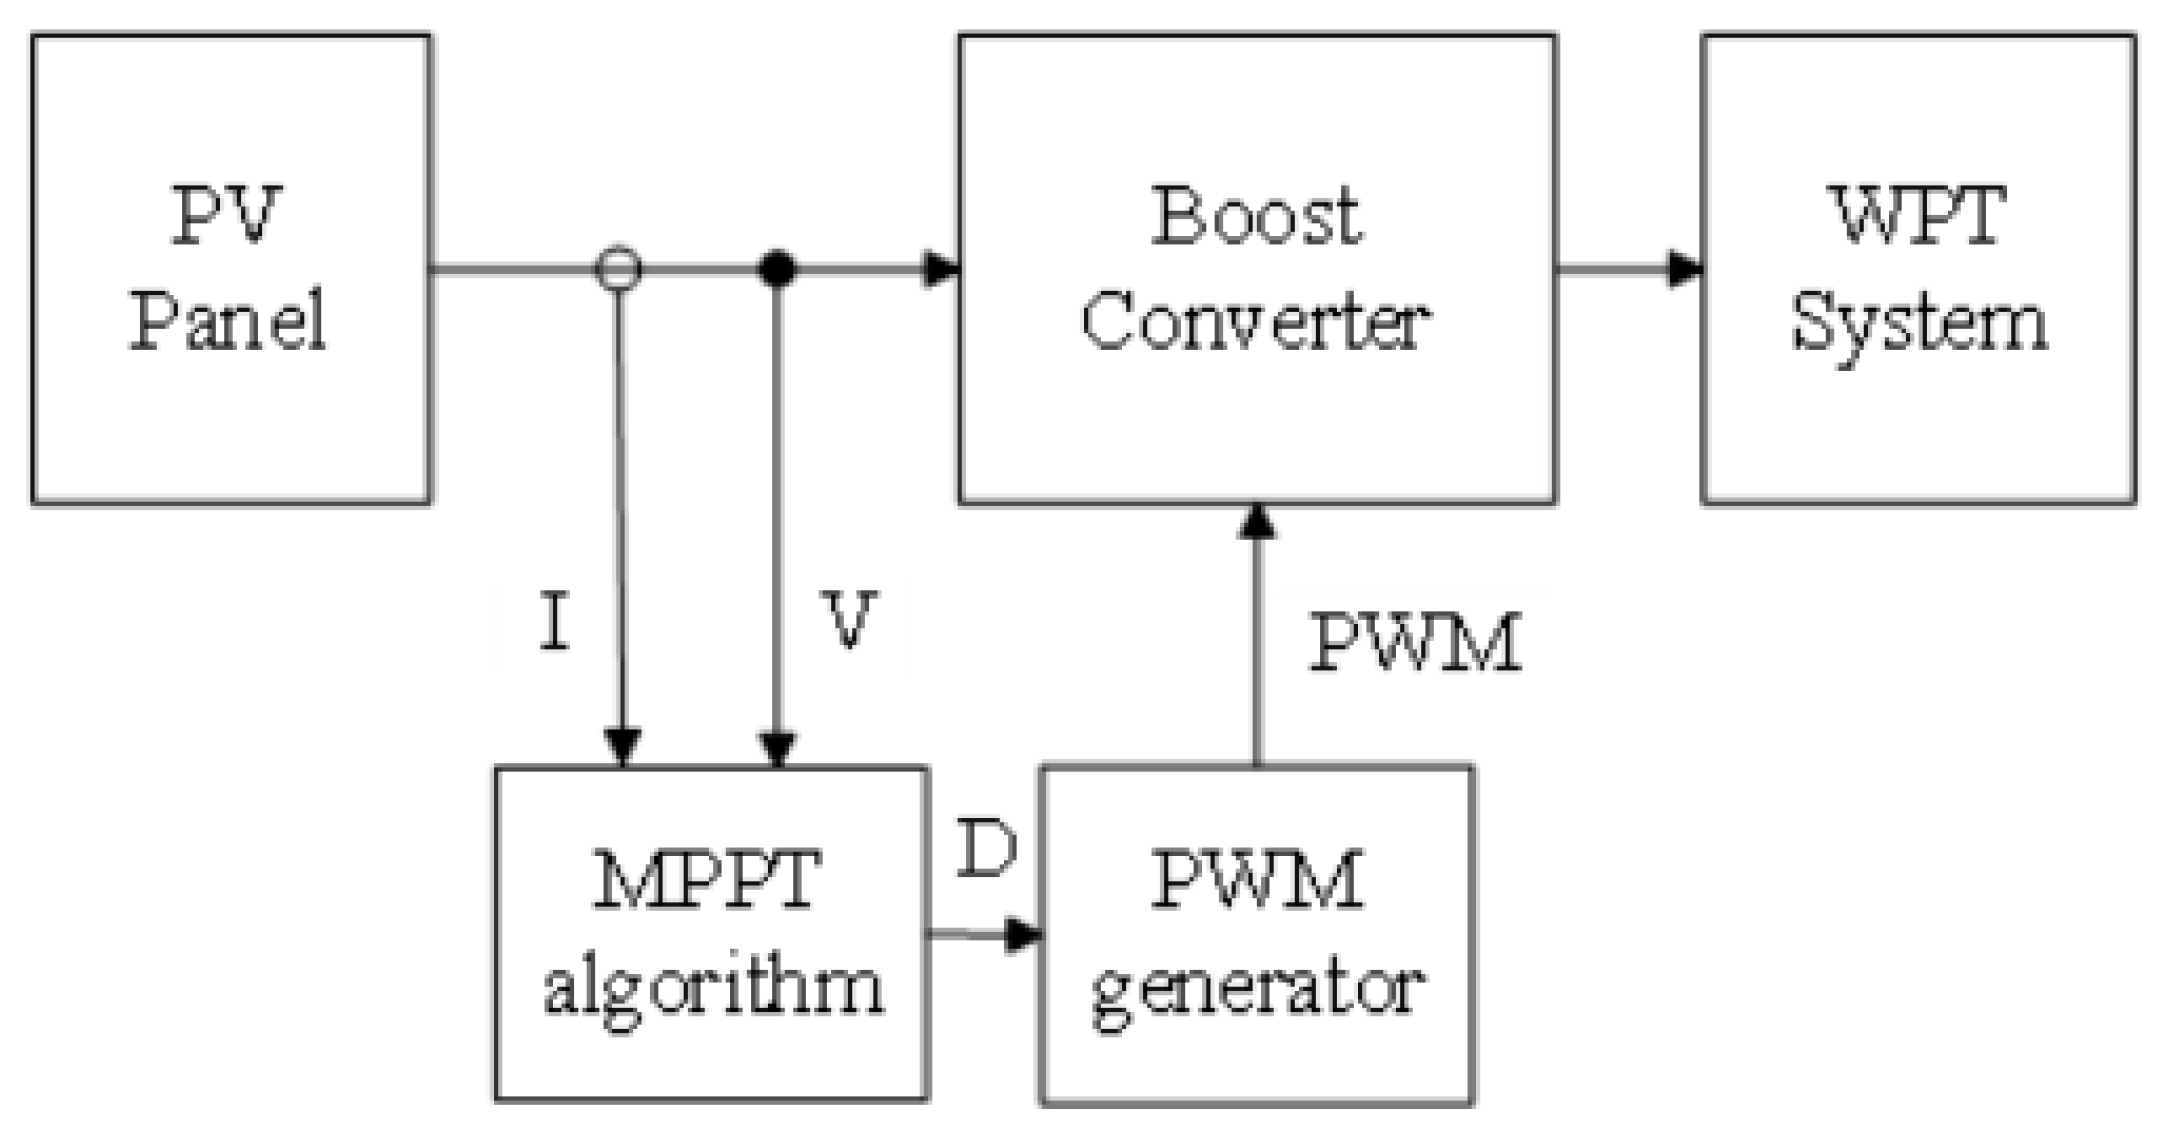
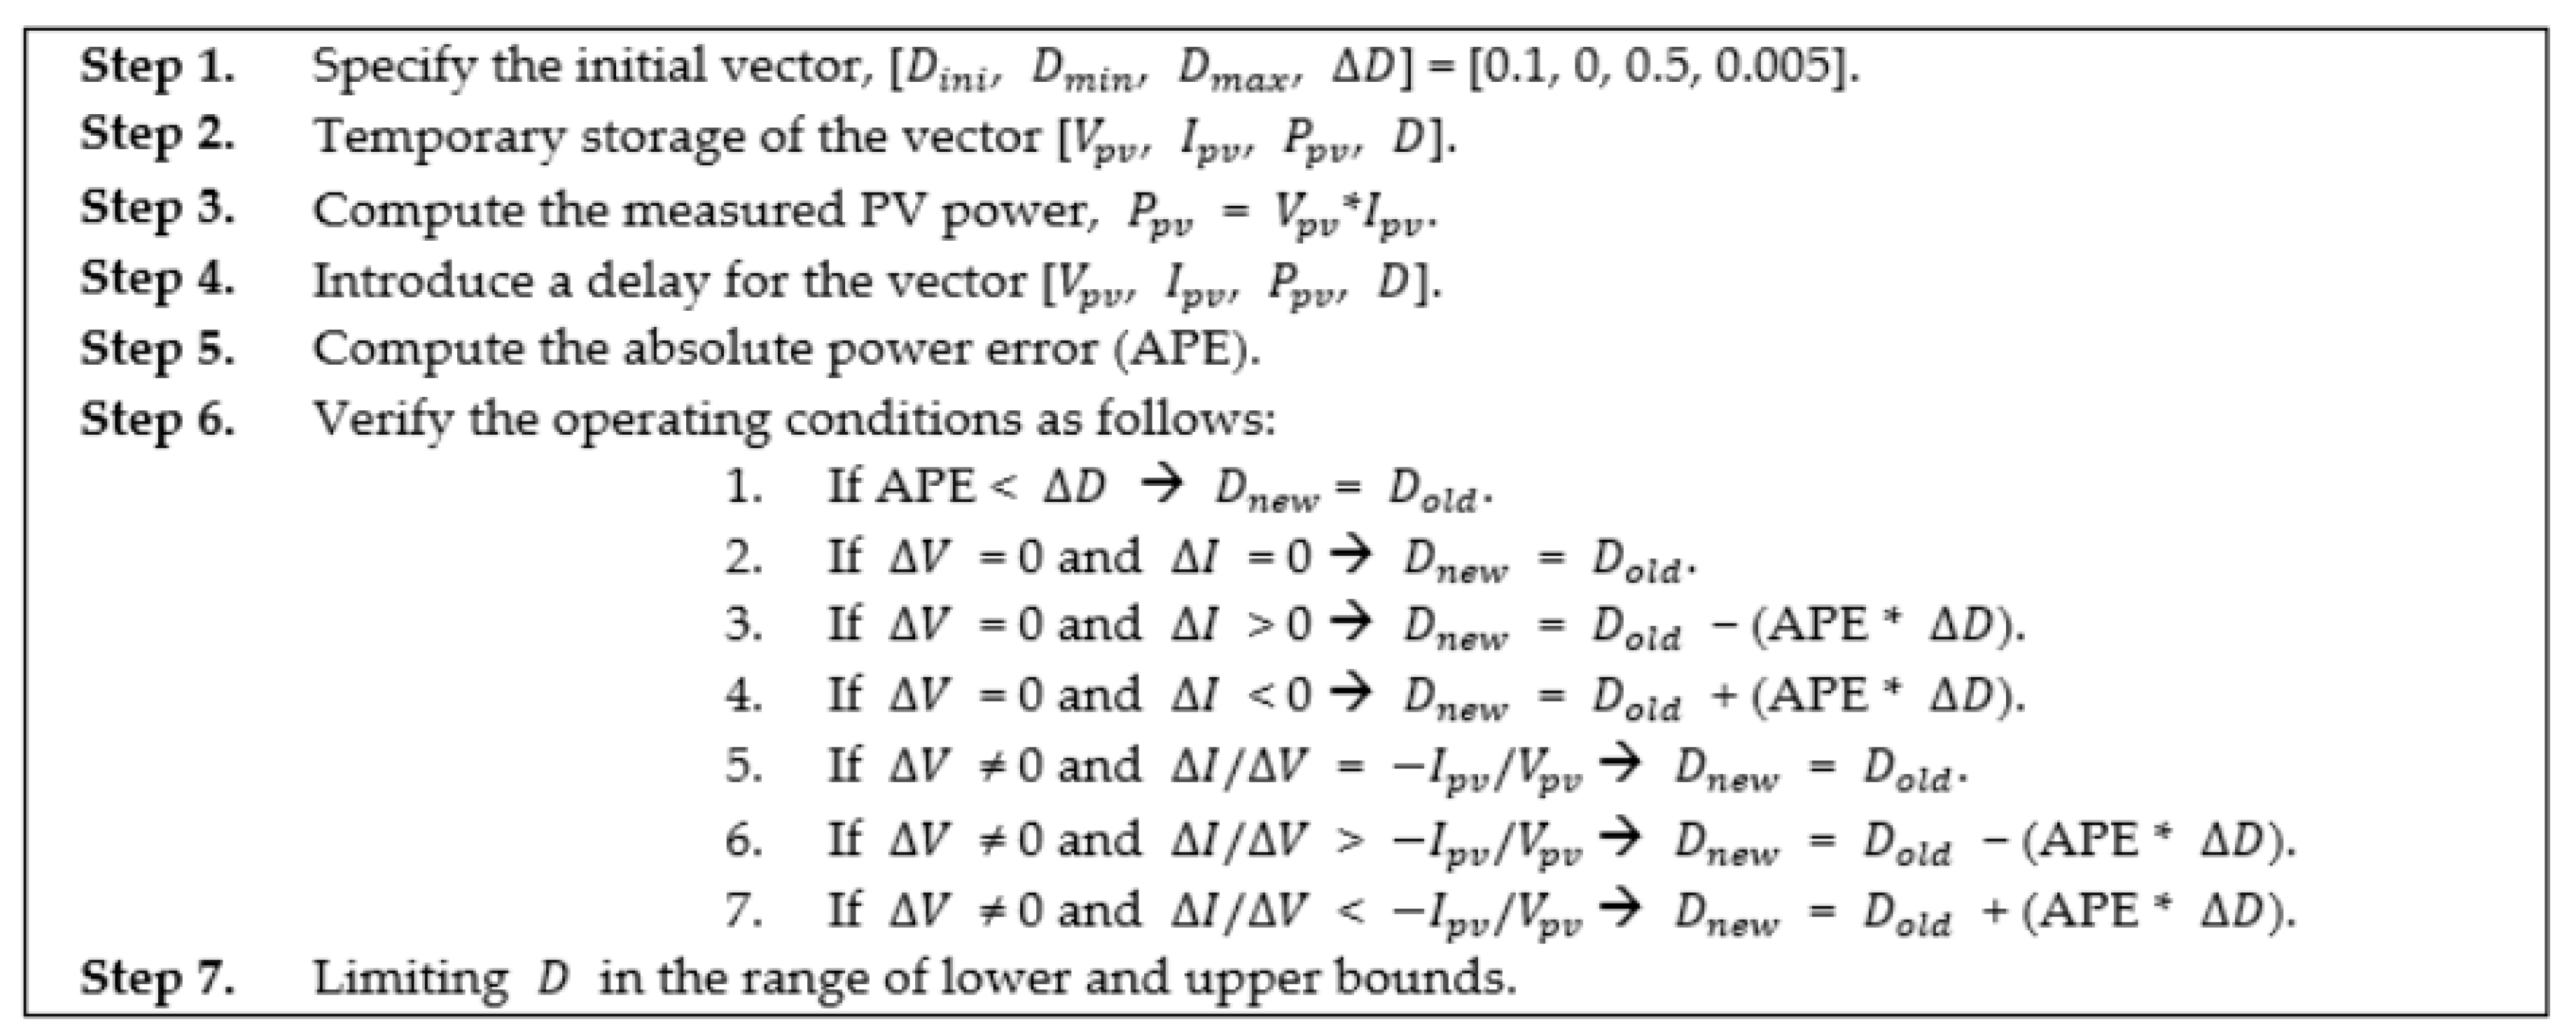
The current of a simplified single diode PV module is represented by [21]:
I pv = I ph I o ( e q V p v K T A N s 1 ) ,
where I ph is the generated current due to bombardment of photons on the surface of solar cells; I o is the dark saturation current, which is typically about 10 12   A / cm 2 ; I pv is the PV output current; N s is the number of modules connected in series; q, K, T, and A are the electron charge, the Boltzmann constant, the PV module temperature, and the diode ideality constant, respectively [22,23]. Because the PVG is operated in MPPT mode, the complexity in Equation (1) can be simplified to a more fast and direct method to obtain the approximate current at MPP. According to the specifications of the PV module listed in Table 1 [24], Equation (1) can be simplified as:
I pv = I mpp   K irr ,
where the term I mpp is the current at maximum power point and K irr is the per unit (pu) irradiance, where the base irradiance is chosen to be 1000 W/m2, which is the ideal irradiance. The term K irr is chosen according to the maximum current of the PV module at the MPP. For example, the PV module chosen for this study has a maximum current of 7.22 A at 1000 W/m2 irradiance. Therefore, at 1000 W/m2 irradiance, the K irr is equal to 1 pu.
To verify the accuracy of the outcome from Equation (2), a comparative analysis of Equations (2) and (1) was conducted. Equation (2) was used to calculate the approximate currents at different irradiance factors ranging from 1 pu to 0.2 pu, and represents a 20% reduction in irradiance at each interval. In the next step, the exact currents were measured via simulation in MATLAB/SIMULINK (developed by mathworks.com). Naturally, the energy losses in the circuit and MPPT module (to be discussed in the next subsection) reduce the measured currents at each interval of irradiance compared to the approximate currents. Both of the measurements are listed in Table 2 and the simulation model is given in Figure 3.

2.2. MPPT Scheme

MPPT is an essential entity for circuits energized by a PVG. Various MPPT techniques are reported in the literature, of which incremental conductance (IC), perturb and observe (P&O), and open circuit voltage (OCV) are popular. Of these techniques, P&O and IC are easy to implement and offer reasonable efficiency; therefore, these methods are most commonly used for MPPT implementation.
The PVG output varies with the weather conditions and generates intermittent power with low output voltage, i.e., 0.5 V to 0.6 V per cell. However, it is pertinent for the WPTS that the sending end DC output voltage should be robust and have a higher amplitude than that of the source. Therefore, in the proposed WPTS, the PVG is connected to a boost converter as shown in Figure 4.
For the proposed WPTS, a modified IC-based MPPT (MIC-MPPT) algorithm is proposed for which the pseudo code is given in Figure 5. The main working principle of the proposed MIC-MPPT module is to increase or decrease the duty cycle according to the pre-defined conditions given in the pseudo code. This duty cycle is used in a pulse width modulation (PWM) generator which latches the switch of the boost converter. Because MPPT is a continuous pursuit of the maximum power point, the term k is used for the current iteration and (k − 1) is used for the previous iteration.
In the first step, the initial value of the duty cycle ( D i n i ) at the start of simulation is chosen, and is 0.1 in this case. The minimum ( D m i n ) and maximum ( D m a x ) range of the duty cycle is chosen to ensure that the converter output voltage does not exceed twice the amplitude of the input voltage. The term Δ D is pre-defined as 0.005, and is the allowable variation in the duty cycle for the next perturbation. Secondly, a vector is defined which includes the parameters of the PVG, such as terminal voltage, current, and power. The third step involves calculation of PVG output power from the output values of the current and voltage sensors. The fourth and fifth steps involve introduction of a delay and calculation of absolute power error (APE), respectively. The APE is the difference between PVG output power during the current iteration P p v ( k ) and the previous iteration P p v ( k 1 ) . In the sixth step, seven conditions are introduced which decide the size of the change required for the duty cycle. These conditions are clarified by the pseudo diagram. In these conditions, Δ V is the difference between V p v ( k ) and V p v ( k 1 ) . Similarly, Δ I is calculated using the difference between I p v ( k ) and I p v ( k 1 ) . Finally, the duty cycle is bounded by the upper and lower limit boundaries. The block diagram in Figure 4 shows the structure of the PVG connected to a boost converter and operated at the MPPT mode. The voltage and current measuring sensors are used to calculate the real power and a microcontroller is used to generate PWM control signals [25].

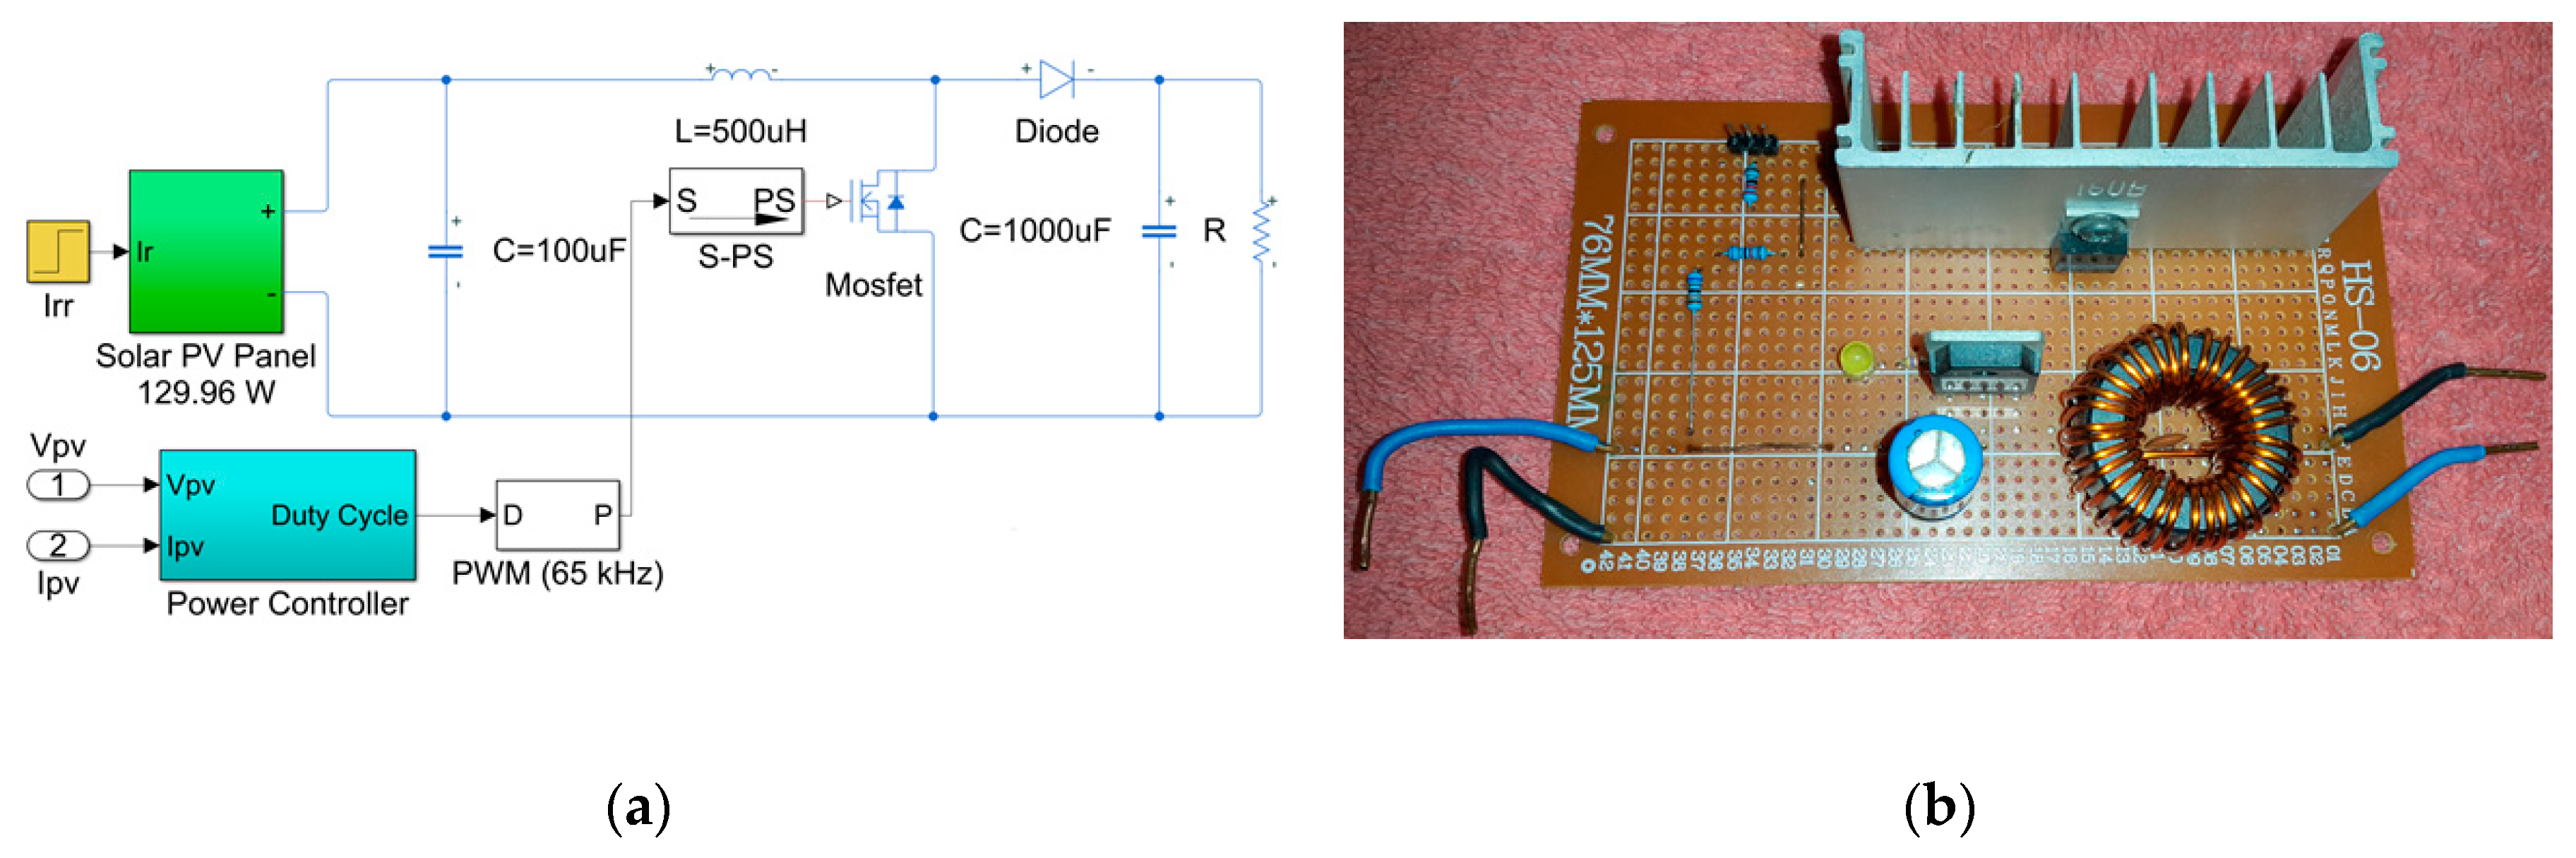
2.3. Design of a Boost Converter

The function of a boost converter is two-fold. Firstly, it is connected to implement the MPPT technique. Secondly, the boost converter steps up the output voltage to a level higher than the input voltage. The duty cycle of MPPT is fed to the PWM generator, which controls the switching cycle of the boost converter switch. More details on a typical boost converter, as shown in Figure 6, are given in [26]{}. In a boost converter, the mathematical form of the inductor charge/discharge is given by Equation (3). The operation of the boost converter is analyzed in two operating conditions: (i) continuous conduction mode (CCM); and (ii) discontinuous conduction mode (DCM). In the CCM, the inductor current charges and discharges without reaching zero (Li(t) > 0). While in DCM, the inductor current reaches zero. In the steady state, during one cycle, the time integral of the inductor voltage must be zero [27].
( V i n ) t o n + ( V i n V o ) t o f f = 0 .
It is important to note that the output filter capacitor should be large enough to ensure a constant output voltage (ΔVo/Vo = 0) [26]. The transfer function of the converter can be expressed as:
V o = V i n 1 D ,
where Vo is the capacitor voltage, V i n is the PVG voltage, and D is the controlled duty cycle of the PWM signal.
To ensure that the converter operates in CCM, the inductance of the coil must be chosen according to the following equation [28]:
L m i n > D ( 1 D ) 2 R m 2 f s w ,
where L m i n is the minimum inductance of the boost coil, R m is the equivalent load resistance of the WPTS, and f s w is the switching frequency. Moreover, the capacitance should be chosen according to Equation (6). From Equation (6), it is evident that ΔVo can be lowered by increasing either the switching frequency or the capacitance of the output capacitor because the inductor is used for energy storage and does not behave as part of the output filter [29].
C m i n = D R m ( Δ V o / V o ) f s w ,
where C m i n is the capacitance of the output filter capacitor and Δ V o is the output voltage ripple. In addition, it is important to use a high-speed switching diode and a metal-oxide semiconductor field-effect transistor (MOSFET) when the switching frequency is above 1 kHz. For stable operation, the parameters of the proposed boost converter are chosen as: inductance = 500 µH, capacitance = 1000 μF, and switching frequency = 65 kHz. The average value of the inductor current passing through the PV panel is always greater than the DC current ( I d c ) on the DC-side of the H-bridge inverter which is related to the optimal duty cycle (Dopt). Thus, the reference DC current ( I d c R e f ) and reference DC voltage ( V d c R e f ) after implementing MPPT are expressed as:
I d c R e f ( D opt ) = I pv   ( 1 D opt ) ,
V d c R e f ( D opt ) = V pv ( 1 D opt ) .

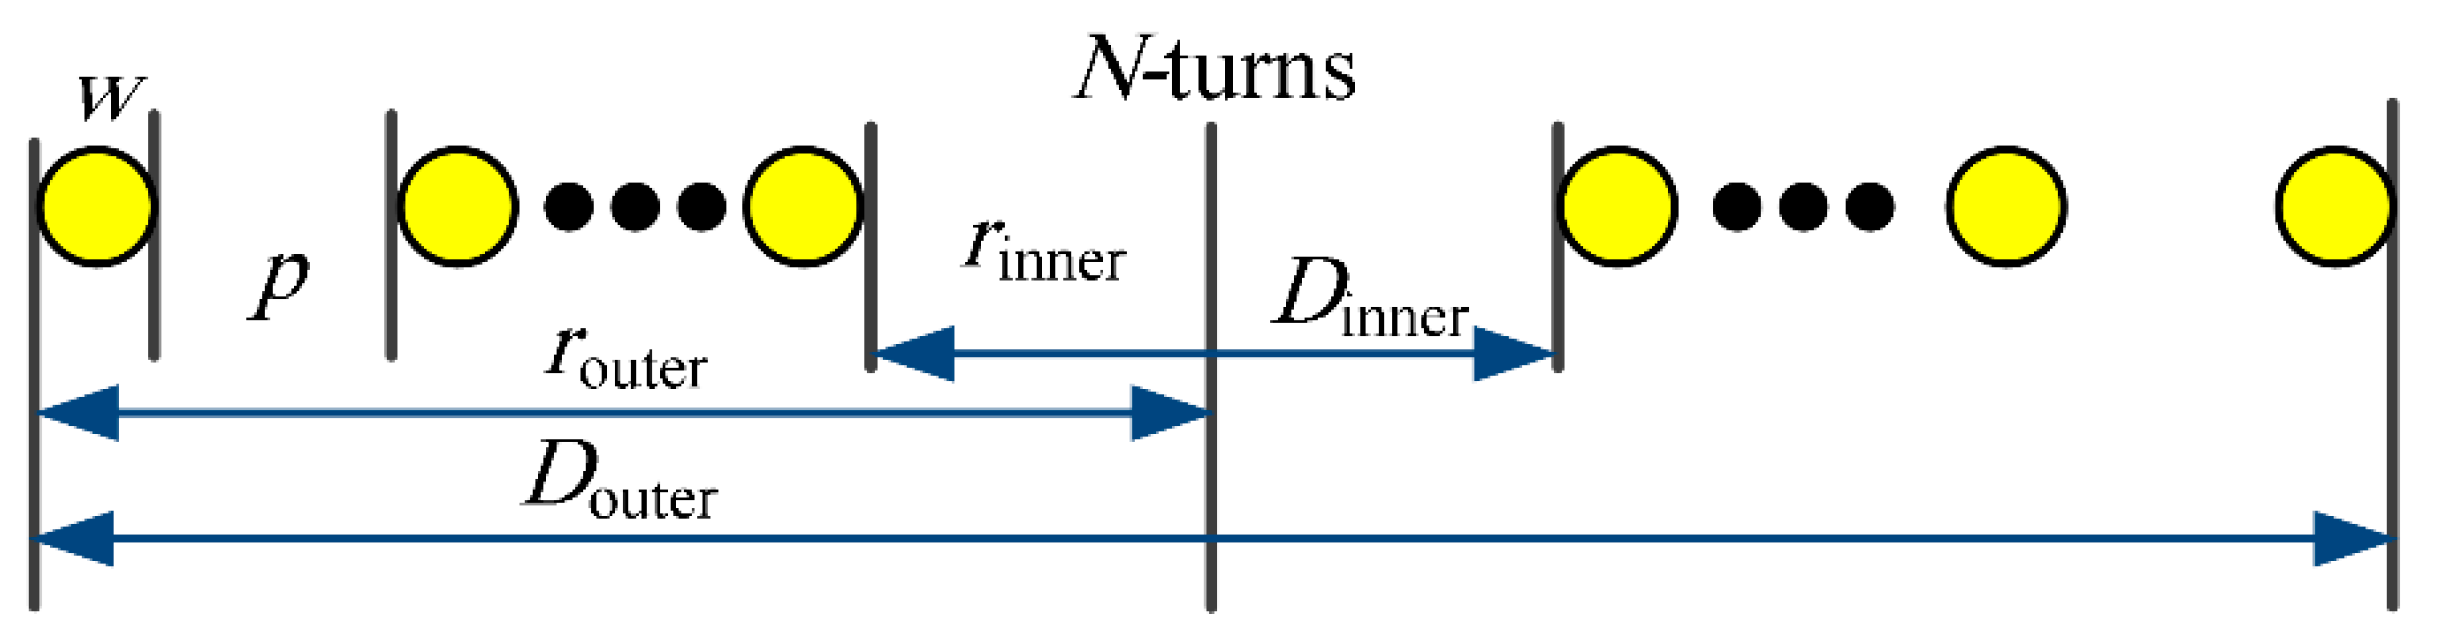
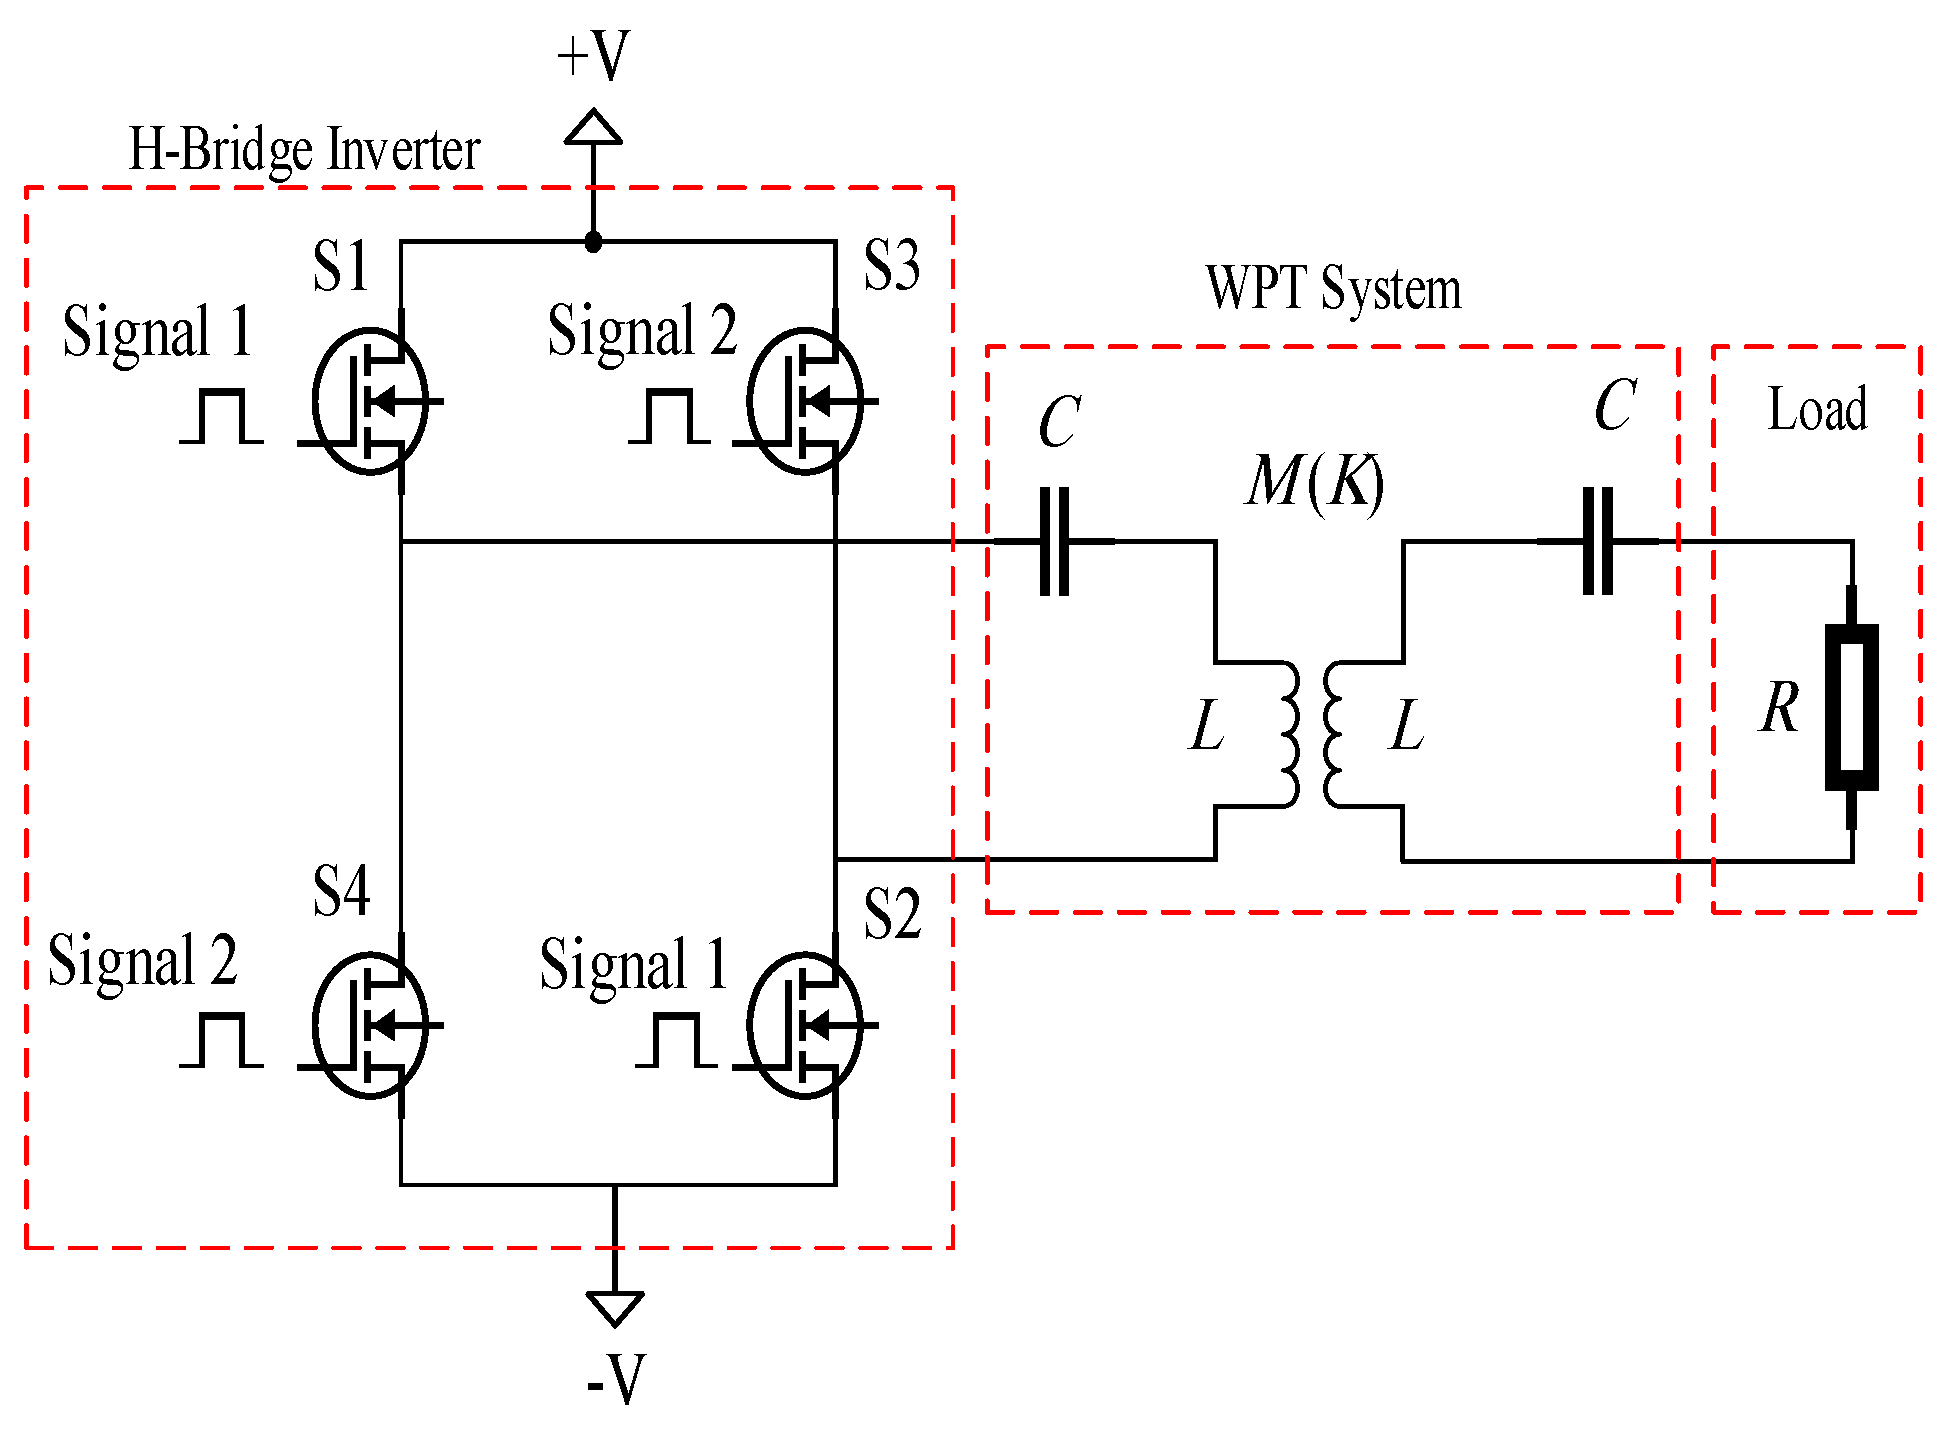
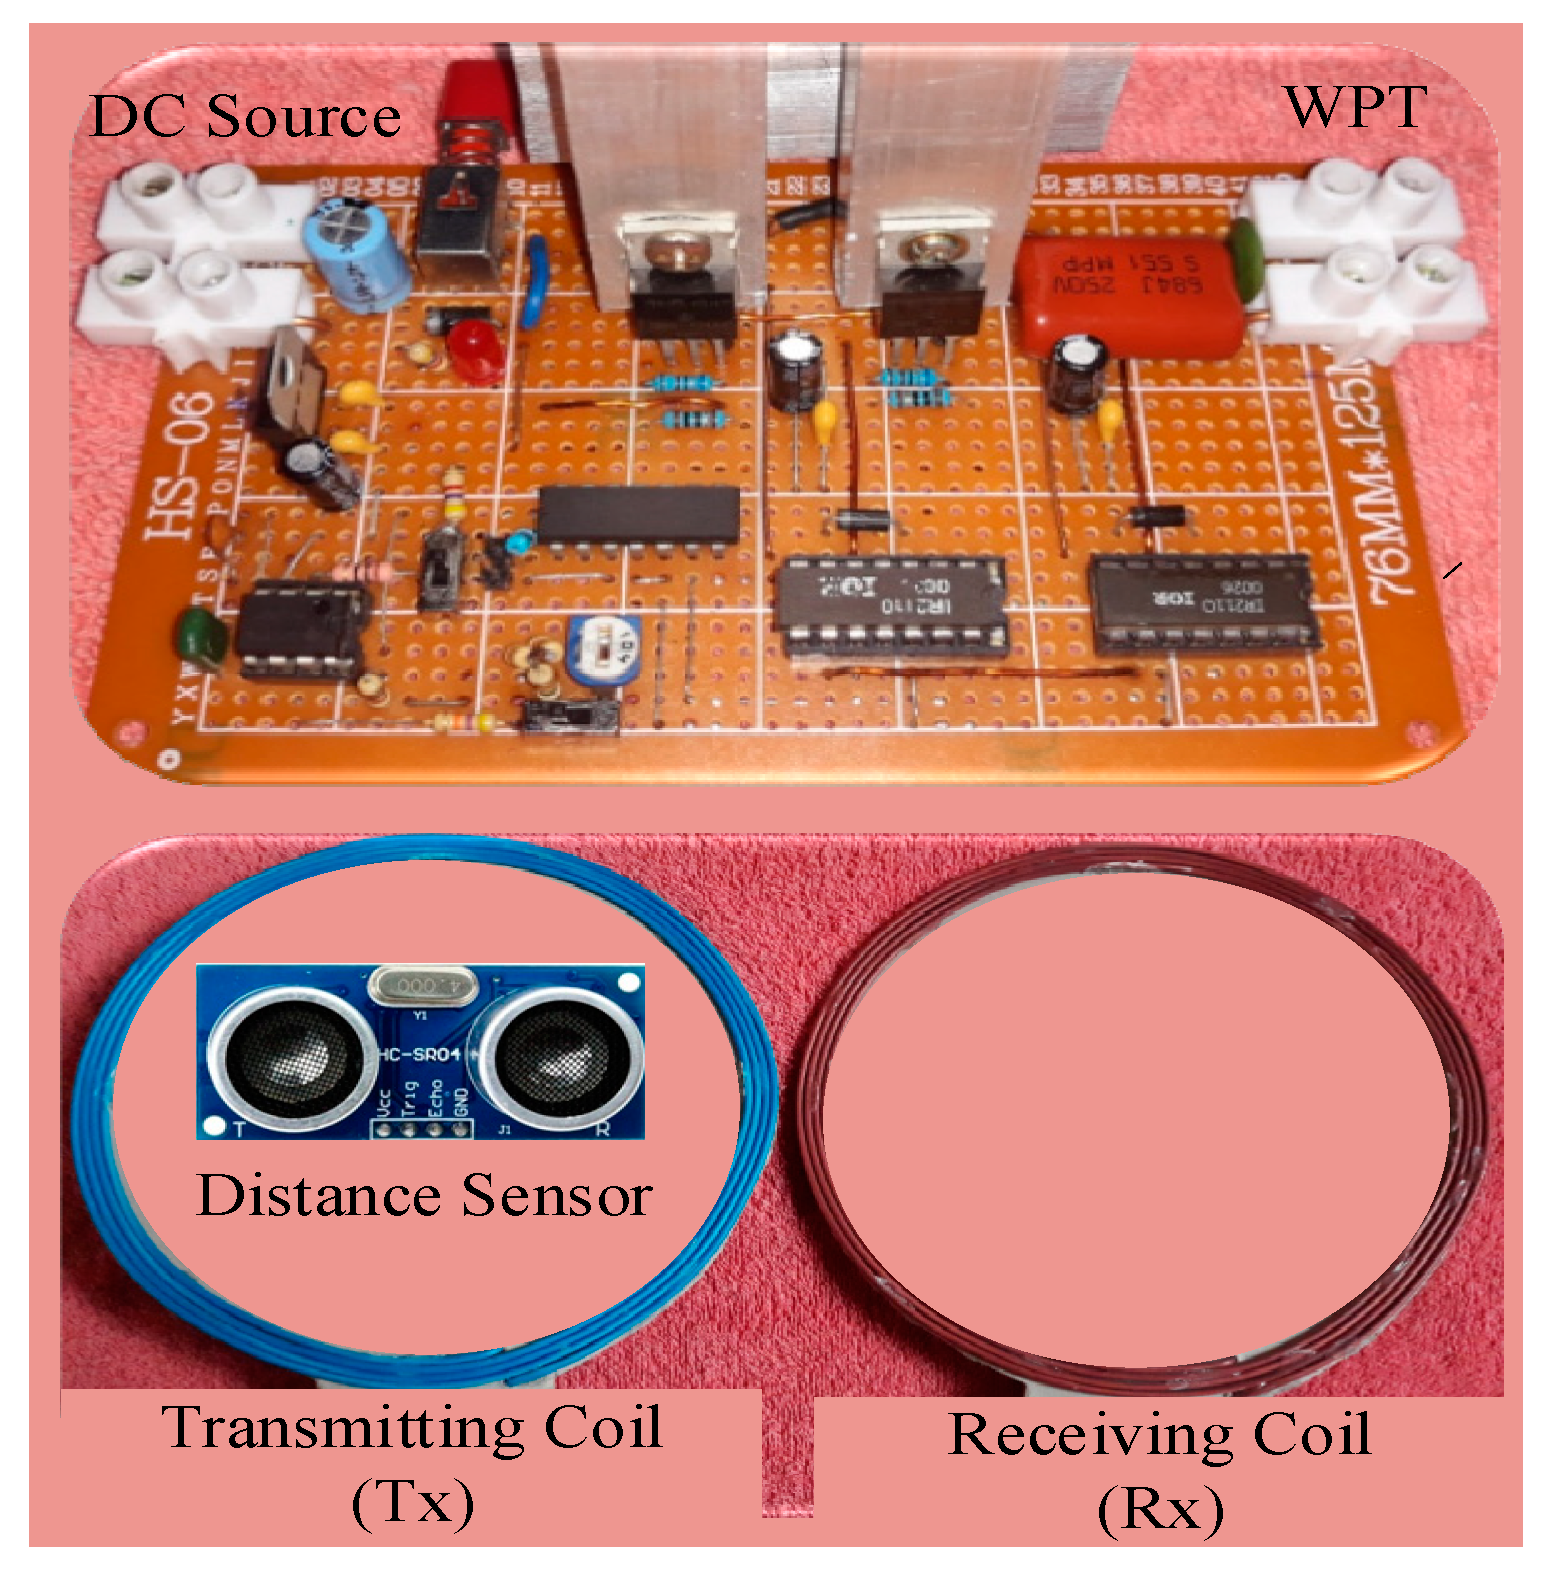
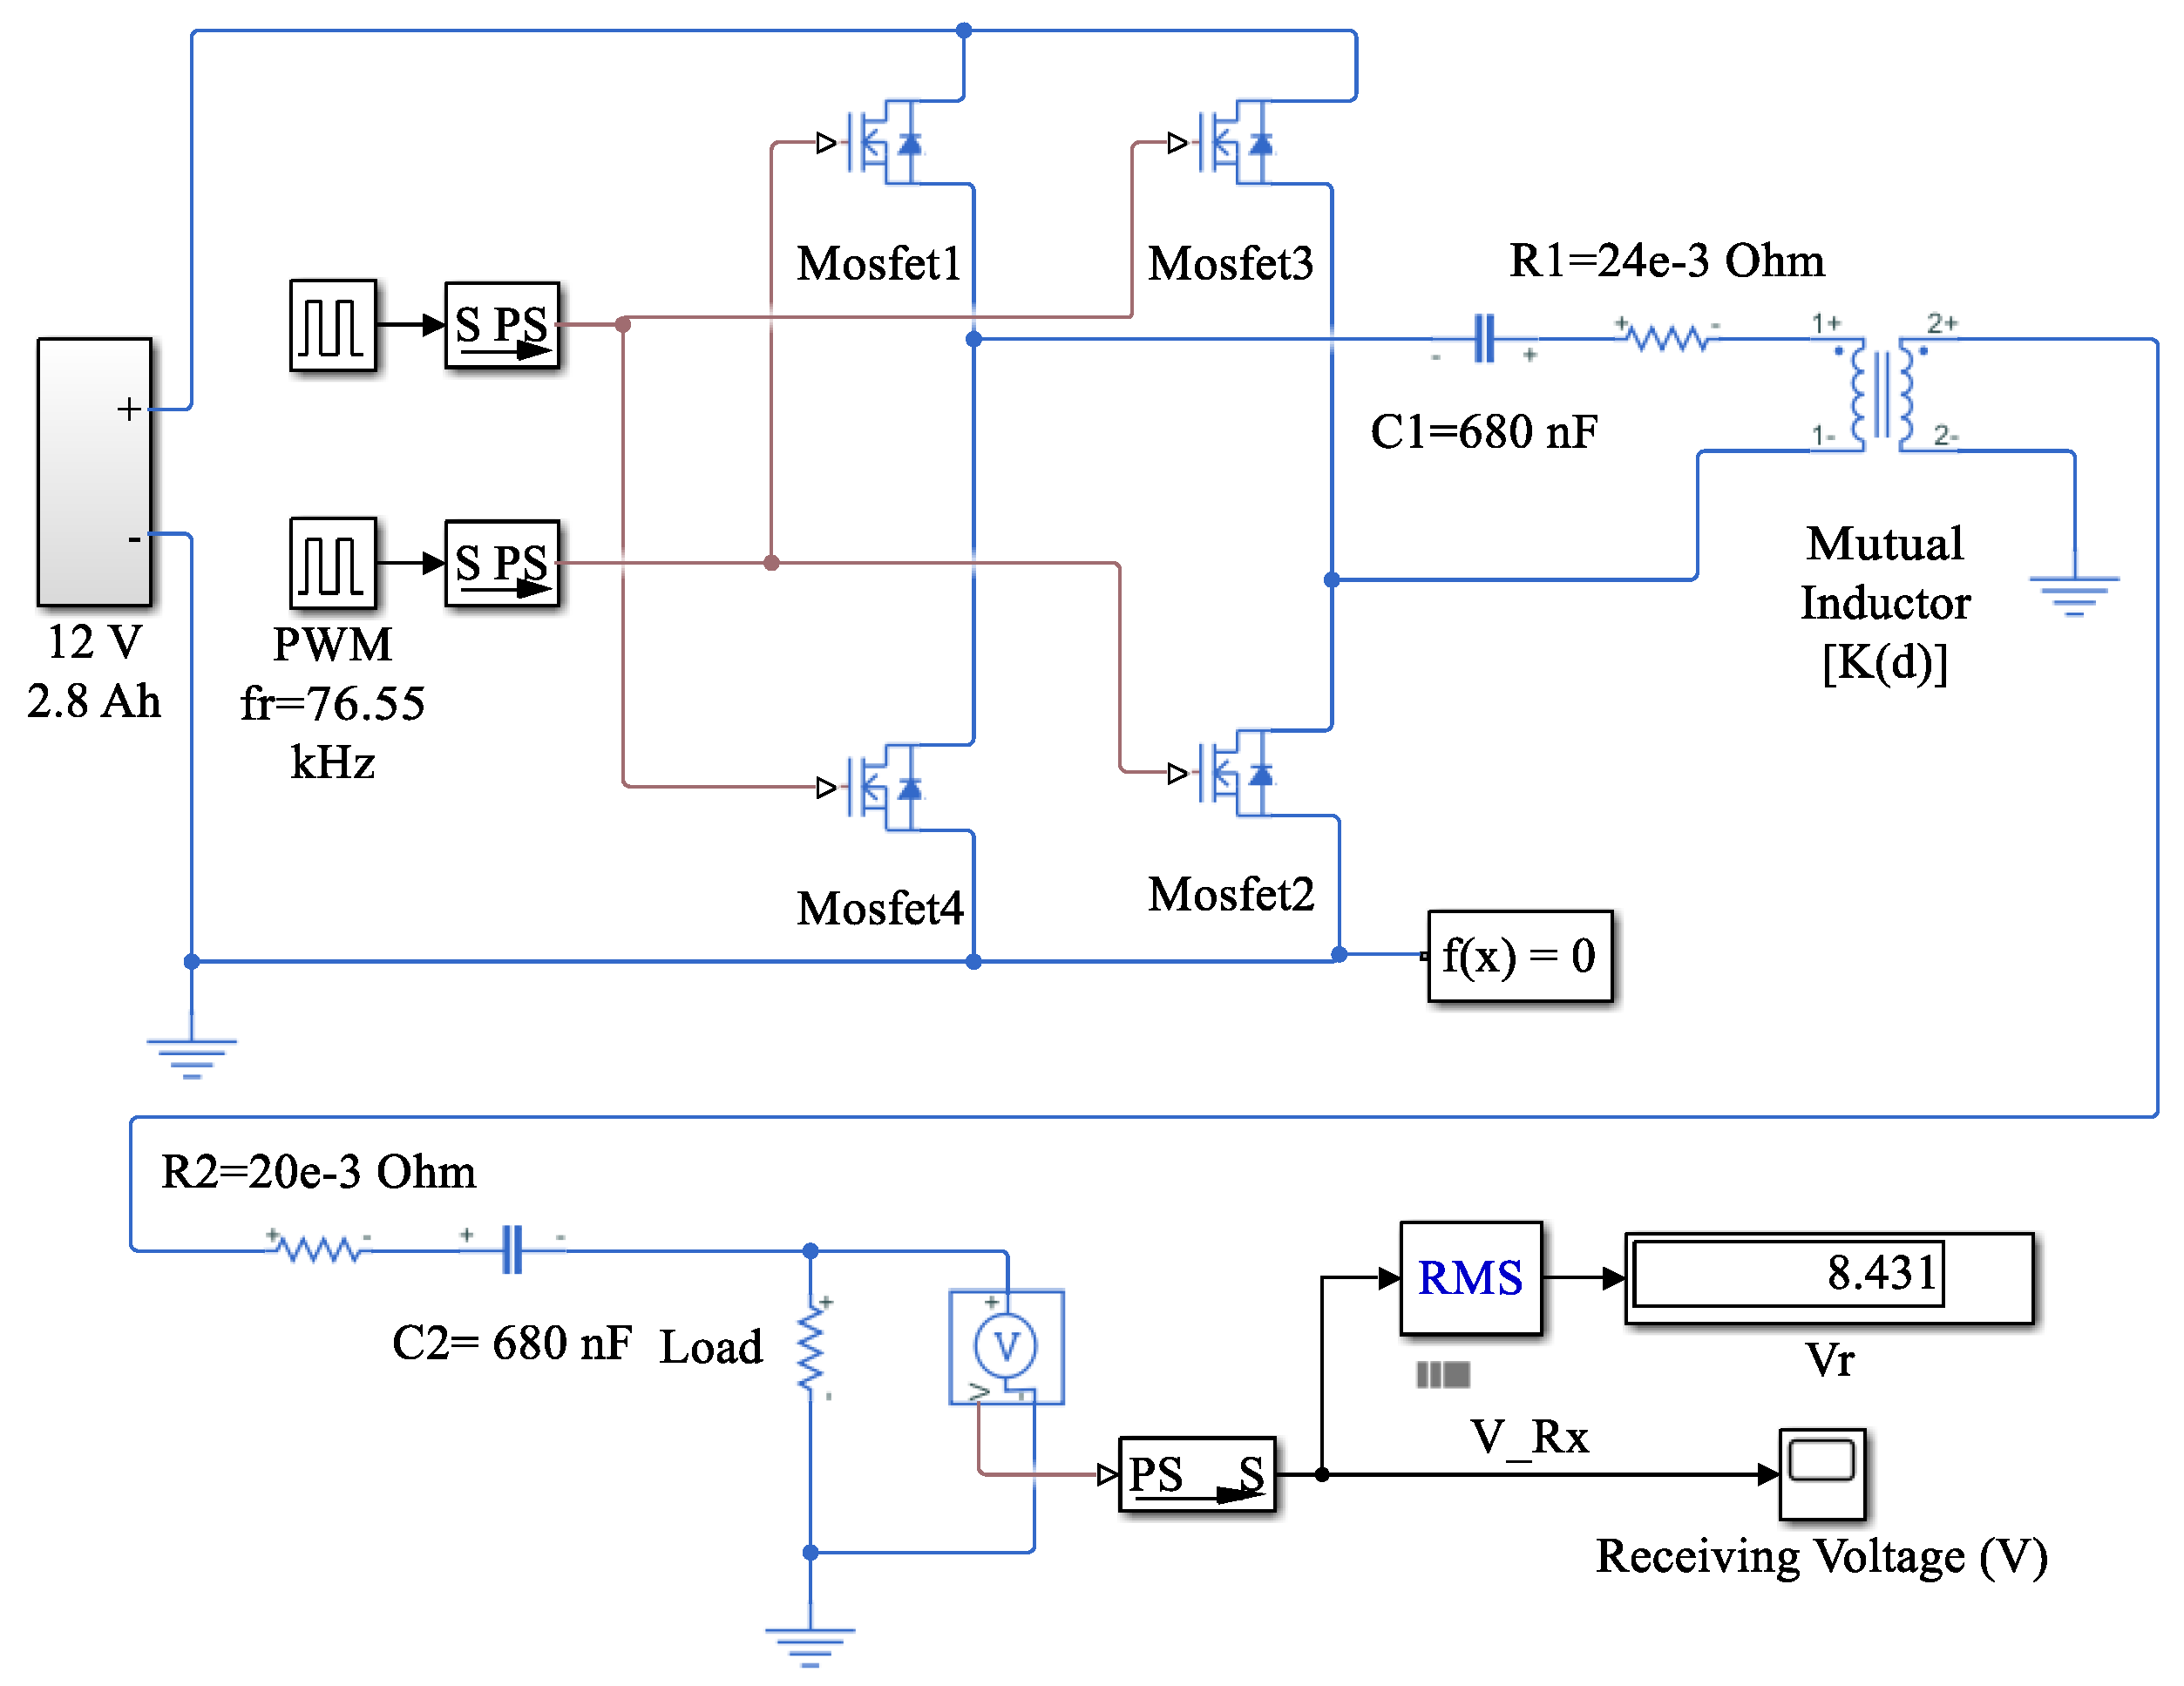
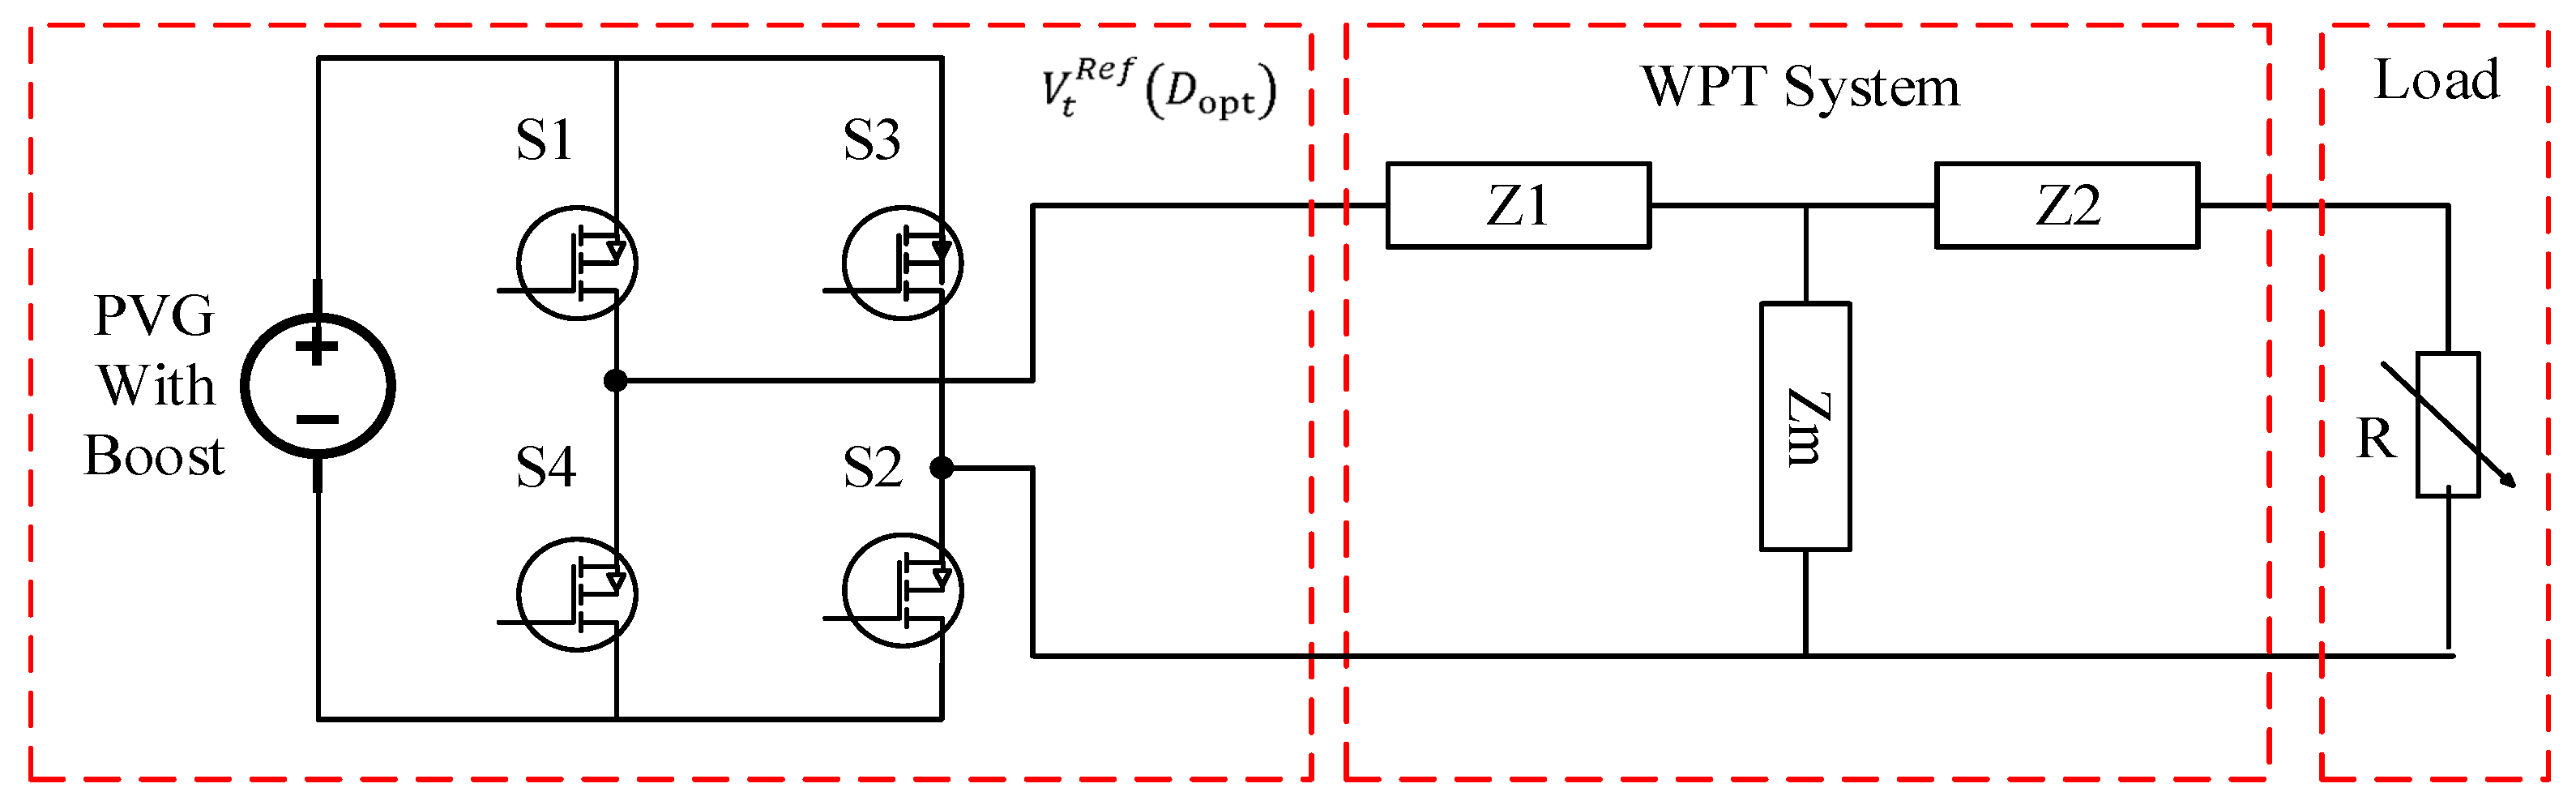
2.4. Designing WPTS Circuits

In this section, modeling of the proposed WPTS is presented. A simple concept of magnetic coupling can be understood by a wire placed in proximity to a changing magnetic field. An electromotive force (EMF) is induced in that wire. To extend this concept to a double circuit system: if a varying magnetic flux produced by one circuit is cut by another circuit, then due to magnetic coupling, the energy can be transferred from one circuit to another circuit. The magnetic field common to both circuits makes the transfer of energy possible [30].
Basically, two types of coils are used for a WPTS: (i) a single layer coil, and (ii) a flat spiral coil. In the proposed WPTS, a circular flat spiral coil, as shown in Figure 7, is used as transmitter/receiver coils [31].
The coil’s self-inductance can be designed using the following modified Wheeler’s expression [9]:
L = N 2 ( D o u t e r N ( w + p ) ) 2 16 D o u t e r + 28 N ( w + p )   39.37 10 6 ,
where L is the self-inductance in henry; N is the number of turns of the circular flat spiral coil; r i n n e r and r o u t e r are the inner and outer radius of the coil, respectively; w is the diameter of the wire used for coil winding; and p is the channel width between two adjacent wires. The magnetic flux linkage between coils due to the current produced in one coil is termed the coefficient of coupling between two coils and is denoted by k. The coupling factor k is related to the mutual inductance according to the formula:
k = M L 1 L 2 ,
where M is the mutual inductance between the sending and receiving coils; and L 1 is the transmitter coil and L 2 is the receiver coil. The coefficient of coupling (k) is obtained through simulation and experiment-based data which will be explained in the next section.
The schematic diagram of the proposed WPTS is shown in Figure 8. It can be observed that an H-bridge inverter circuit is connected to an inductive resonant circuit for supplying resistive loads. For a WPTS, the coil inductance is calculated using Equation (9) and the resonance equation ( f r = 1 / 2 π L C ) is used to calculate the capacitance. To transfer maximum power from the PVG to load, the transmitting and receiving circuits should be tuned to the same adaptive frequency. The main components of the H-Bridge and WPTS are given in Table 3.

3. Coefficient of Coupling Estimator and Adaptive Virtual Impedance Controller (AVIC)

To derive the proposed controller, the calculation of the coefficient of coupling estimator is first presented, which can greatly improve the performance of the conventional WPTS. In the next step, a new method to calculate the adaptive references for the adaptive virtual impedance controller (AVIC) is derived that will further enhance the power transfer efficiency of the proposed WPTS. A brief explanation of the proposed estimators, adaptive references, and controller loops is presented in the subsections below.

3.1. Coefficient of Coupling Estimator

For hardware implementation of a WPTS in sensitive applications such as biomedical devices, it is necessary to keep the size of the circuit small. The main hurdle in reducing the size of the circuit is the coil. Therefore, an optimized design of the coil is pertinent to reduce the size of the overall circuit. To optimize the size of the coil, a detailed analysis of the impact of design parameters on the coil size is necessary.
The hardware test setup used for calculating the coupling coefficient is given in Figure 9. The parameters of the proposed WPTS are listed in Table 3, where L and RL are the inductance and resistance, respectively, of both Tx and Rx coils; C and RC is the capacitance and resistance of the resonant capacitor, respectively; and Ron is the ON resistance of each MOSFET of H-Bridge.
For the case study, a distance sensor is used to measure the distance and a 12 V battery of 2.8 Ah capacity is used as a DC source. In [8], the authors claimed that the efficiency of a WPTS in IWM applications reduces to less than 10% for a distance of 15–20 cm between the coils. Therefore, for the current study, the range of the distance considered for the proposed application was 1–12 cm, because beyond 12 cm the power transfer capability is greatly reduced and huge oscillations are observed in the DC current of the PVG. Moreover, results of the experimental tests conducted for this study showed that the minimum value (e.g., 50 kHz) ensures maximum power transfer efficiency for narrow distances (e.g., less than 2 cm). Therefore, the range of switching frequency (i.e., resonant frequency) considered for this study is between 50 kHz and 65 kHz as a function of the distance between Tx and Rx coils [22].
In the first step, the exact practical circuit was designed in the MATLAB/SIMULINK environment to obtain a model as illustrated in Figure 10. The test scenario was based on changing the coefficient of coupling for each distance step in the range between 1 cm and 12 cm to obtain the same experimental results. The hardware and simulation results are given in Table 4. The maximum percentage error of the output voltage is about 3.25% at the distance of 12 cm. For a more valid comparison, the receiving end output voltage waveforms obtained from the hardware and simulation are demonstrated in Figure 11. The close agreement between experimental and simulation results shows the accuracy of the open loop SIMULINK model for obtaining k(d).
Using the results in Table 4, a relationship between the coupling coefficient and the distance can be formulated. The drop in the coupling coefficient for a measured distance between Tx and Rx is shown in Figure 12. These results are based on decreasing the percentage error between the practical and simulation receiving voltages. To conclude: when a distance between Tx and Rx is measured via an ultrasonic distance sensor, a constrained optimal coefficient of coupling for the virtual impedance controller can be estimated from Equation (11).
k ( d ) = i = 0 5 k i   d i .
The coefficient’s weights in Equation (11) are listed in Table 5.

3.2. Derivation of Adaptive Reference Values

To derive the proposed AVIC, derivation of adaptive references is required. The circuit diagram of an H-bridge inverter supplying a WPTS is given in Figure 13. In this figure, Z1 is the impedance of the transmitting side circuit and Z2 is the impedance of the receiving side circuit. Z m is the mutual impedance between the transmitting and the receiving side circuits. From Equation (10), the mutual inductance is proportional to k ( d ) , which is a function of the distance according to Equation (11).
The value of the mutual impedance is proportional to the coupling coefficient which is the function of the air gap distance between Tx and Rx coils ( Z m k ( d ) ) . The reference transmitting voltage of the WPTS according to the maximum allowable DC voltage can be represented in the time-domain as:
v t R e f ( D opt , f r ,   t ) = 4   m π V d c R e f ( D opt ) sin ( 2   π   f r t ) ,
where f r is the resonant frequency (i.e., the switching frequency of the H-bridge inverter); m is the modulation index; and D opt is the optimal duty cycle. For steady-state analysis, the RMS reference transmitting voltage is given by:
V t R e f ( D opt ) = 4   m π   2 V d c R e f ( D opt ) .
In relation to k(d), the terms Z1 and Z2 can be written as:
Z 1 = R 1 + j 2 π   f r ( d )   L   { 1 k ( d ) } j 1 2 π   f r ( d ) C ,
Z 2 = R 2 + j 2 π   f r ( d )   L   { 1 k ( d ) } j 1 2 π   f r ( d )   C ,
where Z m = j 2 π   f r ( d )   L   k ( d ) ; R 1 = R o n + R L + R C ; and R 2 = R L + R C .
Using the theorem of maximum power transfer, the interfaced WPTS impedance and the optimal receiving end voltage are obtained using the simplified circuit shown in Figure 13.
The real and imaginary parts of the interfaced WPTS impedance can be separated by calculating the total WPTS impedance of the equivalent system as shown in Figure 14.
The total impedance of WPT at natural response can be written as:
Z wpt = Z 2 + ( Z m / / Z 1 ) ,
Re ( Z wpt ) = R 1   X C   X m X t + R 1   X m ( X L X C + X m ) X t R 1   X C   X m X t + R 2 ,
Im ( Z wpt ) = R 1   X m X t + X L   X m ( X L X C + X m ) X t X C   X m ( X L X C + X m ) X t + X L X C ,
where the magnitudes of XL, Xm, XC, and Xt are expressed as: X L = 2 π   f r ( d )   L   { 1 k ( d ) } ; X m = 2 π   f r ( d )   L   k ( d ) ; X C = 1 2 π   f r ( d )   C and X t = R 1 2 + ( X L X C + X m ) 2 . The reference RMS of the open-circuit voltage at the receiving side ( V r R e f ) is calculated by applying Kirchhoff’s voltage law (KVL) in the circuit in Figure 13. It can be observed that V r R e f in Equation (19) is a function of the optimal duty cycle that is obtained from the MPPT algorithm and the distance between Tx and Rx (measured by the distance sensor).
V r R e f ( D opt , d ) = V t R e f ( D opt ) X m { f r ( d ) } X t { f r ( d ) } .
Inserting Xm and Xt in Equation (19) yields:
V r R e f = V t R e f 2   π   f r o p t ( d ) }   L   k ( d ) R 1 2 + { 2   π   f r o p t ( d )   L   ( 1 k ( d ) ) 1 2   π   f r o p t ( d ) }   C   + 2   π   f r o p t ( d ) }   L   k ( d ) } 2 .
To minimize the voltage loss between Tx and Rx coils, the ratio ( X m X t ) should be equal to one. Thus, the theoretical resonant frequency can be derived when X m = X t . The key to solving the above equation is substituting the quantities of Xm and Xt as:
{ 2 π   f r ( d )   L   k ( d ) } 2 = R 1 2 + ( 2 π   f r ( d )   L   { 1 k ( d ) } 1 2 π   f r ( d )   C + 2 π   f r ( d )   L   k ( d ) ) 2 .
Simplifying the above expression, the theoretical resonant frequency ( f r theo ) can be represented as:
f r theo ( d ) = 1 2 π { ( 2 L C ) ( R 1 L ) 2 } ( 1 k ( d ) 2 ) .
Remark 1.
The calculation of the coupling coefficient is required to estimate both the theoretical resonant frequency and the virtual impedance (VI). This VI is used to counter the physical WPT impedance between the optimal receiving voltage and the load as illustrated in Figure 14.
Remark 2.
The main purpose of using the proposed new empirical polynomial expression (Equation (11)) is to avoid the complexity of calculating the physical mutual inductance between the Tx and Rx coils under the variation of the distance between these coils.
The results section validates that the optimal selection of the resonant frequency for a WPTS improves the power transfer efficiency. A new expression for estimating the adaptive resonant frequency ( f r adapt ) is obtained by multiplying the theoretical resonant frequency by an adaptation factor ( K f o p t ) , which includes the variation of the following physical factors: (1) the distance between Tx and Rx coils; (2) misalignment of the Rx coil; and (3) variation of the flux and the current in the resonance LC circuit. These factors cause variations in the theoretical resonant frequency which will decrease the efficiency of the WPTS. The adaptation factor introduced by the proposed work can be estimated from multiple practical scenarios and can be expressed as a polynomial expression as:
f r adapt ( d ) = K f opt 2 π { ( 2 L C ) ( R 1 L ) 2 } ( 1 k ( d ) 2 ) ,
where K f opt is an adaptation factor for estimating optimal resonant frequency for each distance between Tx and Rx coils:
K f opt ( d ) = i = 0 5 f i   d i ,
where the weights of the coefficients of Equation (24) are listed in Table 6. It is worth noting that K f opt is estimated via hardware experiments. K f opt is the ratio of optimal resonant frequency to the base value. Using this estimation factor, the constraints of the adaptation process increase the efficiency of the power transfer and limit the DC current. The range of the resonant frequency is 49–65 kHz and the relationship between adaptation factor and the distance is depicted in Figure 15.
According to the Thevenin WPTS equivalent circuit (see Figure 14), the reference receiving current ( I r R e f ) for the adaptive virtual impedance controller is derived as:
I r Ref = V r Ref 1 { Re ( Z wpt ) + R Load opt } 2 + Im ( Z wpt ) 2 .

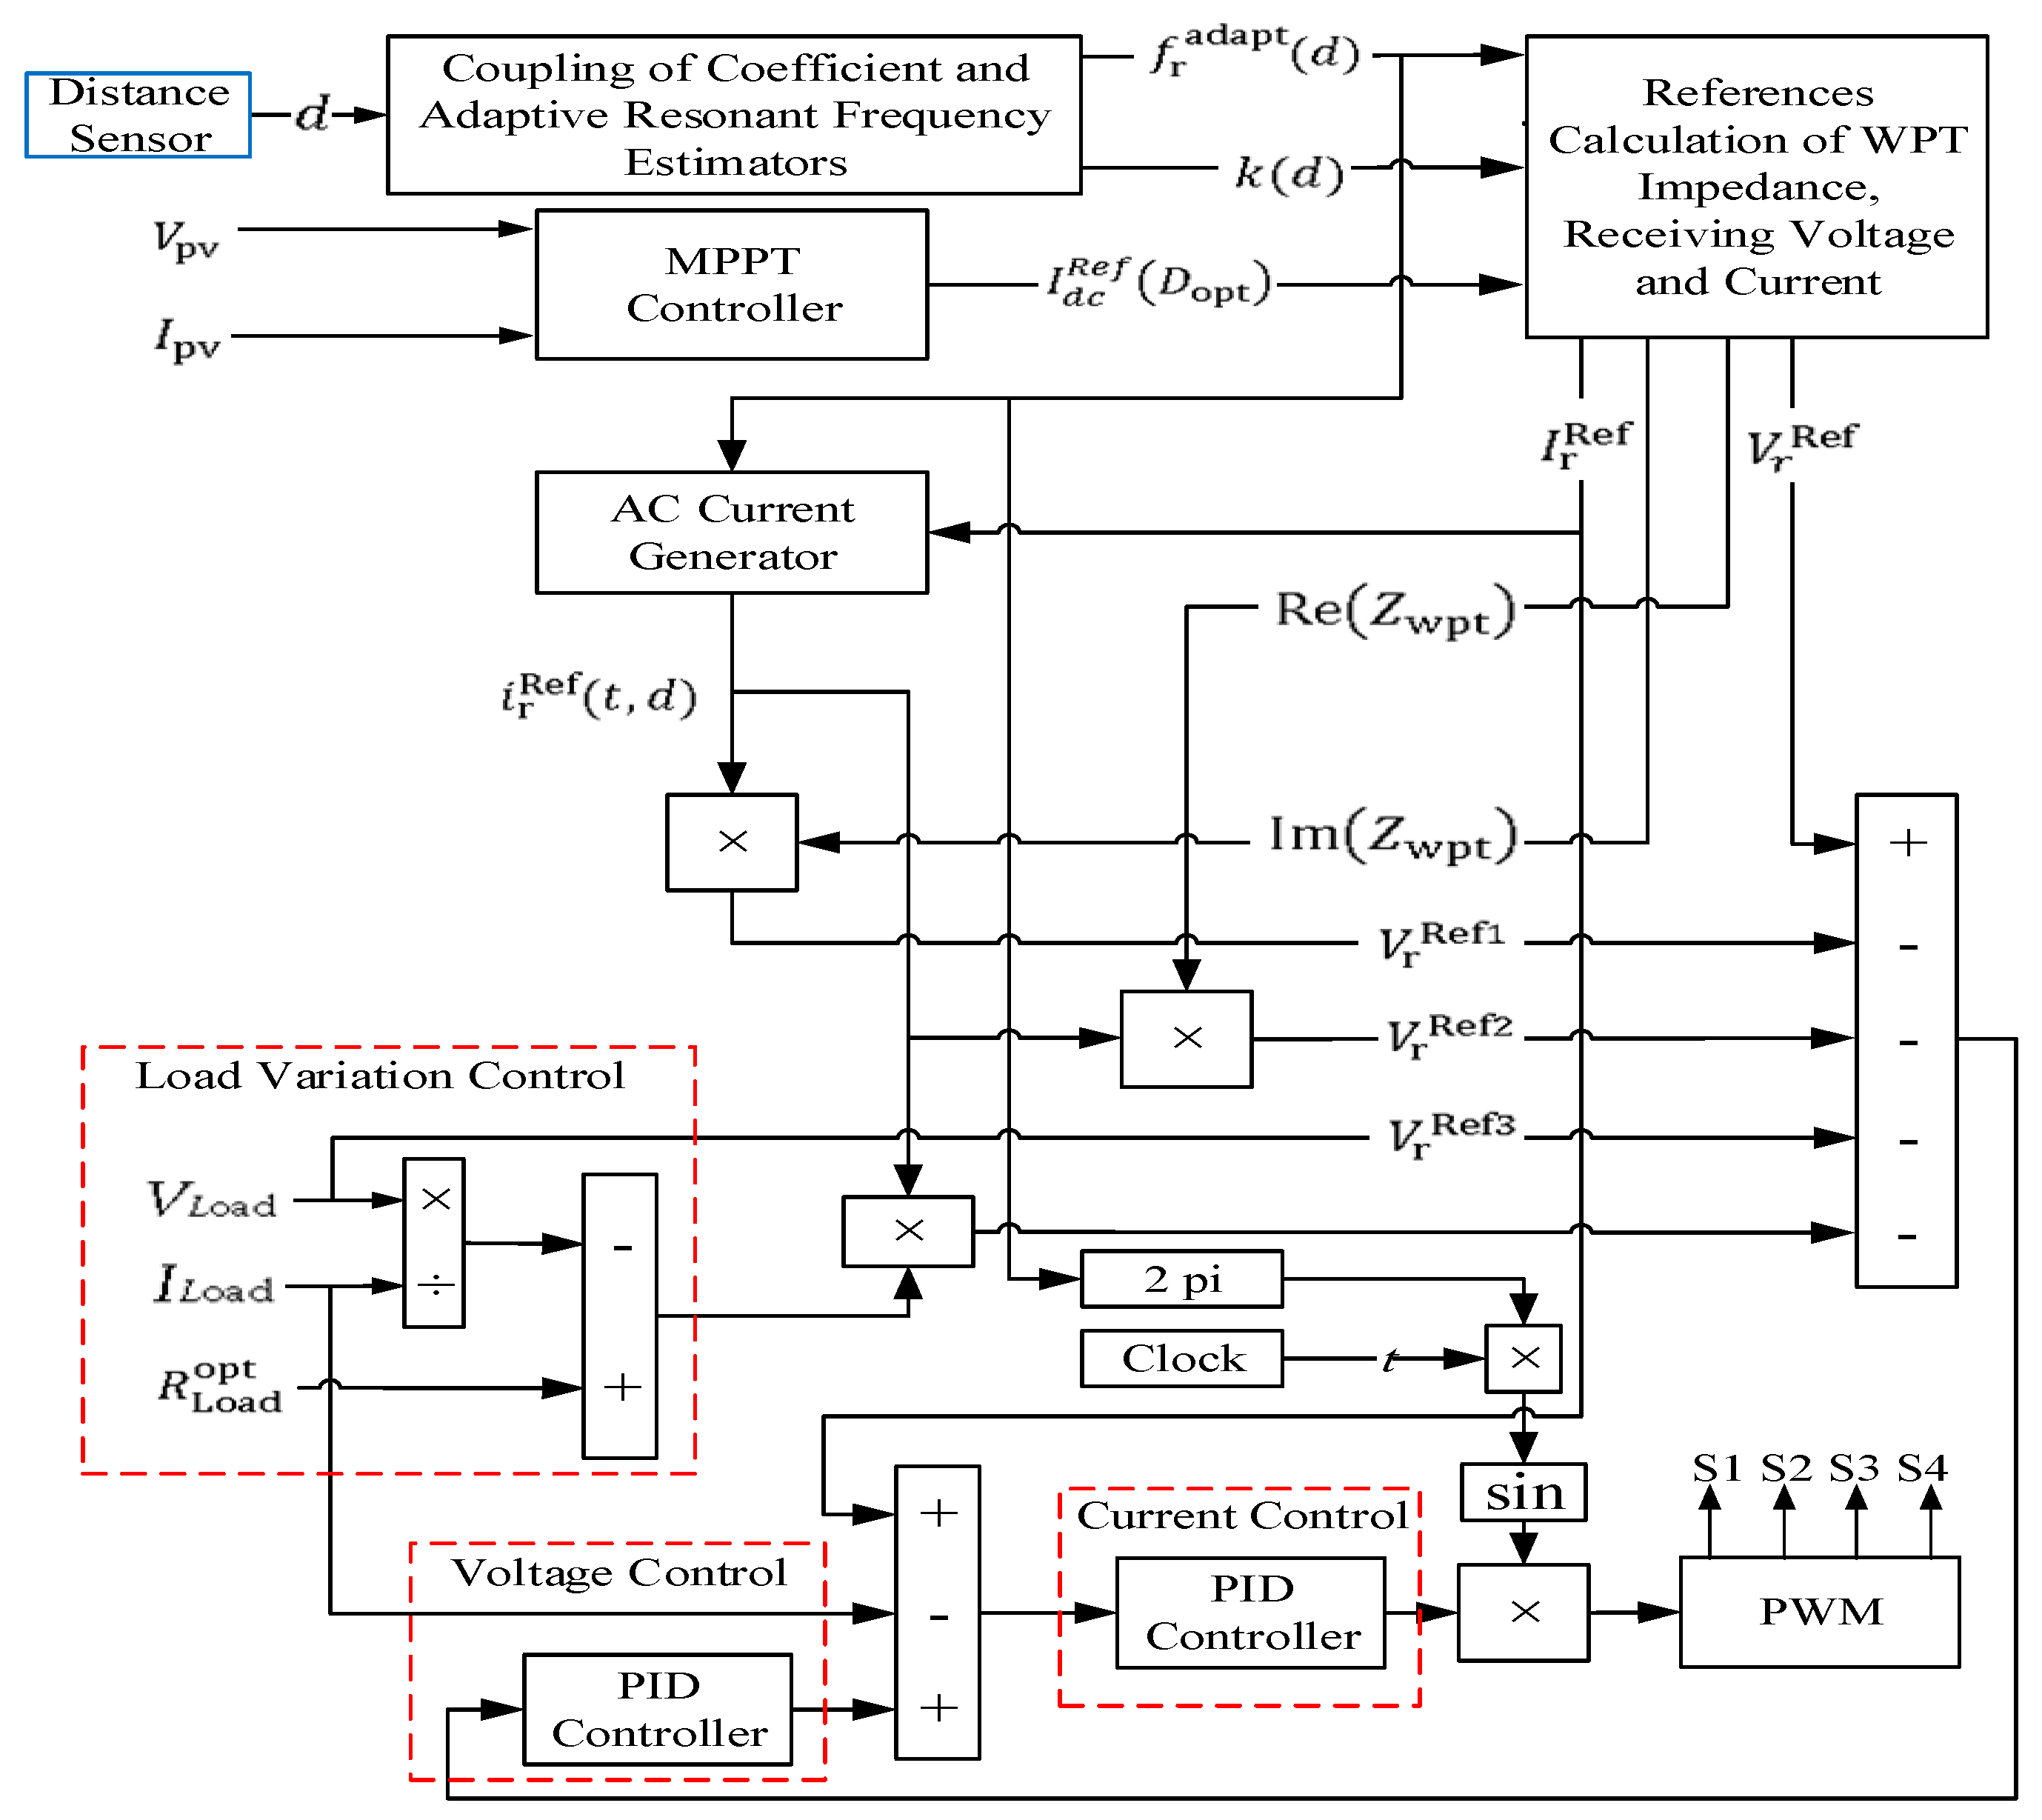
3.3. Description of the Proposed Controller

The block diagram of the adaptive virtual impedance controller (AVIC) is shown in Figure 16. The main parts of the proposed controller are briefly discussed as follows:
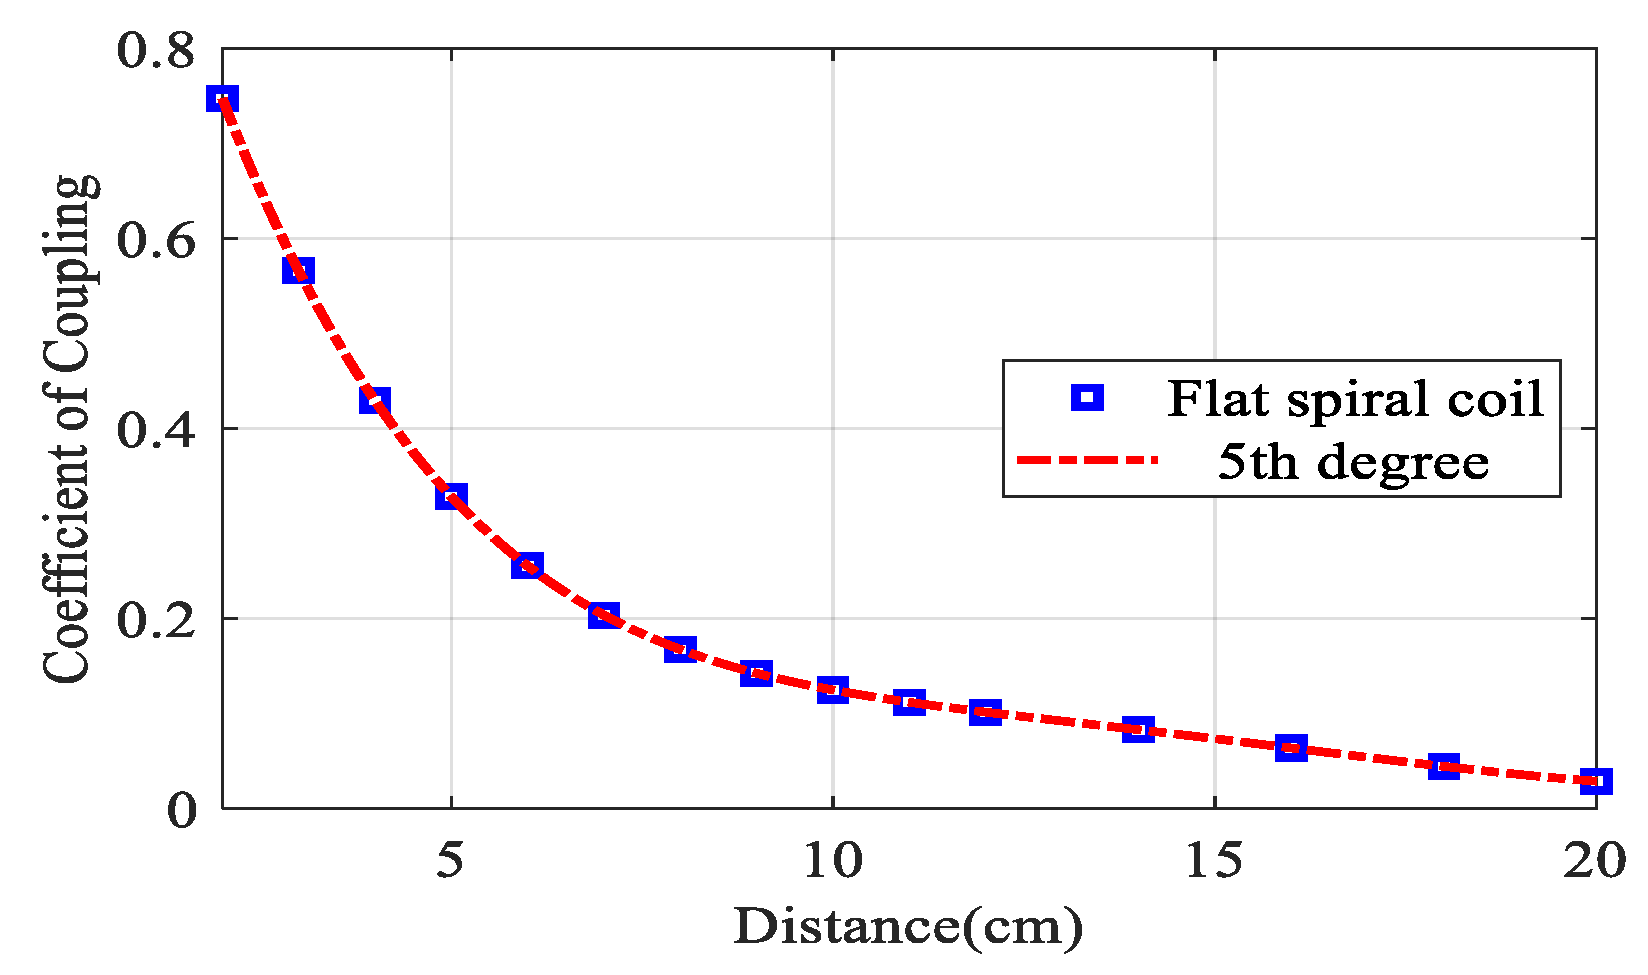
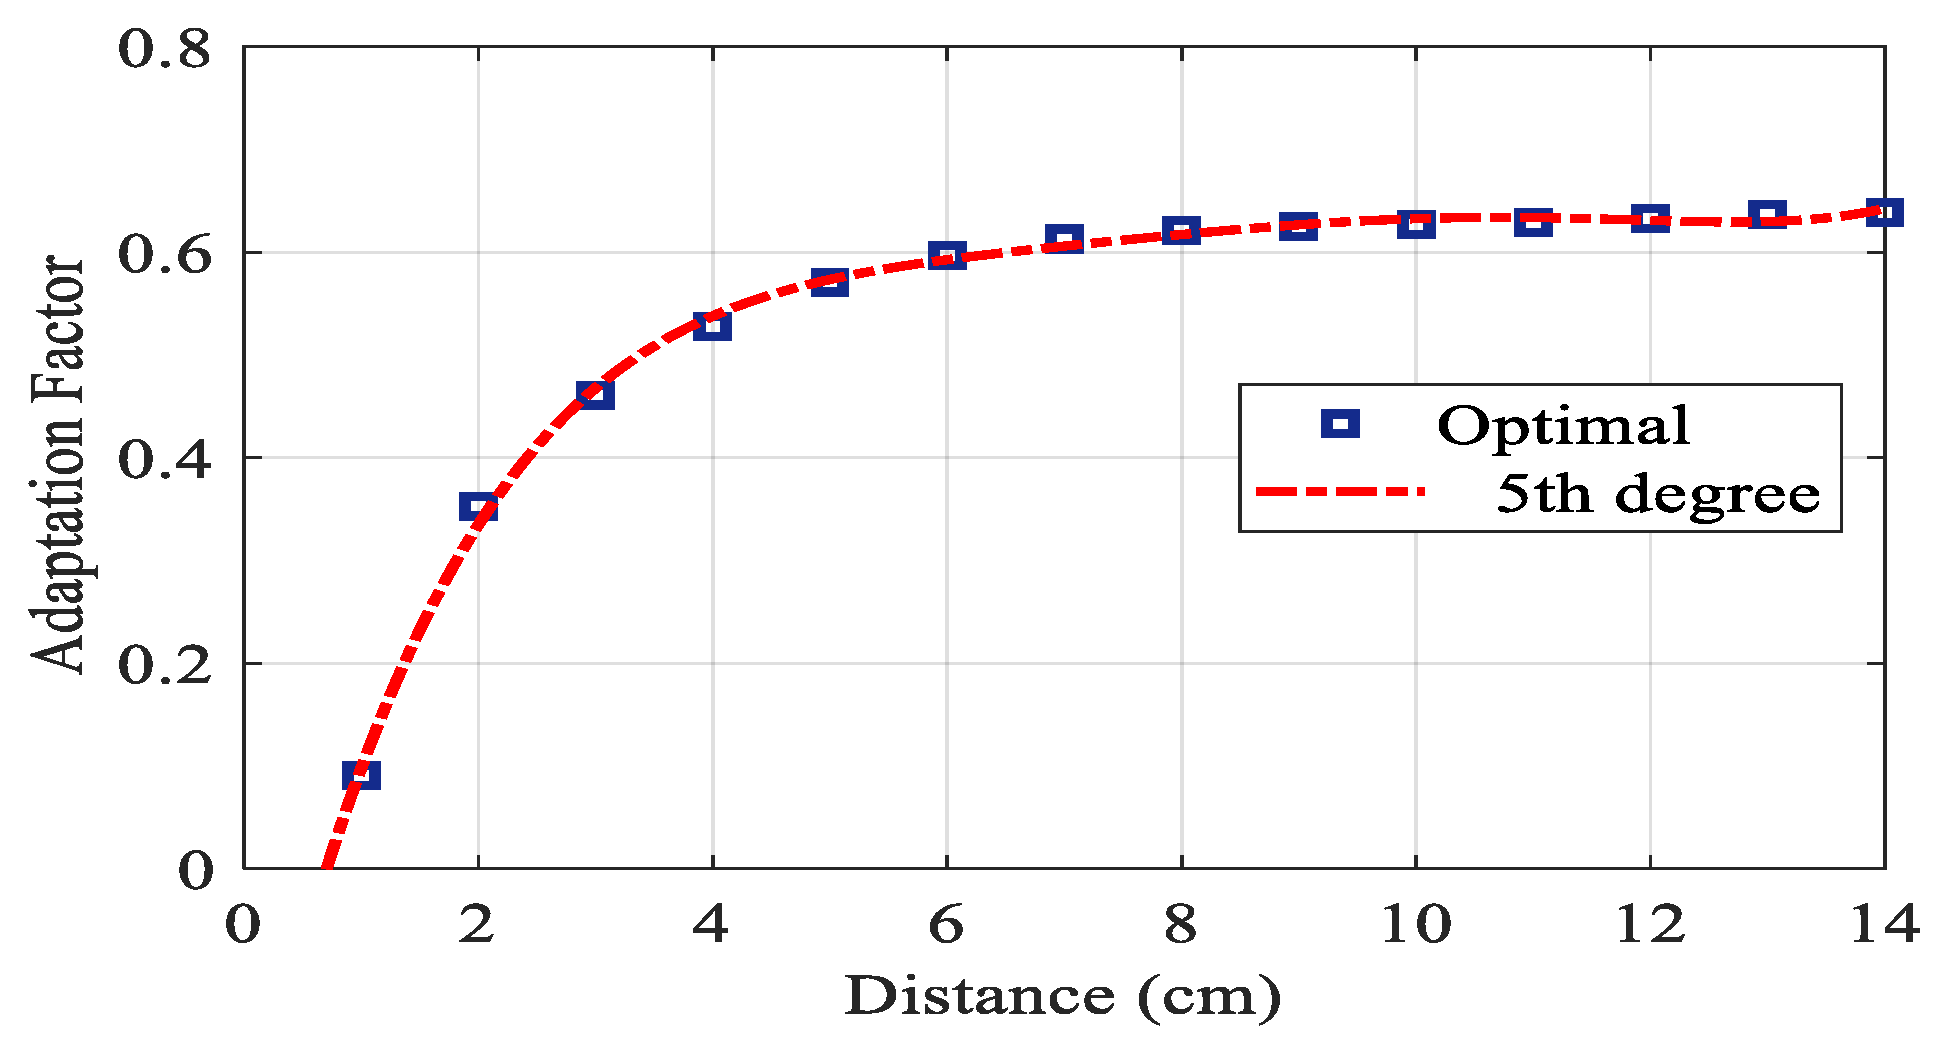
  • Coupling Coefficient and Adaptive Resonant Frequency Estimators: The purpose of these estimators is to obtain optimal values of the coupling coefficient and the resonant frequency under the variation of the distance between Tx and Rx. The new Equations (11) and (24) are used to estimate the optimal control signals, i.e., K(d) and fr(d), by measuring the distance.
  • MPPT Controller: As mentioned previously, the purpose of this controller is to generate the optimal duty cycles that ensure maximum power transfer from the PVG to the DC-link of the inverter.
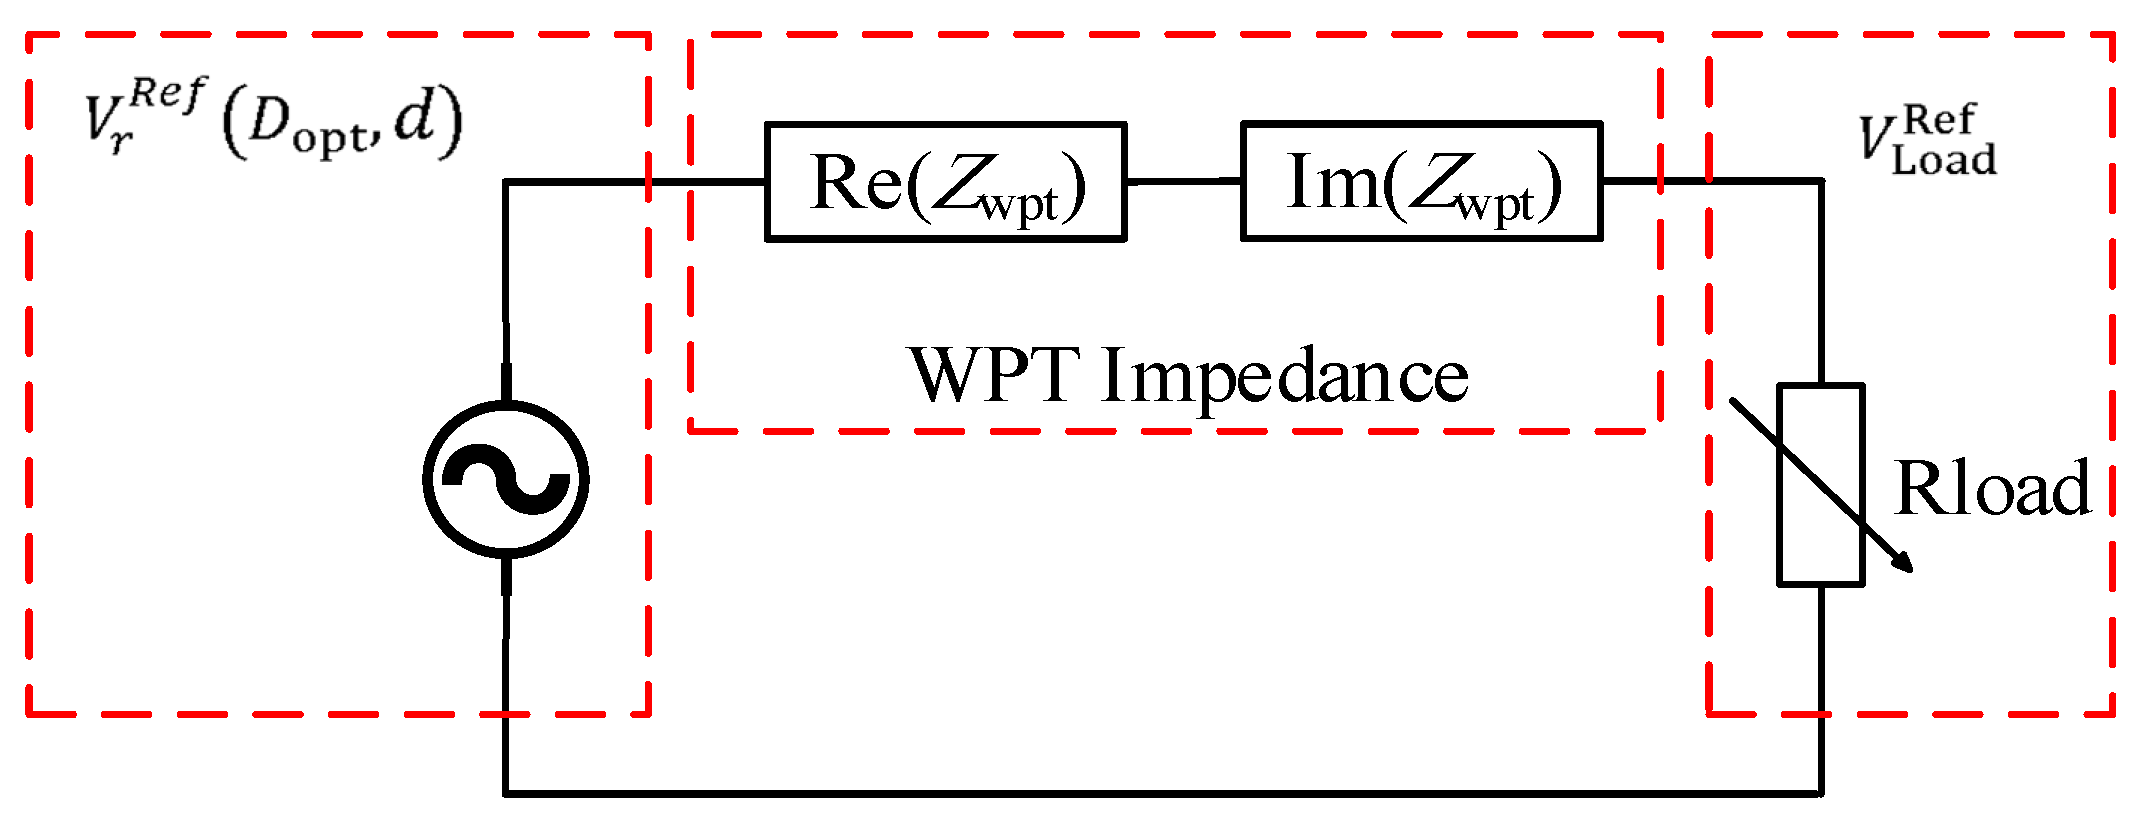
  • Reference Calculation of WPT Impedance, Load Voltage, and Load Current: The reference values of the virtual impedance controller, i.e., virtual resistance, virtual inductance, load voltage, and load current, are estimated using Equations (17), (18), (20), and (25), respectively. Optimal tuning of the WPTS impedance over time is essential when the distance between Tx and Rx coils varies. As mentioned in the literature review, in [13] and [15] the efficiency of the WPTS can be improved by changing the size of inductor and capacitor. This method may add extra weight and cost to the system. In the proposed method, the real and imaginary parts of the equivalent WPTS impedance are computed and multiplied by the reference time-varying receiving end current. The resonant frequency is adaptively changed to improve the receiving end voltage.
  • AC Current Generator: This unit is used to generate the time-domain load current according to the following expression:
    i r Ref ( t , d ) = 2   I r Ref sin ( 2   π   f r adapt ( d )   t ) .
As mentioned previously, the aim of the proposed controller is to maximize the transfer of power from the PVG to load and limit the DC current within the allowable MPP current under the variation of ambient irradiance and load. As illustrated in Figure 16, the outer voltage loop controller is designed to compensate the imaginary part of the WPTS impedance i.e., Im(Zwpt). In this manner, the virtual load resistance is seen to be as close to its optimal value as displayed in the load variation controller. The expressions for the voltage reference signals are:
V r Ref 1 = i r Ref   Im ( Z wpt ) ,
V r Ref 2 = i r Ref   Re ( Z wpt ) ,
V r Ref 3 = i r Ref   ( R Load opt R Load mea ) .
Based on the experimental tests, R Load opt is found to be about 9 Ω. The three voltage reference signals ( V r R e f 1 ,   V r R e f 2 ,   and   V r R e f 3 ) are compared with V r R e f and the measured load voltage. The output is adjusted via a proportional integral derivative (PID) controller to generate the second reference for the receiving end current. The new reference current is compared with the receiving end reference current and the measured load current (ILoad). The output error of these currents is fed to a PID controller to generate the reference voltage. This reference voltage is further converted to ON/OFF pulses using a PWM generator. It is important to note that the switching frequency of the inverter is equal to f r adapt ( d ) .

4. Simulation and Experimental Results

To validate the performance of the proposed WPTS, a MATLAB/SIMULINK environment was used. The detailed circuit model of the simulated WPTS is given in Figure 17. In this model, a 130 W PVG is used as a source for the system. To implement the MPPT module, the voltage is increased to be higher than that of the source, and to ensure the input voltage to the inverter is robust, a boost converter is used that is operated using a 65 kHz PWM generator. Further, the robust DC voltage is fed to an H-Bridge inverter which is operated at the resonant frequency of the inductive coupling circuit. Finally, the output of the inverter is fed to the resonant inductive coupling circuit which feeds the attached load. The parameters of the complete WPTS are given in Table 7. To validate the claims relating to the proposed WPTS, a number of scenarios are proposed in the following subsections.

4.1. Scenario One: Experimental Tests for Verifying the MPPT Algorithm

In this scenario, the proposed MPPT algorithm, i.e., modified IC-based MPPT (MIC-MPPT), was experimentally tested during different hours of the day for various types of loads. Because the main focus of MPPT is to generate maximum power from the source, the WPTS is replaced by a pure resistive load to test the power transfer capability of the proposed MIC-MPPT algorithm. The simplified circuit diagram and experimental prototype, as shown in Figure 6a,b, includes power transfer from the PVG to the DC-link through a boost converter interface. For the test scenario, results of two hours of the day are demonstrated in which power delivery was verified for a system with and without the MIC-MPPT algorithm. On 10 April 2020, irradiance of 893 W/m2 at 10:00 am was calculated using a light sensor. A pure resistive optimal load of 5 Ω was calculated from a voltage versus current graph to obtain maximum power transfer. Moreover, the system was also tested for loads other than the optimal value, such as 7 Ω and 9 Ω. Results of both of the systems can be observed in Figure 18a–c. In these figures, for each load, the initial irradiance is 723 W/m2 and after t = 0.05 s, the irradiance is 893 W/m2. Moreover, a detailed quantitative analysis for both the systems is also given in Table 8.
To avoid redundancy, the discussion here is only limited to results with optimal load (i.e., 5 Ω) as shown in Figure 18c. In this figure, before t = 0.05 s (irradiance = 723 W/m2) it can be observed that the power delivery to the load without MPPT is found to be 62.1 W, which is denoted DC-without MPPT in the legend. In the same figure, the total output power of the PVG is 68 W, which is denoted PV-without MPPT. After activating the MIC-MPPT algorithm, the system power delivery was increased to 68.5 W (DC with MPPT) out of 75.2 W (PV with MPPT) of the total PVG output power. Overall system losses of around 9.6% with MPPT and 8.7% without MPPT can be calculated. The efficiency of the system without MPPT is 66.1%, and increases to 91.1% using the proposed MIC-MPPT algorithm. At t = 0.05 s, the irradiance is changed to 893 W/m2. Here, without the MIC-MPPT algorithm, the power delivery to the load is almost 66.1 W and the total output power of the PVG is 72.3 W. After activating the MIC-MPPT algorithm, the system power delivery is increased to 101.2 W out of the total 112.7 W generated by the PVG. The overall losses of the system are around 8.6% (without MPPT mode) and 10.2% (with MPPT mode). Furthermore, the efficiency of the system without the MPPT algorithm is almost 56.9%, which is increased to a sizeable 89.8% using the proposed MIC-MPPT algorithm.

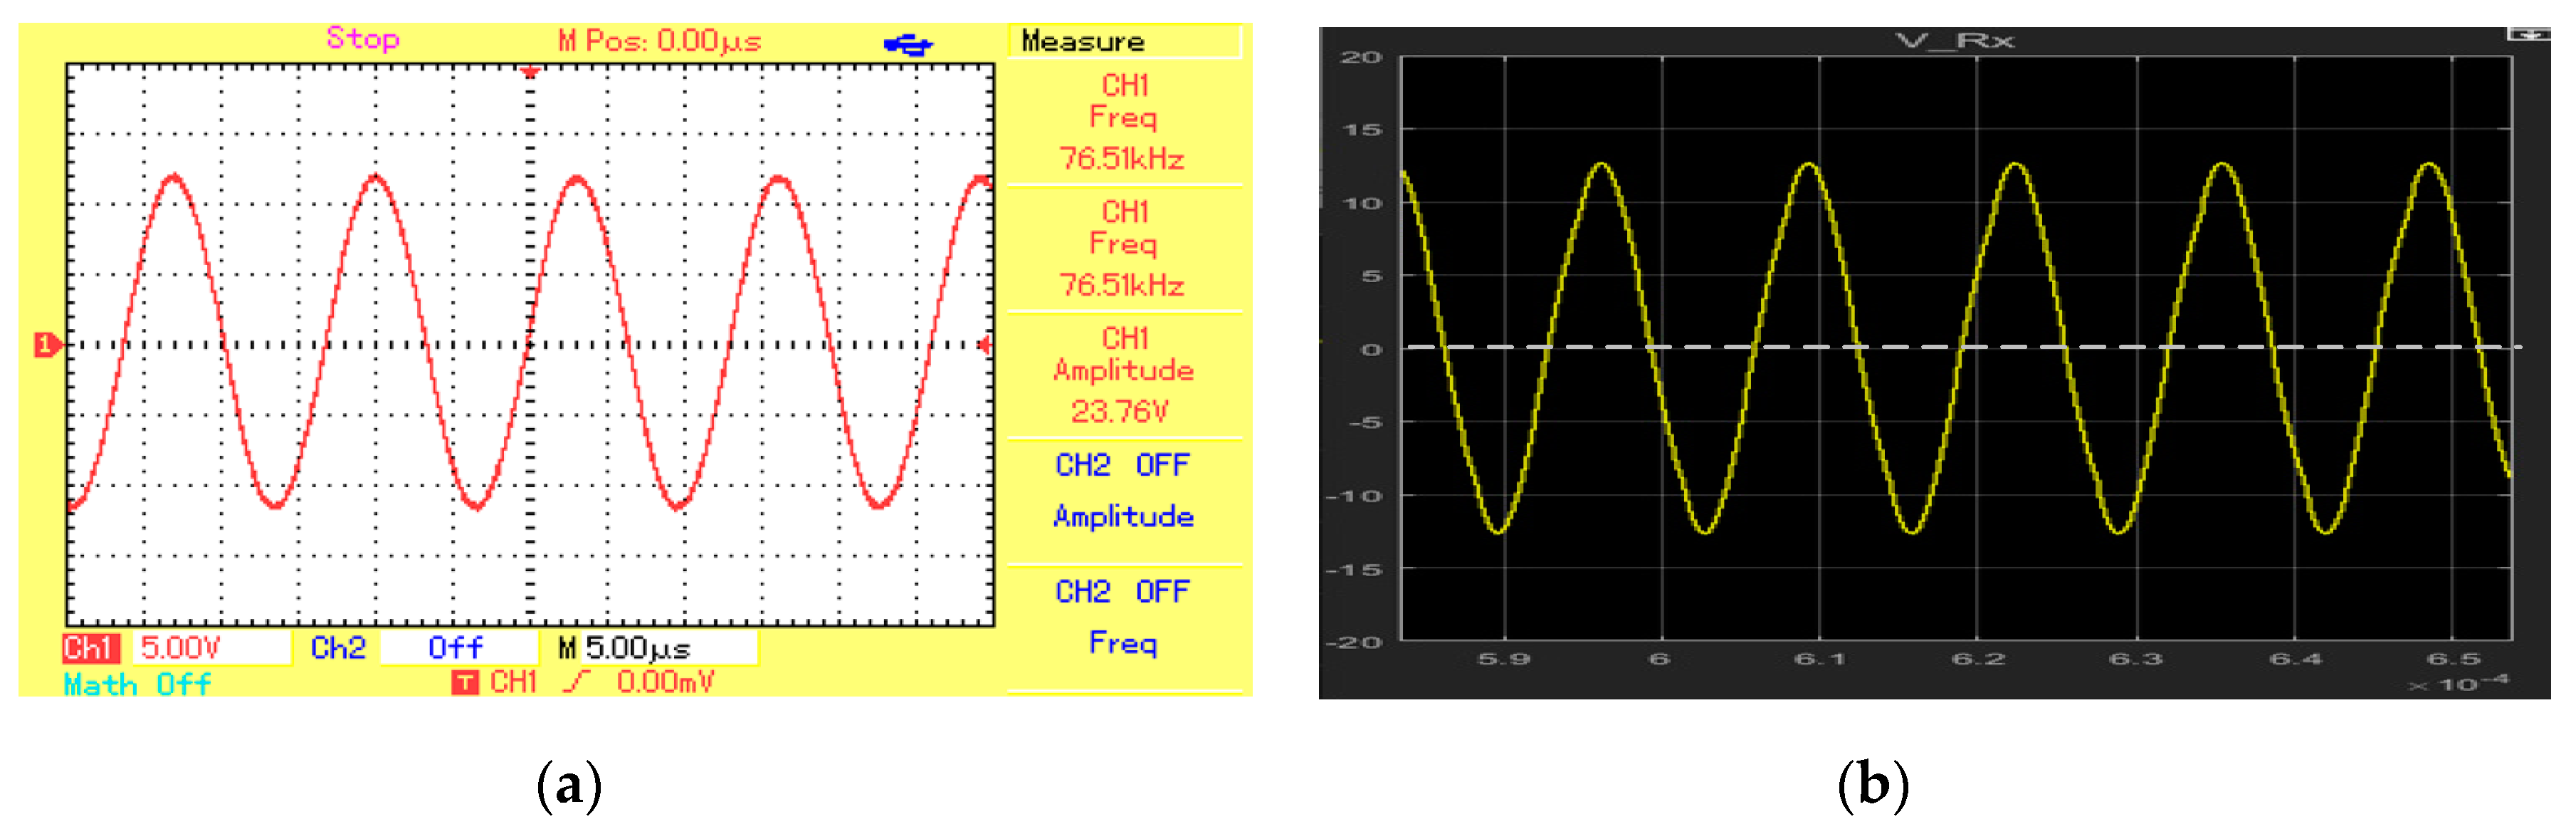
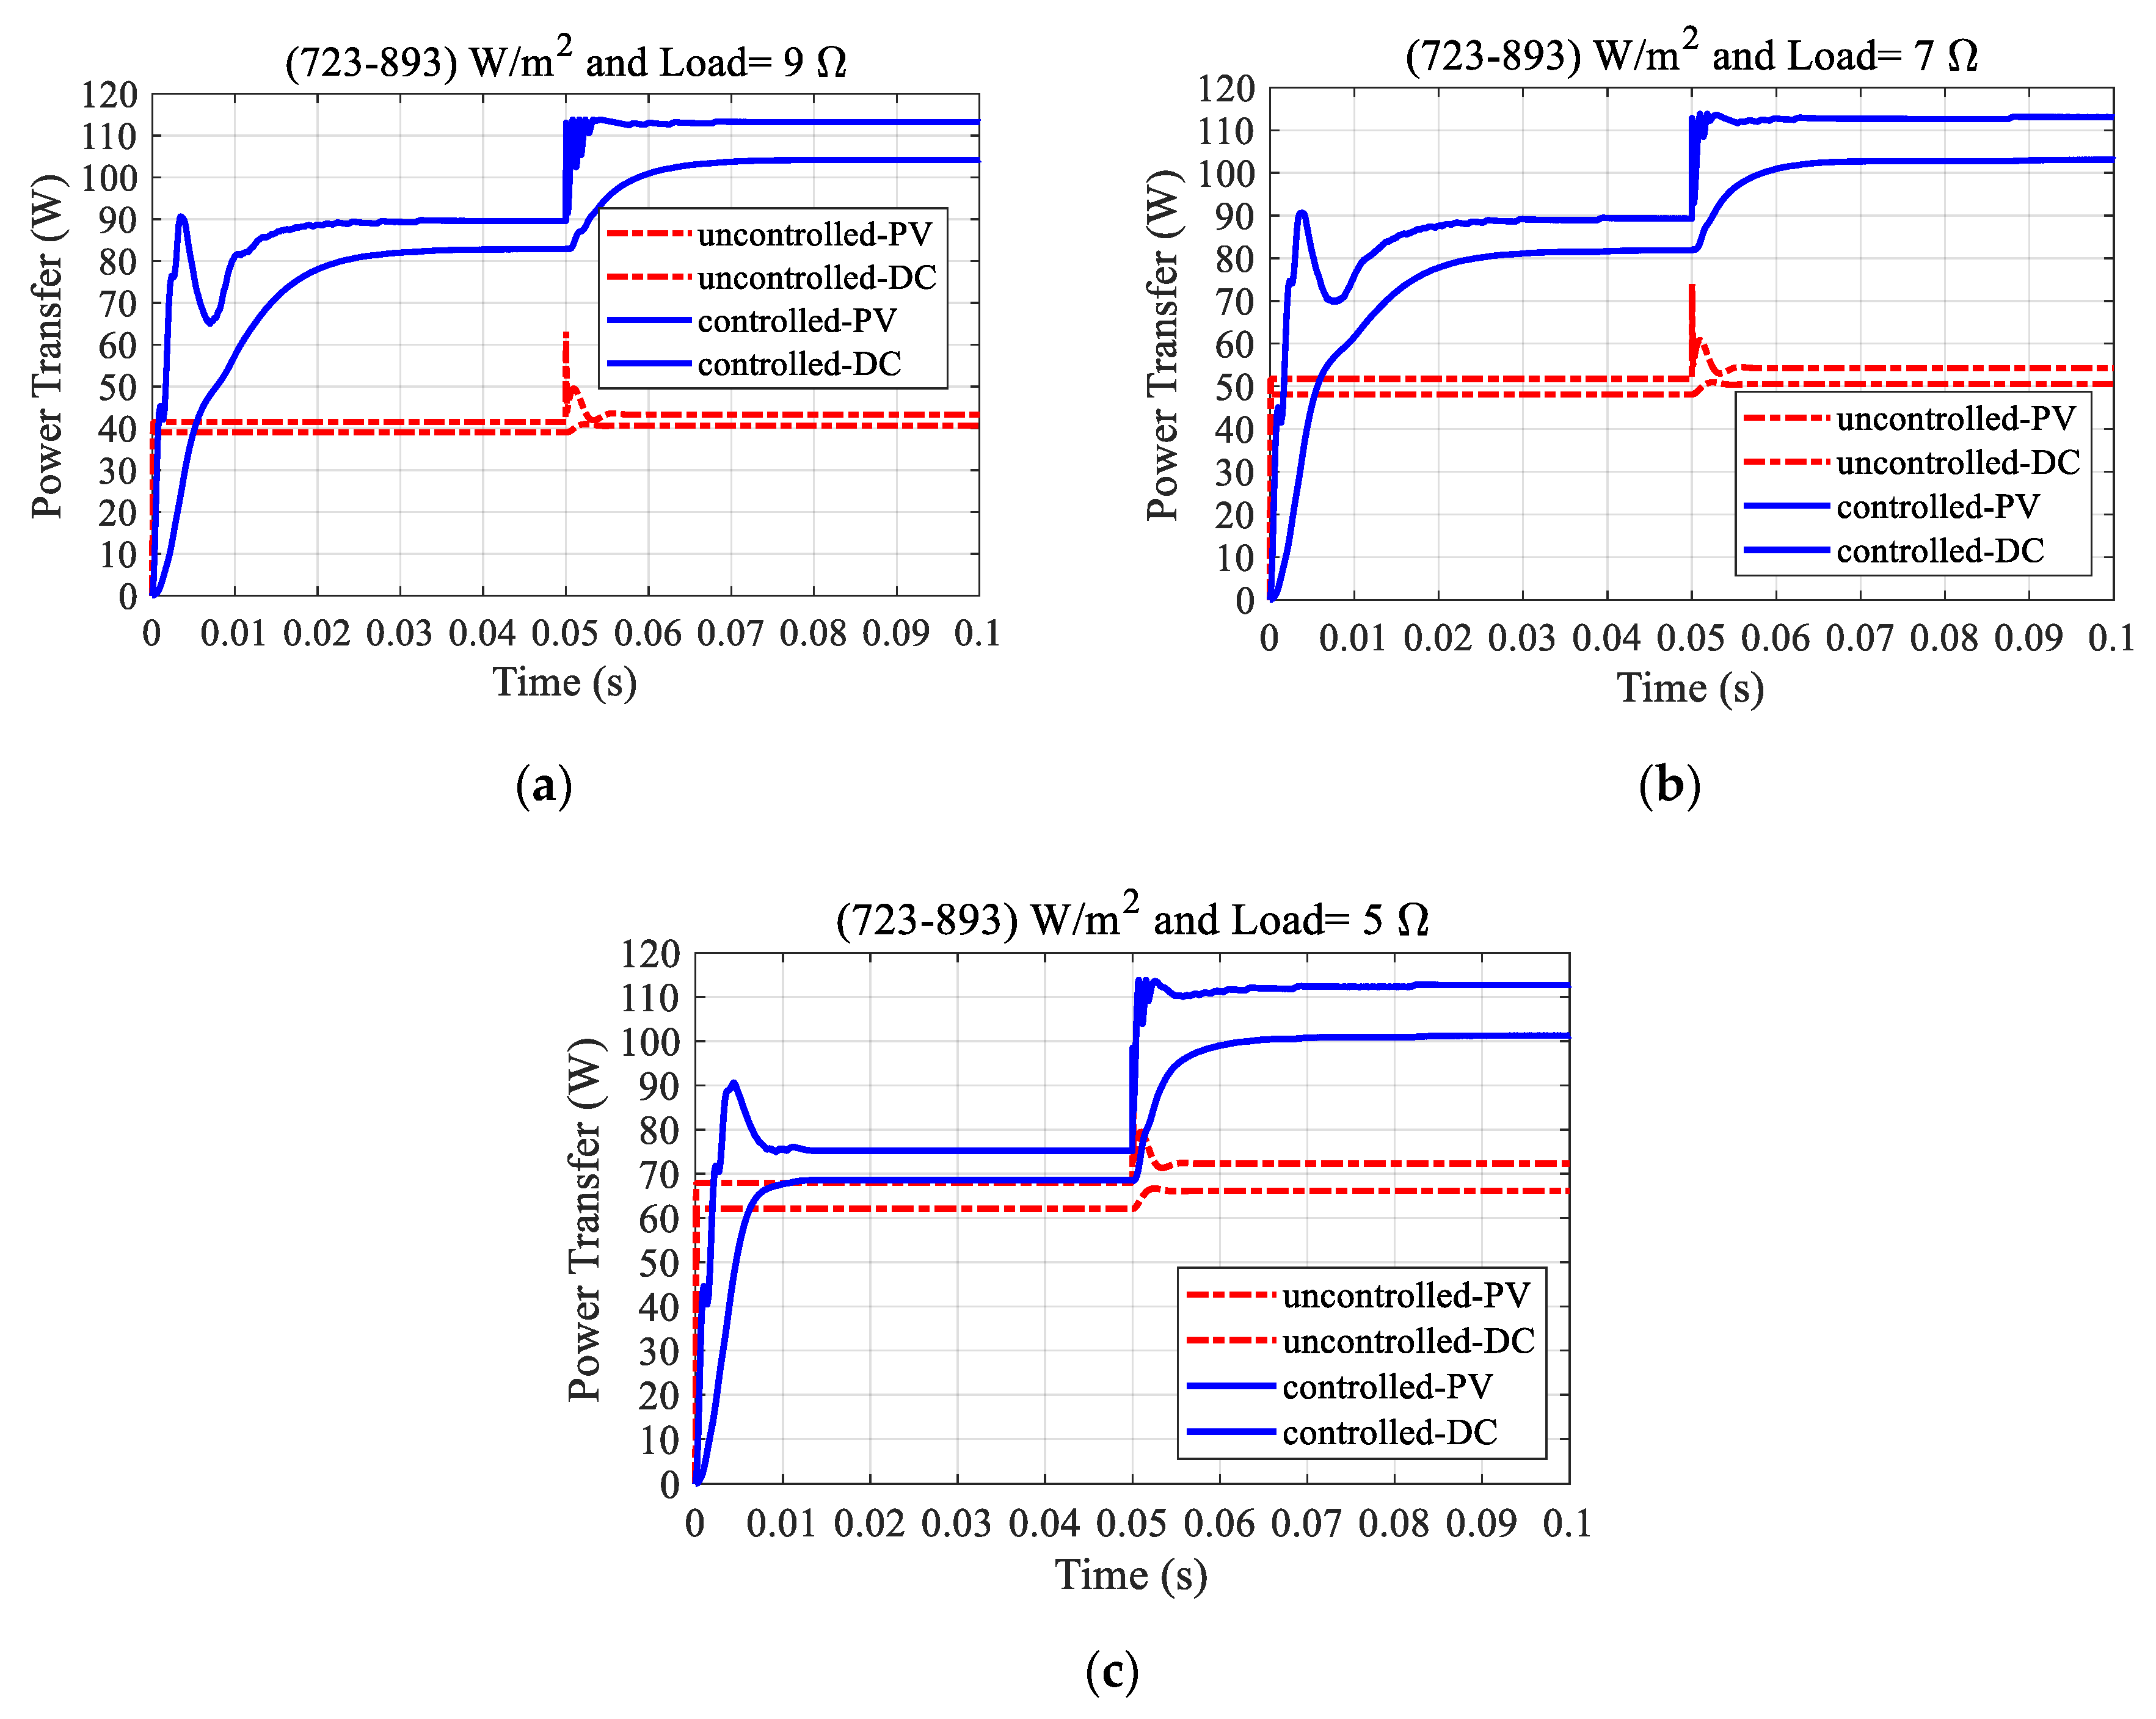
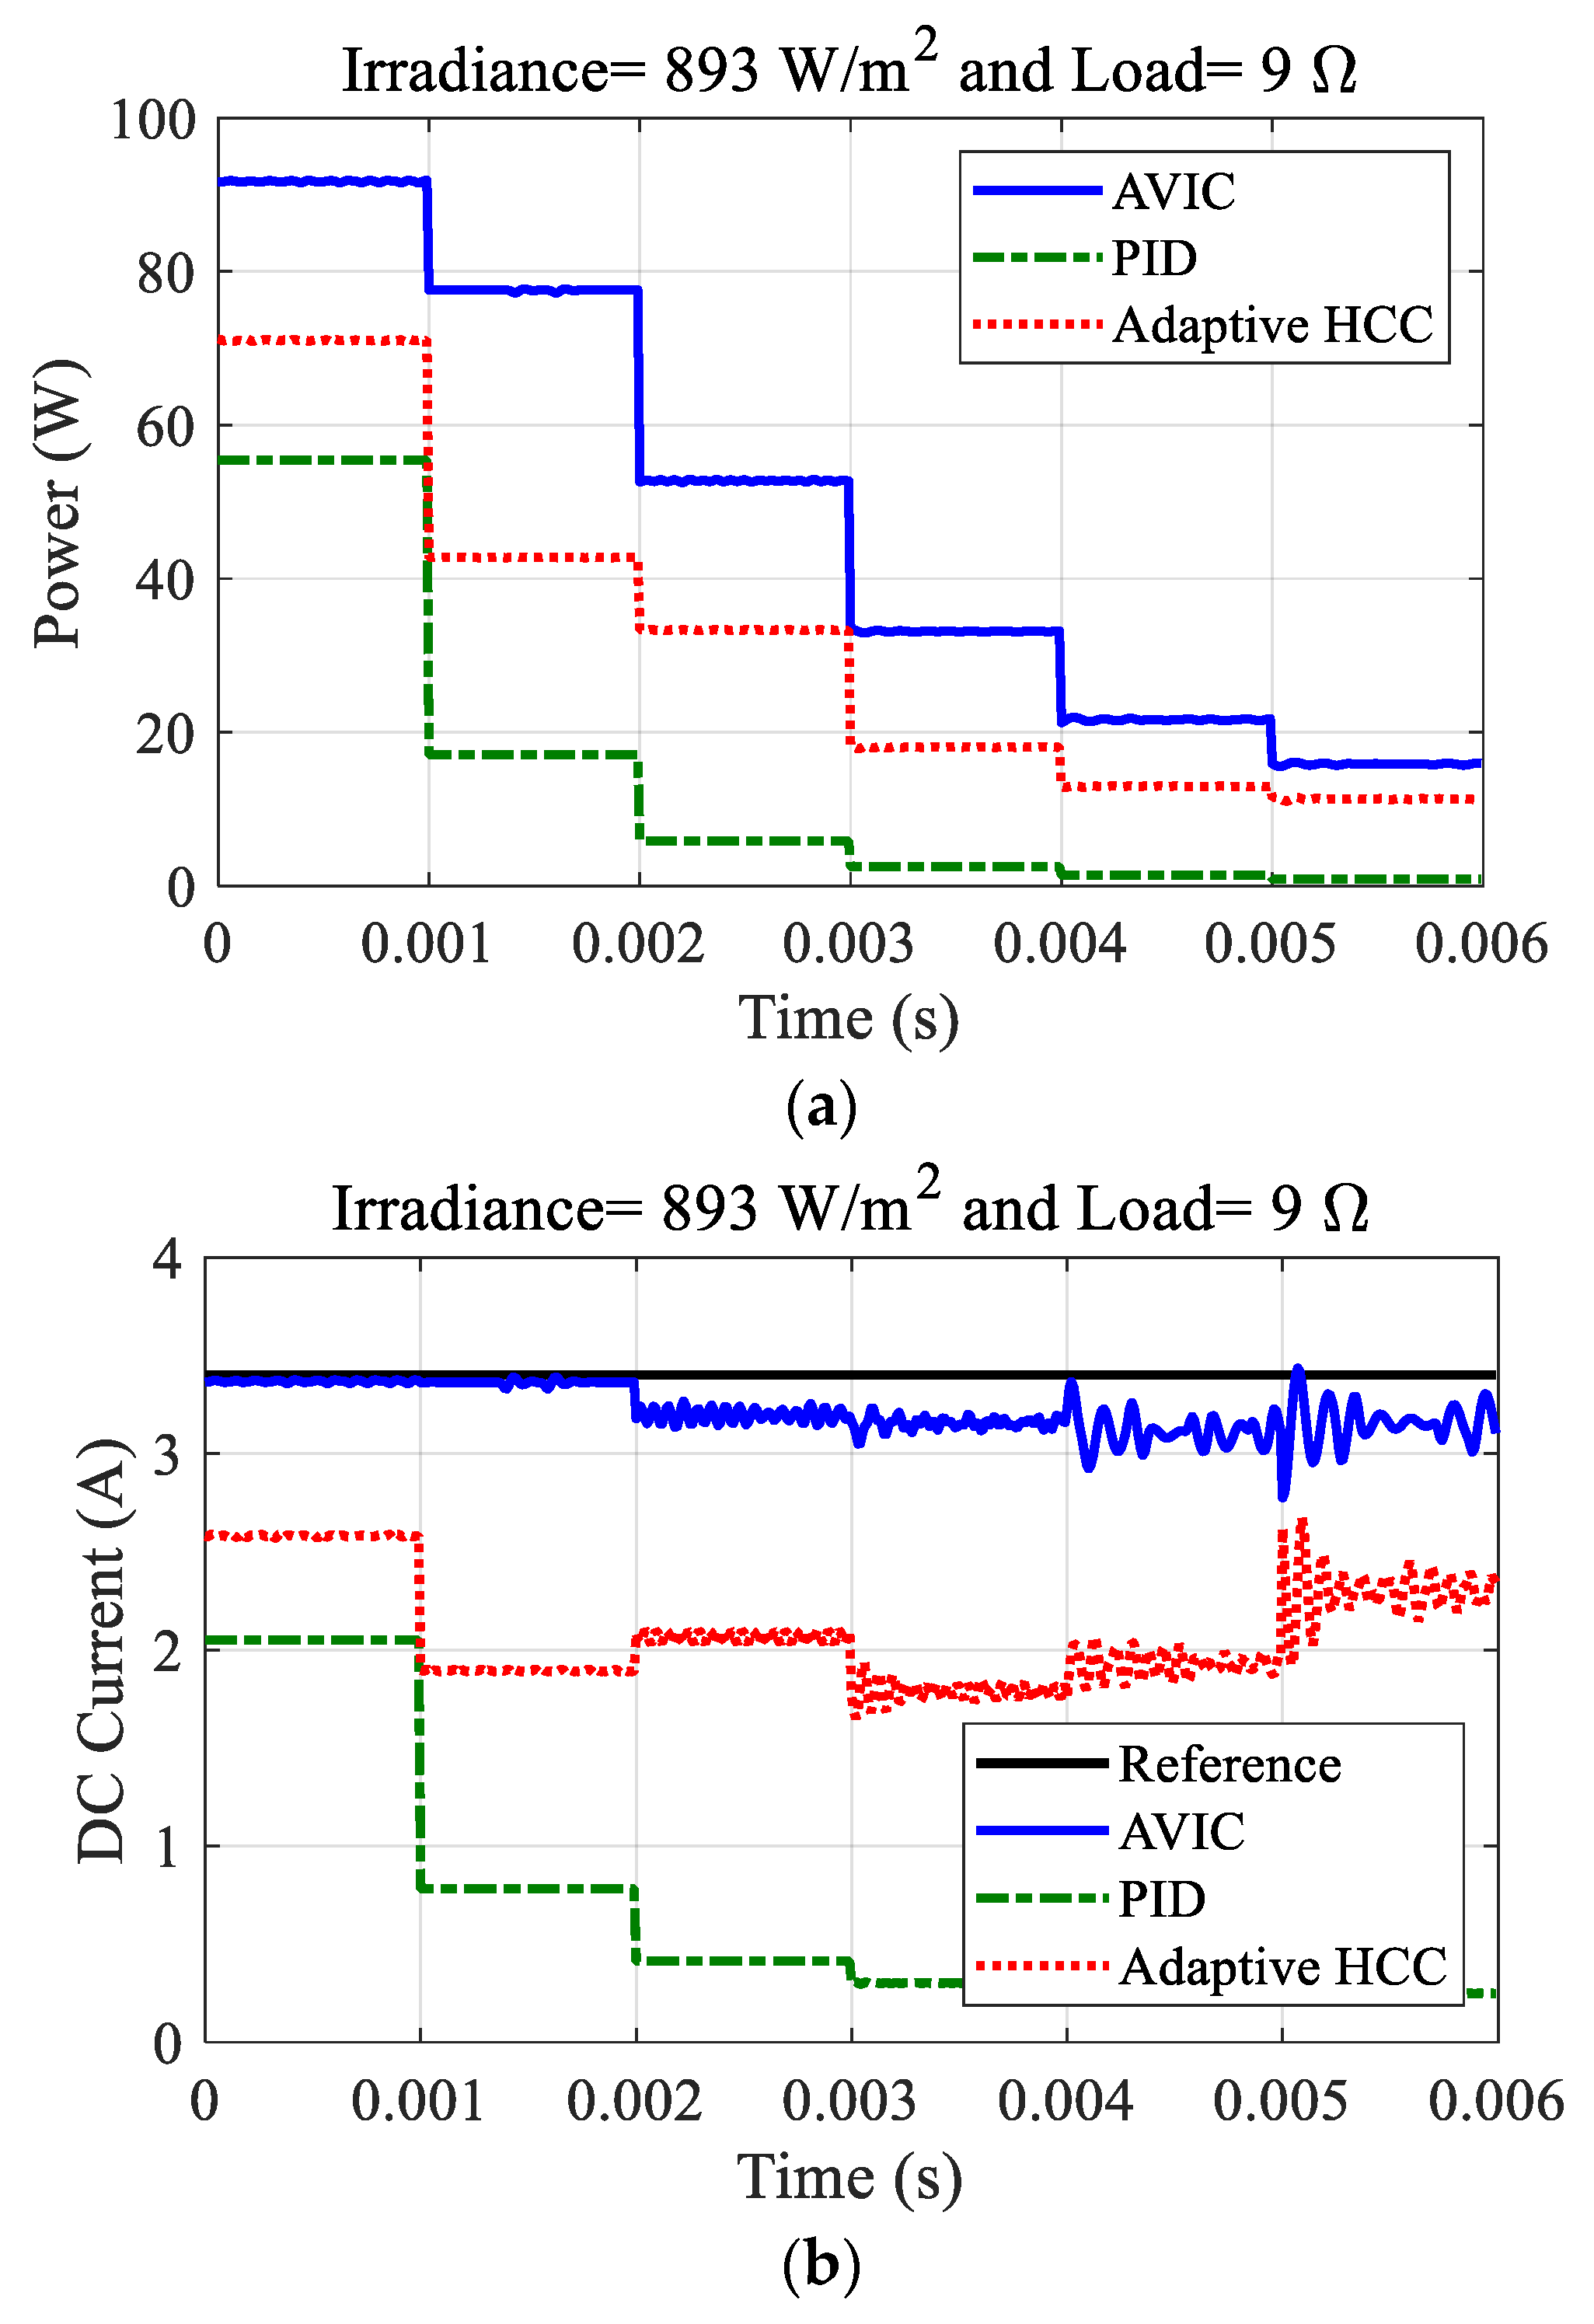
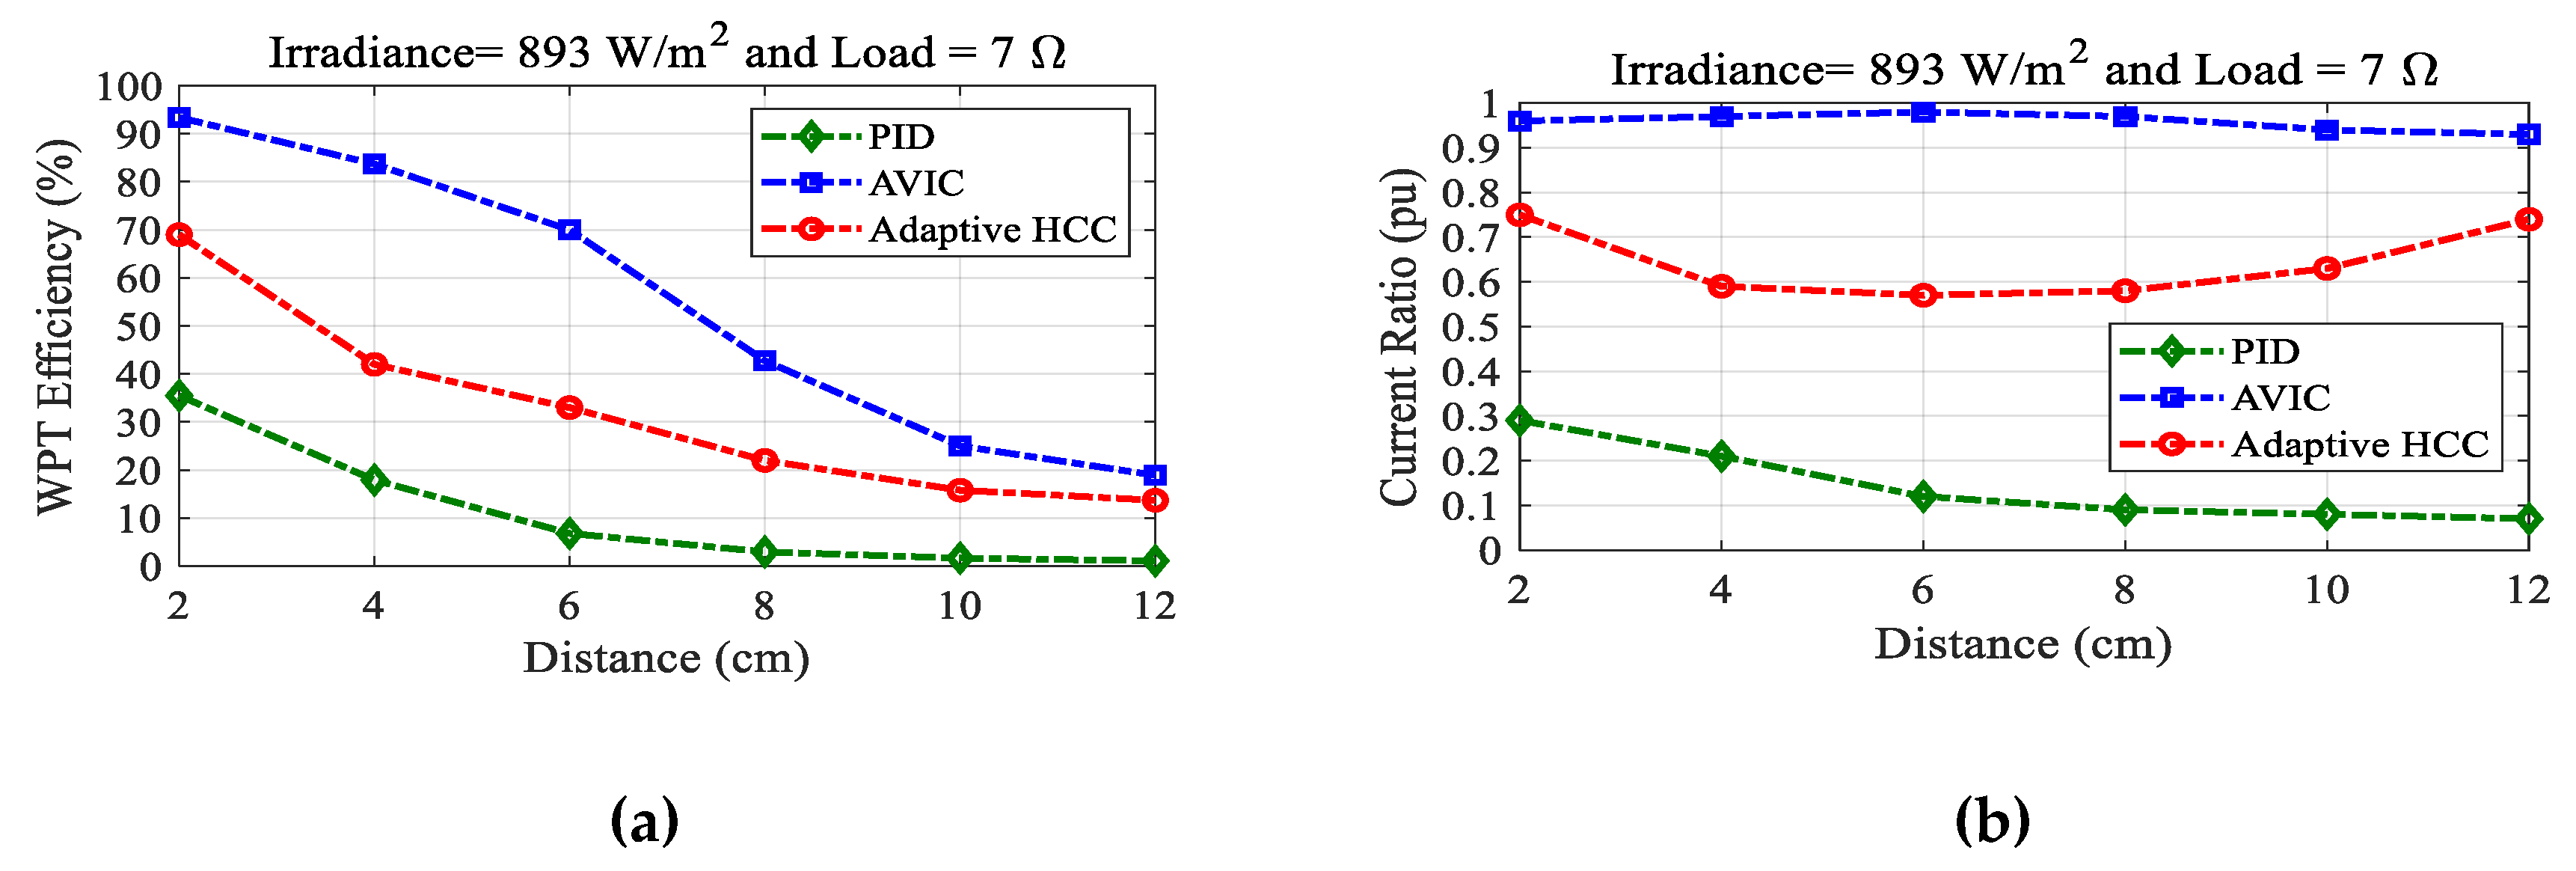
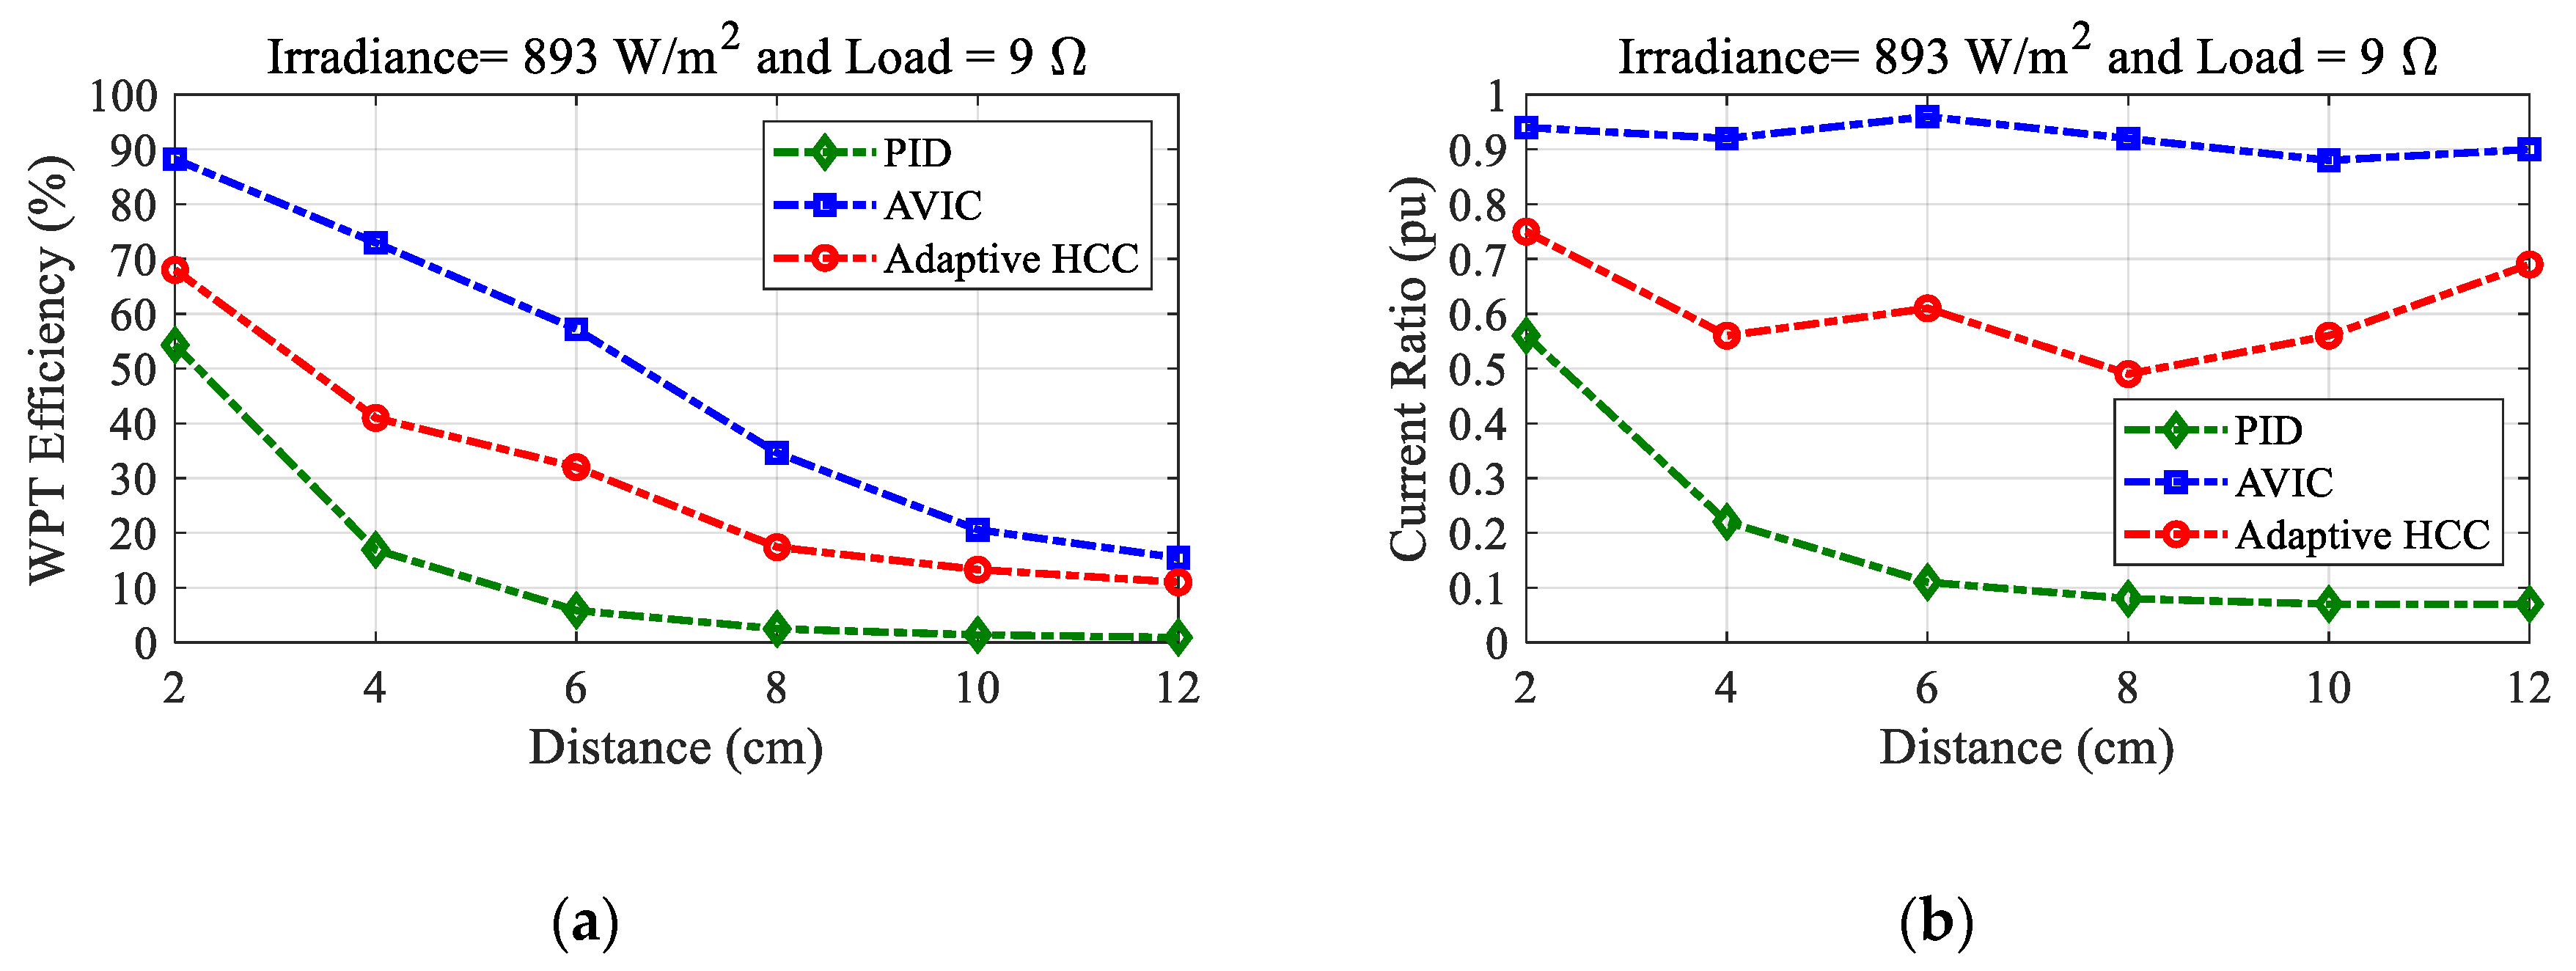
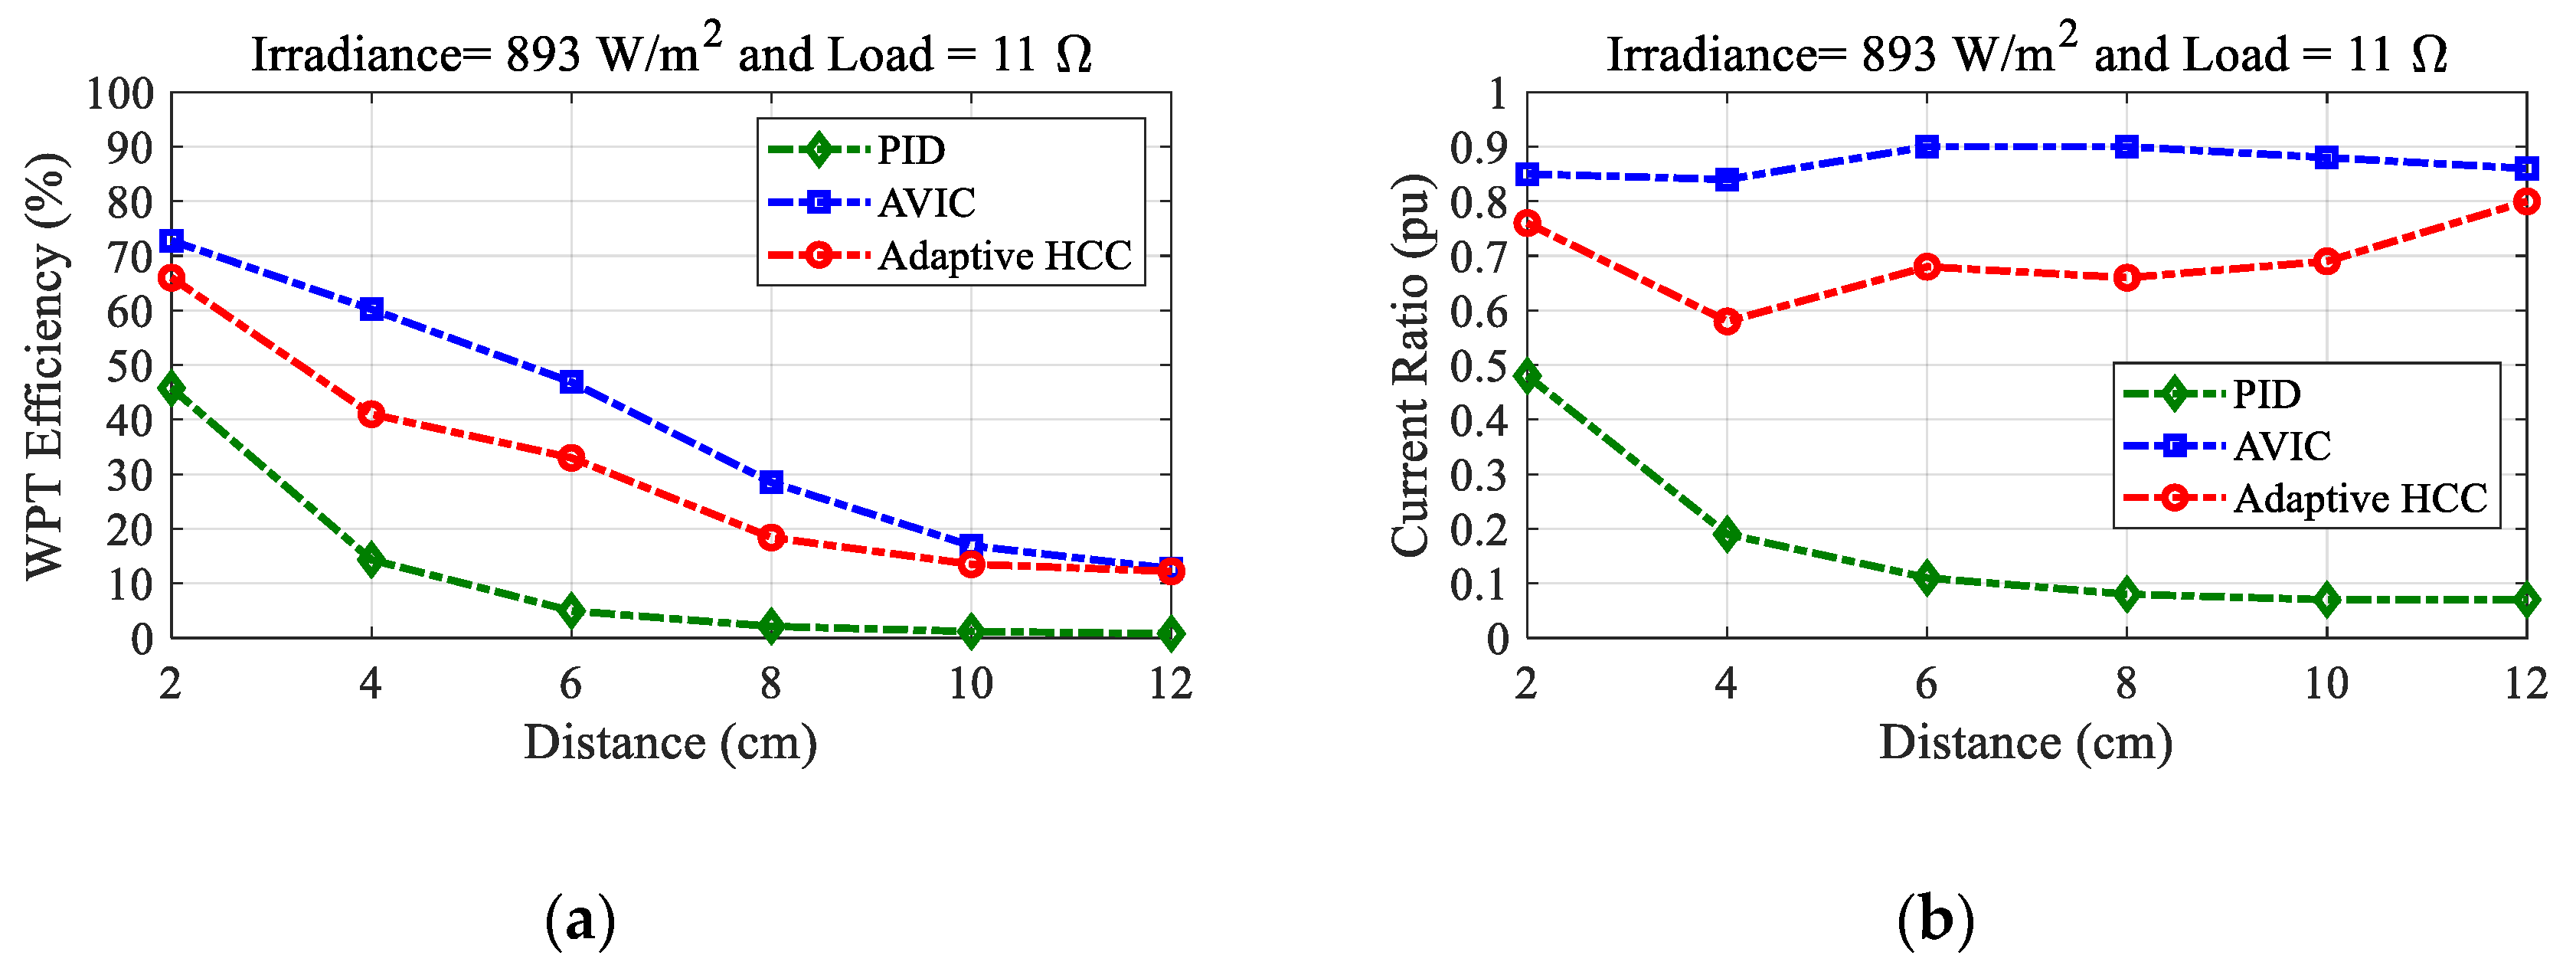
4.2. Scenario Two: Validating the Superiority of the Proposed AVIC Adaptive Frequency Controller

In this case study, the influence of the proposed AVIC adaptive resonant frequency controller was tested on the overall performance of the WPTS. For this scenario, a comparative analysis was undertaken between a proportional integral derivative (PID) controller (based on fixed resonant frequency versus distance) and an adaptive hysteresis current controller (HCC) (based on adaptive resonant frequency versus distance), as presented in [19]. It is important to note that the HCC proposed in [19] is based on a non-adaptive frequency strategy. To present a fair comparison, the HCC in [19] is upgraded to adaptive resonant frequency, which enhanced its efficiency as evident from the results presented. The constraints chosen for this scenario are: irradiance = 893 W/m2; maximum allowable DC current of the PVG (short circuit current) = 3.4 A; maximum DC power supplied by the PVG = 104.4 W; and a fixed load = 9 Ω. As shown in Figure 19a,b, the performance of the WPTS is greatly improved using the adaptive resonant frequency in AVIC, which is optimally estimated according to the variations of the distance measured by an HC-SR04 ultrasonic sensor.
In Figure 19a, the effect of the distance between the Tx and Rx coils on the power transfer capability of the WPTS is illustrated. It is obvious from Figure 19a that the proposed AVIC controller for closed loop adaptive frequency offers higher capability of power transfer compared to previous methods based on PID and HCC. For instance, at 2 cm distance between Tx and Rx, the AVIC controller transfers 92 W to the load, whereas the non-adaptive PID and HCC transfer 55 and 71 W, respectively. It is pertinent to mention that the constraint of maximum short circuit current of PVG should not be violated; otherwise, the normal operation of the PVG will be disturbed. From Figure 19b, it is obvious that the proposed AVIC controller does not violate the maximum short circuit DC current constraint of the PVG. Hence, the power transfer enhancement does not disturb the normal operation of the PVG. However, one drawback of the proposed method that can be observed from Figure 19b is that, beyond an 8 cm distance between the Tx and Rx coils, the DC current starts oscillating. This drawback is left for future research. In Table 9, a more detailed comparison is presented to show the relationship between the proposed adaptive resonant frequency controller (using AVIC) and load power at various loads.
Finally, the main objective of the proposed study was to enhance the efficiency of WPTS. The aim of this case study is to validate the efficiency of power transfer of the proposed controller under a variety of loads i.e., 7 Ω, 9 Ω, and 11 Ω. Therefore, the efficiency of the WPTS under the proposed AVIC controller is calculated and compared with conventional controllers such as non-adaptive PID and adaptive HCC. Simulations are run for the three previously mentioned loads and tested for each category, i.e., with MPPT and without MPPT. The results are illustrated in Figure 20, Figure 21 and Figure 22. To avoid redundancy, results of only 7 Ω load are discussed. In Figure 20a, it is evident that the efficiency of all of the controllers decline with the increase in distance. In the case of the PID control strategy, for a distance of 2 cm, the efficiency is as low as 36%, whereas the efficiency increases to 69% for adaptive HCC. However, in the case of AVIC, the efficiency reaches almost 93.39%. This shows that the proposed controller has successfully regulated the output voltage of the WPTS by implementing the adaptive virtual impedance controller. As shown in Figure 20b, by using the proposed controller the DC current ratio is close to unity (above 0.93 for all distances) compared to the PID controller and adaptive HCC, in which the DC current ratio drops to 0.7 and 0.1, respectively, for longer distances.

5. Conclusions

In this study, an adaptive virtual impedance controller (AVIC) was designed for a PVG-based WPTS. The proposed controller is characterized by the advanced features of coefficient of coupling estimator and adaptive resonant frequency. In addition, a modified incremental conductance based MPPT (MIC-MPPT) algorithm was developed and validated using hardware implementation. The simulation results verified that the proposed WPTS can transfer maximum power compared to conventional controllers, such as PID control and adaptive resonant frequency-based HCC controllers. It was verified that the proposed AVIC outperforms the conventional controllers with an efficiency of 93.39% and 0.95 pu DC current ratio, compared to the efficiency and DC current ratio of adaptive HCC, i.e., 69% and 0.75 pu, respectively. A detailed comparative analysis of AVIC with conventional controllers is presented in tables and graphs, and shows that the proposed controller enhances the efficiency of the WPTS to 1.353 times that of the adaptive HCC controller for a 2 cm distance between Tx and Rx coils. Moreover, for a distance of 12 cm, the efficiency is less than 20% for each of the three controllers; however, AVIC still outperforms the remaining controllers by improving the efficiency by 1537 times compared to adaptive HCC. Finally, for all of the examined distances between the Tx and Rx coils, the DC current ratio remains greater than 0.9 pu for AVIC, whereas for HCC and PID the DC current ratio at greater distances drops to 0.74 pu and 0.1 pu, respectively.

Author Contributions

Conceptualization, methodology, experiments, simulation, original draft preparation and proofreading, A.J.M. and S.F.; improving the article structure and review, W.T. All authors have read and agreed to the published version of the manuscript.

Funding

This research project is supported by National Natural Foundation of China (51977082) and the Fundamental Research Funds for the Central Universities.

Conflicts of Interest

The authors declare no conflict of interest.

References

  1. Fahad, S.; Goudarzi, A.; Xiang, J. Demand Management of Active Distribution Network using Coordination of Virtual Synchronous Generators. IEEE Trans. Sustain. Energy 2020. [Google Scholar] [CrossRef]
  2. Brown, W.C. The history of power transmission by radio waves. IEEE Trans. Microw. Theory Tech. 1984, 32, 1230–1242. [Google Scholar] [CrossRef] [Green Version]
  3. Liu, X.; Han, W.; Liu, C.; Pong, P.W.T. Marker-Free Coil-Misalignment Detection Approach Using TMR Sensor Array for Dynamic Wireless Charging of Electric Vehicles. IEEE Trans. Magn. 2018, 54, 1–5. [Google Scholar]
  4. ICNIRP. Gaps in Knowledge Relevant to the Guidelines for Limiting Exposure to Time-Varying Electric and Magnetic Fields (1 Hz–100 kHz) 2010. Health Phys. 2020, 118, 533–542. [Google Scholar] [CrossRef]
  5. Ibrahim, F.N.; Jamail, N.A.M.; Othman, N.A. Development of wireless electricity transmission through resonant coupling. In Proceedings of the 4th IET Clean Energy and Technology Conference (CEAT 2016), Kuala Lumpur, Malaysia, 14–15 November 2016. [Google Scholar]
  6. Rohith, T.; Samhitha, V.S.; Mamatha, I. Wireless transmission of solar power using inductive resonant principle. In Proceedings of the 2016 Biennial International Conference on Power and Energy Systems: Towards Sustainable Energy (PESTSE), Bangalore, India, 21–23 January 2016; pp. 1–6. [Google Scholar]
  7. Summerer, L.; Purcell, O. Concepts for Wireless Energy Transmission via Laser; Europeans Space Agency (ESA)-Advanced Concepts Team: Paris, France, 2009. [Google Scholar]
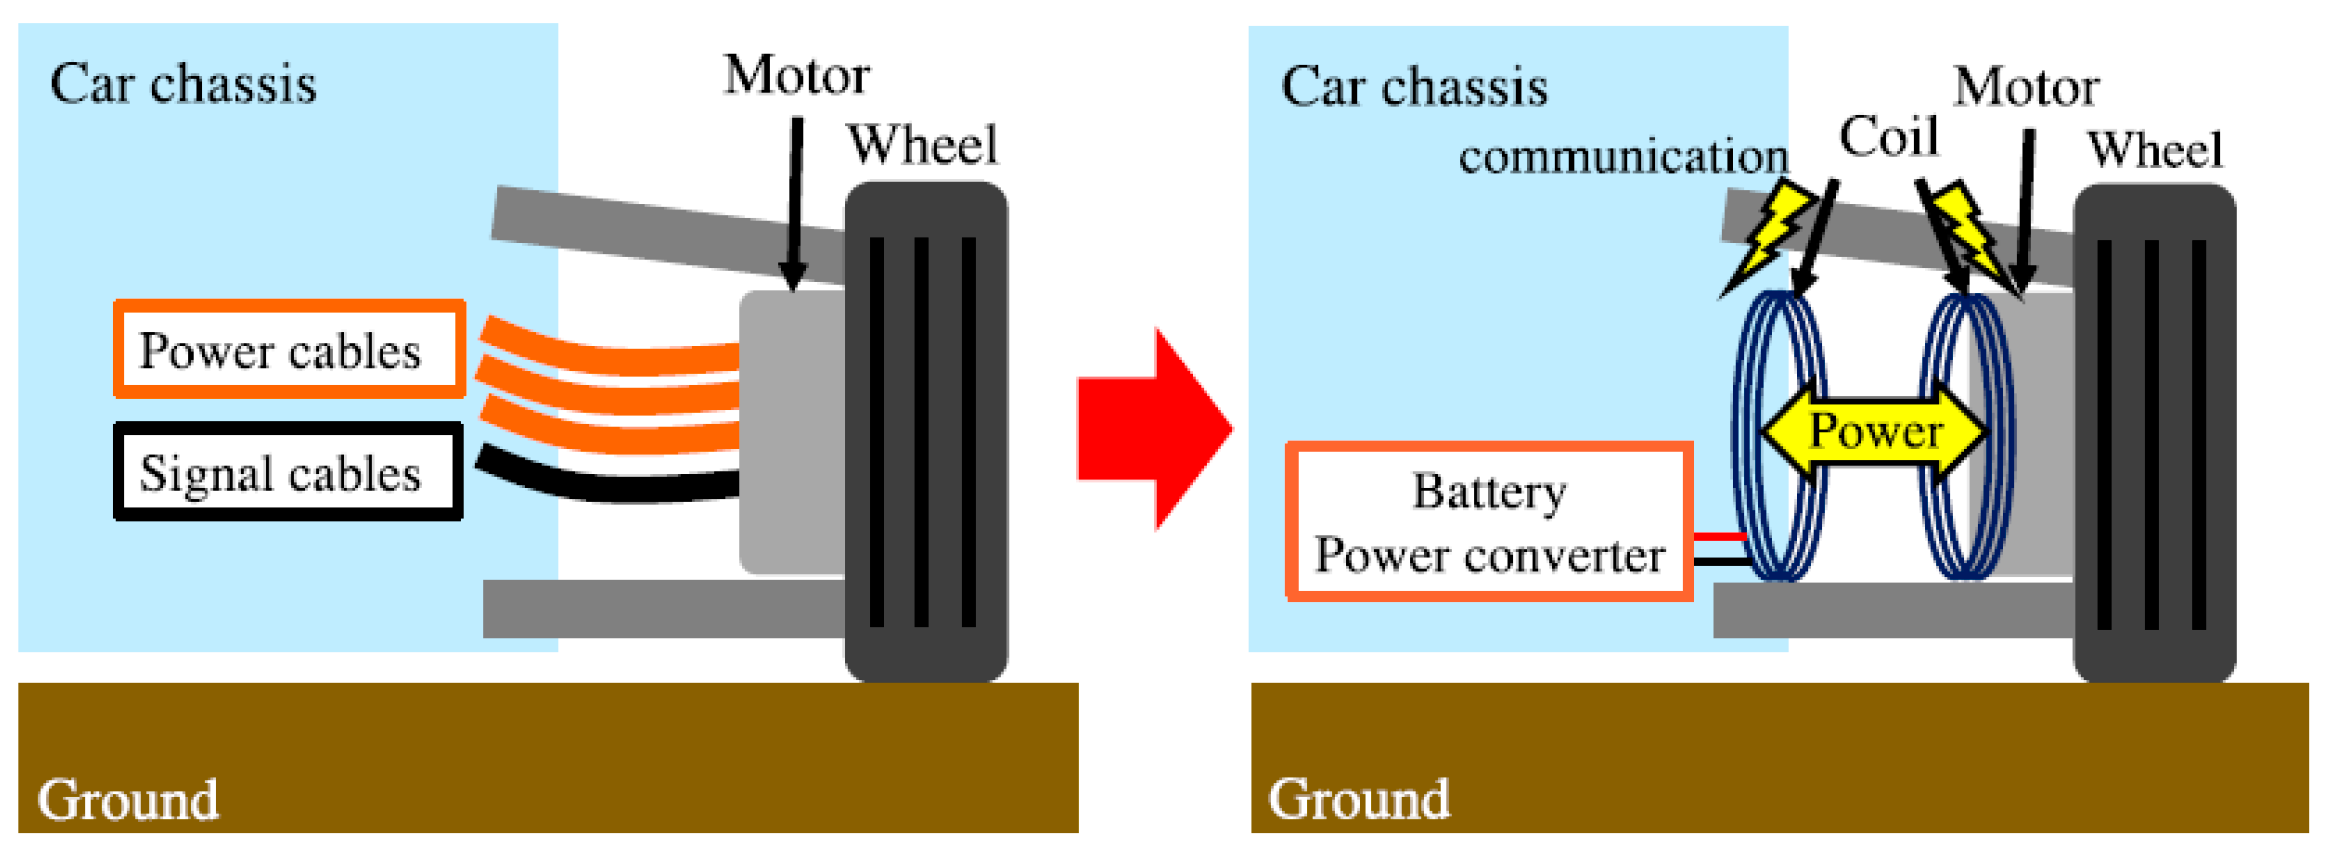
  8. Sato, M.; Yamamoto, G.; Gunji, D.; Imura, T.; Fujimoto, H. Development of Wireless In-Wheel Motor Using Magnetic Resonance Coupling. IEEE Trans. Power Electron. 2016, 31, 5270–5278. [Google Scholar] [CrossRef]
  9. Huang, Z.; Iam, I.W.; Hoi, I.U.; Lam, C.; Mak, P.; Martins, R.P. Self-Contained Solar-Powered Inductive Power Transfer System for Wireless Electric Vehicle Charging. In Proceedings of the 2019 IEEE PES Asia-Pacific Power and Energy Engineering Conference (APPEEC), Macao, China, 1–4 December 2019; pp. 1–6. [Google Scholar]
  10. Kaushik, B.P.; Reddy, I.T.; Svama, S.; KirthikaDevi, V.S. Wireless Power Transmission Incorporating Solar Energy as Source for Motoring Applications. In Proceedings of the 2018 International Conference on Emerging Trends and Innovations in Engineering and Technological Research (ICETIETR), Ernakulam, India, 11–13 July 2018; pp. 1–5. [Google Scholar]
  11. Minnaert, B.; Ravyts, S.; Driesen, J.; Stevens, N. Challenges for Wireless Power Transfer in Building-Integrated Photovoltaics. In Proceedings of the 2018 IEEE PELS Workshop on Emerging Technologies: Wireless Power Transfer (Wow), Montréal, QC, Canada, 3–7 June 2018; pp. 1–5. [Google Scholar]
  12. Narayanamoorthi, R. Modeling of Capacitive Resonant Wireless Power and Data Transfer to Deep Biomedical Implants. IEEE Trans. Compon. Packag. Manuf. Technol. 2019, 9, 1253–1263. [Google Scholar] [CrossRef]
  13. Pevere, A.; Petrella, R.; Mi, C.C.; Shijie, Z. Design of a high efficiency 22 kW wireless power transfer system for EVs fast contactless charging stations. In Proceedings of the 2014 IEEE International Electric Vehicle Conference, Florence, Italy, 17–19 December 2014. [Google Scholar]
  14. Kan, T.; Nguyen, T.; White, J.C.; Malhan, R.K.; Mi, C.C. A New Integration Method for an Electric Vehicle Wireless Charging System Using LCC Compensation Topology: Analysis and Design. IEEE Trans. Power Electron. 2017, 32, 1638–1650. [Google Scholar] [CrossRef]
  15. Nguyen, M.Q.; Woods, P.; Hughes, Z.; Seo, Y.; Rao, S.; Chiao, J. A mutual inductance approach for optimization of wireless energy transmission. In Proceedings of the Texas Symposium on Wireless and Microwave Circuits and Systems, Waco, TX, USA, 3–4 April 2014; pp. 1–4. [Google Scholar]
  16. Carloni, A.; Baronti, F.; Di Rienzo, R.; Roncella, R.; Saletti, R. Effect of the DC-Link Capacitor Size on the Wireless Inductive-Coupled Opportunity-Charging of a Drone Battery. Energies 2020, 13, 2621. [Google Scholar] [CrossRef]
  17. Zambari, I.F.; Hui, C.Y.; Mohamed, R. Development of Wireless Energy Transfer Module for Solar Energy Harvesting. Procedia Technol. 2013, 11, 882–894. [Google Scholar] [CrossRef] [Green Version]
  18. Yi, K. Output Voltage Analysis of Inductive Wireless Power Transfer with Series LC and LLC Resonance Operations Depending on Coupling Condition. Electronics 2020, 9, 592. [Google Scholar] [CrossRef] [Green Version]
  19. Fu, M.; Yin, H.; Zhu, X.; Ma, C. Analysis and Tracking of Optimal Load in Wireless Power Transfer Systems. IEEE Trans. Power Electron. 2015, 30, 3952–3963. [Google Scholar] [CrossRef]
  20. Zhong, W.; Hui, S.Y.R. Charging Time Control of Wireless Power Transfer Systems Without Using Mutual Coupling Information and Wireless Communication System. IEEE Trans. Ind. Electron. 2017, 64, 228–235. [Google Scholar] [CrossRef]
  21. Fahad, S.; Ullah, N.; Mahdi, A.J.; Ibeas, A.; Goudarzi, A. An Advanced Two-Stage Grid Connected PV System: A Fractional-Order Controller. Int. J. Renew. Energy Res. (IJRER) 2019, 9-1, 504–514. [Google Scholar]
  22. Krivchenkov, A.; Saltanovs, R. Increasing the Efficiency of the Wireless Charging System for Mobile Devices that Support Qi Standard. In Reliability and Statistics in Transportation and Communication; RelStat, Lecture Notes in Networks and Systems; Kabashkin, I., Yatskiv (Jackiva), I., Prentkovskis, O., Eds.; Springer: Cham, Switzerland, 2018; Volume 68. [Google Scholar]
  23. Fahad, S.; Mahdi, A.J.; Tang, W.H.; Huang, K.; Liu, Y. Particle Swarm Optimization Based DC-Link Voltage Control for Two Stage Grid Connected PV Inverter. In Proceedings of the 2018 International Conference on Power System Technology POWERCON, Guangzhou, China, 6–9 November 2018; pp. 2233–2241. [Google Scholar]
  24. Szlufcik, J.; Sivoththaman, S.; Nijs, J.; Mertens, R.; van Overstraeten, R. Low-cost industrial technologies of crystalline silicon solar cells. Proc. IEEE 1997, 85, 709–730. [Google Scholar] [CrossRef]
  25. Mostafa, M.R.; Saad, N.H.; El-sattar, A.A. Tracking the maximum power point of PV array by sliding mode control method. Ain Shams Eng. J. 2020, 11-1, 119–131. [Google Scholar] [CrossRef]
  26. Ned, M.; Tore, M.U.; William, P.R. Power Electronics; Converters and Design; John Wiley & Sons Inc.: Hoboken, NJ, USA, 1995; pp. 178–184. [Google Scholar]
  27. Choudhury, T.R.; Nayak, B.; Santra, S.B. Investigation of voltage stress on a single switch boost-fly-back integrated high gain converter with light load condition. Ain Shams Eng. J. 2019, 10-1, 217–226. [Google Scholar] [CrossRef]
  28. Ang, S.S.; Alejandro, O. Power Switching Converters, 3rd ed.; CRC Press INC: Boca Raton, FL, USA, 2011. [Google Scholar]
  29. Maniktala, S. Switching Power Supplies A-Z, 2nd ed.; Elsevier Inc.: Amsterdam, The Netherlands, 2012. [Google Scholar]
  30. Rahman, S.; Ahmed, O.; Islam, M.S.; Awal, A.H.M.R.; Islam, M.S. Design and Construction of Wireless Power Transfer System Using Magnetic Resonant Coupling. Am. J. Electromagn. Appl. 2014, 2, 11–15. [Google Scholar]
  31. Liu, X.; Xia, C.; Yuan, X. Study of the Circular Flat Spiral Coil Structure Effect on Wireless Power Transfer System Performance. Energies 2018, 11, 2875. [Google Scholar] [CrossRef] [Green Version]
Figure 1. Comparison between classical wired and wireless interior wheel motor (IWM) [8].
Electronics 09 01648 g001
Figure 2. Block diagram of the proposed wireless power transmission system (WPTS) with its controllers.
Electronics 09 01648 g002
Figure 3. SIMULINK model of the photovoltaic (PV) panel.
Electronics 09 01648 g003
Figure 4. Power and control diagram of a photovoltaic generator (PVG) connected to a boost converter.
Electronics 09 01648 g004
Figure 5. Pseudo code of the implemented maximum power tracking (MPPT) algorithm.
Electronics 09 01648 g005
Figure 6. The model and the prototype of the boost converter: (a) SIMULINK model, (b) experimental prototype.
Electronics 09 01648 g006
Figure 7. Cross-sectional shape of a circular flat spiral coil.
Electronics 09 01648 g007
Figure 8. Schematic of the proposed WPT circuit.
Electronics 09 01648 g008
Figure 9. Experimental prototype for estimating coefficient of coupling.
Electronics 09 01648 g009
Figure 10. Open-loop SIMULINK model for estimating K(d) based on practical tests.
Electronics 09 01648 g010
Figure 11. Receiving end voltage waveform at distance of 6 cm: (a) practical voltage waveform, (b) simulation voltage waveform.
Electronics 09 01648 g011
Figure 12. Practical coefficient of coupling.
Electronics 09 01648 g012
Figure 13. Equivalent WPTS.
Electronics 09 01648 g013
Figure 14. WPT equivalent circuit.
Electronics 09 01648 g014
Figure 15. Optimal adaptation factor versus distance.
Electronics 09 01648 g015
Figure 16. Adaptive virtual impedance controller.
Electronics 09 01648 g016
Figure 17. SIMULINK model of the proposed WPTS based on practical design.
Electronics 09 01648 g017
Figure 18. Power transfer (with and without MPPT) for various loads: (a) load = 9 Ω, (b) load = 7 Ω, (c) load = 5 Ω.
Electronics 09 01648 g018
Figure 19. Comparison among three controllers under various distances and at 893 W/m2: (a) power transfer capability, (b) DC current reference tracking.
Electronics 09 01648 g019
Figure 20. Performance evaluation at load of 7 Ω: (a) efficiency vs. distance, (b) current ratio vs. distance.
Electronics 09 01648 g020
Figure 21. Performance evaluation at load of 9 Ω: (a) efficiency vs. distance, (b) current ratio vs. distance.
Electronics 09 01648 g021
Figure 22. Performance evaluation at load of 11 Ω: (a) efficiency vs. distance, (b) current ratio vs. distance.
Electronics 09 01648 g022
Table 1. Photovoltaic (PV) panel characteristics.
PV TypeMonocrystallineMaximum Power at STC130 W
Open-circuit voltage21.6 VShort-circuit current7.94 A
Voltage at MPP18.0 VCurrent at MPP7.22 A
Table 2. Verification of Equations (1) and (2).
Irradiance Factor (pu)Optimal Resistance (W)Exact Current (A)Approximate Current (A)
1.02.4937.1657.220
0.83.1165.6745.776
0.64.1554.1974.332
0.46.2332.7412.888
0.212.4651.3191.444
Table 3. Main components of the proposed wireless power transmission (WPT) H-bridge circuit.
ComponentValue/Name
C1 and C2680 nF
RL and RC10 mΩ
L1 and L27.35 µH
Ron2 mΩ
Diode1N4007
Power MOSFETIRF540N
Square Wave GeneratorNE555
Gate Driver ICIR2110
Not Gate IC74LS04 TTL IC
5 V Voltage RegulatorLM7805
Table 4. Comparison between practical and simulation receiving RMS voltage.
Distance
(cm)
Optimal
Coefficient of
Coupling
Practical
RMS Receiving
Voltage (V)
Simulation
RMS Receiving
Voltage (V)
Error of
Voltage (%)
20.74749.209.301.10
30.566210.1010.211.09
40.429610.2110.432.15
50.32879.569.792.41
60.25578.438.66 2.73
70.20387.247.452.90
80.16776.226.413.05
90.10275.435.592.94
100.12514.844.982.89
110.11224.384.512.96
120.10184.004.133.25
Table 5. Coefficients of Equation (11).
k01.287k1−0.341
k20.04005k3−0.002352
k46.678 × 10−5k5−7.271 × 10⁻⁷
Table 6. Coefficients of Equation (24).
f0−0.299f10.4990
f2−0.115f30.0135
f4−7.79 × 10⁻⁴f51.76 × 10−5
Table 7. Parameters of the complete WPTS.
PVG Power at STC130 WBoost Inductor500 µH
Boost Capacitor1000 µFResonance Capacitors680 nF
Resonance Inductors7.35 µHLoad Resistance(7, 9, 11) Ω
Table 8. Experimental results for verifying the MPPT algorithm.
Irradiance of 723 W/m2
Load (Ω)MPPT ControllerPV Power (W)DC Power (W)Efficiency (%)
5Without68.062.166.1
With75.268.591.1
7Without51.848.151.2
With89.381.991.7
9Without41.539.041.5
With89.582.892.5
Irradiance of 893 W/m2
Load (Ω)MPPT ControllerPV Power (W)DC Power (W)Efficiency (%)
5Without72.366.156.9
With112.7101.289.8
7Without54.350.543.5
With113.1103.191.2
9Without43.340.735.1
With113.2104.292.1
Table 9. Comparative analysis between proportional integral derivative (PID), adaptive hysteresis-based current control (HCC), and adaptive virtual impedance controller (AVIC).
Distance
(cm)
Control
Strategy
Resonant
Frequency (kHz)
Load
Power (W)
DC Current
(A)
2PID50.00
51.00
552.05
Adaptive HCC712.58
AVIC53.70923.37
4PID50.00
56.00
170.78
Adaptive HCC431.89
AVIC59.10783.36
6PID50.00
60.00
60.41
Adaptive HCC342.05
AVIC61.90533.22
8PID50.00
61.00
2.50.30
Adaptive HCC181.68
AVIC63.26343.13
10PID50.00
62.00
1.40.26
Adaptive HCC131.89
AVIC63.78223.10
12PID50.00
63.00
10.25
Adaptive HCC122.35
AVIC64.10163.10

