Article

Exploring the Effects of Scale and Color Differences on Users’ Perception for Everyday Mixed Reality (MR) Experience: Toward Comparative Analysis Using MR Devices

1
Department of Digital Contents Engineering, Wonkwang University, Iksan 54538, Korea
2
Electronics and Telecommunications Research Institute (ETRI), Daejeon 34129, Korea
3
Division of Applied Mathematics, Wonkwang University, Iksan 54538, Korea
*
Author to whom correspondence should be addressed.
Electronics 2020, 9(10), 1623; https://doi.org/10.3390/electronics9101623
Submission received: 31 August 2020 / Revised: 21 September 2020 / Accepted: 28 September 2020 / Published: 2 October 2020
(This article belongs to the Special Issue LifeXR: Concepts, Technology and Design for Everyday XR)

Abstract

:
With continued technological innovations in the fields of mixed reality (MR), wearable type MR devices, such as head-mounted display (HMD), have been released and are frequently used in various fields, such as entertainment, training, education, and shopping. However, because each product has different parts and specifications in terms of design and manufacturing process, users feel that the virtual objects overlaying real environments in MR are visualized differently, depending on the scale and color used by the MR device. In this paper, we compare the effect of scale and color parameters on users’ perceptions in using different types of MR devices to improve their MR experiences in real life. We conducted two experiments (scale and color), and our experimental study showed that the subjects who participated in the scale perception experiment clearly tended to underestimate virtual objects, in comparison with real objects, and overestimated color in MR environments.

1. Introduction

Recently, mixed reality (MR) has received significant attention as a key technology for entertainment, training, education, games, and shopping, because it has the potential to make real spaces smarter and more interactive by adding context-aware information of our everyday lives [1,2]. MR helps people use augmented virtual objects by spatially registering useful information in the direction of improving the perception of real places, and it offers various situations in which users can visualize and interact to improve their experience and performance in completing actual tasks in everyday spaces [3]. Additionally, MR head-mounted display (HMD) devices (e.g., a helmet-type head-mounted display) are a major class of new instruments in scientific research and engineering applications for visualization. Nonetheless, MR devices for the user’s experience are heavy, and their viewing angle is relatively narrow compared with the human viewing angle [4]. Moreover, because each MR device has different design configurations and specifications in terms of their parts, people often differently perceive the same virtual object, depending on the MR device used [5,6]. In this line of thinking, Kruijff et al. presented perceptual issues in augmented reality and provided predominant issues for specific devices, such as the head-worn display, the handheld mobile device, and the projector–camera system [6].
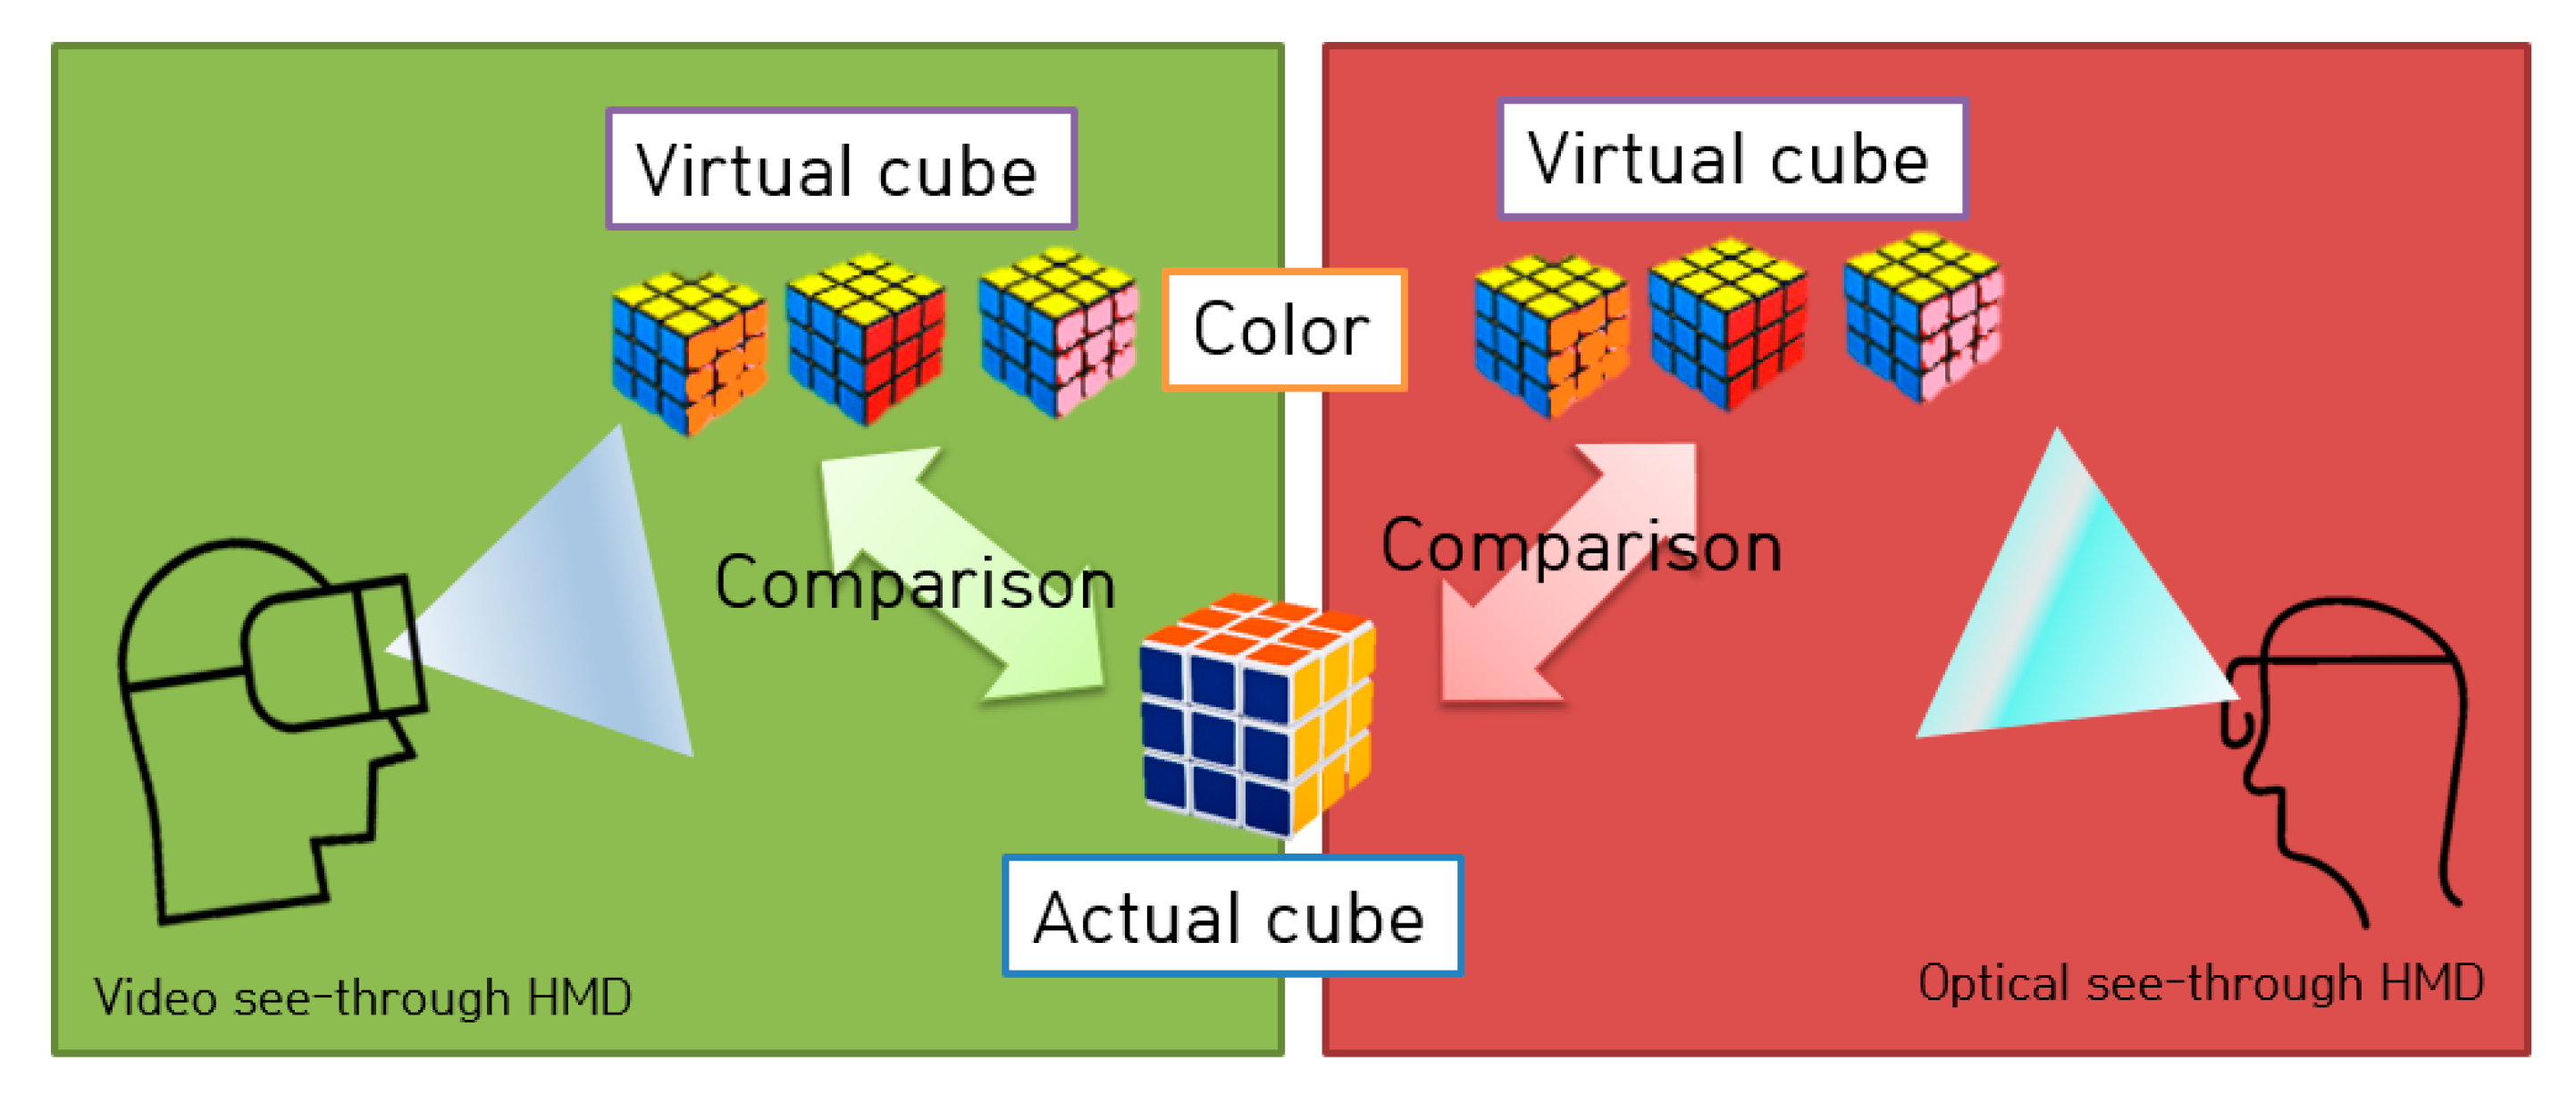
Therefore, it is necessary to resolve visual differences between different MR devices to obtain mixing consistency (i.e., a perceived coherence between virtual and real objects). For example, imagine a situation where a user is wearing a helmet-type MR device. When the user sees a computer-generated virtual cube that looks like a real cube, he or she recognizes the scale and color of that cube differently, depending on the MR device used (see Figure 1). Note that the cubic puzzle with the same size and color on each side was used in our experiment to compare shape and color differences. Thus, consistency between different MR devices in the perceived scale and color of virtual objects will need to be established.
Table 1 shows the parameters that affect users’ perceptions in a typical MR environment. To begin with, it should be noted that we referred to related research works to define which factors would affect users’ perceptions [7,8,9]. In our paper, we divided the parameters that affect users’ perceptions in an MR environment, such as color, scale, naturalness, visibility, and readability, into three groups: device, environment, and virtual object characteristics. Firstly, the device characteristics were related to issues concerning different specifications (e.g., the field of view and brightness). Secondly, the environment parameters, such as lighting conditions, refer to elements affecting the MR environment in real spaces. Lastly, the virtual object characteristics were related to how a computer-generated virtual object was represented, such as its texture quality and viewing setting, which was presented to the user looking at the virtual object. Table 1 shows newly configured perception issues with Figure 2 and the work of Kruijff et al. for our experimental design.
Using these parameters, our paper focuses on the device characteristics in terms of display type (e.g., video or optical see-through head-mounted display) to measure users’ perceptions (e.g., scale and color), and the remaining parameters were used as control variables in our evaluation. It should be noted that the video see-through head-mounted display (HMD) is based on stereoscopic visualization, which allows a dual webcam module to be attached to an immersive HMD display and have two image sources (i.e., the real world and the computer-generated world). On the other hand, the optical see-through HMD is a device that has the capability of mixing virtual objects and allowing the user to see through them, and it has only one image source (i.e., the computer-generated world) [10]. Thus, as the first step shown in Table 1, this paper proposes a novel method for evaluating users’ perceptions of virtual objects by using heterogeneous MR devices to improve the MR experience. Specifically, we explore the correlation in visual perception between real and virtual objects when using MR devices. To find the relationship between two different objects in users’ perceptions, we ran comparative experiments to assess users’ perceptions in terms of, for example, the effects of the scale and color differences when using various MR devices. People who participated in the scale perception experiment thought the large virtual object was equal to the small real object and tended to both perceive the virtual object as small and underestimate the virtual object. Subjects in the color perception experiment tended to overestimate virtual objects. For example, people thought the higher red color of the virtual object was equal to the lower red one of the actual object. Our study allowed different MR devices to induce the same user experience by providing consistency related to the dynamic range of the device-dependent virtual object (e.g., in terms of scale and color).
The remainder of our paper is organized as follows: Section 2 discusses works related to our paper. Section 3 provides details of the proposed experiment involving scale perception and different MR devices and discusses the results. Section 4 provides an experimental evaluation of color perception and the main findings. Finally, in Section 5, we summarize our results and contributions and conclude with directions for future research.

2. Related Works

We outline three areas of research that are directly related to the main theme of this work (i.e., MR devices, users’ perceptions in LifeXR environments, and MR consistency).
MR devices are mixed reality (MR) devices, which are visualization platforms that merge real and virtual worlds. Virtual objects overlay a real environment in MR and thus give users additional information [11]. Most previous works have mainly used smart phones to provide images that synthesize real and virtual environments, but they did not consider the presentation of synthesized images directly to the human eye. More recently, MR devices with helmet-type HMDs that synthesize spatially registered virtual objects overlaying a user’s view have been introduced. As already mentioned, MR devices are mainly divided into optical and video see-through HMDs, depending on whether actual images are viewed directly by the user or via a video input. We are interested in how the scale and color of different types of HMDs affect users’ perceptions. No comprehensive work has been done in connection with this.
Concerning users’ perceptions in XR environments, given the availability of immersive environments using XR (i.e., VR, AR, and MR) technologies, it has become possible for users to experience virtual objects as if they were real [12]. Therefore, many researchers have considered users’ perceptions when using these technologies in order to evaluate the sense of presence and emotional response that they experience when interacting with virtual objects in XR environments [13]. There have been a few attempts to evaluate users’ perceptions, which were conducted using questionnaires and by monitoring physiological signals, such as heart rate and skin conductance [14,15]. As a result of representative research, Diaz et al. proposed depth perception in augmented reality as a function of the virtual object design. In their studies, they found that participants underestimated the depth and rendering of virtual objects, which influenced their perception of the objects’ spatial positions [16]. Additionally, Baumeister et al. investigated and showed results concerning the cognitive load imposed on users by MR devices, comparing different types of augmented reality displays (e.g., a projection-based spatial augmented reality, optical see-through HMD, and video see-through HMD). The results showed that spatial augmented reality helped to reduce cognitive load [17]. Our work was designed to further the research of these two pioneering works by proposing a virtual object-level comparison in terms of scale and color differences, comparing actual and virtual objects in relation to two forms of HMD.
For MR consistency, another related trend is the use of illumination and rendering techniques to make the appearance of virtual objects consistent and thus achieve a coherent MR [18]. Rohmer et al. proposed a photorealistic, high-quality MR framework, with compensated differential rendering and shadows to illuminate virtual objects and make them consistent with real objects [19]. They described photorealistic rendering with consistent appearance of virtual objects by light simulation to compute the appearance of virtual objects in a real environment. Rhee et al. presented a novel immersive system that provided composite, optimized 3D virtual objects with a lighting source, which allowed them to create a live 360° video and thus illuminate virtual objects [20]. In addition, Menk and Koch suggested an interactive visualization technique which is able to equally perceive as the real, desired colors for spatial MR [21]. They used the approach to compute the influences of elements such as the ambient light and color model of the projector. For our research, some of these concepts were used, but they were modified for the purpose of compensating for users’ perceptions.

3. Experiment 1: Scale Perception

So far, we have described our motivation for investigating the effects of scale and color conflicts on users’ perceptions when using heterogeneous MR devices and related works on MR devices, as well as users’ perceptions in XR environments, in terms of MR consistency. In this section, we present our experiments and the results concerning the differences in users’ perceptions when using different MR devices that are caused by the degree of scale (e.g., optical see-through HMD vs. video see-through HMD) in the defined experiment below.

3.1. Overview of Experimental Design

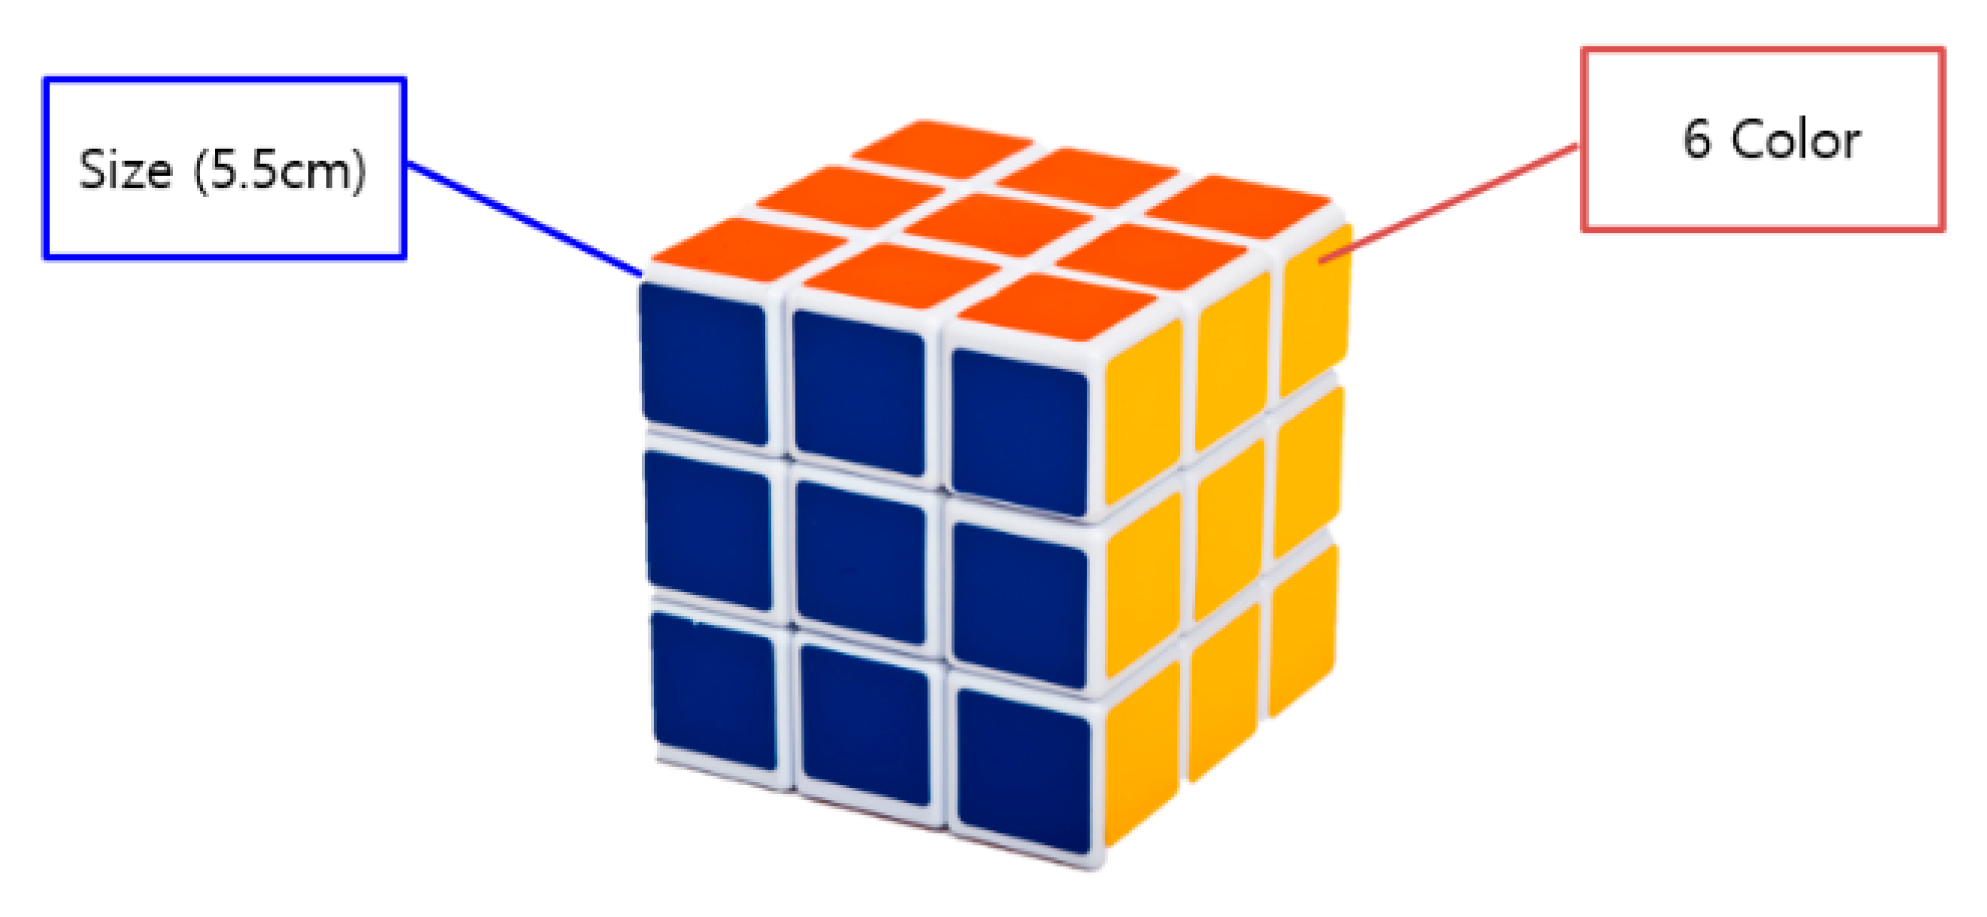
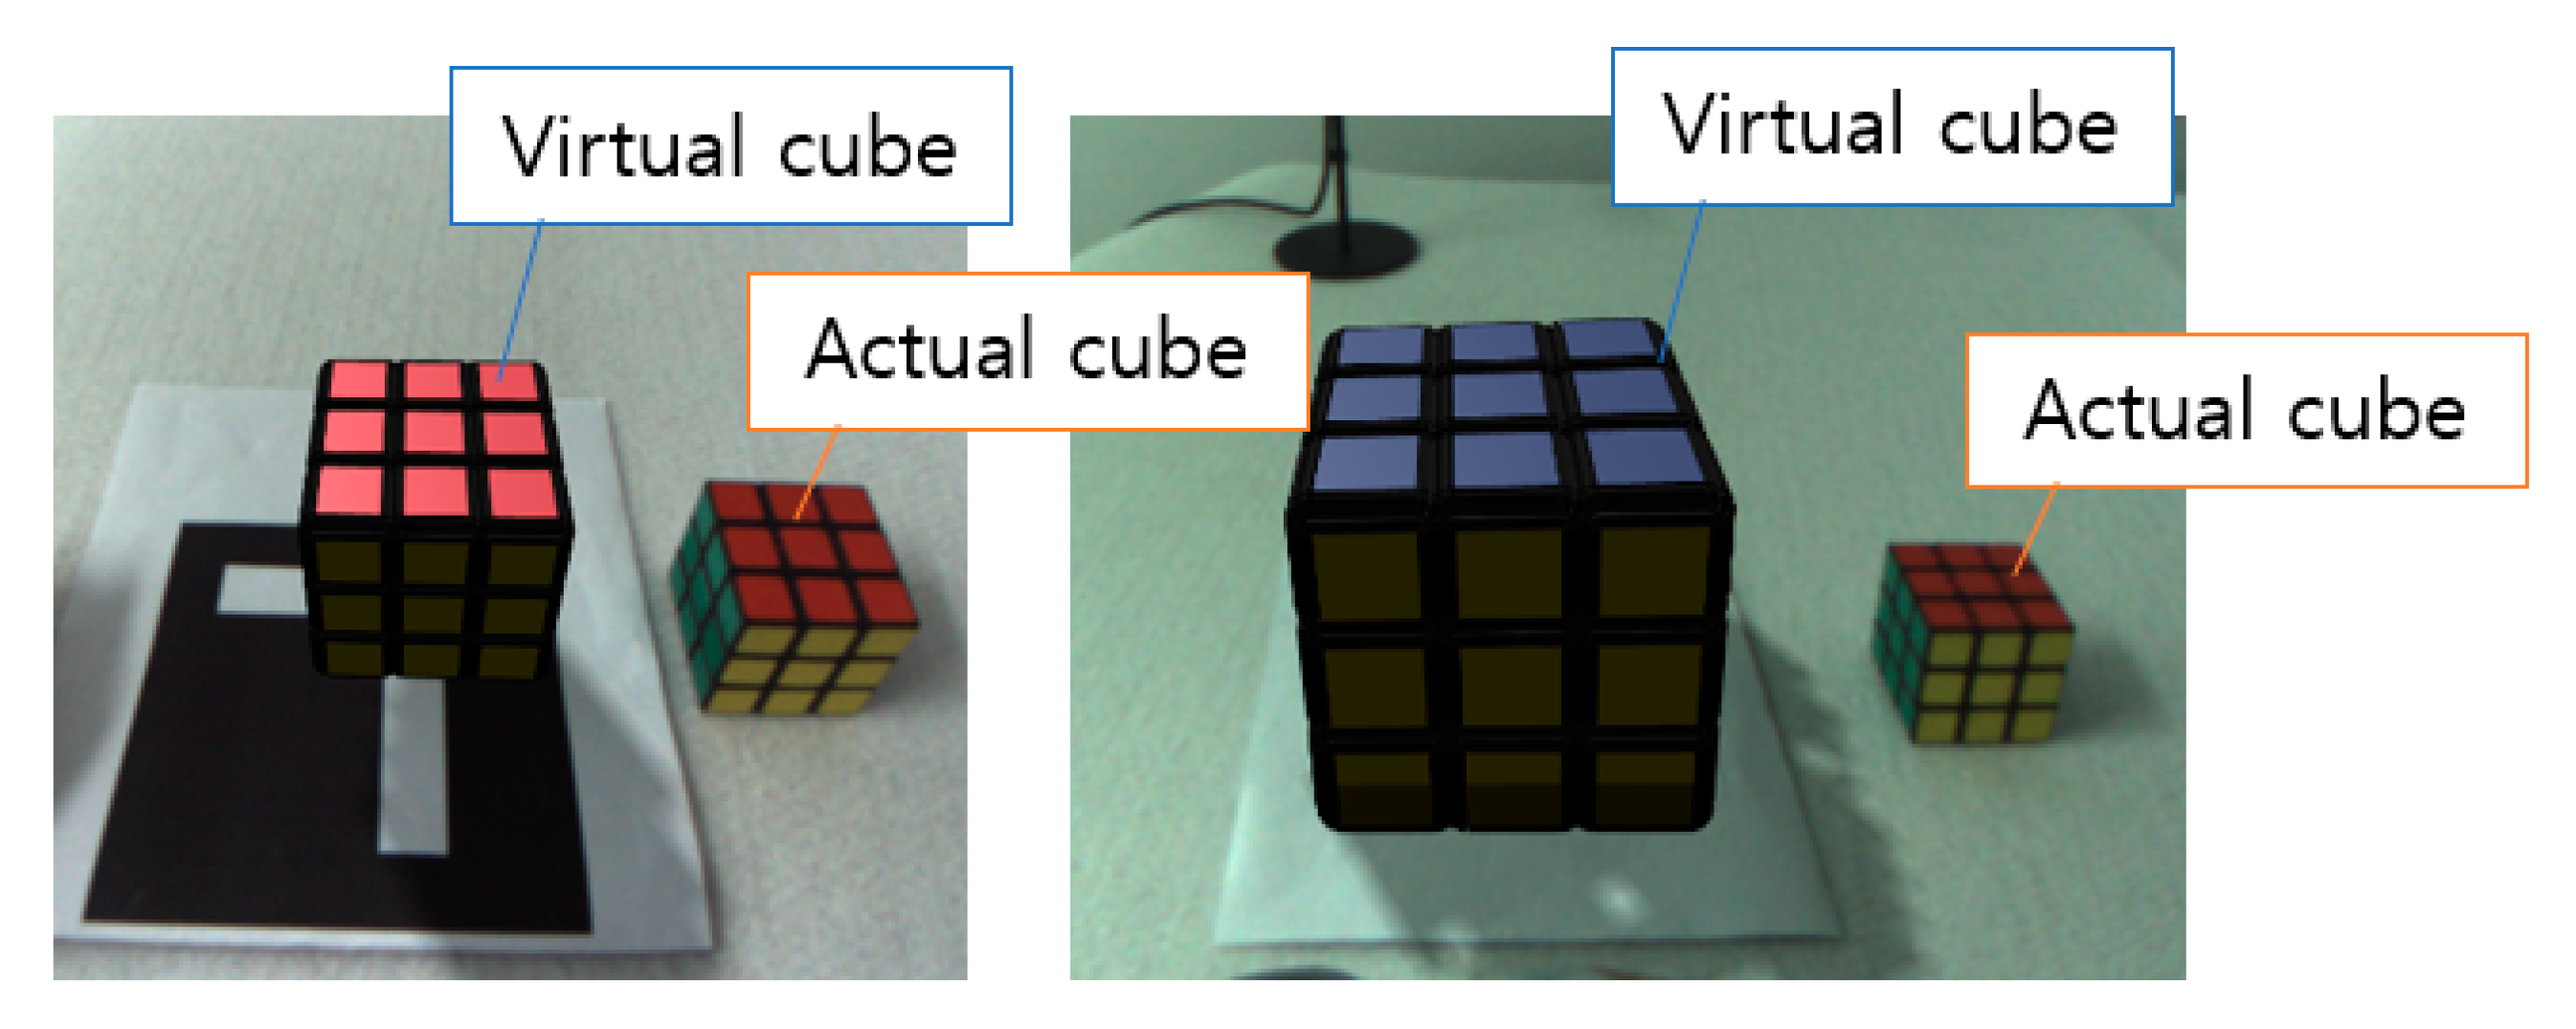
In the experiment, as MR devices, we compared a video see-through HMD and an optical see-through HMD, in terms of users’ perceptions (e.g., their sense of scale in relation to virtual objects) (see Figure 2). In the experiment, to assess users’ scale perceptions, participants were permitted to adjust the size of a virtual cubic puzzle, which was briefly called a cube, and select the same size as the actual puzzle. Then, we compared different types of HMDs in relation to users’ scale perceptions. It should be noted that we assumed that the users had different senses of scale, depending on the HMD used. Figure 3 shows the actual cubic puzzle used in the scale comparison experiment. It was 5.5 cm in size and had different colors on each side, with six colors in total.
Figure 4 shows our system configuration for the experiment. A participant in our experiment was seated in a chair in front of a desk. Then, the subject wore an MR head-mounted display (HMD) to view the virtual cube and compare it with the real cube.
The main factor was the scale value of the virtual cube, and two test conditions (video vs. optical) were employed. We also included the variable of the distance between the participant and the cube. Figure 5 shows the two test conditions, including the video and optical see-through HMD. As already mentioned, the video see-through HMD had a dual webcam module attached, which allowed the user to visualize the virtual cube, and the optical see-through HMD, which allowed the user to integrate the virtual cube into reality since the device was semi-transparent. In our experiment, we used a Microsoft HoloLens for the optical see-through HMD and an Oculus Rift and OVRVision stereo camera set for the video see-through HMD (see Figure 5).

3.2. Experimental Set-Up for Scale Perception

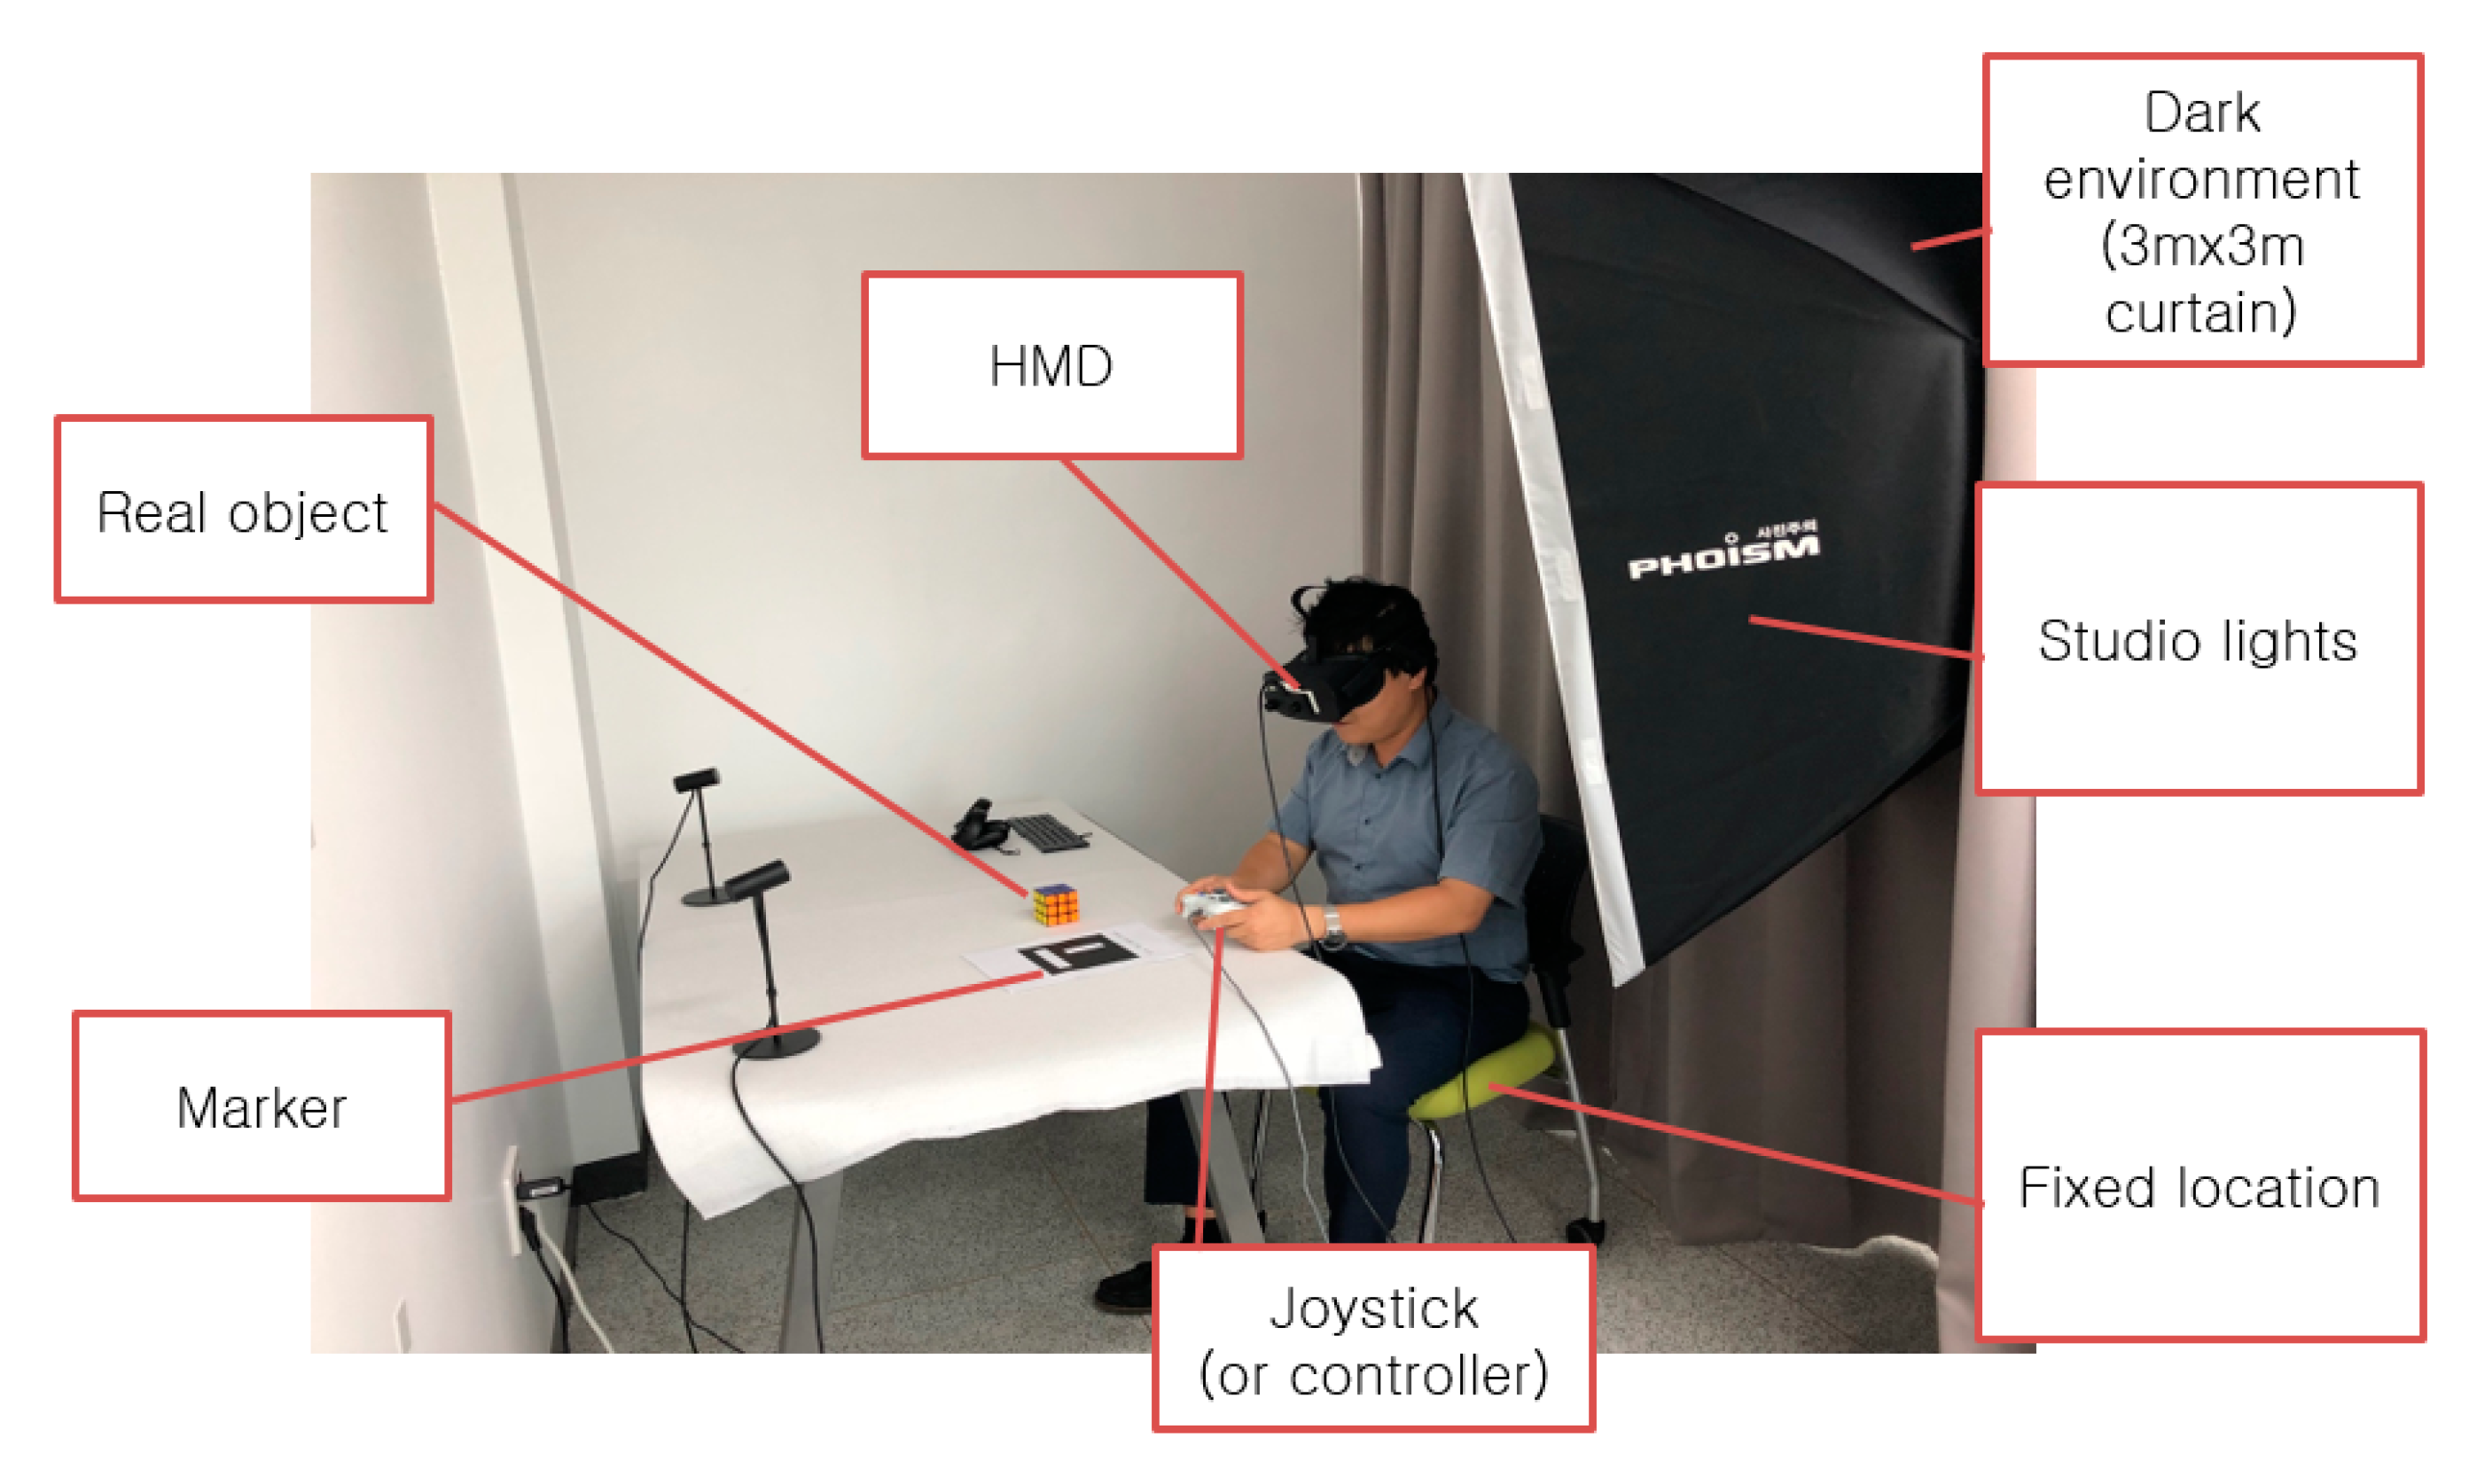
As mentioned earlier in the overview of the experimental design, in order to evaluate users’ scale perceptions when using heterogeneous MR devices, we compared the scale difference between two HMDs (video vs. optical see-through HMDs). To set up this experiment, first of all, the geometrically aligned process of fundamental parameters, such as the FOV (field of view), disparity, and distortion of the HMD, was performed. The step toward aligning and calibrating video and virtual spaces was established with a protractor placed in front of the nodal point of the camera lens [22]. Then, we installed an experimental environment that consisted of the HMD, a real object (e.g., an actual cube), and a fiducial MR marker for registration of the virtual cube (see Figure 6). As for the test conditions, a 3D virtual cube with the same shape as the real cube was constructed using Unity3D and appeared at the same time in a given MR environment.

3.3. Experimental Task and Procedure

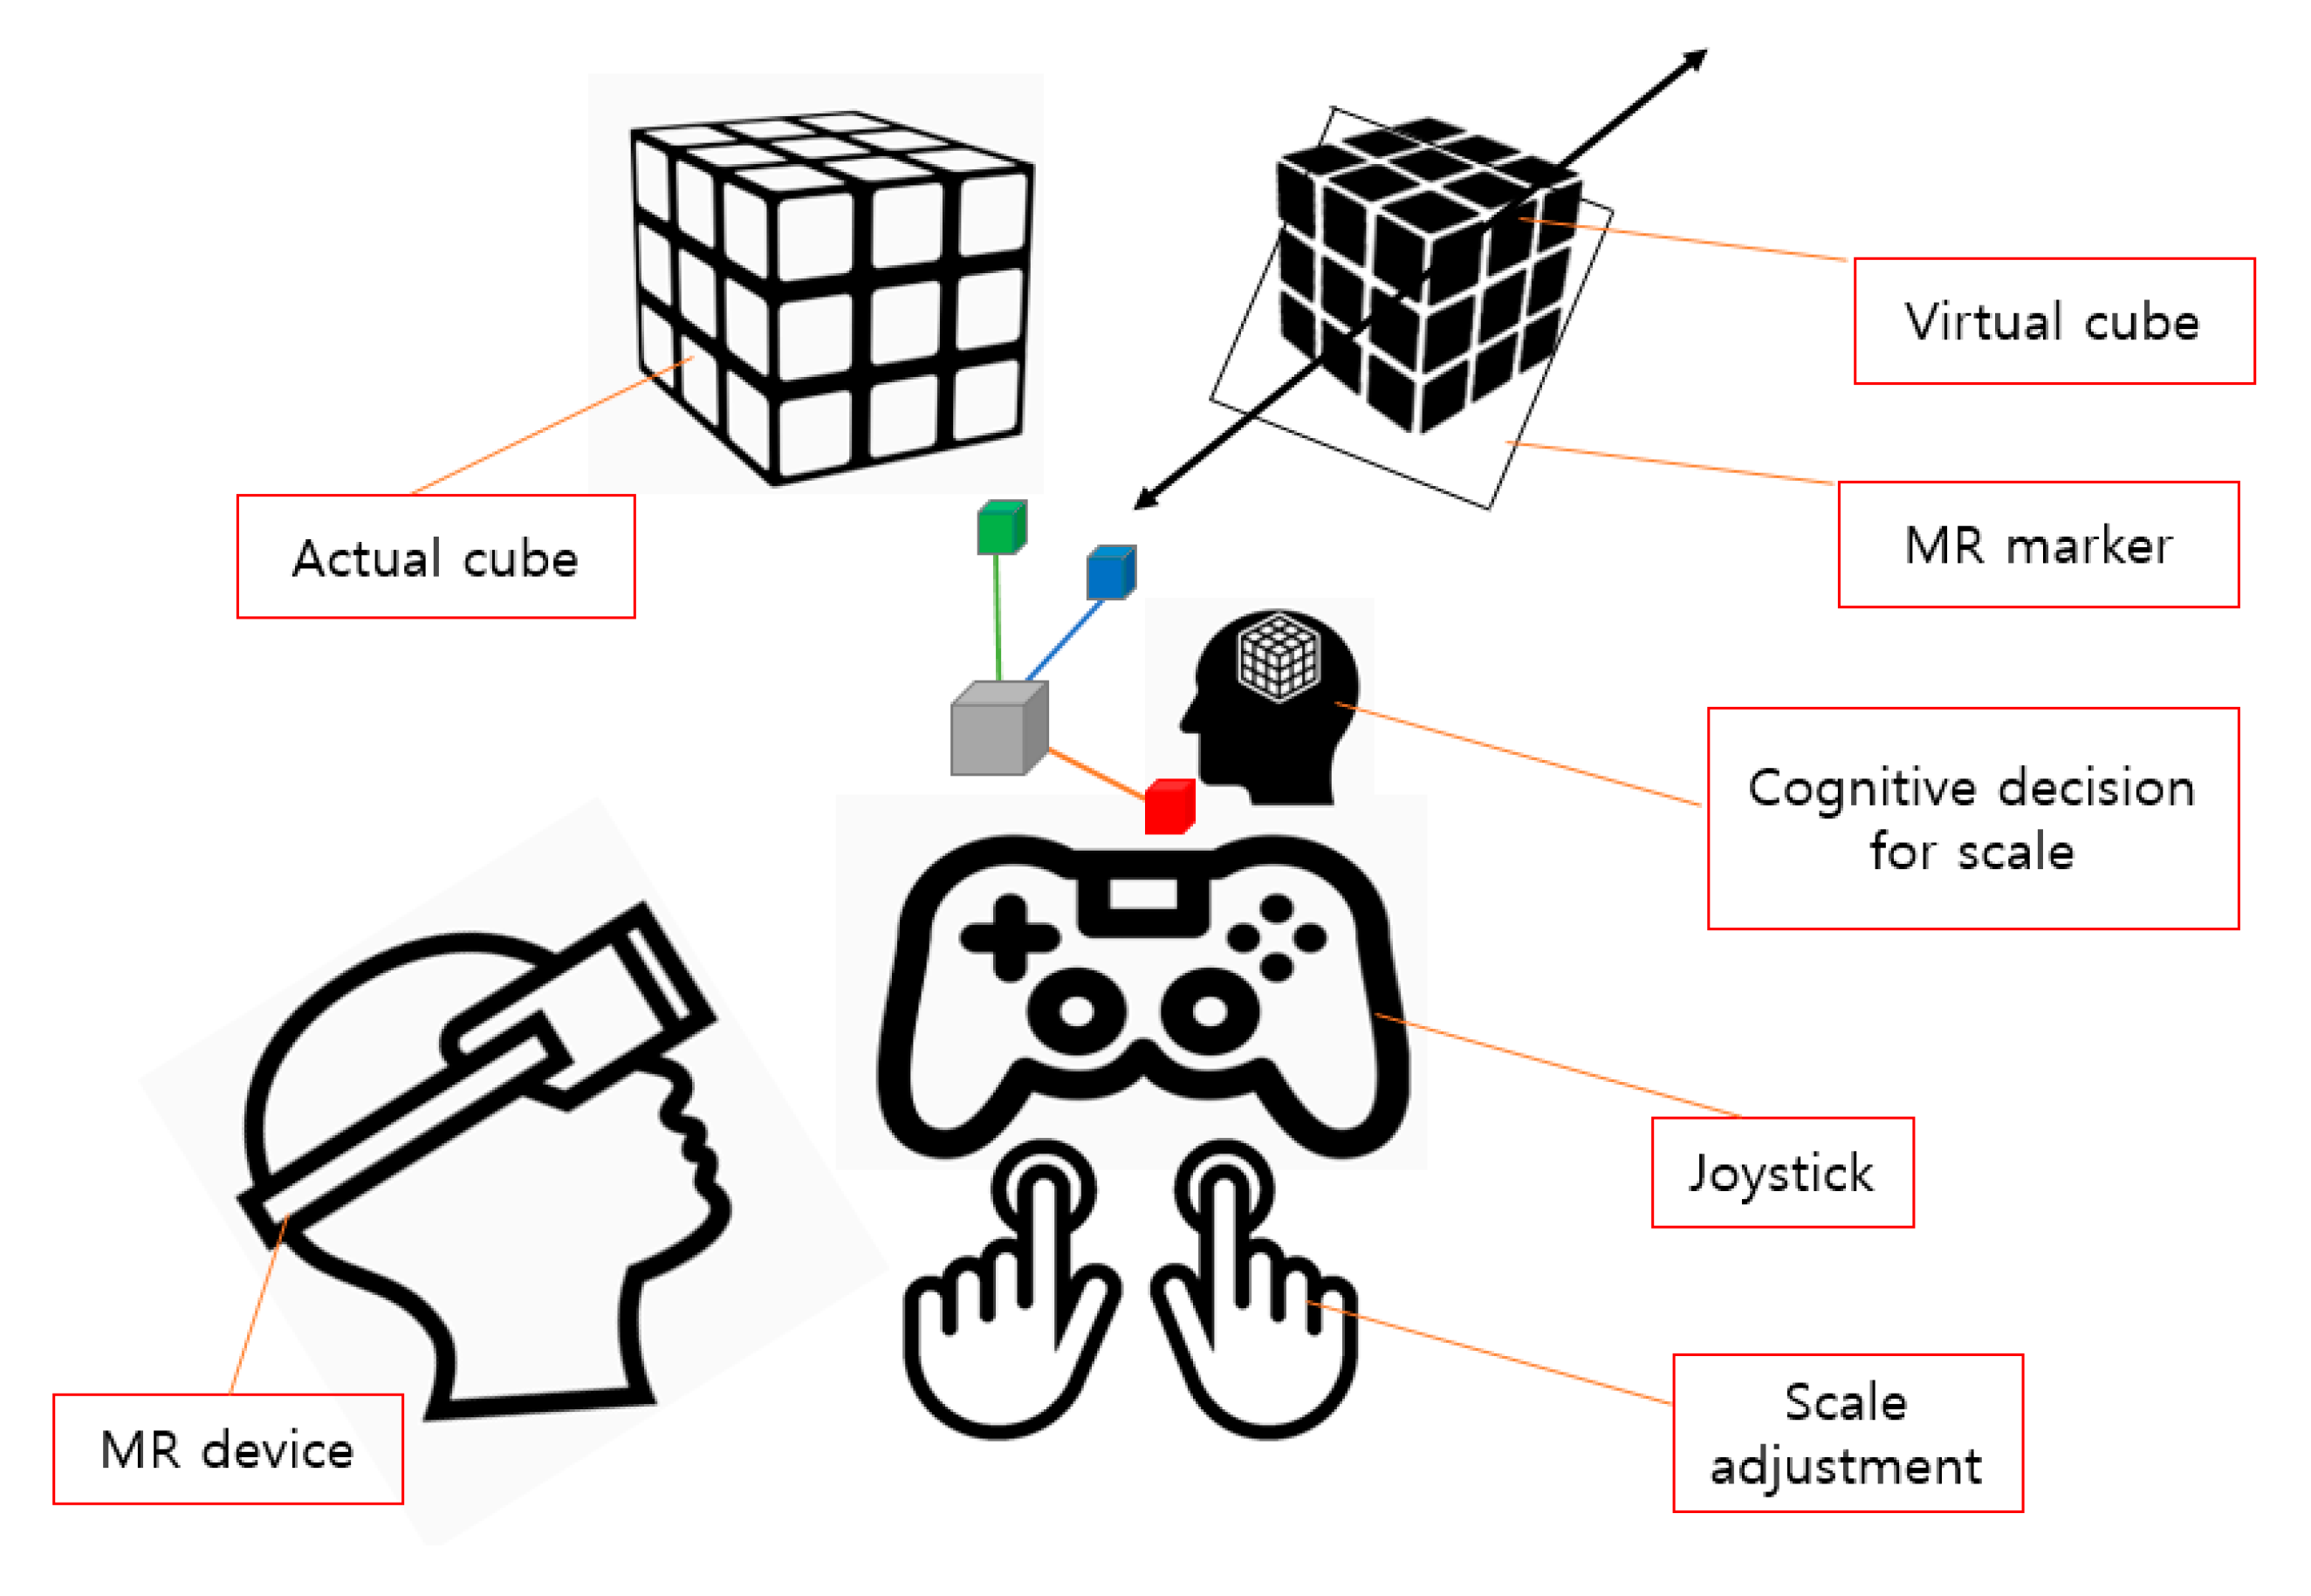
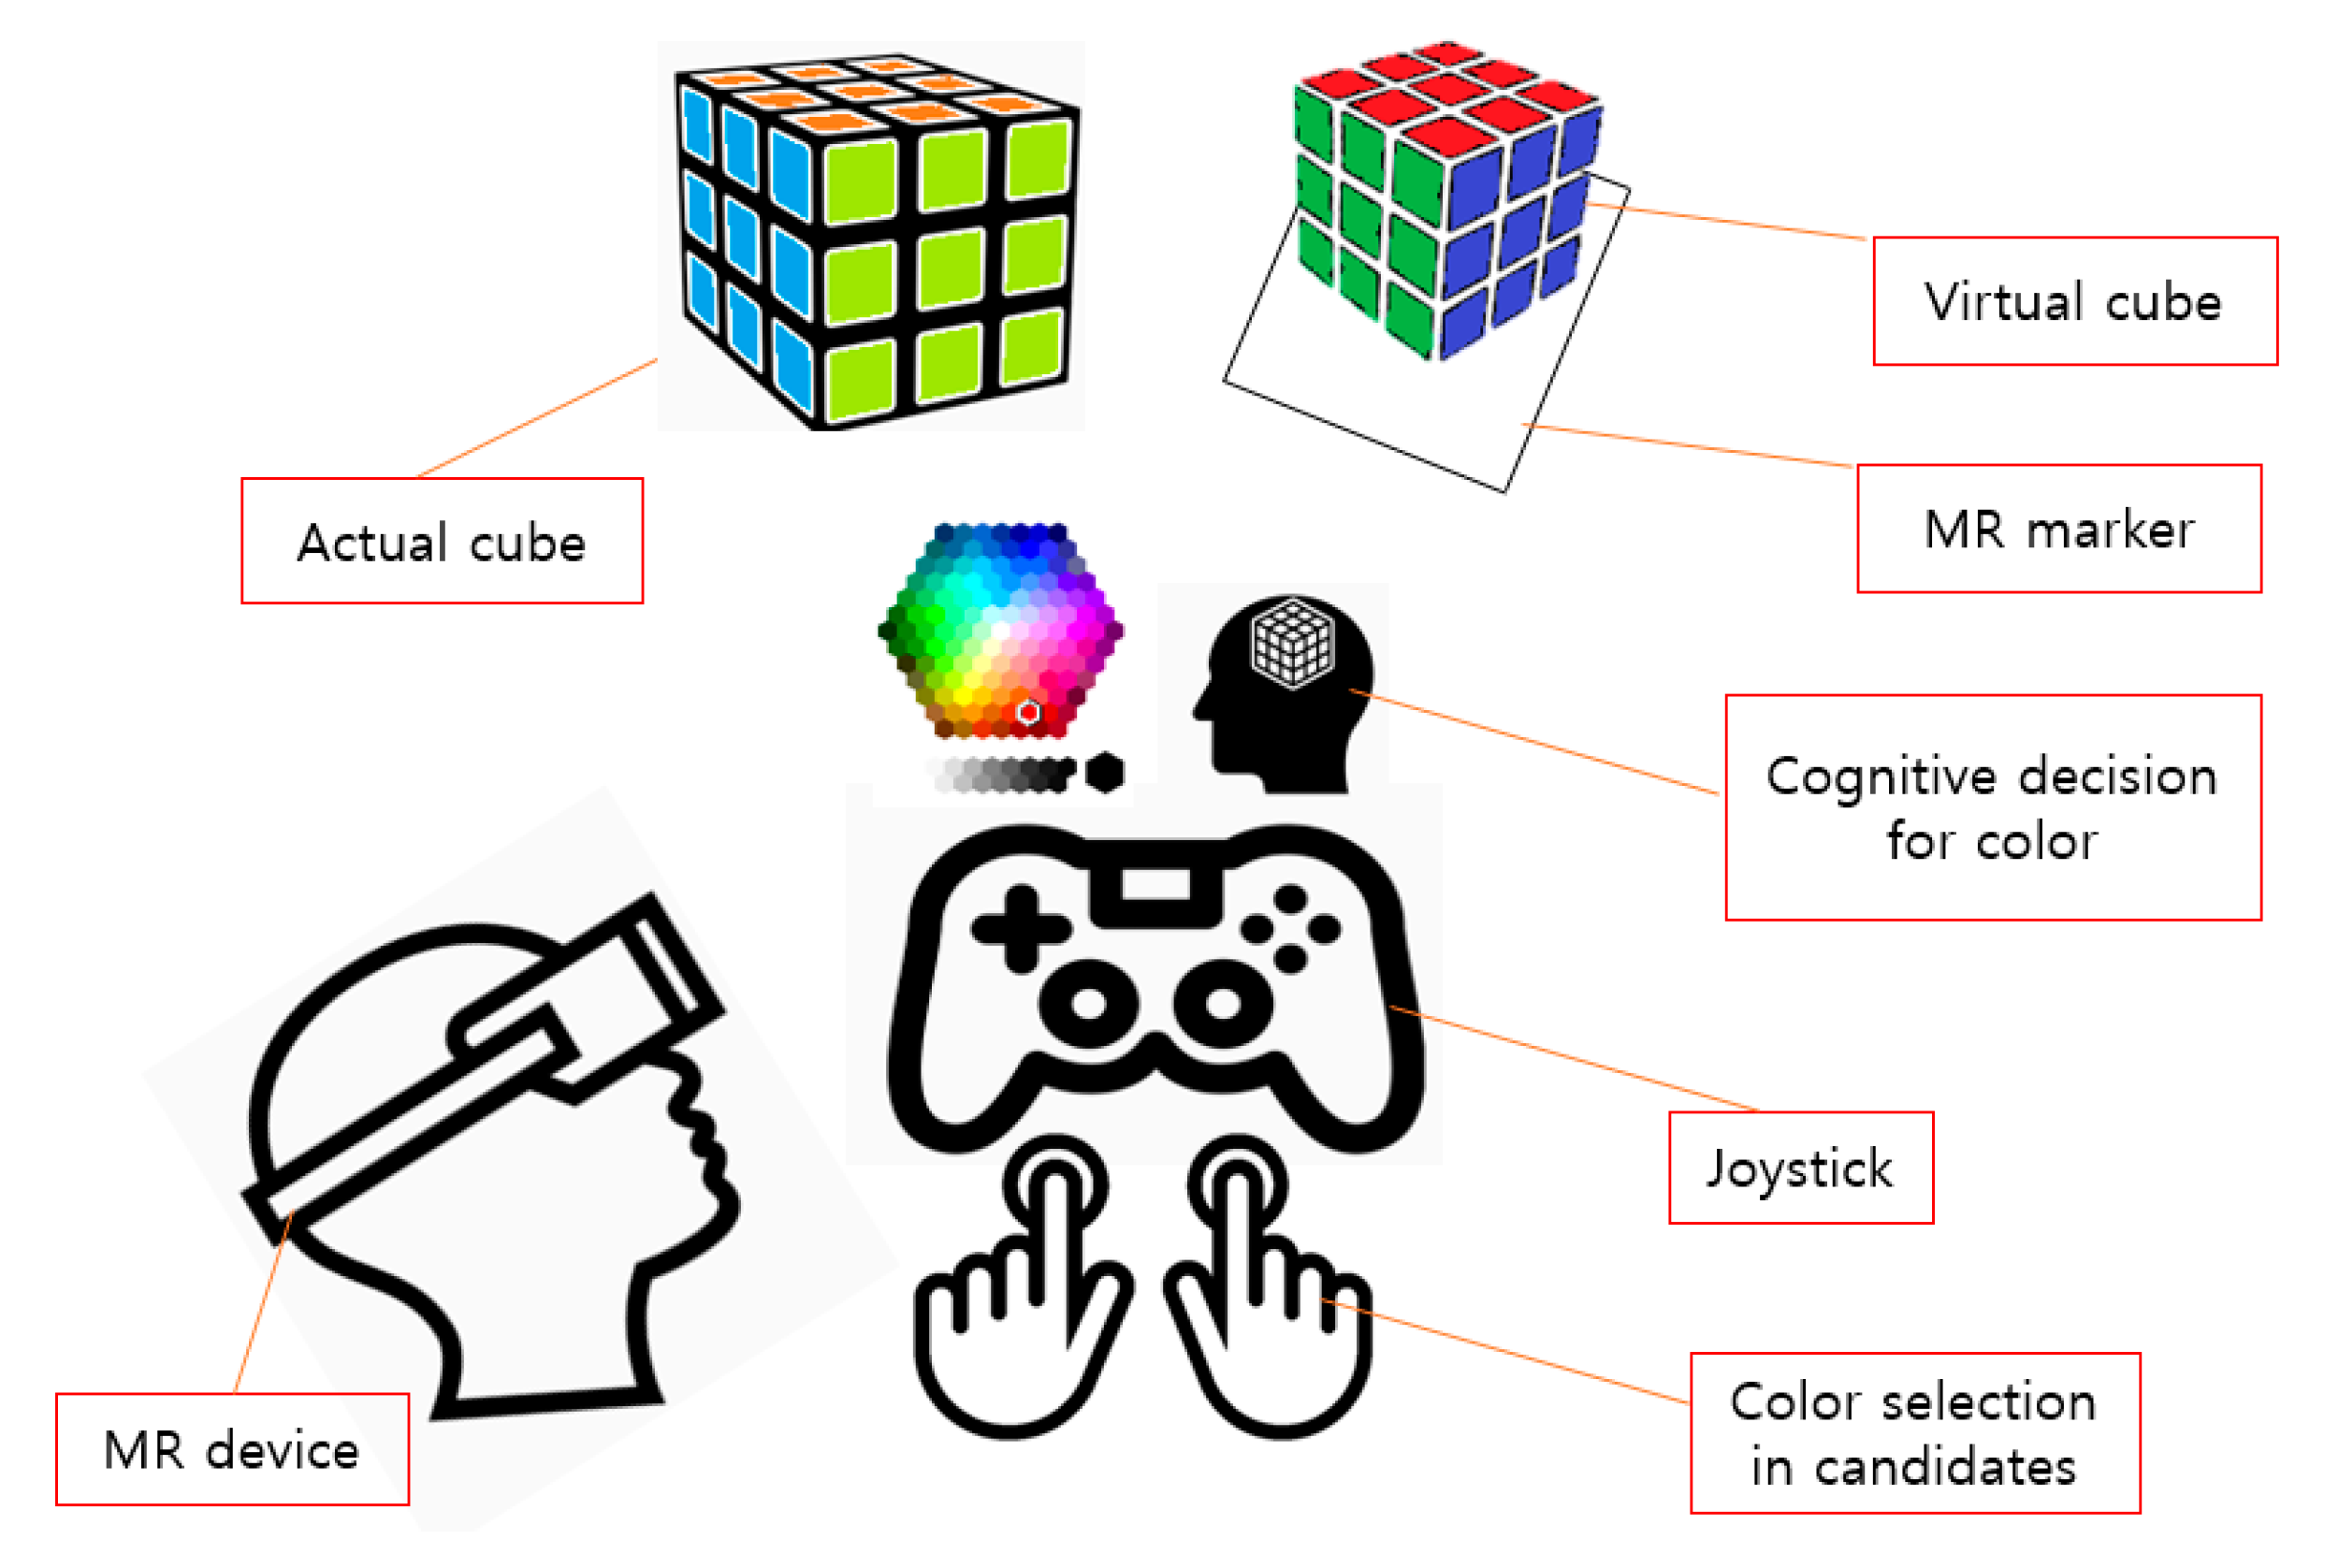
The experiment was carried out with 60 paid subjects, tested for pre-built stereo blindness, who were divided into two groups. Thirty subjects participated in the experiment under each of the two conditions, with a between-subject measurement. To assess the sense of scale, as an indicator of users’ perceptions, the experiment was designed with two factors (i.e., the heterogeneous MR devices and distance between the object and the participant). We measured how participants perceived the scale of the virtual cube compared with that of the actual cube in the MR environment. Thus, during the experiment, the subject was asked to control and adjust the size of the virtual cube and try to match the size of the actual cube using a joystick (or controller) (see Figure 7). The distance between the subject and the cube in our experiment was divided into three steps. The cube was set up to the initial position for each step. The experiment was conducted by setting the fixed observation distance to 10 cm, 40 cm, and 70 cm. Each group (30 people per group) conducted the experiment at all distances.
After the experiment, the subjects were asked to submit their answers to a list of questions concerning their experience, which was conducted by having the subjects fill out a questionnaire. The question categories were as follows: What were your criteria regarding size? (The total size of the real cube, the partial size of the real cube, or the size of the fiducial marker).

3.4. Results and Discussions

Before the experiment, we hypothesized that both the video and optical see-through HMDs were assumed to have different scales, depending on their distance from polynomial regression forms. One-way ANOVA analysis was conducted for the three experimental test conditions, and the use of the video-based MR device (video see-through HMD, p-value = 0.1265, p > 0.05) and the optical-based MR device (optical see-through HMD, p-value = 0.3195, p > 0.05) were not affected by the distance factor (i.e., 10 cm, 40 cm, and 70 cm) between the participant and the virtual object. Note that the dependent variable in our experiment was set to measure the scale factor, the independent variable was set to the HMD type, and the control variables were visual elements that could affect users’ perceptions (e.g., light condition. See Table 1). Thus, this invalidated our hypothesis depending on their distance from polynomial regression forms.
However, in both HMD situations, we confirmed the result that the virtual objects were underestimated, compared with actual objects. For example, people thought 6.04 cm was equal to the real cube, which was 5.5 cm (see the result of 10 cm when wearing the video see-through HMD in Figure 8). Thus, as shown in previous studies, we found that people tended to perceive the virtual object as small. In previous research works, people tended to underestimate the virtual space [15]. In addition, in our experiment, when the distance was long, it was found that there was a difference between the optical and video-type HMD (see the result of 70 cm). According to a survey analysis, most people (except one) to compare the size with the marker said they performed based on the size of the actual objects. As a result, although our hypothesis that both HMDs would be different did not agree, in the case of using the MR device, the common characteristics to recognize virtual objects were known in our experiment.

4. Experiment 2: Color Perception

In the second experiment, we investigated users’ color perceptions when using different MR devices. Thus, we present the experiment and the result regarding users’ perceptions of the degree of color in the defined experiment, shown below.

4.1. Overview of the Experimental Design

The experiment regarding color perception was similar to the scale evaluation. We compared the video see-through HMD and the optical see-through HMD in relation to users’ perceptions when using different types of HMDs (e.g., their sense of color in relation to virtual objects). In the experiment, participants were asked to select the color that appeared to be most similar to that of the actual cube among a number of virtual cubes with different colors. For our experiment of color perception, some concepts were borrowed in color calibration for multi-camera systems but revised to handle real-time adjustment by user’s decisions [23]. We decided to carry out the experiment using the method of allowing users to choose similar colors, because adjusting for matching, as in the scale experiment, was too time-consuming. The real cube with different colors on six sides, as shown in Figure 3, was used in the experiment.
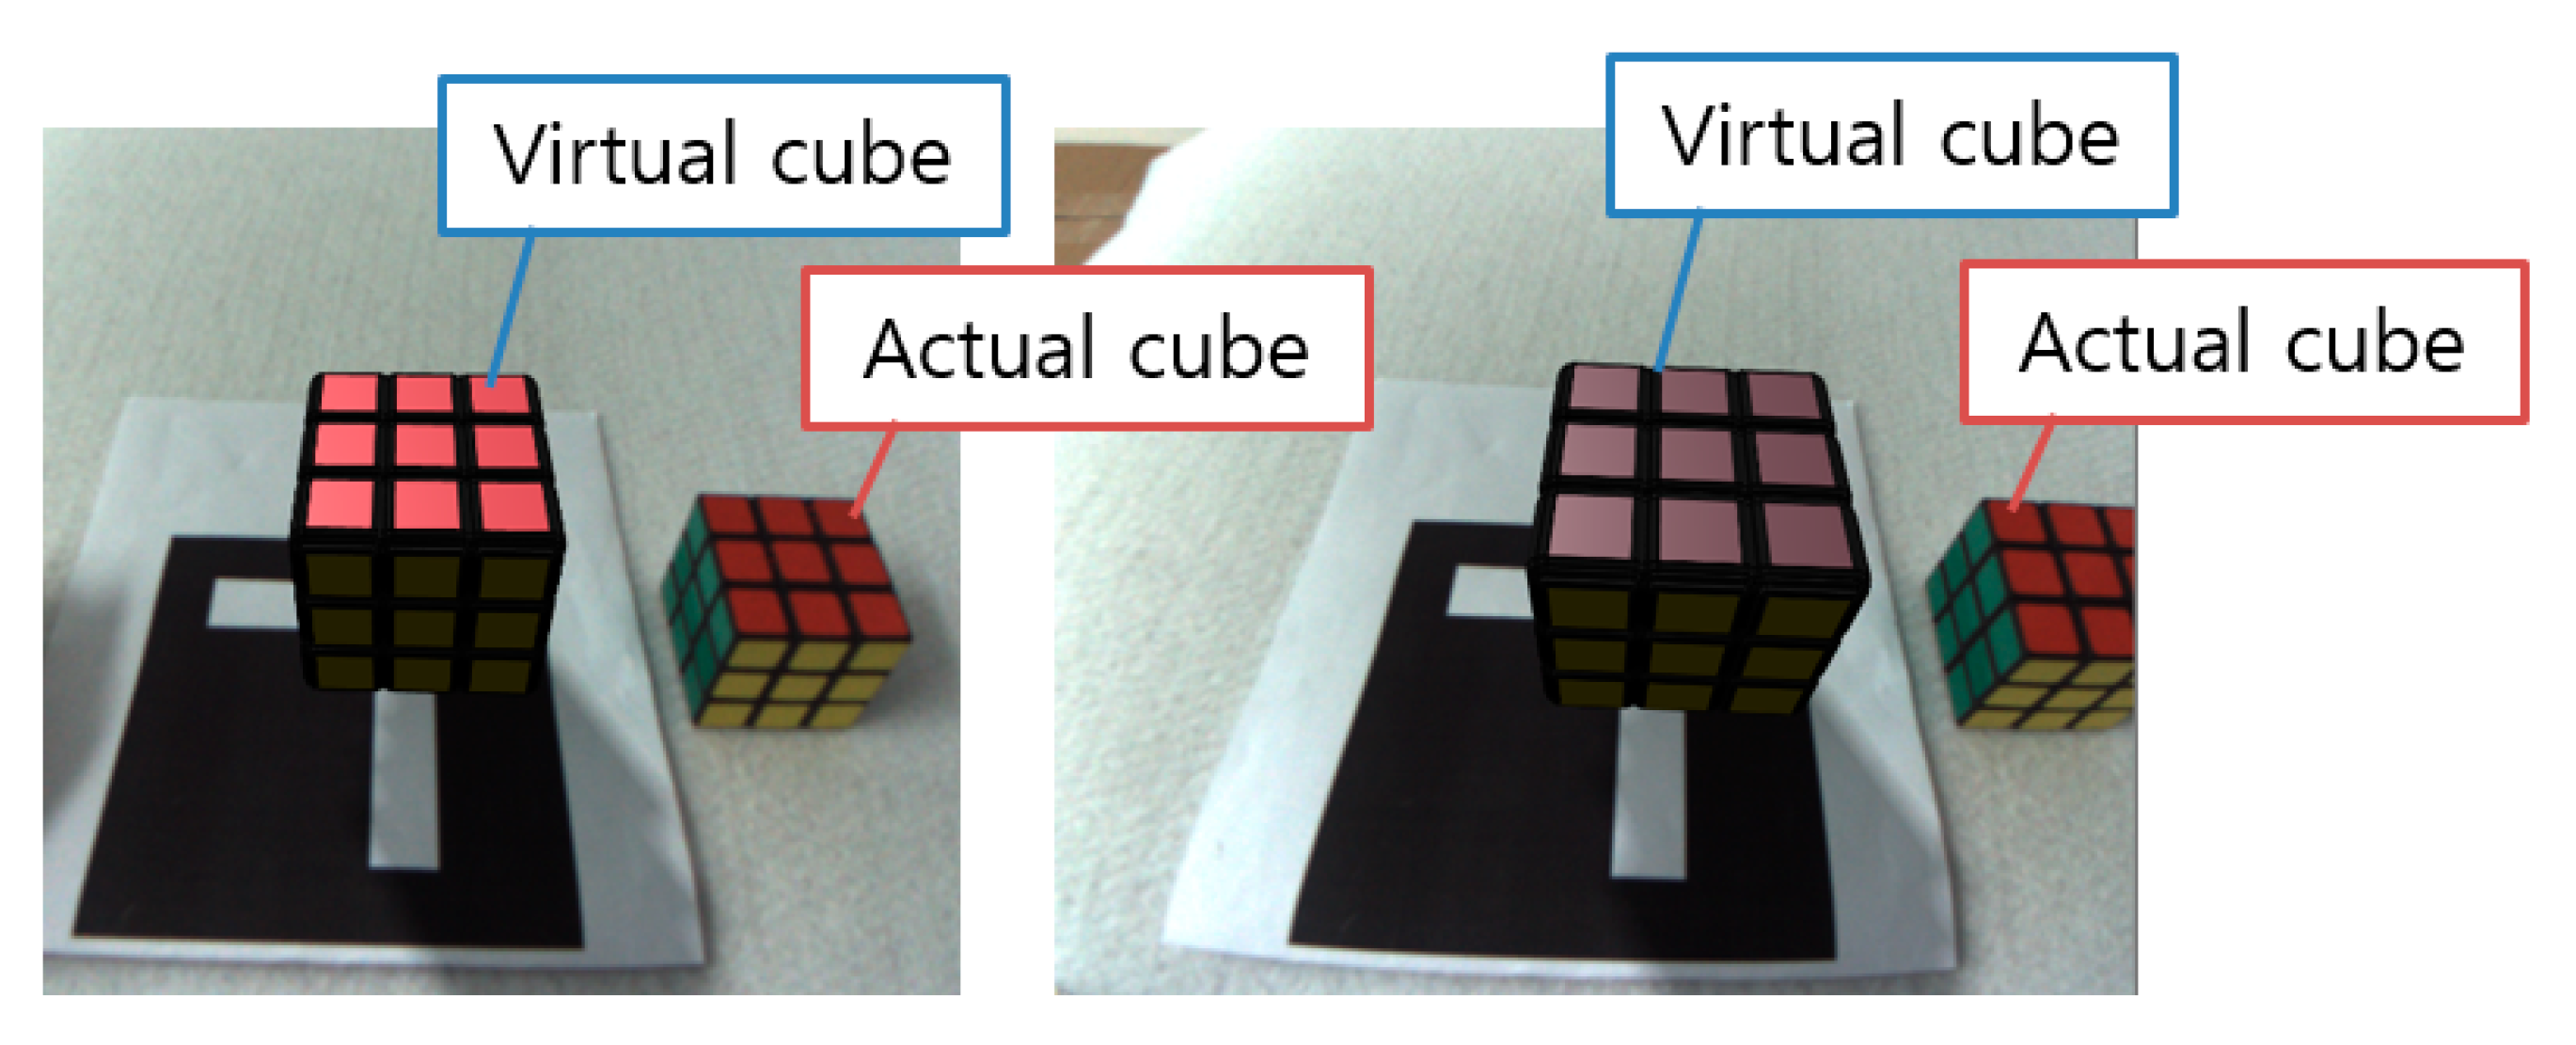
The factor was the color value of the virtual cube under two test conditions (video vs. optical), and Figure 9 shows the two test conditions, including the video and optical see-through HMDs. Figure 10 shows our method of pre-measured color values (ground truth), using a color meter for comparison. Figure 11 and Figure 12 describes our experimental task and environment for color perception.

4.2. Experimental Set-Up for Color Perception

Unlike in the scale experiment, in the color experiment, we installed a curtain and two studio lights to ensure that the real and virtual environments had the same lighting conditions (see Figure 6). It should be noted how important it is that, when calculating the colors of the virtual object, ambient lighting is considered. Thus, we applied the same shadow to our virtual object as the real-life shadow using the same lighting conditions. For example, the shadow on the virtual cube was rendered to be the same as the shadow on the actual cube. Figure 13 shows the lighting conditions and the simulated shadow in the virtual environment. The shadow matched the actual shadow, which was the control variable. To measure the lighting conditions of the real environment, we used a color meter and a light sensor module.
Figure 14 shows the color values for the candidates in the experiment. Because the participants using the optical see-through and the video see-through HMDs experienced different intensity values, we used the HSL (hue, saturation, lightness) color model to set candidates (see Figure 14). Then, we selected seven candidates in the color vector at a given intensity, depending on the HMD used. Note that the HSL color model is a device-dependent color space and, in our experiment, we selected candidates with intensities corresponding to pre-defined device characteristics. Table 2 shows seven color candidates (of blue colors) selected with a total of 42 colors in the color experiment.

4.3. Experimental Task and Procedure

To assess users’ perceptions in terms of color difference when using heterogeneous MR devices, we adapted the method used in the scale perception experiment. In the case of our scale perception, we measured how the participants perceived the scale of the virtual cube, compared with the actual cube, in the MR environment. The task for color perception was similar. Additionally, the experiment was conducted with 60 paid subjects divided into two groups, with a between-subject measurement, as in the scale experiment.
During the experiment, participants tried to match the virtual cube and the actual cube in terms of color. The rest was performed in the same manner as the scale experiment.

4.4. Results and Discussions

Before the experiment, as in the scale perception, we hypothesized that both the video and optical see-through HMDs induced different color perceptions. To establish the background to conduct our experiment, as already mentioned, the real and virtual environments had the same lighting conditions (see Figure 6) and we have only focused on object-level color perception.
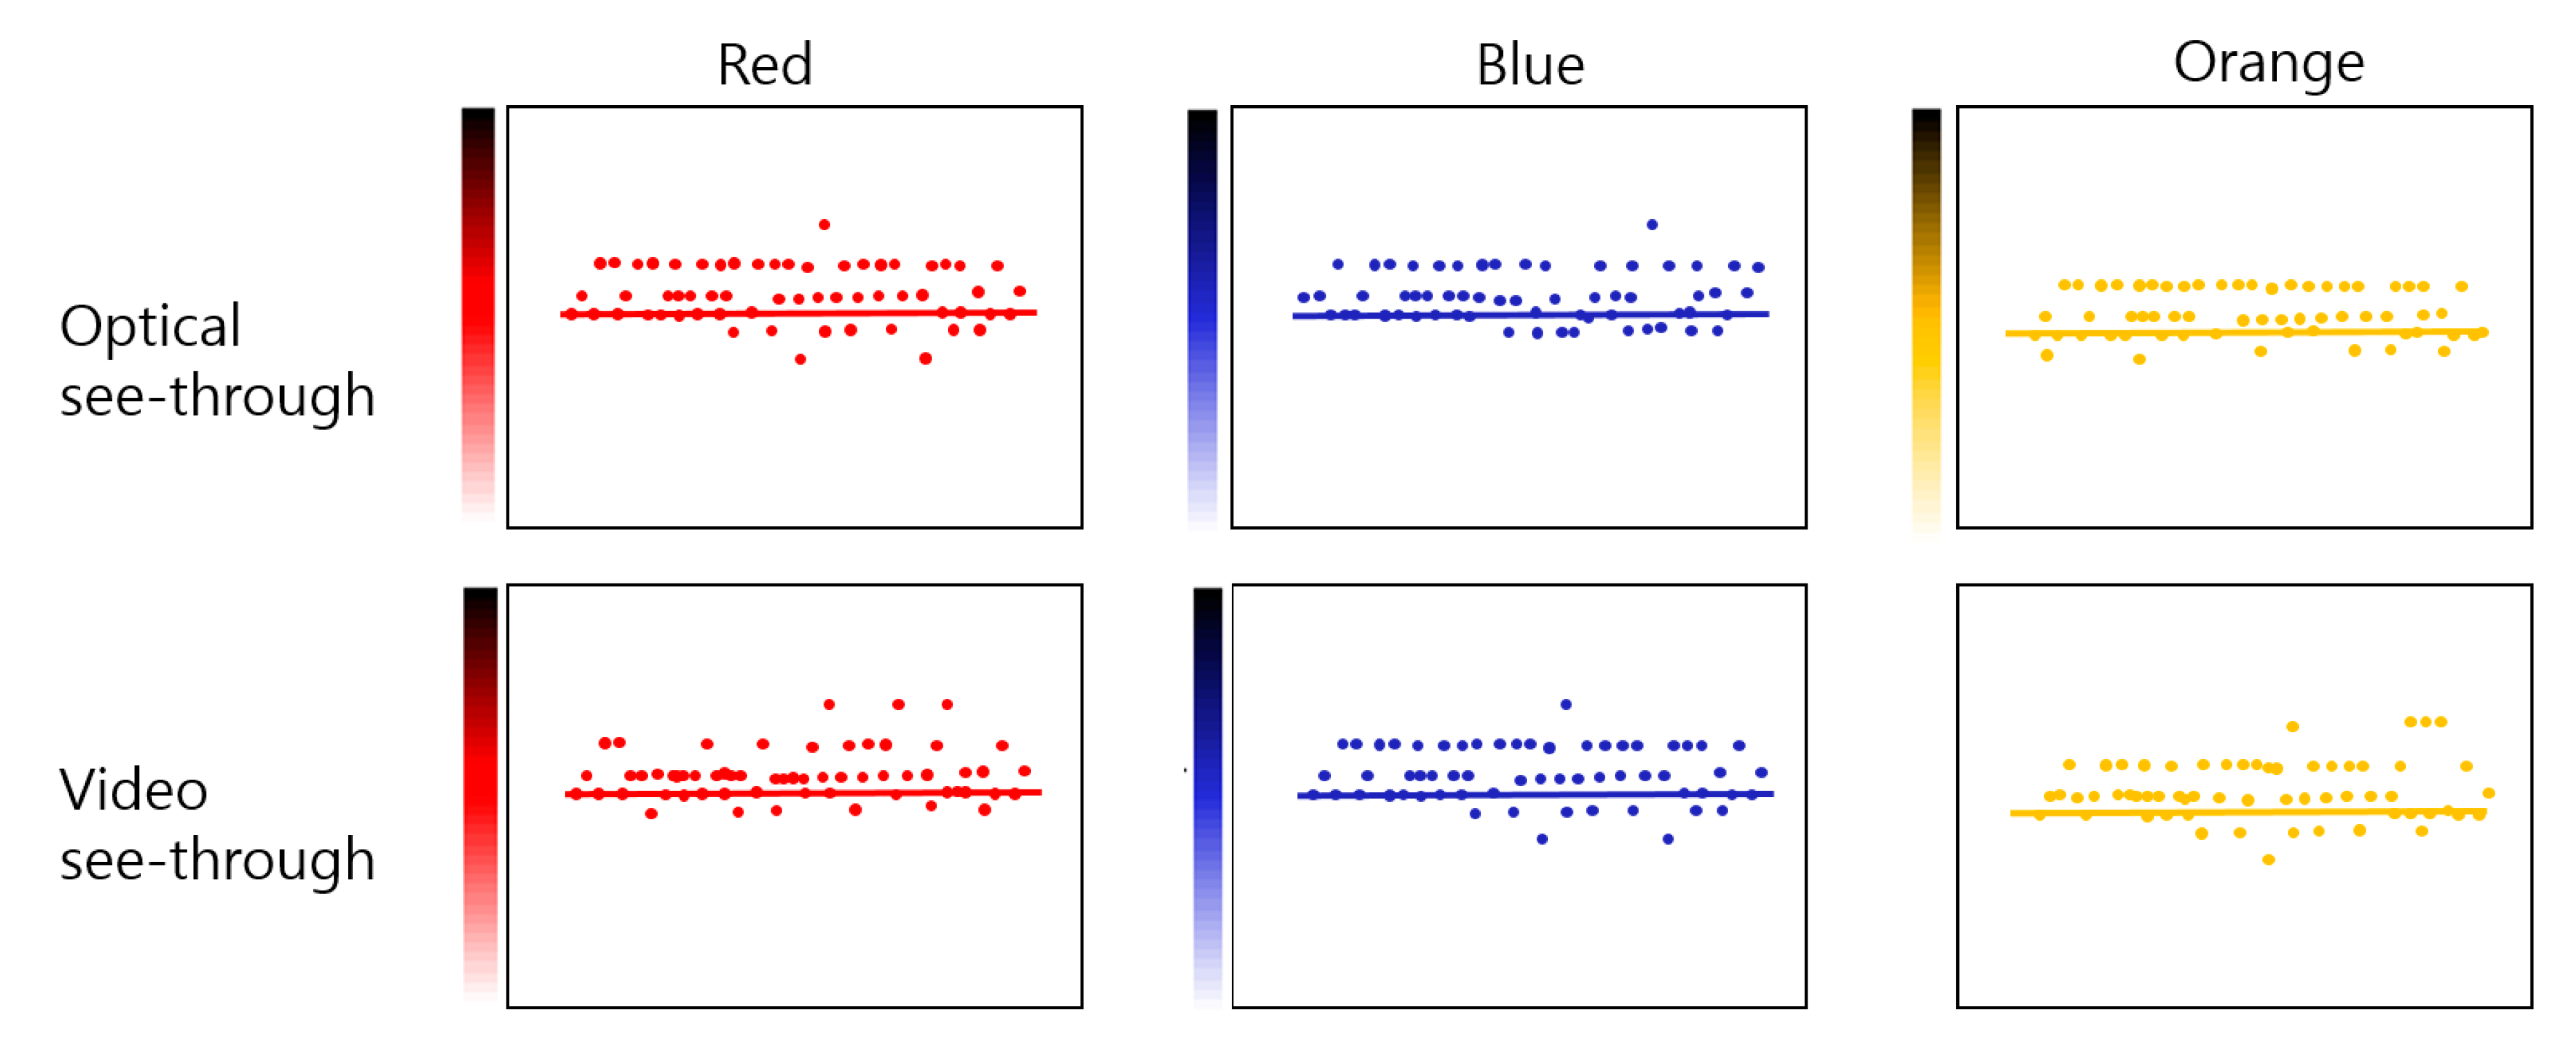
The results showed that the experimental test conditions for the video-based MR device and the optical-based MR device did not have a major effect on users’ color perceptions of the virtual object. Statistically significant differences between head-worn display conditions were not found (p > 0.05). However, we confirmed the result that virtual objects were overestimated, compared with actual objects. For example, people thought the original blue color in the real cube was a darker blue when wearing the video see-through HMD, and the red 211 color of the virtual cube was equal to red 189 of the real cube (see Figure 15). According to a survey analysis, most people tended to think that the virtual object projected by a head-worn display was shown through a filter, so people decided it was darker, based on the color of the actual object. As a result, although our hypothesis that both HMDs would be perceived differently in color perception did not agree, in the case of using the MR device, the common characteristics to recognize the colors of virtual objects were revealed in our experiment.

5. Conclusions and Future Works

In this paper, we presented the novel method for evaluating users’ perceptions of virtual objects to make a methodological contribution, and the effects of scale and color perception when using heterogeneous MR devices (optical vs. video see-through HMDs) to improve MR experiences and the design of future MR systems. We are interested in how the scale and color of different types of HMDs affect users’ perceptions and how to compensate for users’ perceptions. Our work was designed with an object-level comparison in terms of scale and color differences, comparing actual and virtual objects in relation to two forms of HMDs.
We conducted two usability experiments (scale and color) in MR environments. The main result of our experiments was that participants tended to underestimate virtual objects in terms of scale, thought the large virtual object was equal to the small real object, and tended to perceive the virtual object as small. In addition, the use of the video-based MR device and the optical-based MR device was not affected by the distance factor between the participant and the virtual object, whereas our study showed that subjects tended to overestimate virtual objects in the MR environment in terms of color. However, the experimental test conditions for the video-based MR device and the optical-based MR device did not have a major effect on participants’ color perceptions of the virtual object. Note that we need additional color experiments for more accurate analysis with future research. Specifically, we will need to analyze how fundamental parameters of MR devices, such as the gamut and characteristic curve, affect our experiments. From these findings, we found that if we adjust the size and color of a virtual object according to the characteristics of the HMD, people will be able to recognize the same virtual object, irrespective of the MR HMD used. Additionally, we tried to find out the results with object levels at which people perceived virtual objects in an MR environment. Through our experimental results, we can allow different MR devices to induce the same user experience and provide consistency with device-dependent control values (see Figure 16). For instance, the values from the results of our experiment can be adjusted to configure in MR contents. Thus, our approach provided an experimentally novel methodology for participants to provide the same experience in MR environments, and if the same method applies to other visual parameters, an MR user will able to get the same user’s perception under different types of MR elements (e.g., lighting conditions or FOV) in real life.
For future research, there are still many aspects to improve in terms of practical applicability and perceptual factors. In the case of scale perception with objects of various shapes (i.e., real-life objects), we plan to conduct additional experiments and will perform a quantitative experiment (e.g., measuring interaction errors) on the interaction with the corrected scale factor. In addition, in the case of color perception, it is necessary to study the chromatic characterization of the mixed reality system, which determines the color transformation between the device-dependent color space and device-independent color space, such as CIEXYZ or CIE Lab, and the differences in the color gamuts and dynamic ranges between different devices. Additionally, we will continue to explore various MR devices, including smartphones, in order to make them usable in the real world. We also plan to further extend our experiments using various parameters that affect users’ perceptions.

Author Contributions

K.-s.S. performed the prototype implementation and usability experiments. H.K. designed the study in terms of conceptualization and performed the analysis of the results, J.g.L. performed mathematical studies and statistical analysis of the results, and D.J. analyzed the data and contributed to the writing of the paper. All authors have read and agreed to the published version of the manuscript.

Funding

This research is supported by the Ministry of Culture, Sports, and Tourism (MCST) and Korea Content Agency (KOCCA) in the Culture Technology (CT) Research & Development Program 2018.

Acknowledgments

We express sincere gratitude to the users who participated in the experiments. We especially thank JuHwan Kim, Donggeun Lee, Soobin Oh, and HyunSoo Jung for their efforts in managing the experimental assessment of the participants’ perception. We also thank the reviewers for their valuable contributions.

Conflicts of Interest

The authors declare no conflict of interest.

References

  1. Jo, D.; Kim, K.-H.; Kim, G.J. Spacetime. Adaptive control of the teleported avatar for improved AR tele-conference experience. Comput. Anim. Virtual Worlds 2015, 26, 259–269. [Google Scholar] [CrossRef]
  2. Xue, H.; Sharma, P.; Wild, F. User satisfaction in augmented reality-based training using Microsoft Hololens. Computers 2019, 8, 9. [Google Scholar] [CrossRef] [Green Version]
  3. Muller, L.; Aslan, I.; Kruben, L. GuideMe: A mobile augmented reality system to display user manuals for home appliances. In Advances in Computer Entertainment; Springer: Cham, Switzerland, 2013; pp. 152–167. [Google Scholar]
  4. Maimone, A.; Yang, X.; Dierk, N.; State, A.; Dou, M.; Henri, F. General-purpose telepresence with head-worn optical see-through displays and projector-based lighting. In Proceedings of the 2013 IEEE Virtual Reality (VR), Lake Buena Vista, FL, USA, 18–20 March 2013; pp. 23–26. [Google Scholar]
  5. Wilson, A.; Hua, H. Design and prototype of an augmented reality display with per-pixel mutual occlusion capability. Opt. Express 2017, 25, 30539–30549. [Google Scholar] [CrossRef] [PubMed] [Green Version]
  6. Kruijff, E.; Swan, E.; Feiner, S. Perceptual issues in augmented reality revisited. In Proceedings of the 2010 IEEE International Symposium on Mixed and Augmented Reality, Seoul, Korea, 13–16 October 2010; pp. 3–12. [Google Scholar]
  7. Albarelli, A.; Colentano, A.; Cosmo, L.; Marchi, R. On the inter-play between data overlay and real-world context using see-through displays. In Proceedings of the 11th Biannual Conference on Italian SIGCHI Chapter (CHItaly 2015), New York, NY, USA, 28–30 September 2015; pp. 58–65. [Google Scholar] [CrossRef] [Green Version]
  8. Debernardis, S.; Gattullo, M.; Monno, G.; Uva, A. Text readability in head-worn displays: Color and style optimization in video versus optical see-through devices. IEEE Trans. Vis. Comput. Graph. 2014, 20, 125–139. [Google Scholar] [CrossRef] [PubMed]
  9. Draelos, M.; Keller, B.; Viehland, C.; Zevallos, C.; Kuo, A.; Izatt, J. Real-time visualization and interaction with static and live optical coherence tomography volumes in immersive virtual reality. Biomed. Opt. Express 2018, 9, 2825–2843. [Google Scholar] [CrossRef] [PubMed]
  10. Rolland, J.P.; Henri, F. Optical versus video see-through head-mounted displays in medical visualization. Presence 2000, 9, 287–309. [Google Scholar] [CrossRef]
  11. Jang, C.; Lee, S.; Lee, B. Mixed reality near-eye display with focus cue. In Proceedings of the 3D Image Acquisition and Display: Technology, Perception and Applications, Orlando, FL, USA, 25–28 June 2018. [Google Scholar] [CrossRef]
  12. Wang, Y.; Cheng, D.; Xu, C. Freeform optics for virtual and augmented reality. In Proceedings of the Freeform Optics 2017, Denver, CO, USA, 9–13 July 2017. [Google Scholar] [CrossRef]
  13. Kim, K.; Schubert, R.; Welch, G. Exploring the impact of environmental effects on social presence with a virtual human. In Intelligent Virtual Agents (IVA); Springer: Cham, Switzerland, 2016; pp. 470–474. [Google Scholar]
  14. Balenson, J.-N.; Blascovich, J.; Beall, A.-C.; Loomis, J.M. Interpersonal distance in immersive virtual environments. Pers. Soc. Psychol. Bull. 2003, 29, 819–833. [Google Scholar] [CrossRef] [PubMed] [Green Version]
  15. Volante, M.; Babu, S.-V.; Chaturvedi, H.; Newsome, N.; Ebrahimi, E.; Roy, T.; Daily, S.-B.; Fasolino, T. Effects of virtual human appearance fidelity on emotion contagion in affective inter-personal simulations. IEEE Trans. Vis. Comput. Graph. 2016, 22, 1326–1335. [Google Scholar] [CrossRef] [PubMed]
  16. Diaz, C.; Walker, M.; Szafir, D.A.; Szafir, D. Designing for depth perceptions in augmented reality. In Proceedings of the 2017 IEEE International Symposium on Mixed and Augmented Reality (ISMAR), Nantes, France, 9–13 October 2017; pp. 111–122. [Google Scholar]
  17. Baumeister, J.; Ssin, S.Y.; Elsayed, N.A.E.; Dorrian, J.; Webb, D.P.; Walsh, J.P.; Simon, T.M.; Irlitti, A.; Smith, R.T.; Kohler, M.; et al. Cognitive cost of using augmented reality displays. IEEE Trans. Vis. Comput. Graph. 2017, 23, 2378–2388. [Google Scholar] [CrossRef] [PubMed]
  18. Juan, M.-C.; Inmaculada, G.; Molla, R.; Lopez, R. Users’ perceptions using low-end and high-end mobile-rendered HMDs: A comparative study. Computers 2018, 7, 15. [Google Scholar] [CrossRef] [Green Version]
  19. Rohmer, K.; Jendersie, J.; Grosch, T. Natural environment illumination: Coherent interactive augmented reality for mobile and non-mobile devices. IEEE Trans. Vis. Comput. Graph. 2017, 23, 2474–2484. [Google Scholar] [CrossRef] [PubMed]
  20. Rhee, T.; Petikam, L.; Allen, B.; Chalmers, A. MR360: Mixed reality rendering for 360o panoramic videos. IEEE Trans. Vis. Comput. Graph. 2017, 23, 1379–1388. [Google Scholar] [CrossRef] [PubMed]
  21. Menk, C.; Koch, R. Truthful color reproduction in spatial augmented reality applications. IEEE Trans. Vis. Comput. Graph. 2012, 19, 236–248. [Google Scholar] [CrossRef] [PubMed]
  22. AR-RIFT: Aligning Tracking and Video Spaces. Available online: https://willsteptoe.com/post/67401705548/ar-rift-aligning-tracking-and-video-spaces-part (accessed on 1 September 2019).
  23. Kun, L.; Qionhai, D.; Wenli, X. Collaborative color calibration for multi-camera systems. Signal Process. Image Commun. 2011, 26, 48–60. [Google Scholar]
Figure 1. A user’s perception in a mixed reality (MR) environment. When comparing a virtual object with a real object in an MR environment, the user must be able to perceive the scale and color using different MR devices (left). Additionally, the user should be able to recognize the same size and color, irrespective of the MR device worn (right). In our case, we assumed that people wearing different MR devices had different perceptions.
Electronics 09 01623 g001
Figure 2. Scale perception in comparing a real cubic puzzle with a virtual one using a video see-through head-mounted display (HMD) and an optical see-through HMD. In the experiment, two cubes (each with a real and a virtual cube) appeared at the same time for comparison.
Electronics 09 01623 g002
Figure 3. Real cubic puzzle (or cube) provided as a basis for the scale comparison. It was 5.5 cm in size and had different colors on each side.
Electronics 09 01623 g003
Figure 4. Experimental design. A participant compared the size of the virtual cube with the actual cube in the experiment.
Electronics 09 01623 g004
Figure 5. Video see-through HMD with a dual webcam module attached, which allowed the user to visualize the virtual cube (left), and the optical see-through HMD, which allowed the user to integrate the virtual cube into reality since the device was semi-transparent in our experiment (right). Participants could see the virtual cubes placed on the fiducial MR marker. In the experiment, the keyboard (in the right image) was used for the initial start, and the joystick (in the left image) was used for the actual experiment.
Electronics 09 01623 g005
Figure 6. System set-up in our experiment. The participant wearing the HMD sat in a chair and compared the size of the actual cube with that of the virtual one. The participant could adjust the size of the virtual cube using a joystick (or controller). The participant used the same controller to interact with the virtual cube.
Electronics 09 01623 g006
Figure 7. Experimental task of adjusting the scale parameter of the virtual cube in comparison with the actual cube. In the experiment, the subject was asked to match the size of the actual cube. In the first frame, the virtual cube was presented as large. Participants were able to adjust the size with a joystick.
Electronics 09 01623 g007
Figure 8. Results regarding scale perception. The subjects underestimated the virtual cube, compared with the real cube (5.5 cm), when using two MR devices (video and optical HMD type). Statistically significant differences between all distance conditions were not found (p > 0.05). However, in the case of 70 cm, as a result of the T-test, it was found that there was a significant difference between the two HMDs (p < 0.05).
Electronics 09 01623 g008
Figure 9. We investigated users’ color perceptions when comparing a real cubic puzzle and a virtual one, using the video see-through and optical see-through HMDs.
Electronics 09 01623 g009
Figure 10. Real cubic puzzle (or cube) provided as a basis for the color comparison. The color values for the reference were measured in advance through a color meter.
Electronics 09 01623 g010
Figure 11. Experimental task of selecting a color parameter for the virtual cube, compared with the actual cube. In the experiment, the subject was asked to match the color of the actual cube. In the first frame, the virtual cube was presented with different color values, and participants were able to select the same color with their cognitive decision among candidates which consisted of a set of similar colors. In the experiment, participants select one from seven colors (each cube face) and they could go back for their choice with the controller. Enough time was given until the participant’s choice was made.
Electronics 09 01623 g011
Figure 12. Experimental environment for color perception. The color of the virtual cube was selected by comparing the color of the actual cube. The image on the left represents the color at the beginning of the experiment, and the image on the right shows the process of matching by the subject.
Electronics 09 01623 g012
Figure 13. The light conditions and shadow in the virtual environment. The intensity of the virtual environment was set to be equal to the real space. The left figure shows a situation in which one of the studio lights is turned on, and the right figure shows a situation in which two lights are turned on.
Electronics 09 01623 g013
Figure 14. Experimental setup for selecting color values. In the experiment, we used the hue, saturation, lightness (HSL) color model, which includes color and lightness.
Electronics 09 01623 g014
Figure 15. Results regarding color perception. The subjects overestimated the colors when using two MR devices (video and optical).
Electronics 09 01623 g015
Figure 16. Results regarding color perception. The subjects overestimated the colors when using two MR devices (video and optical).
Electronics 09 01623 g016
Table 1. Our newly configured perception issues with the work of Kruijff et al. [6]. We classified elements of the users’ perceptions, examples of users’ perceptions (output), and visual elements to affect users’ perceptions (input). In our paper, we presented a way to evaluate user perception (with display type as an independent variable and scale and color perception as dependent variables. The remaining parameters should be used as control variables in the evaluation).
Input (Specifications of MR Devices)Perception
Device CharacteristicsDisplay type (video or optical)Scale, color, naturalness
ResolutionScale, naturalness
Aspect ratioScale, readability
BrightnessColor, visibility, readability
ContrastColor, visibility, readability
FOV (viewing angle)Scale, visibility
Refresh rateNaturalness, readability
Response time (tracking)Naturalness, readability
User’s Surrounding EnvironmentLight conditionColor, visibility
OcclusionVisibility
Virtual Object CharacteristicsRealistic representationNaturalness, readability
Texture qualityNaturalness, readability
Distance between the user and the objectScale
Viewing directionVisibility, readability
Table 2. Candidates for color perception. Participants were asked to select a color for the virtual cube that appeared to be the most similar color to the actual cube among color candidates (e.g., a blue color in six areas).
Electronics 09 01623 i001 Electronics 09 01623 i002 Electronics 09 01623 i003 Electronics 09 01623 i004 Electronics 09 01623 i005 Electronics 09 01623 i006 Electronics 09 01623 i007
H169169169169169169169
S169169169169169169169
L2302001701401108050