1. Introduction
School dropout is one of the problems analyzed worldwide that has attracted the attention of researchers and government agencies due to the relevance of education in the process of economic development and the reduction of income disparity. A high dropout rate also has a significant, negative impact on the recruitment process of professionals from the institution [
1]. According to Yang [
2], education is vital for economic progress, increasing the country’s competitiveness and improving social welfare. In this context, it is crucial to identify which student profiles are more likely to be evasive, as this information can assist in decision-making so that education professionals can propose personalized solutions to reverse this dropout trend [
3,
4].
There are many reasons for dropout, and some of the most common include economic factors [
5], size of university, acceptance rate of university, academic ability tests, grades, and number of credits to be taken [
1]. For Reference [
6], with the use of Artificial Intelligence (AI) techniques, it is possible to discover patterns and hidden features that are helpful for modeling student evasion. The Artificial Neural Network (ANN) is an Applied Computational Intelligence (ACI) algorithm that can learn using examples [
7].
The Federal Institute of Education, Science, and Technology of Ceará (IFCE), Fortaleza campus, is one of the Brazilian institutions that has faced the challenge of reducing a high dropout rate, as approximately 13% of students drop out during their academic trajectory [
8]. Therefore, there is a need to develop automated proposals to assist in early detection of dropouts, allowing its possible causes to be analyzed and addressed early, reducing possible dropout costs.
The Internet of Things (IoT) enables the ease of interaction between real-world technologies and virtual resources. The development of this technology stimulates the growth of this concept in several sectors, such as industry, health, safety, education, and other areas [
9]. This growth encourages other researchers to develop works that address the subject. Among the sectors mentioned, the education sector presented a delay in the use of such technologies. Educational institutions have only recently started to understand the relevance of the IoT and adopt it in sub-areas of education such as in administration, teaching, and internal policies. In addition, big data has become a frequent research topic due to the increased availability of data, and the combination of this data with IoT can bring promising research findings [
10].
There are several types of IoT devices and systems applied in education to aid decision-making, including academic performance monitoring systems [
11], teaching and learning optimization systems [
12], and systems that can predict student success in high school [
13]. However, each case study goes through several challenges that can often compromise the delivery of an IoT structure.
The purpose of this article is to bring together several computational aspects, with the difference of guaranteeing usability and promoting intuitive use by lay computer users who are not aware of dropout analysis techniques. Another indirect contribution is to support the creation of large banks with socioeconomic data, within a scientific platform, with shared data from users working in this area of study. This should improve the structure by applying its algorithms to a much broader base. Thus, it is hoped that this platform, specifically in the field of education, will contribute to predicting school dropouts with socioeconomic data and can provide school managers with the opportunity to intervene by reversing this situation.
The main challenge in implementing this type of application is the combination of three elements that are not generally integrated: computer knowledge, dropout risk analysis, and high computational power to deliver predictions with minimum time between the requisition and the results. These three elements can be integrated using Internet of Things (IoT) [
14]. Several research projects approaching school dropout prediction can be found, applying different algorithms and with very precise solutions, but most do not have an appropriate interface for use by ordinary education professionals [
6,
15].
Therefore, the main contributions of this work are as follows:
Creation of a simple platform to predict dropout based on socioeconomic information;
Make it possible to predict dropouts in universities to help specialists reduce dropout in higher education;
Creation of a prediction support system that can be accessed from different devices;
Enable the use of an IoT system for predicting dropouts without the need for specific hardware and advanced user knowledge.
This article is organized as follows.
Section 2 presents a literature review to provide a better understanding of existing work and to highlight why this work is relevant.
Section 3 describes the methodology used in the article, presenting the database used, how data were selected and processed, and the IoT framework developed.
Section 4 shows the results obtained with the classifiers used. Finally,
Section 5 presents the conclusion and future work.
2. Related Works
The number of studies that seek to predict dropout has intensified in recent years. Researchers such as [
16,
17,
18,
19,
20,
21] carried out surveys that sought to predict which students were likely to drop out of courses in the face-to-face modality.
Authors in [
16,
17] used school data from the census between the years 2011 to 2016 in the states of Pernambuco, Sergipe, and Ceará, in Brazil; using predictive characteristics such as age, gender, and demographic region presented significant results within the studied context. Authors in [
16] applied the Decision Tree classifier and obtained 69% accuracy. Authors in [
17] used data from Ceará and Sergipe between the years 2014 and 2016 and reached 87% on the same metric with logistic regression.
Other authors such as [
18,
19,
20,
21] sought to mitigate the problem of school dropout by using enrollment data, academic characteristics, and other information that was considered relevant. Authors in [
18] obtained 90.80% accuracy using the Support Vector Machines (SVM) classifier in a 2008 elementary school database in a North Carolina school. Authors in [
19] applied K-Nearest Neighbors (KNN) algorithm in a 2013 database of a university level in Washington and reached 64.60% accuracy. Authors in [
20], using the Multi-Layer Perceptron classifier, obtained an accuracy of 68% in a database from 1977 to 2002 of an Illinois school. Authors in [
21] used deep learning and achieved 73% accuracy on a 2010 to 2017 dataset from a university in Budapest.
With the popularization of information and communication technology (ICT), a new modality of courses has emerged: Massive Open Online Courses (MOOCs). MOOCs offer ease of completion, as the student can take the course remotely, without the need to travel to a university. However, the number of dropouts of these courses is even higher than those in classroom courses [
22,
23]; therefore, more recent studies have focused on the prediction of dropout in MOOCs [
24,
25,
26], with few studies focused on the prediction of dropout in face-to-face courses [
1]. The lack of studies focused on in-person courses is mainly due to the difficulty of data collection from face-to-face courses, with few universities having organized systems that easily allow data collection, making the work of researchers complicated.
Some works can be highlighted in predicting dropout. In Reference [
27], the authors proposed a multi-view semi-supervised learning model based on behavior features for the dropout prediction task. The authors used the KDD Cup 2015 dataset and used a multi-training algorithm that achieved better results than all the others compared to state-of-the-art methods.
In Reference [
24], the authors combined behavioral and demographic features from the Harvard dataset to predict dropout from MOOCs. The authors compared different machine learning techniques, but Random Forest (RF) and Support Vector Machine (SVM) achieved better results, with accuracy values of 98.81% and 98.51%, respectively.
In more recent studies, authors also used deep learning to predict dropout. Wang, Yu and Miao [
28] combined a Convolutional Neural Network (CNN) and a Recurrent Neural Network (RNN) to develop a framework for MOOC dropout prediction. The method achieved comparable results with other methods that require manual processing performed by experts. Another interesting work is the study developed by [
29]. The authors used a Deep Neural Network to predict weekly temporal dropout, exploring not only the probability of dropout but also personalized and prioritized intervention for each student.
As stated, there are many types of research focused on MOOC dropout prediction, but only a few are focused on in-person courses dropout. The algorithms proposed are not integrated with an easy-to-use framework and interface, which complicates the accessibility by people who are not an expert in the area [
30,
31].In addition, most works use only academic/performance data [
32,
33,
34,
35].
Therefore, this paper proposes a user-friendly IoT framework for predicting dropout using machine learning methods based on socioeconomic data. The platform can be accessed from any device connected to the internet and gives a dropout prediction in reduced time, allowing personalized intervention by school managers.
3. Methodology
In this section, the methodology used to develop the proposed system for predicting dropout from socioeconomic data will be presented.
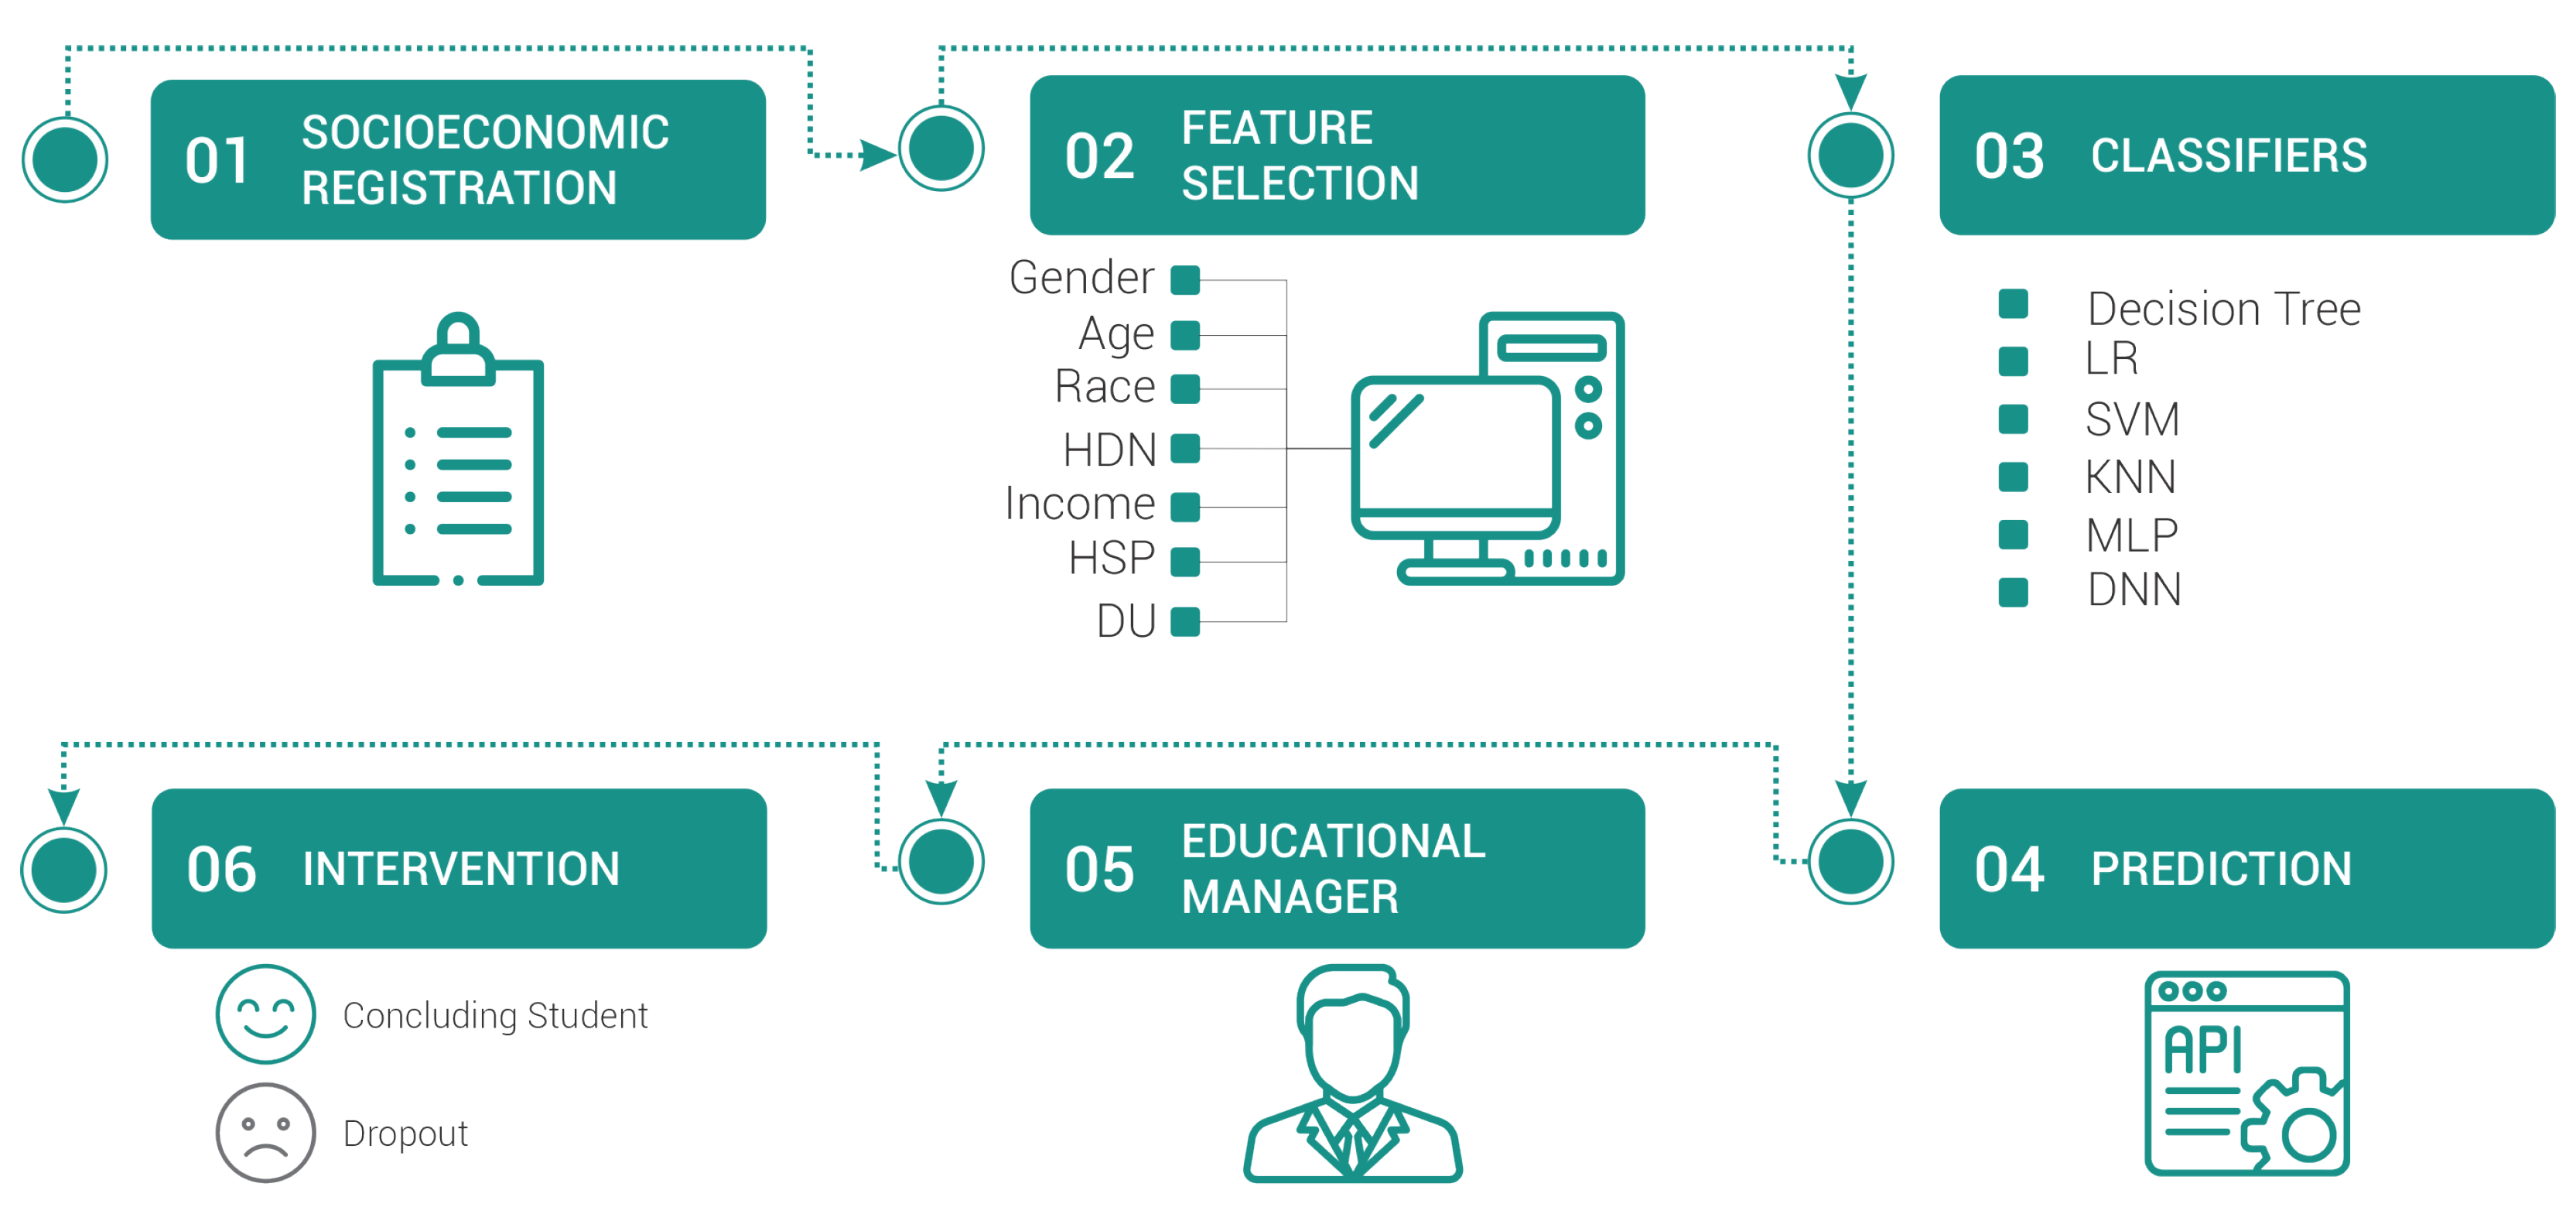
Figure 1 presents the diagram containing the steps to be developed according to the adopted methodology.
3.1. Data Acquisition
To obtain the socioeconomic records of the students, the database system of the Federal Institute of Education, Science, and Technology of Ceara (IFCE), campus Fortaleza, was used. The socioeconomic data were stored in the format Comma Separated Values (CSV). Most devices support this standard.
The analysis was performed using the database of four engineering courses from the Fortaleza campus: Civil, Computer, Mechatronics, and Telecommunications engineering. The databases used had the socioeconomic data from each student’s registration form. The information is from a historical base of the classes from 2008 to 2019 that have already closed. In total, there were 1549 records, of which 1318 were students who had completed the course, and 231 were dropout students.
The feature selection was carried out based on the students’ socioeconomic data provided in the pre-registration form. With these data, it is possible to build a model that can assist the manager’s decision-making in an attempt to reverse the new student’s possible evasion situation. The selected features were gender, age, race, human development index by neighborhood (HDIN), family income, high school provenance (HSP), and distance from university (DU). Validation of student dropout was obtained through academic records.
3.2. Preprocessing of Socioeconomic Data
Among the information of the selected students, there are two types of variables: continuous variables and categorical variables. Continuous variables had their values preserved.
Table 1 presents the continuous variables used as well as the maximum and minimum values they can assume.
On the other hand, categorical variables went through a process of assigning values to each of the classes they could assume.
Table 2,
Table 3 and
Table 4 present gender, race, and high school provenance data, respectively. Each table has the number of observed samples for each possibility of that specific feature and the respective percentage of dropout.
Table 2 presents the acquired data for gender. Male students presented a greater percentage of evasion from the engineering courses. This information reinforces the data collected by the census [
36], in which it corroborates that female students are more likely to complete the higher education course.
Table 3 shows the data related to students’ race. The Asian race had the highest percentage of school dropouts. This higher percentage was also reported in the survey carried out by the census [
36].
Table 4 shows the high school provenance of the students as well as the total number of students from each institution and the dropout percentage for each of these schools. Students from philanthropic institutions had the highest dropout rate within the analyzed data set. This higher percentage may be related to the difficulties that these institutions face. According to [
37], philanthropic institutions face difficulties such as finding funding, drawing up consistent proposals, raising funds, and managing organizations.
The values assigned to each class of the categorical variables correspond to the dropout percentage observed for that specific class. The only exception is the Income variable, where the assigned value was the average of salary ranges.
Table 5 presents the categorical variables, the classes each assumes, and the values assigned to each.
With the categorical values converted to numerical values, all the attributes were normalized between −1 and 1. Then, the attributes were concatenated to form the feature vector, as shown in
Table 6.
3.3. IoT Framework
For the selection and processing of data extracted from socioeconomic records, an IoT platform was created. This platform was developed using two main frameworks: one for data processing and dropout prediction and the other for interface creation, data storage, and communication between devices. The first system was developed using the Python language and is responsible for processing the socioeconomic records available in the web application and later predicting possible dropout. In addition, this system only comes into operation once requested by the Web application, which passes the information from the socioeconomic records and the classifiers that the user wants to apply. This system then performs the preprocessing of the submitted data, i.e., assignment of the values presented in
Table 5 to the categorical variables and further normalization of the feature vector between −1 and 1. Finally, the system passes this vector of attributes to the loaded model and shows the prediction made to the user who requested it.
The second part of the system was developed using Java and is the structure responsible for managing the service Web. This part manages the socioeconomic records information already available on the platform between different connected devices. To store this information, PostgreSQL was used, which is a free software and stores not only the information of the socioeconomic record but also the settings of the best classifiers used and the last queries made. These settings are made available through an easy-to-use interface where the user can modify the classifier settings or submit new socioeconomic records as needed.
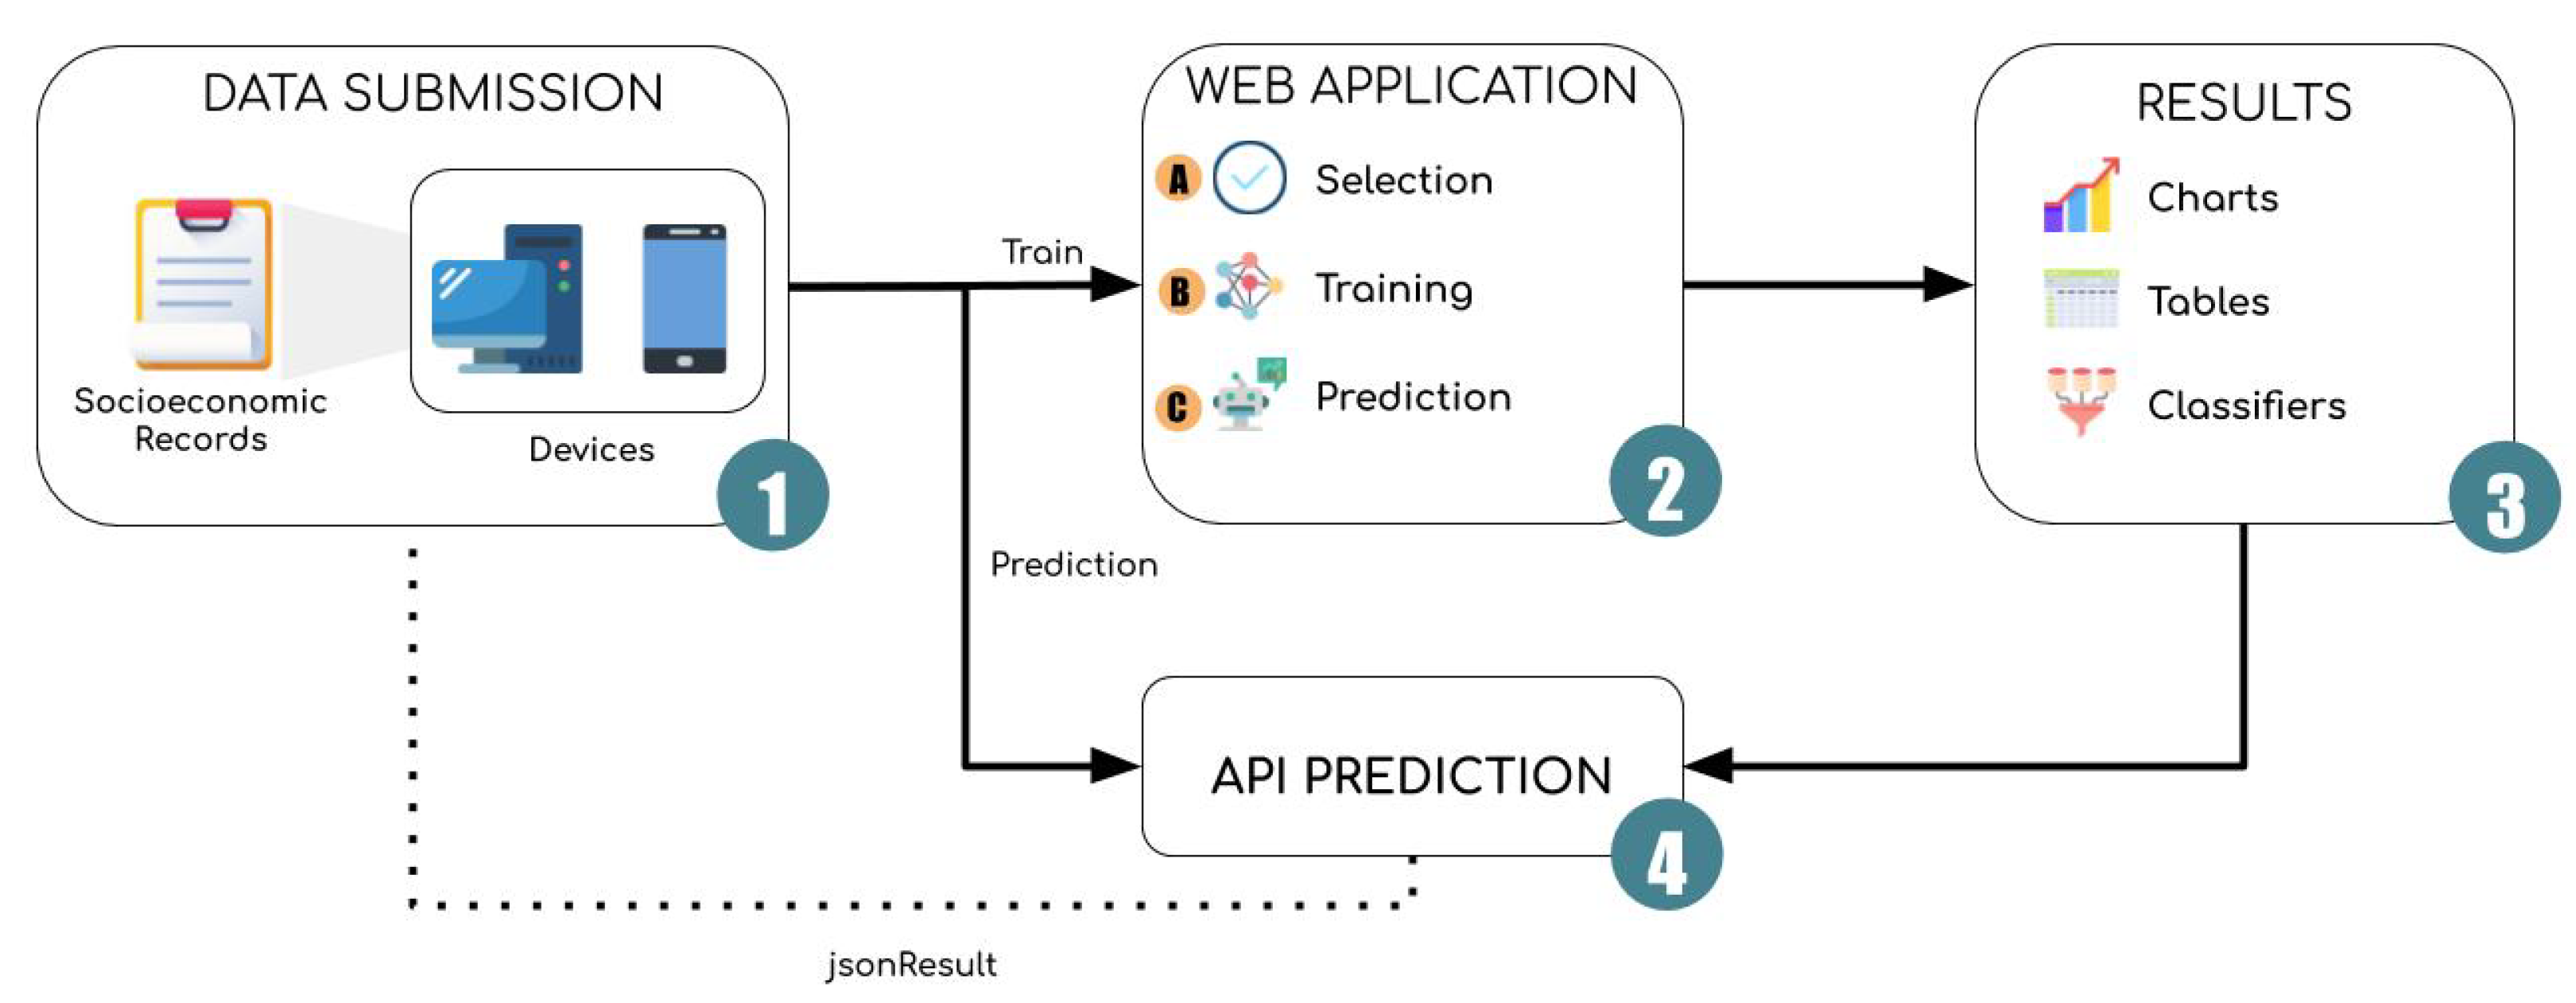
Figure 2 shows an overview of the processing methodology adopted.
The access interface is part of the system developed in Java and uses the Java Persistence API (JPA), Hibernate, and Java Server Faces (JSF) frameworks. After login to the platform, the user will be directed to a screen with two options: adjust the system configurations or analyze a socioeconomic record. If the option to analyze socioeconomic record is selected, the user will be given the option to upload the socioeconomic record they wish to analyze or analyze any record present in the database. After selecting the record to analyze, the answer will be displayed on the screen containing the student dropout probability and the time required for analysis.
To execute the process described, the API calls the prediction system and sends the socioeconomic data and a unique hash code of each user. The prediction system then performs data preprocessing, selects attributes, normalizes them between −1 and 1, makes the predictions, and, finally, presents the results obtained on the user’s device.
If, after login, the user selects to change the settings, they will be taken to a new screen with the configuration options of the classifiers, and if it is a user with higher permissions, he/she can also change the variables that will be extracted from the socioeconomic records and passed to the classifiers. This option, although not advised and not made available to inexperienced users, allows future tests to be performed to add new variables to the feature vector and may make the system even more robust. Furthermore, the user can also upload a new socioeconomic record base to the existing base and train a new model from the new set of socioeconomic records. This makes the system more robust and flexible.
The purpose of this platform is to provide educators with a simple machine learning tool to predict dropout that can be accessed through multiple devices and without the need for technical knowledge in the area. In addition, all the predictions and training are performed on the server, drastically reducing the time needed to receive a response. As more people use this tool, the system will be able to integrate different socioeconomic record bases among its users, allowing the system to evolve.
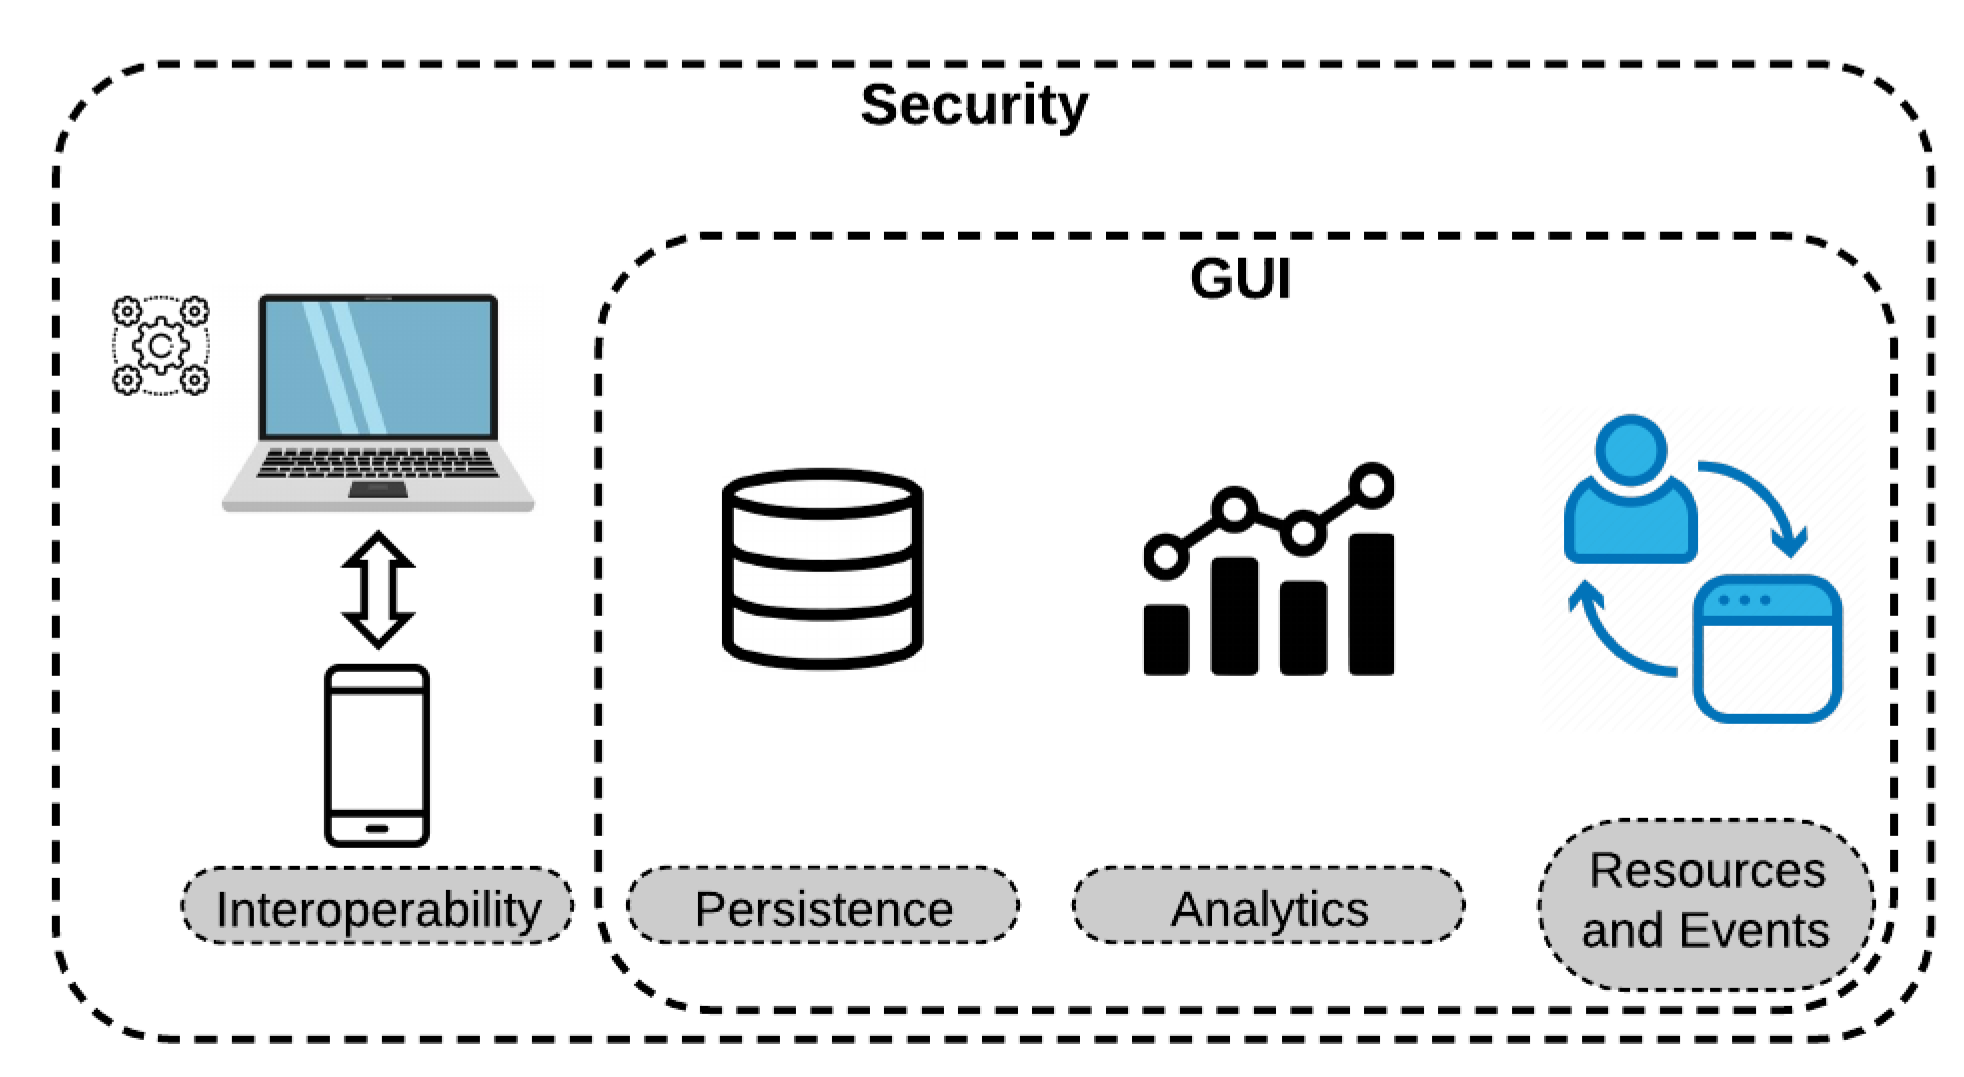
3.4. IoT System Architecture
The architecture of the IoT Framework was designed and divided into four fundamental parts. The first part is interoperability, which is a feature that enables communication and integration with multiple devices. The second part is the storage of system information, i.e., socioeconomic record data, classifier settings, and user information; this step is known as persistence and was implemented using PostgreSQL. The third part is responsible for performing the processing of socioeconomic data and predicting a possible dropout, called analytics. The last part, resource and events, is responsible for the user interaction with the system, where the user can upload the socioeconomic records, choose which classifiers will be used, as well as the configuration of each one, among other options.
Figure 3 presents the design of the system in layers. In all these layers, security is a priority and present in each. The interoperability layer is the only one that does not have an interface.
Besides the mentioned concepts, some other aspects were taken into consideration in the system implementation: availability, interoperability, and scalability.
Availability is a crucial feature of every web-based system, allowing the platform to be accessed at any time continuously. If the system stops, the requests made are queued for further processing when the system becomes available again.
Scalability allows a large number of users to access the platform simultaneously. This feature depends on the system being modularized, allowing processing to be performed in parallel and more efficiently. If the system was not modularized, there would be no way to manage a large volume of requests made by multiple users, as both the web part of the system and the data processing part would not be decoupled, and the information processing could not be parallelized.
Interoperability, as mentioned earlier, is critical to enabling communication and information exchange between different devices. This is a fundamental feature of all internet-connected devices, as efficient communication between them is required. The web system handles a variety of devices that is hard to count, and so tools are needed to handle these different devices. Fortunately, tools such as HyperText Markup Language (HTML) 5 and Cascade Style Sheets (CSS) 3 can handle this situation quickly and easily. It should also be noted that database access by external and unknown devices implies an even greater need for system security. For this, the information and data exchange was implemented using a JSON file and unique hash code per user, allowing a wide variety of different devices to connect and reducing the security risks that the system could have.
The system proposed in this work is undergoing tests for possible improvements. The platform will be made available free of charge to the studied institution’s managers and later to other institutions.
3.5. Metrics
For the evaluation of the proposed system, the accuracy, recall, precision, and F1 score metrics were used. All of these metrics are based on the confusion matrix, which is composed of True Positives (TP), True Negative (TN), False Negative (FN), and False Positive (FP).
Accuracy (
Acc) is a measure between the correctly classified records and the total number of samples.
Acc is defined in Equation (
1).
Recall measures the number of samples from a class that was correctly predicted to be of that class.
Recall is defined in Equation (
2).
Precision quantifies the number of predictions of a class that indeed belongs to that class.
Precision is defined in Equation (
3).
F1 score is a measure that computes the harmonic mean of
recall and
precision. Equation (
4) shows how the
F1 score is calculated.
4. Experiments
This section presents the results obtained using different classifiers. The dataset used consists of 1549 socioeconomic records, of which 1318 refer to students who have completed their course, and 231 correspond to students who drop out. The base was divided so that the same amount of training data from each class was equally distributed. Then, 80% of the concluding and dropout student socioeconomic records were used, and the rest of the samples were used for testing. The data set was normalized between −1 and 1.
The hardware used for testing in the server was a computer with an Intel Core-i7 processor with 2.5 GHz, 12 GB of RAM, and no Graphics Processing Unit (GPU).
The classifiers parameterization, as well as the obtained results, are presented in the following sections.
4.1. Classifiers Parameterization
In this work, the following classifiers were used for their different characteristics: Decision Tree [
38], Logistic Regression (LR) [
39], Support Vector Machines (SVM) [
40,
41], K-Nearest Neighbors (KNN) [
42,
43], Multi Layer Perceptron (MLP) [
44,
45], and Deep Neural Networks (DNN) [
46].
The Decision Tree used the entropy function to measure the quality of a division, always being ordered by the best division. LR was configured with an L2-norm. For SVM, the RBF kernel was used, with the C hyperparameter ranging from 0.1 to 10. A grid search ranging from 3 to 13 was performed to determine the k hyperparameter value in KNN. MLP hyperparameters were defined as the number of hidden layer neurons in the range of 5 neurons to 65 neurons with only one hidden layer. DNN was tested with 2 to 4 hidden layers, with each layer containing 2 neurons to 120 neurons. The learning rate was set to 0.3 with linear decay for both MLP and DNN.
The database was split randomly between train and test groups at 80% and 20%, respectively. All classifiers were trained using 10-fold cross-validation and were trained 50 times. The best results from each classifier were used.
4.2. Results Comparison
Table 7 presents the results obtained by each classifier. From
Table 7, it is evident that the Decision Tree obtained the best results in every metric analyzed. The Decision Tree achieved 99.34% accuracy and
F1 score, 100%
recall, and 98.69%
precision, surpassing DNN, which obtained the second-best result, by 1.57%, 1.59%, 3.13%, and 2.04% in accuracy,
F1 score, recall, and
precision, respectively. The Decision Tree and DNN were the only classifiers that obtained results higher than 90% in all metrics.
LR and SVM with RBF kernel showed poor results and, therefore, are not the best options to handle with the presented data. KNN and MLP also presented good results, reaching more than 90% in several metrics.
This work used socioeconomic data from students made available by IFCE—Fortaleza campus. No other work has used this basis, and therefore no direct comparison can be made. However,
Table 8 presents a comparison of the results obtained by the proposed method with different classifiers and the maximum accuracy obtained by other studies with each classifier.
As can be seen, the proposed method obtained considerably greater accuracy than the other methods. This better performance is because the proposed method uses attributes that the other works did not use or used only part of these attributes. The attributes used are gender, age, race, HDN, income, HSP, and DU. The transformation carried out from categorical attributes to continuous attributes using the percentage of evasion within each category was one reason why our method obtained better results since these data are quite relevant.
Another critical metric in machine learning applications is the time, not only during the training phase but also in the test. In IoT applications, this variable can become the main challenge due to the amount of information that is transmitted between different devices.
Table 9 presents both the training and the average sample test times. As shown, the Decision Tree, which obtained the best result in other metrics, had a low training time as well as test time.
5. Conclusions
This paper proposes an approach to detect and classify students at risk of dropping out based on their socioeconomic data. The IoT platform was designed to allow this task to be done online and from any internet-connected device without the need for technical knowledge from users. Machine learning methods were used to identify the possibility of dropping out, providing opportunities for school managers to take appropriate action to reverse a possible dropout.
Using the students’ pre-registration form’s socioeconomic data, it is possible to identify in advance the students with characteristics and profile most likely to drop out. These characteristics are important because they allow a preliminary assessment before the student even starts the course. Simultaneously, other methods only use academic performance during the course, delaying a possible action by the managers.
As stated, the Decision Tree presents itself as a viable alternative to accomplish this task because it has achieved the best results, reaching 99.34% accuracy, 99.34% F1 score, 100% recall, and 98.69% precision.
The proposal to have a system that can inform students more likely to drop out of school would directly impact managers’ actions and prevent school dropouts if the appropriate measures were applied at the beginning of the student’s course.
With this perspective, it is expected that the manager will monitor and supervise the students’ evasion risk due to the prediction returned by the system. With the proper monitoring of those responsible, the student would be less likely to evade. Thus, the rate of formation of higher education courses would increase, placing more qualified professionals on the market and contributing to the improvement of the region’s education and economy.
For future work, we intend to expand our system, developing it so that other socioeconomic data can also be incorporated. In addition, we intend to apply the same approach to larger databases from other universities.

 ,
, 


