Random Number Generator with Long-Range Dependence and Multifractal Behavior Based on Memristor


Abstract
1. Introduction
2. Related Work
3. Materials and Methods
3.1. Memristor
- The device must exhibit a pinched hysteresis loop in the voltage-current plane for some period of excitation signal.
- The area of the pinched hysteresis lobe should decrease monotonically with excitations of increments in frequency.
- The pinched hysteresis loop must shrink to a simple function value when the frequency tends to infinity.
3.2. Chaotic Systems
3.2.1. System 1
3.2.2. System 2
3.3. Random Number Generator (RNG)
3.4. NIST Tests
- The frequency (monobit) test;
- Frequency test within a block;
- The cumulative sums (cusums) test;
- The runs test;
- Tests for the longest-run-of-ones in a block;
- The binary matrix rank test;
- The discrete Fourier transform (spectral) test;
- The overlapping template matching test;
- Maurer’s “universal statistical” test;
- The approximate entropy test;
- The serial test;
- The linear complexity test;
- The random excursions test;
- The random excursions variant test;
- The non-overlapping template matching test.
3.5. Diagram Variance-Time
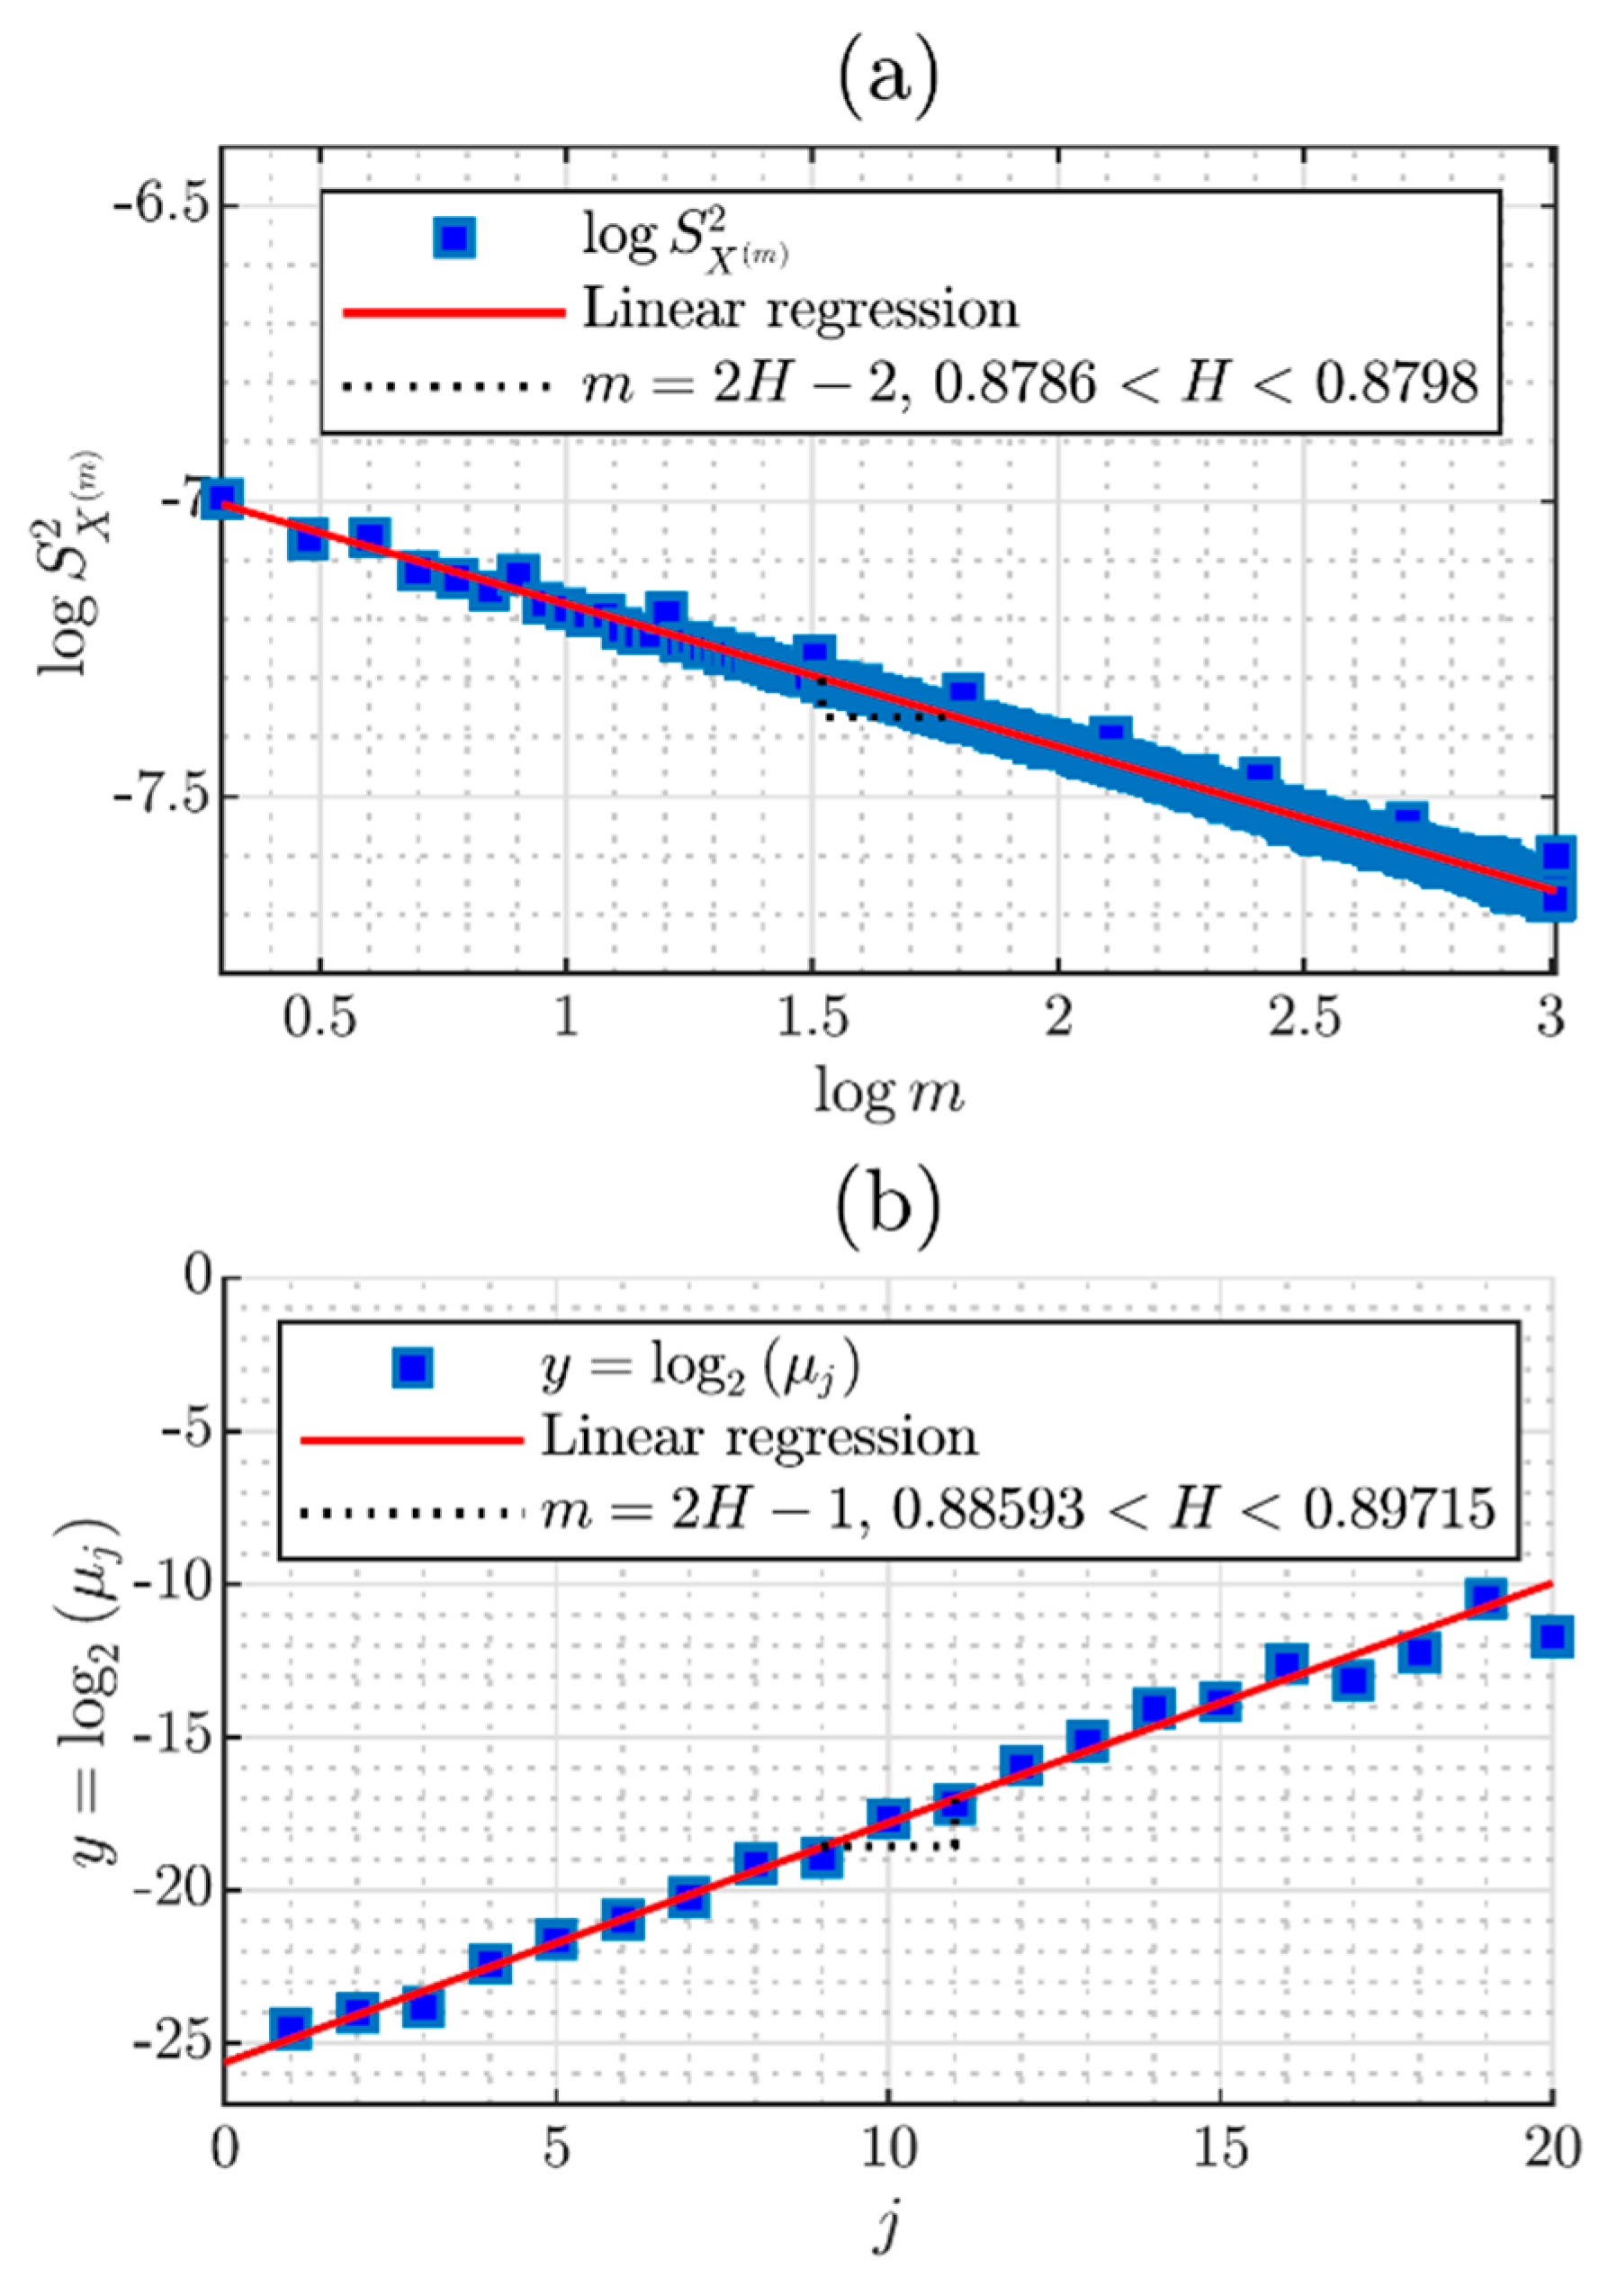
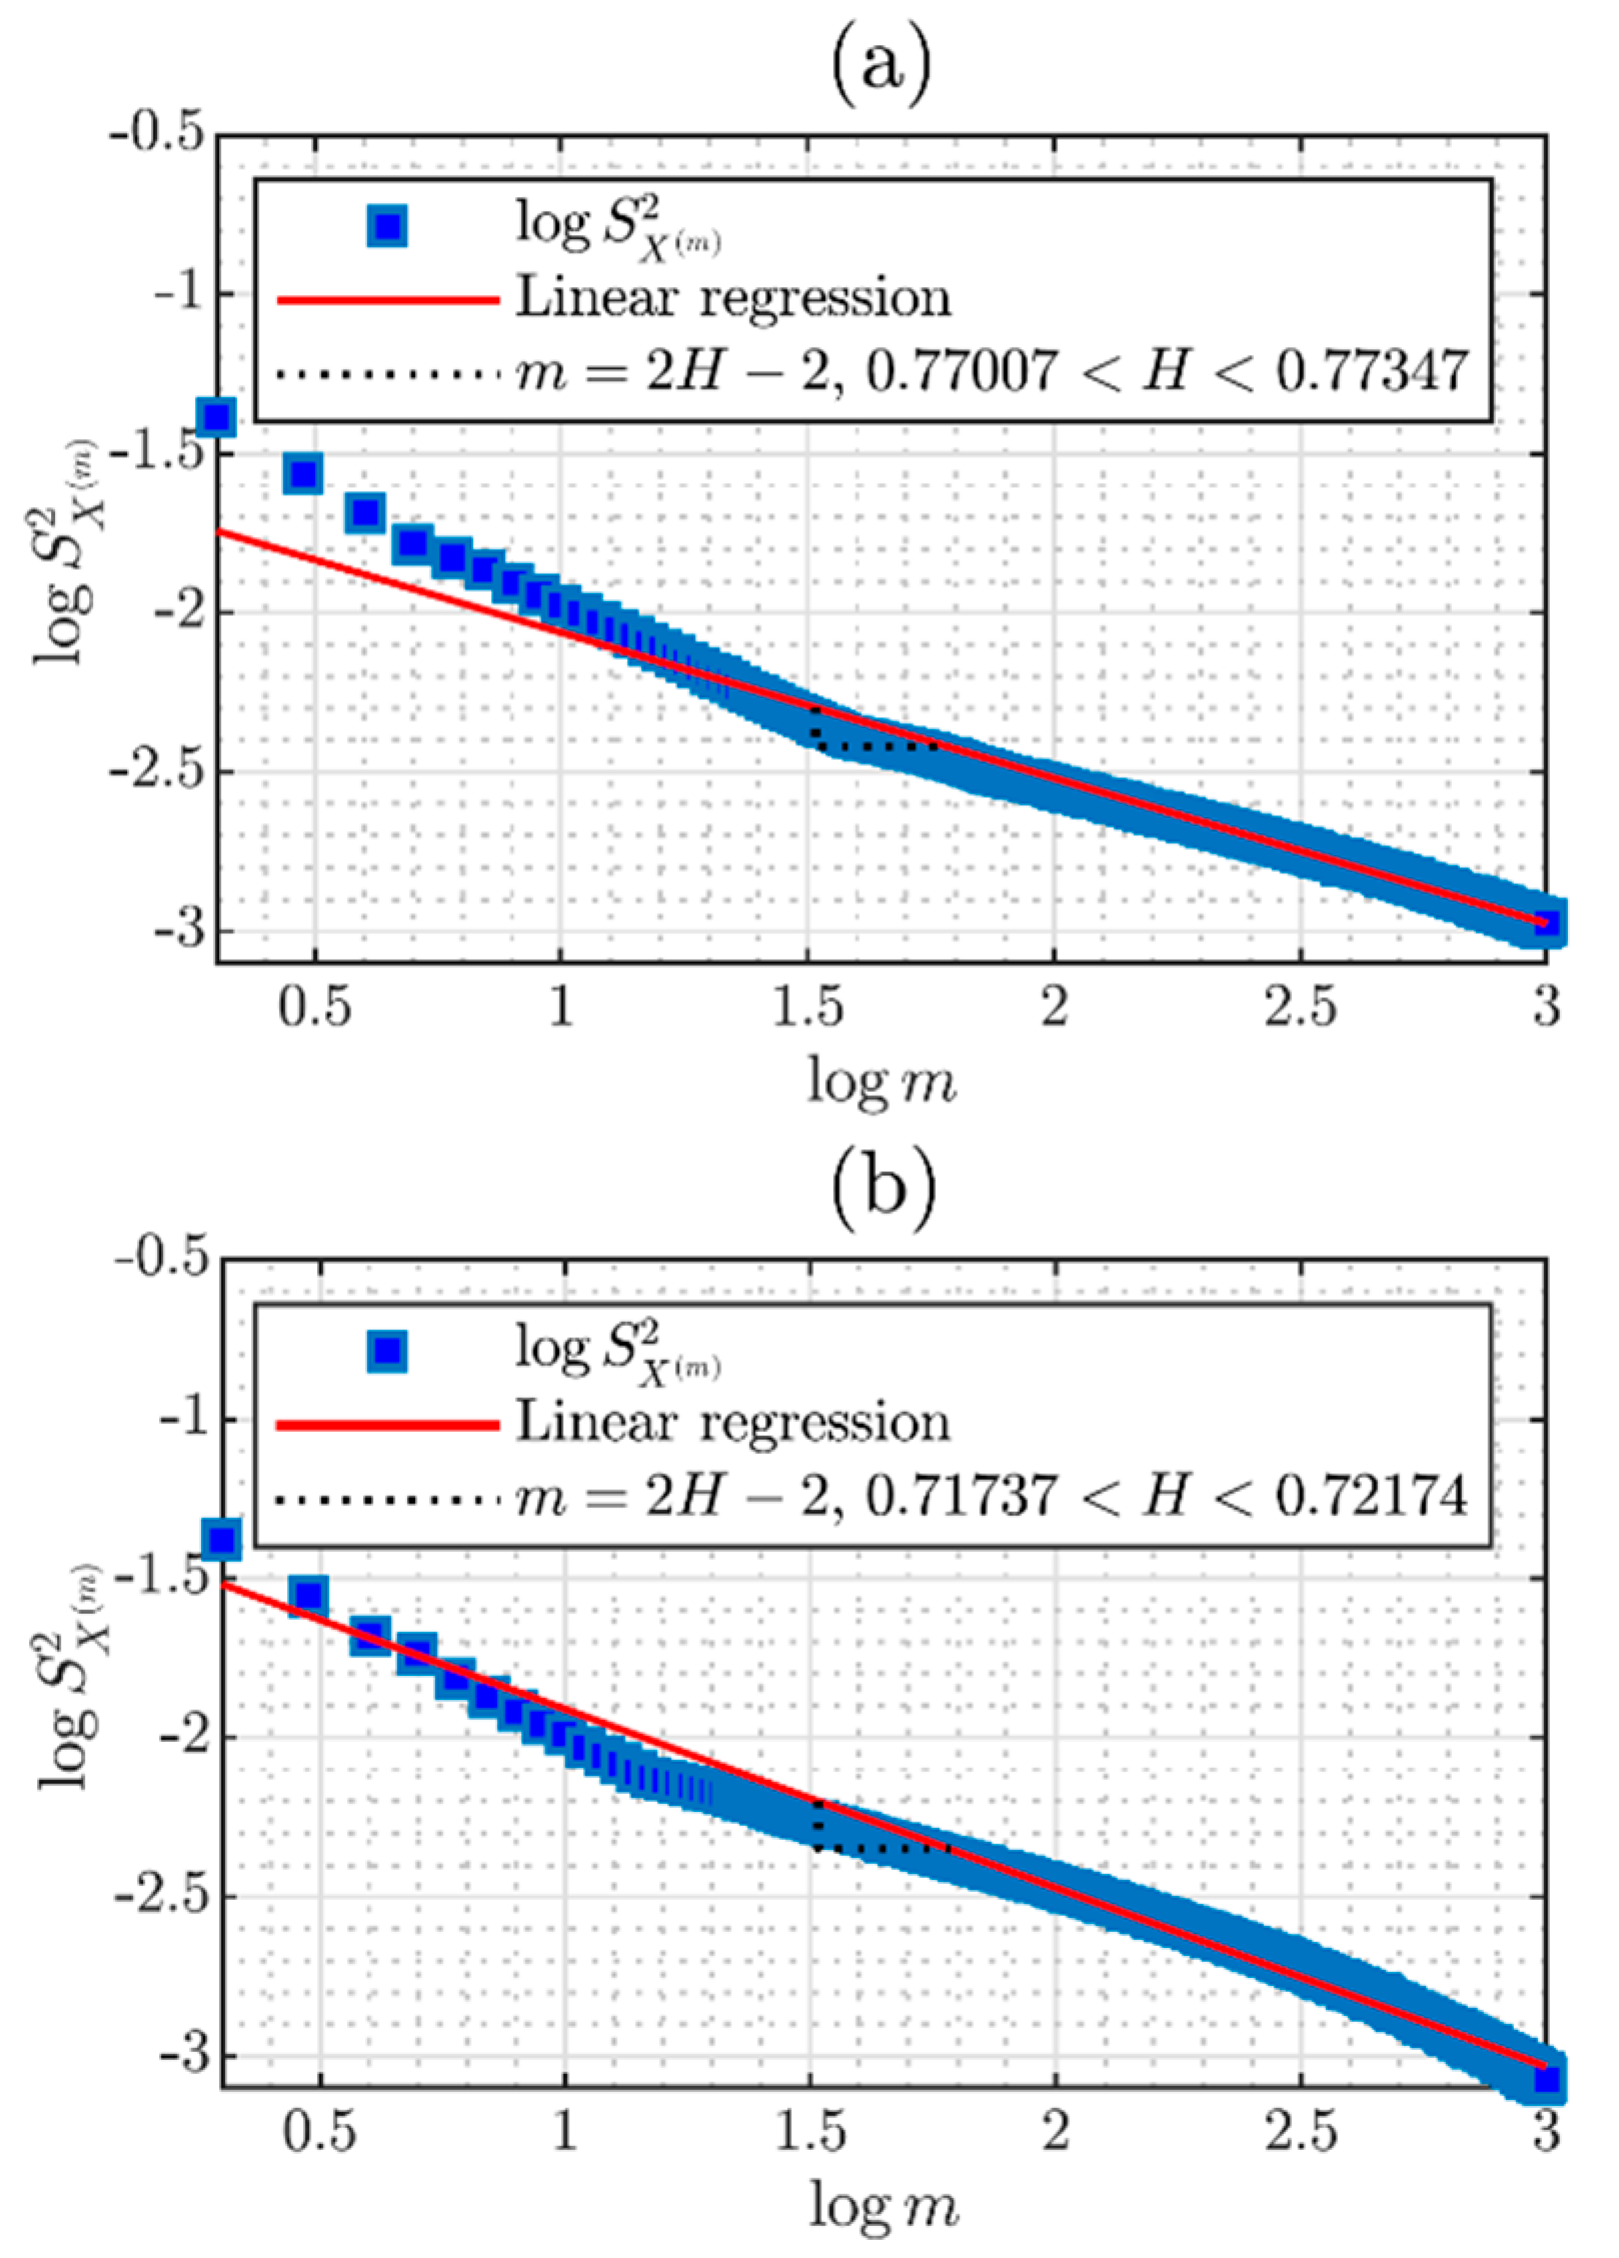
3.6. Diagram Log-Scale
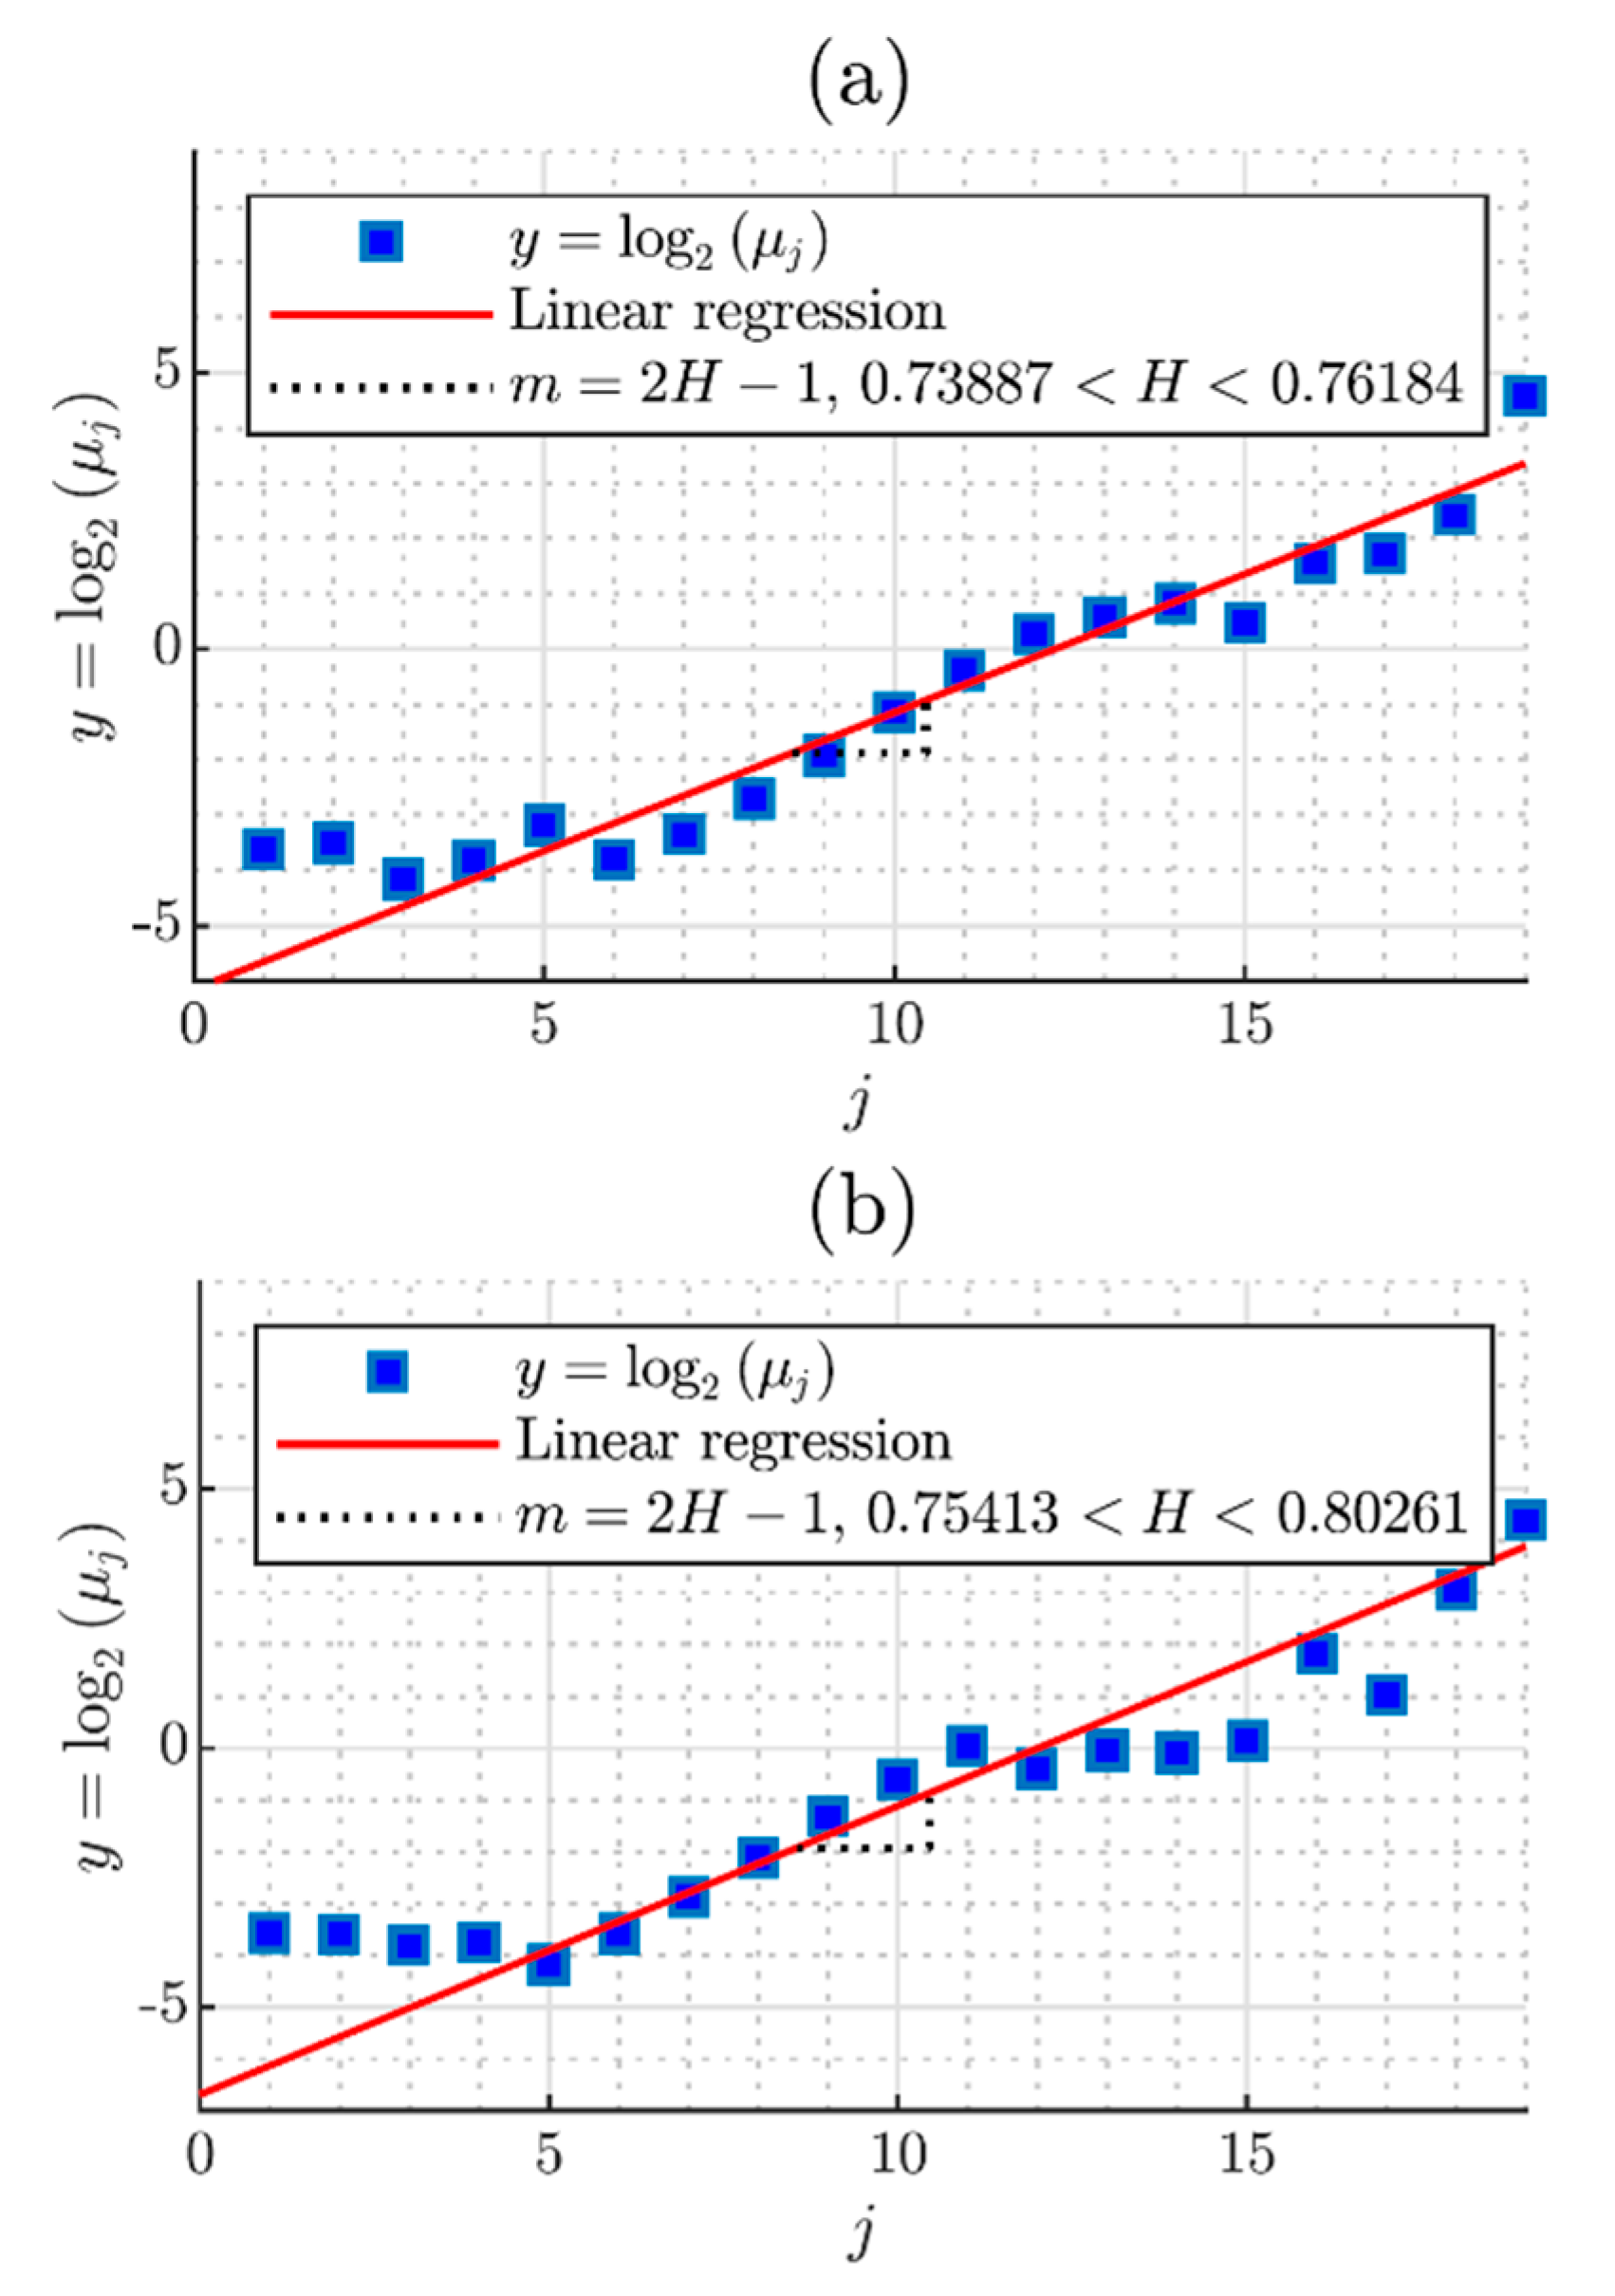
3.7. Multiscale Diagram and Linear Multiscale
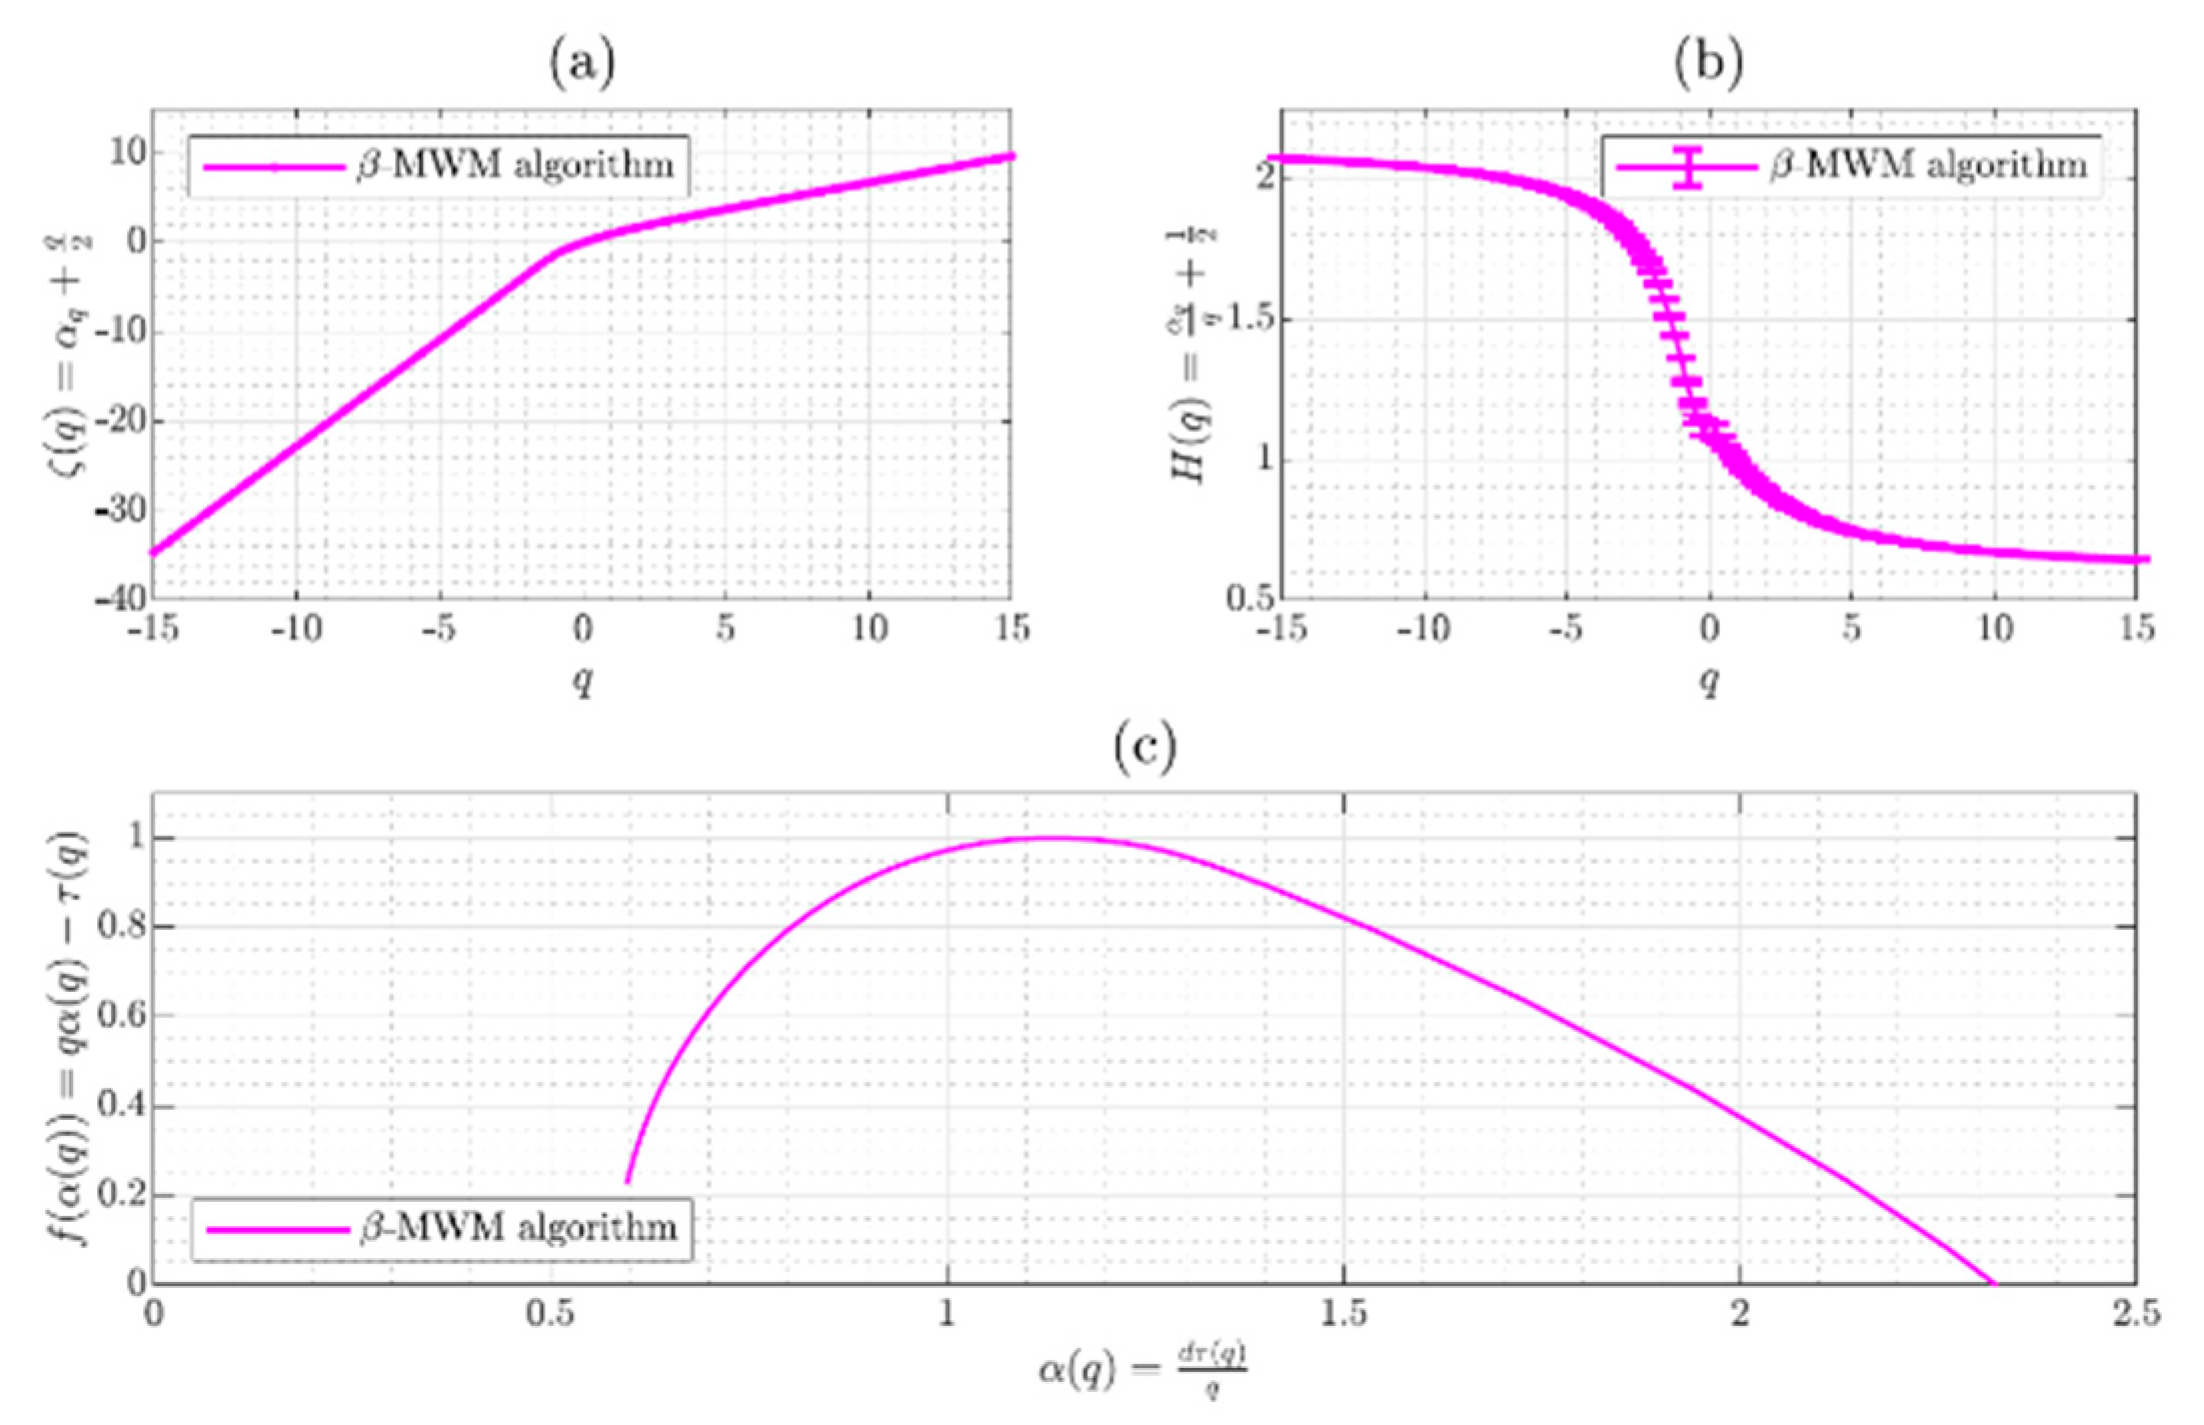
3.8. Multifractal Spectrum
3.9. Multiplicative Cascades
4. Results
4.1. Random Number Generator
4.2. Comparation with the Multiplicative Cascades
5. Conclusions
Author Contributions
Funding
Acknowledgments
Conflicts of Interest
References
- Ditto, W.; Munakata, T. Principles and applications of chaotic systems. Commun. ACM 1995, 38, 11. [Google Scholar] [CrossRef]
- Menezes, A.J.; Vanstone, S.A.; Oorschot, P.C.V. Handbook of Applied Cryptography; CRC Press, Inc.: Boca Raton, FL, USA, 1996; ISBN 0-8493-8523-7. [Google Scholar]
- Das, M.; Ghosh, S.K. Detection of climate zones using multifractal detrended cross-correlation analysis: A spatio-temporal data mining approach. In Proceedings of the 2015 Eighth International Conference on Advances in Pattern Recognition (ICAPR), Kolkata, India, 4–7 January 2015; pp. 1–6. [Google Scholar]
- Mandelbrot, B.; Hudson, R.L. The (Mis)behavior of Markets: A Fractal View of Financial Turbulence; Basic Book: New York, NY, USA, 2004; ISBN 978-0-465-04357-6. [Google Scholar]
- Wang, S.; Qiu, Z. A novel multifractal model of MPEG-4 video traffic. In Proceedings of the IEEE International Symposium on Communications and Information Technology, Beijing, China, 12–14 October 2005; ISCIT 2005. pp. 97–100. [Google Scholar] [CrossRef]
- Beran, J.; Taqqu, M.S.; Sherman, R.; Willinger, W. Long-Range Dependence in Variable-Bit-Rate Video Traffic. IEEE Trans. Commun. 1995, 43, 1566–1579. [Google Scholar] [CrossRef]
- Leland, W.E.; Taqqu, M.S.; Wilson, D.V. On the Self-Similar Nature of Ethernet Traffic (Extended Version). IEEE/ACM Trans. Netw. 1994, 2, 1–15. [Google Scholar] [CrossRef]
- ACM SIGCOMM. Traces Available in the Internet Traffic Archive. Available online: http://ita.ee.lbl.gov/html/traces.html (accessed on 20 May 2008).
- Riedi, R.H.; Vehel, L. Multifractal Properties of TCP Traffic: A Numerical Study. Available online: https://hal.inria.fr/inria-00073560/document (accessed on 20 January 2019).
- Riedi, R.H.; Crouse, M.S.; Ribeiro, V.J.; Baraniuk, R.G. A multifractal wavelet model with application to network traffic. IEEE Trans. Inf. Theory 1999, 45, 992–1018. [Google Scholar] [CrossRef]
- Feldmann, A.; Gilbert, A.; Willinger, W. Data Networks as Cascades: Investigating the Multifractal Nature of Internet WAN Traffic. In Proceedings of the ACM SIGCOMM ’98 Conference on Applications, Technologies, Architectures, and Protocols for Computer Communication, Vancouver, BC, Canada, 2–4 September 1998. [Google Scholar]
- Gao, J.; Rubin, I. Multifractal Analysis and Modelling of VBR Video Traffic. Electron. Lett. 2000, 36, 278–279. [Google Scholar] [CrossRef]
- Tuberquia-David, L.; López, H.; Hernández, C. Multifractal Model for Cognitive Radio Networks; Primera, Ed.; UDistrital: Bogotá, Colombia, 2019. [Google Scholar]
- Rangayyan, R.M. Biomedical Signal. Analysis, 2nd ed.; John Wiley & Sons Inc.: Hoboken, NJ, USA, 2015. [Google Scholar]
- McSharry, P.E.; Clifford, G.D.; Tarassenko, L.; Smith, L.A. A dynamical model for generating synthetic electrocardiogram signals. IEEE Trans. Biomed. Eng. 2003, 50, 289–294. [Google Scholar]
- López, H.I.; Alzate, M. Generation of LRD Traffic Traces with Given Sample Statistics. In Proceedings of the IEEE 2012 Workshop on Engineering Applications, Bogota, Columbia, 2–4 May 2012; pp. 1–6. [Google Scholar] [CrossRef]
- Akhmet, M.; Alejaily, E.M. Abstract similarity, fractals and chaos. Discret. Contin. Dyn. Syst. B 2017, 22, 1–19. [Google Scholar]
- Chua, L.O. Memristor—The Missing Circuit Element. IEEE Trans. Circuit Theory 1971, 18, 507–519. [Google Scholar] [CrossRef]
- Muthuswamy, B.; Chua, L.O. Simplest Chaotic Circuit. Int. J. Bifurc. Chaos 2010, 20, 1567–1580. [Google Scholar] [CrossRef]
- Cruz, J.M.; Chua, L.O. A CMOS IC Nonlinear Resistor for Chua’s Circuit. IEEE Trans. Circuits Syst. I Fundam. Theory. Appl. 1992, 39, 985–995. [Google Scholar] [CrossRef]
- Li, Y.; Zhao, L.; Chi, W.; Lu, S.; Huang, X. Implementation of a New Memristor Based Chaotic System. In Proceedings of the 2012 Fifth International Workshop on Chaos-fractals Theories and Applications, Dalian, China, 18–21 October 2012; pp. 92–96. [Google Scholar] [CrossRef]
- Li, Y.; Huang, X.; Guo, M. The generation, analysis, and circuit implementation of a new memristor based chaotic system. Math. Probl. Eng. 2013. [Google Scholar] [CrossRef]
- Yang, C.; Hu, Q.; Yu, Y.; Zhang, R.; Yao, Y.; Cai, J. Memristor-Based Chaotic Circuit for Text/Image Encryption and Decryption. In Proceedings of the 2015 8th International Symposium on Computational Intelligence and Design, ISCID, Hangzhou, China, 12–13 December 2015; pp. 447–450. [Google Scholar] [CrossRef]
- Tlelo-Cuautle, E.; Rangel-Magdaleno, J.; de la Fraga, L.G. Engineering Applications of FPGAs; Springer International Publishing: Cham, Switzerland, 2016; ISBN 978-3-319-34113-2. [Google Scholar]
- Corinto, F.; Krulikovskyi, O.V.; Haliuk, S.D. Memristor-based chaotic circuit for pseudo-random sequence generators. In Proceedings of the 18th Mediterranean Electrotechnical Conference: Intelligent and Efficient Technologies and Services for the Citizen, Lemesos, Cyprus, 18–20 April 2016; pp. 18–20. [Google Scholar] [CrossRef]
- Melgarejo, M.; Piraján, A. Diseño y realización hardware de un generador de números aleatorios. Rev. Ing. 2002, 7, 97–100. [Google Scholar]
- Li, X.; Cohen, A.B.; Murphy, T.E.; Roy, R. Scalable parallel physical random number generator based on a superluminescent LED. Opt. Lett. 2011. [Google Scholar] [CrossRef] [PubMed]
- Alzate Monroy, M.A. Uso de la Transformada Wavelet para el Estudio de Tráfico Fractal en Redes de Comunicaciones. Rev. Ing. 2002, 7, 11–24. [Google Scholar]
- Chen, H.C.H.; Cai, H.C.H.; Li, Y.L.Y. The multifractal property of bursty traffic and its parameter estimation based on wavelets. In Proceedings of the TENCON ’97 Brisbane—Australia. Proceedings of IEEE TENCON ’97. IEEE Region 10 Annual Conference. Speech and Image Technologies for Computing and Telecommunications (Cat. No.97CH36162), Brisbane, Queensland, Australia, 4 December 1997. [Google Scholar] [CrossRef]
- Shimizu, J. A Multifractal Traffic Generation Method using Wavelet and Volterra Filtering. In Proceedings of the IEEE International Symposium on Communications and Information Technology, 2004. ISCIT 2004, Sapporo, Japan, 26–29 October 2004. [Google Scholar] [CrossRef]
- Lashermes, B.; Jaffard, S.; Abry, P. Wavelet leader based multifractal analysis. In Proceedings of the ICASSP, IEEE International Conference on Acoustics, Speech and Signal Processing, Philadelphia, PA, USA, 23 March 2005. [Google Scholar]
- Tuberquia, M.; Vela, F.; López, H.; Hernández, C. A multifractal wavelet model for the generation of long-range dependency traffic traces with adjustable parameters. Expert Syst. Appl. 2016, 62, 373–384. [Google Scholar] [CrossRef]
- Park, K.; Willinger, W. Self-Similar Network Traffic and Performance Evaluation; John Wiley and Sons: Hoboken, NJ, USA, 2000. [Google Scholar]
- Abry, P.; Flandrin, P.; Taqqu, M.S.; Veitch, D. Wavelets for the Analysis, Estimation, and Synthesis of Scaling Data. In Self-Similar Network Traffic and Performance Evaluation; John Wiley & Sons, Inc.: New York, NY, USA, 2000; pp. 39–88. [Google Scholar]
- Abry, P.; Gonçalves, P.; Véhel, J.L. Scaling, Fractals and Wavelets; ISTE: London, UK, 2009; ISBN 978-0-470-61156-2. [Google Scholar]
- Sheluhin, O.I.; Smolskiy, S.M.; Osin, A.V. Principal Concepts of Fractal Theory and Self-Similar Processes. In Self-similar Processes in Telecomunications; John Wiley & Sons Ltd.: Chichester, UK, 2007; pp. 1–47. ISBN 978-0-470-01486-8. [Google Scholar]
- Feder, J. Fractals; Springer: Boston, MA, USA, 1988; ISBN 978-1-4899-2126-0. [Google Scholar]
- Radwan, A.G.; Fouda, M.E. On the Mathematical Modeling of Memristor, Memcapacitor, and Meminductor; Studies in Systems, Decision and Control; Springer International Publishing: Cham, Switzerland, 2015; Volume 26, ISBN 978-3-319-17490-7. [Google Scholar]
- Widrow, B. An Adaptive “Adaline” Neuron Using Chemical “Memistors”. Stanford Electronics Laboratories Technical Report 1553-2. 1960. ISBN Technical Report No. 1553-2. Available online: https://isl.stanford.edu/~widrow/papers/t1960anadaptive.pdf (accessed on 20 January 2019).
- Adhikari, S.P.; Sah, M.P.; Kim, H.; Chua, L.O. Three fingerprints of memristor. IEEE Trans. Circuits Syst. I Regul. Pap. 2013. [Google Scholar] [CrossRef]
- Biolek, D.; Biolek, Z.; Biolkova, V.; Kolka, Z. Some fingerprints of ideal memristors. In Proceedings of the 2013 IEEE International Symposium on Circuits and Systems (ISCAS2013), Beijing, China, 19–23 May 2013; pp. 201–204. [Google Scholar]
- Talukdar, A.; Radwan, A.G.; Salama, K.N. Time domain oscillating poles: Stability redefined in Memristor based Wien-oscillators. In Proceedings of the Proceedings of the International Conference on Microelectronics, ICM, Cairo, Egypt, 19–22 December 2010. [Google Scholar]
- Talukdar, A.; Radwan, A.G.; Salama, K.N. Generalized model for Memristor-based Wien family oscillators. Microelectron. J. 2011. [Google Scholar] [CrossRef]
- Talukdar, A.; Radwan, A.G.; Salama, K.N. Non linear dynamics of memristor based 3rd order oscillatory system. Microelectron. J. 2012. [Google Scholar] [CrossRef]
- Shin, S.S.S.; Kim, K.K.K.; Kang, S.-M.K.S.-M. Memristor-based fine resolution programmable resistance and its applications. 2009 Int. Conf. Commun. Circuits Syst. 2009. [Google Scholar] [CrossRef]
- Kozma, R.; Pino, R.E.; Pazienza, G.E. Are Memristors the Future of AI? In Advances in Neuromorphic Memristor Science and Applications; Springer: Dordrecht, The Netherlands, 2012; pp. 9–14. ISBN 978-94-007-4491-2. [Google Scholar]
- Driscoll, T.; Quinn, J.; Klein, S.; Kim, H.T.; Kim, B.J.; Pershin, Y.V.; Di Ventra, M.; Basov, D.N. Memristive adaptive filters. Appl. Phys. Lett. 2010. [Google Scholar] [CrossRef]
- Pershin, Y.V.; Di Ventra, M. Experimental demonstration of associative memory with memristive neural networks. Neural Netw. 2010. [Google Scholar] [CrossRef] [PubMed]
- Hu, Q.; Yu, Y.; Men, L.; Lei, F.; Zhang, H. Memristor-based chaotic circuit design on image En/decryption. In Proceedings of the 2016 31st Youth Academic Annual Conference of Chinese Association of Automation, YAC, Wuhan, China, 11–13 November 2016; pp. 56–60. [Google Scholar]
- Rukhin, A.; Soto, J.; Nechvatal, J.; Smid, M.; Barker, E.; Leigh, S.; Levenson, M.; Vangel, M.; Banks, D.; Heckert, A.; et al. A Statistical Test. Suite for Random and Pseudorandom Number Generators for Cryptographic Applications; Lawrence E Bassham III; Special Publication 800-22 Revision 1a; National Institute of Standards & Technology: Gaithersburg, MD, USA, 2010. [Google Scholar]
- Barker, E.; Bassham, L. Random Bit Generation; Institute of standards and technology: Gaithersburg, MD, USA, 2018. [Google Scholar]
- Kant, K. On aggregate traffic generation with multifractal properties. Globecom 1999, 1179–1183. [Google Scholar] [CrossRef]
- Chen, Y. Zipf’s law,1/f noise, and fractal hierarchy. ChaosSolitons Fractals 2012, 45, 63–73. [Google Scholar] [CrossRef]
- Ihlen, E.A.F. Introduction to Multifractal Detrended Fluctuation Analysis in Matlab. Front. Physiol. 2012, 3. [Google Scholar] [CrossRef] [PubMed]
- Canavos, G. Algunas distribuciones continuas de probabilidad. In Probabilidad y Estadistica Aplicaciones y Métodos; McGraw-Hill: Ciudad de Mexico, Mexico, 1998; pp. 130–184. ISBN 978-968-451-856-8. [Google Scholar]
- Standards, M.; Society, C. IEEE Std 754-2008, IEEE Standard for Floating-Point Arithmetic (Revision of IEEE Std 754-1985). IEEE Comput. Soc. 2008, 1–58. [Google Scholar] [CrossRef]


| Test | Parameter |
|---|---|
| p2 | M = 10,500 |
| p8 | m = 5 |
| p10 | m = 6 |
| p11 | m = 2 |
| p12 | M = 500 |
| p13 | x = +1 |
| p14 | x = +1 |
| Interval H | 0.5 < H < 0.6 | 0.6 < H < 0.7 | 0.7 < H < 0.8 | 0.8 < H < 0.9 | ||||||||
|---|---|---|---|---|---|---|---|---|---|---|---|---|
| Parameter H | 0.5218 | 0.5756 | 0.651 | 0.6757 | 0.6913 | 0.7196 | 0.7738 | 0.7958 | 0.8171 | 0.8253 | ||
| RNG Param | b | 8 | 16 | 12 | 16 | 10 | 8 | 0 | 8 | 0 | 0 | Approval rate |
| N | 8 | 8 | 8 | 10 | 10 | 12 | 12 | 10 | 10 | 10 | ||
| M | 4 | 7 | 7 | 9 | 8 | 10 | 9 | 10 | 8 | 9 | ||
| NIST Tests | p1 | 0.3638 | 0.0784 | 0.0000 | 0.6369 | 0.0000 | 0.0341 | 0.1795 | 0.3756 | 0.4629 | 0.0000 | 7/10 |
| p2 | 0.7665 | 0.6337 | 0.0000 | 0.0002 | 0.0000 | 0.0000 | 0.0000 | 0.0000 | 0.0000 | 0.0000 | 2/10 | |
| p3 | 0.4384 | 0.1069 | 0.0000 | 0.4135 | 0.0000 | 0.2635 | 0.0310 | 0.0000 | 0.0120 | 0.0000 | 6/10 | |
| p4 | 0.0000 | 0.0169 | 0.0000 | 0.4853 | 0.0000 | 0.9980 | 0.0000 | 0.0000 | 0.1137 | 0.0000 | 4/10 | |
| p5 | 0.0000 | 0.0002 | 0.0000 | 0.0580 | 0.0000 | 0.0578 | 0.2928 | 0.0000 | 0.0000 | 0.0000 | 3/10 | |
| p6 | 0.7192 | 0.4932 | 0.4457 | 0.3003 | 0.0000 | 0.3979 | 0.6861 | 0.0000 | 0.0000 | 0.0000 | 6/10 | |
| p7 | 0.0000 | 0.0000 | 0.0000 | 0.0000 | 0.0000 | 0.0000 | 0.0000 | 0.0000 | 0.0000 | 0.0000 | 0/10 | |
| p8 | 0.9999 | 0.9999 | 0.0000 | 0.0000 | 0.0000 | 0.0000 | 0.0000 | 0.0000 | 0.0000 | 0.0000 | 2/10 | |
| p9 | 0.0000 | 0.0000 | 0.0000 | 0.1358 | 0.0000 | 0.0000 | 0.0000 | 0.0000 | 0.0000 | 0.0000 | 1/10 | |
| p10 | 0.0000 | 0.0000 | 0.0000 | 0.0000 | 0.0000 | 0.0108 | 0.0001 | 0.0000 | 0.0000 | 0.0000 | 1/10 | |
| p11 | 0.0000 | 0.0123 | 0.0000 | 0.7001 | 0.0000 | 0.1061 | 0.1527 | 0.0000 | 0.2178 | 0.0000 | 5/10 | |
| p12 | 0.8905 | 0.1969 | 0.5713 | 0.5318 | 0.0605 | 0.6755 | 0.1527 | 0.2339 | 0.2952 | 0.5528 | 10/10 | |
| p13 | 0.3062 | 0.8364 | 0.7000 | 0.3845 | 0.0553 | 0.4942 | 0.8007 | 0.4128 | 0.4972 | 0.5544 | 10/10 | |
| p14 | 0.2602 | 0.7119 | 0.8875 | 0.5600 | 0.6490 | 0.2850 | 0.8162 | 0.0453 | 0.6462 | 0.7806 | 10/10 | |
| Total tests approved | 8/14 | 10/14 | 4/14 | 10/14 | 3/14 | 10/14 | 8/14 | 4/14 | 7/14 | 3/14 | ||
| Interval H | 0.5 < H < 0.6 | 0.6 < H < 0.7 | 0.7 < H < 0.8 | 0.8 < H < 0.9 | ||||||||
|---|---|---|---|---|---|---|---|---|---|---|---|---|
| Parameter H | 0.5458 | 0.5998 | 0.6666 | 0.6726 | 0.6938 | 0.7456 | 0.7718 | 0.7845 | 0.8104 | 0.8614 | ||
| RNG Param. | B | 12 | 16 | 8 | 8 | 10 | 8 | 8 | 8 | 16 | 0 | Approval rate |
| N | 12 | 16 | 12 | 16 | 16 | 10 | 16 | 12 | 12 | 10 | ||
| M | 3 | 9 | 5 | 9 | 11 | 5 | 13 | 9 | 9 | 6 | ||
| NIST Tests | p1 | 0.5286 | 0.0000 | 0.0000 | 0.0010 | 0.0074 | 0.0000 | 0.0185 | 0.0000 | 0.0000 | 0.0000 | 2/10 |
| p2 | 0.0000 | 0.0046 | 0.0000 | 0.0000 | 0.0000 | 0.0000 | 0.0000 | 0.0000 | 0.0000 | 0.0000 | 0/10 | |
| p3 | 0.1292 | 0.0079 | 0.0000 | 0.0015 | 0.0020 | 0.0000 | 0.0020 | 0.0000 | 0.0000 | 0.0000 | 1/10 | |
| p4 | 0.7436 | 0.5809 | 0.0000 | 0.1419 | 0.0262 | 0.0000 | 0.1488 | 0.0000 | 0.0000 | 0.0000 | 5/10 | |
| p5 | 0.0000 | 0.2046 | 0.1259 | 0.4249 | 0.5282 | 0.0497 | 0.4171 | 0.0035 | 0.0000 | 0.0000 | 6/10 | |
| p6 | 0.0686 | 0.8804 | 0.8603 | 0.0413 | 0.4437 | 0.0022 | 0.2841 | 0.8427 | 0.0508 | 0.0000 | 7/10 | |
| p7 | 0.0000 | 0.0034 | 0.0000 | 0.0000 | 0.0000 | 0.0000 | 0.0000 | 0.0000 | 0.0000 | 0.0000 | 0/10 | |
| p8 | 0.0000 | 0.0000 | 0.0000 | 0.0000 | 0.0000 | 0.0000 | 0.0000 | 0.0000 | 0.0000 | 0.0000 | 0/10 | |
| p9 | 0.0000 | 0.7511 | 0.0000 | 0.5834 | 0.5741 | 0.0000 | 0.0022 | 0.0000 | 0.0000 | 0.0000 | 3/10 | |
| p10 | 0.0000 | 0.1902 | 0.0001 | 0.0441 | 0.0085 | 0.0000 | 0.0000 | 0.0000 | 0.0000 | 0.0000 | 2/10 | |
| p11 | 0.7349 | 0.0155 | 0.0148 | 0.1453 | 0.0266 | 0.7398 | 0.0223 | 0.1713 | 0.0000 | 0.0283 | 9/10 | |
| p12 | 0.8879 | 0.7832 | 0.6853 | 0.6494 | 0.6990 | 0.0206 | 0.3344 | 0.6419 | 0.9085 | 0.0000 | 9/10 | |
| p13 | 1835 | 0.7439 | 0.0700 | 0.8801 | 0.9194 | 0.0752 | 0.2596 | 0.4906 | 0.4964 | 0.2667 | 10/10 | |
| p14 | 0.3337 | 0.5930 | 0.2636 | 10.000 | 0.5023 | 0.1336 | 0.0868 | 0.6817 | 0.3428 | 0.5930 | 10/10 | |
| Total tests approved | 8/14 | 9/14 | 6/14 | 9/14 | 8/14 | 5/14 | 8/14 | 4/14 | 4/14 | 3/14 | ||
| System 1 | |||
|---|---|---|---|
| Combinations | Result | ||
| Bits | n | m | - |
| 8 | 8 | 4 | ∩ |
| 16 | 8 | 3 | • |
| 16 | 10 | 9 | ∩ |
| 12 | 8 | 7 | • |
| 10 | 10 | 8 | • |
| 8 | 12 | 10 | ∩ |
| 0 | 12 | 9 | • |
| 8 | 10 | 10 | ∩ |
| 0 | 10 | 8 | • |
| 0 | 10 | 9 | • |
| System 2 | |||
|---|---|---|---|
| Combinations | Result | ||
| Bits | n | m | - |
| 12 | 12 | 3 | ∩ |
| 16 | 16 | 9 | • |
| 8 | 12 | 5 | • |
| 8 | 16 | 9 | • |
| 10 | 16 | 11 | • |
| 8 | 10 | 5 | • |
| 8 | 16 | 13 | • |
| 8 | 12 | 9 | • |
| 16 | 16 | 15 | • |
| 0 | 10 | 6 | ∩ |
| Parameter H | 0.8792 | |
|---|---|---|
| NIST Tests | p1 | 0.0000 |
| p2 | 0.0000 | |
| p3 | 0.0000 | |
| p4 | 0.0000 | |
| p5 | 0.0000 | |
| p6 | 0.0000 | |
| p7 | 0.0000 | |
| p8 | 0.0000 | |
| p9 | 0.0000 | |
| p10 | 0.0000 | |
| p11 | 0.0000 | |
| p12 | 0.0000 | |
| p13 | 0.1051 | |
| p14 | 0.8744 | |
| Total approved tests | 2/14 | |
© 2020 by the authors. Licensee MDPI, Basel, Switzerland. This article is an open access article distributed under the terms and conditions of the Creative Commons Attribution (CC BY) license (http://creativecommons.org/licenses/by/4.0/).
Share and Cite
Téllez, M.; Mejía, J.; López, H.; Hernández, C. Random Number Generator with Long-Range Dependence and Multifractal Behavior Based on Memristor. Electronics 2020, 9, 1607. https://doi.org/10.3390/electronics9101607
Téllez M, Mejía J, López H, Hernández C. Random Number Generator with Long-Range Dependence and Multifractal Behavior Based on Memristor. Electronics. 2020; 9(10):1607. https://doi.org/10.3390/electronics9101607
Chicago/Turabian StyleTéllez, María, Johan Mejía, Hans López, and Cesar Hernández. 2020. "Random Number Generator with Long-Range Dependence and Multifractal Behavior Based on Memristor" Electronics 9, no. 10: 1607. https://doi.org/10.3390/electronics9101607
APA StyleTéllez, M., Mejía, J., López, H., & Hernández, C. (2020). Random Number Generator with Long-Range Dependence and Multifractal Behavior Based on Memristor. Electronics, 9(10), 1607. https://doi.org/10.3390/electronics9101607