Variability of Muscular Recruitment in Hemiplegic Walking Assessed by EMG Analysis

 ,
,  ,
, 
 , and
, and 
Abstract
1. Introduction
2. Indices for sEMG Variability Analysis
3. Material and Methods
3.1. Participants
3.2. Measurement Chain
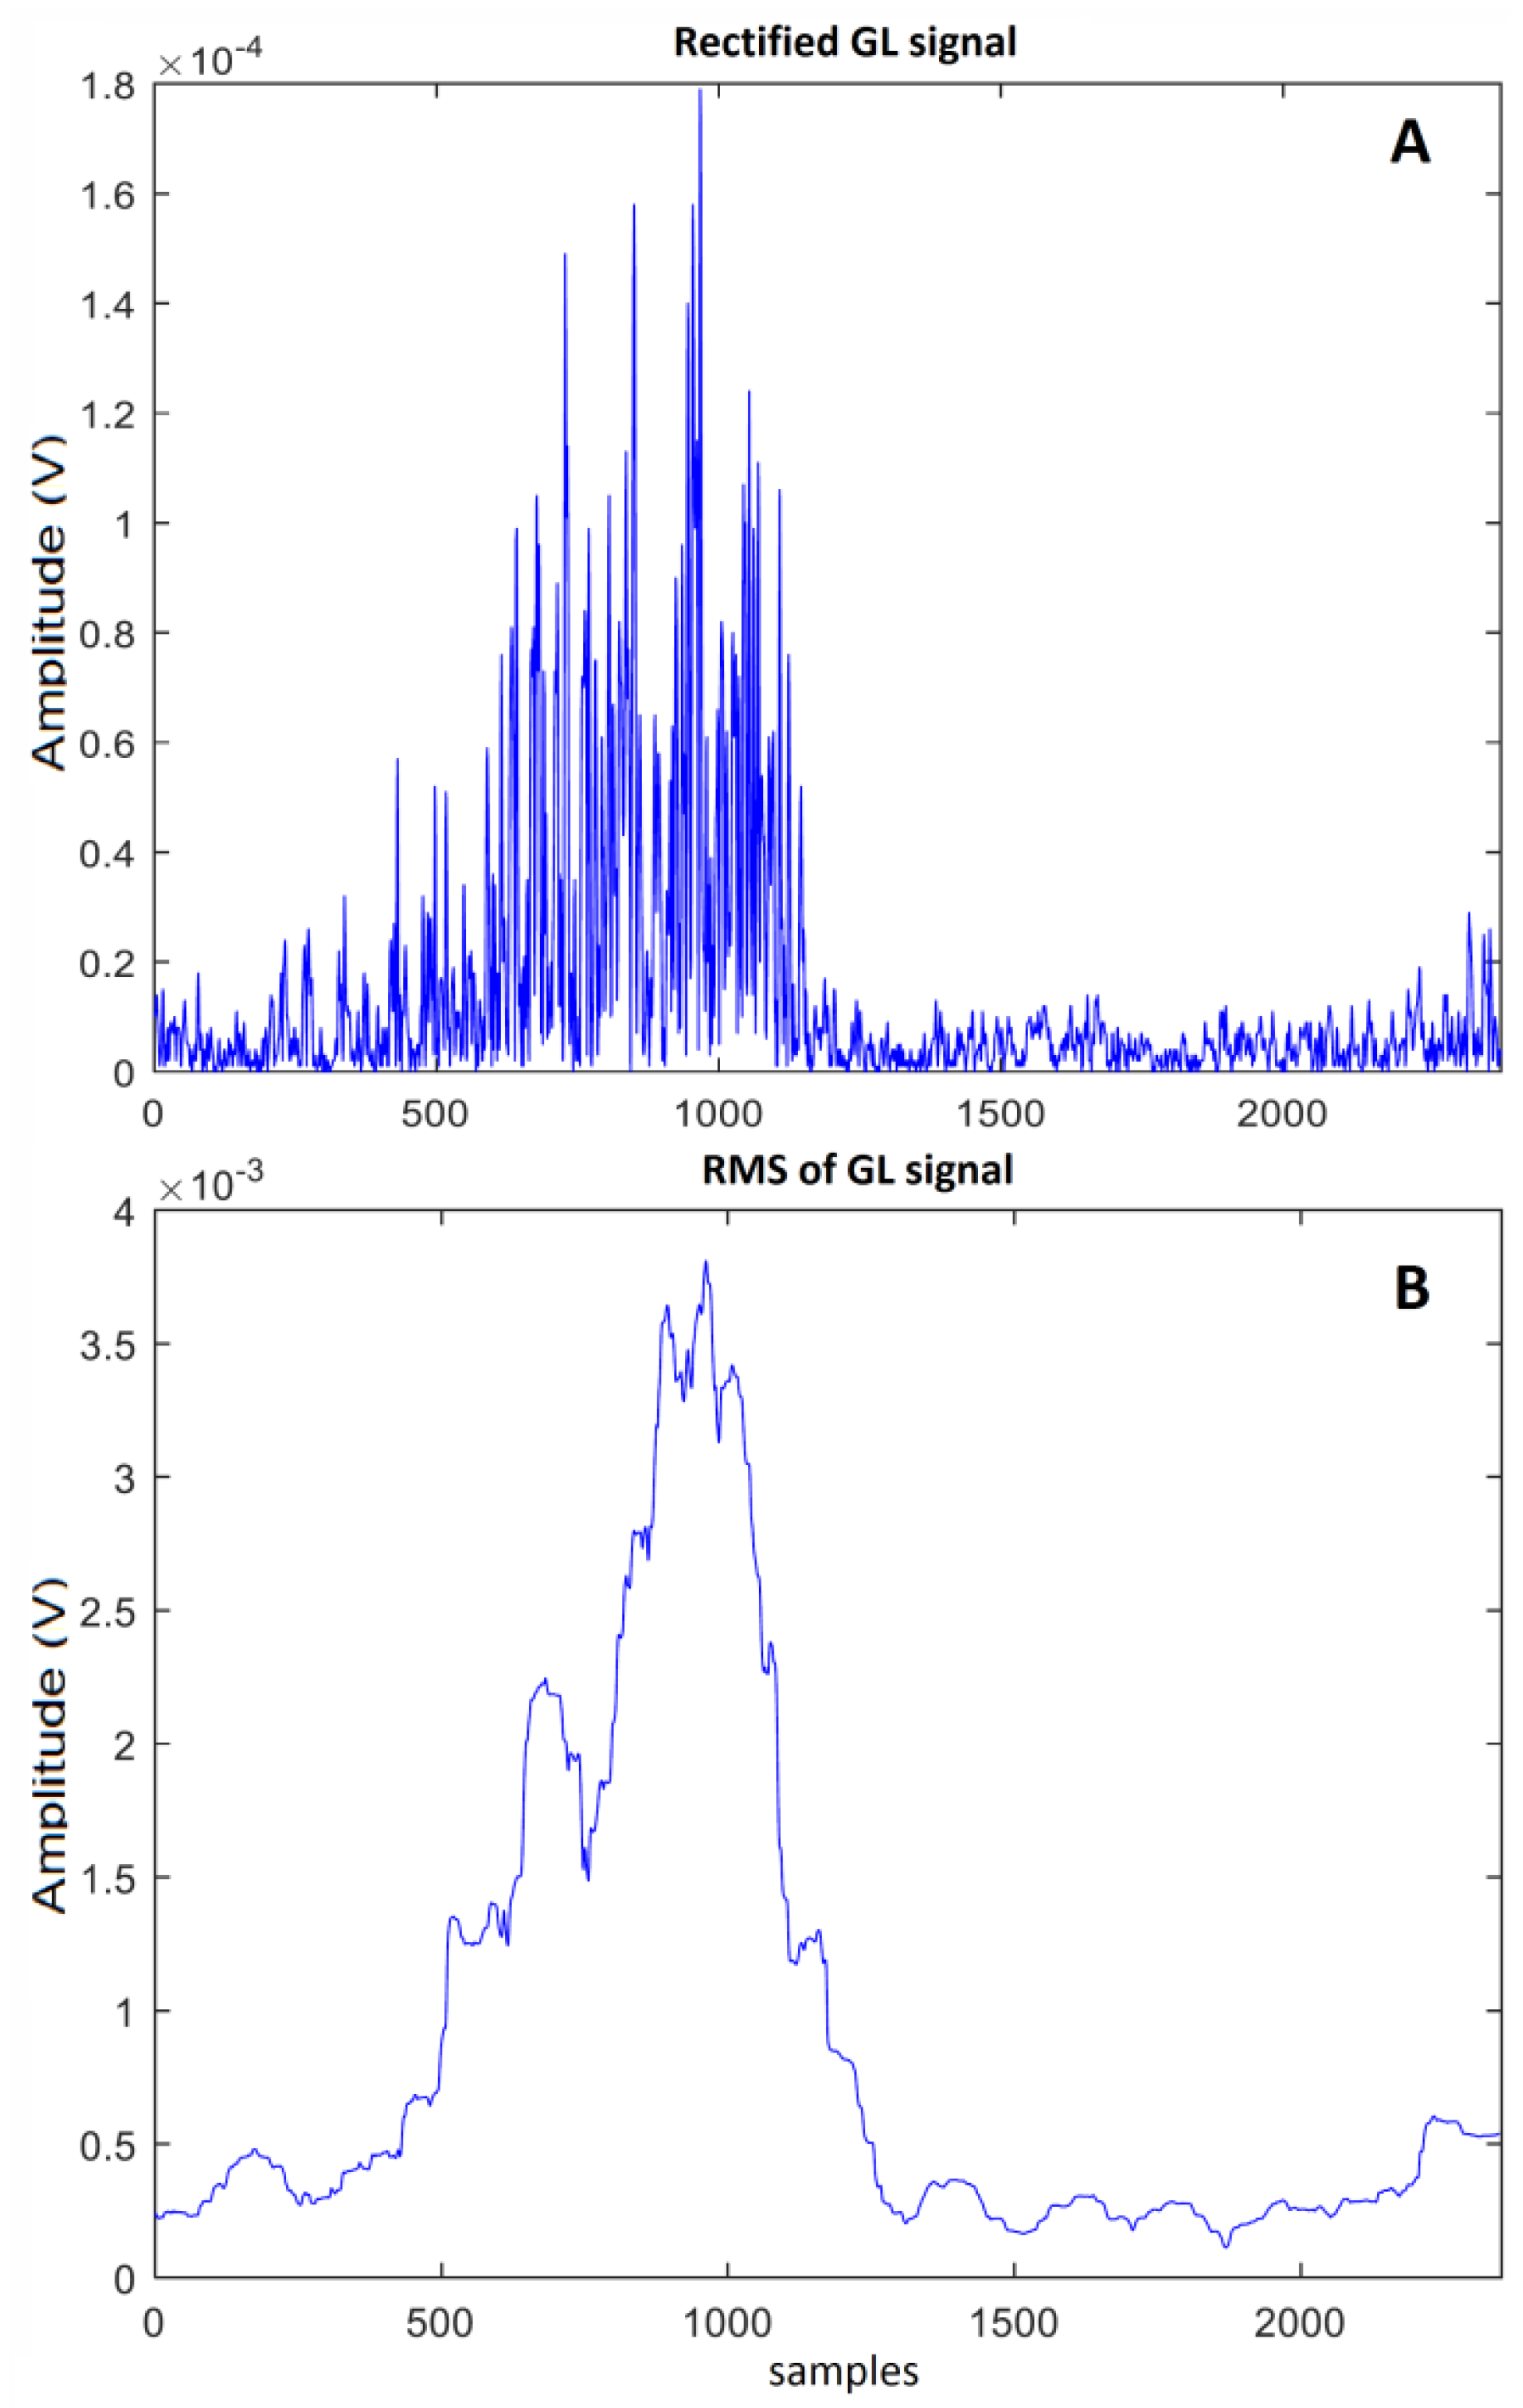
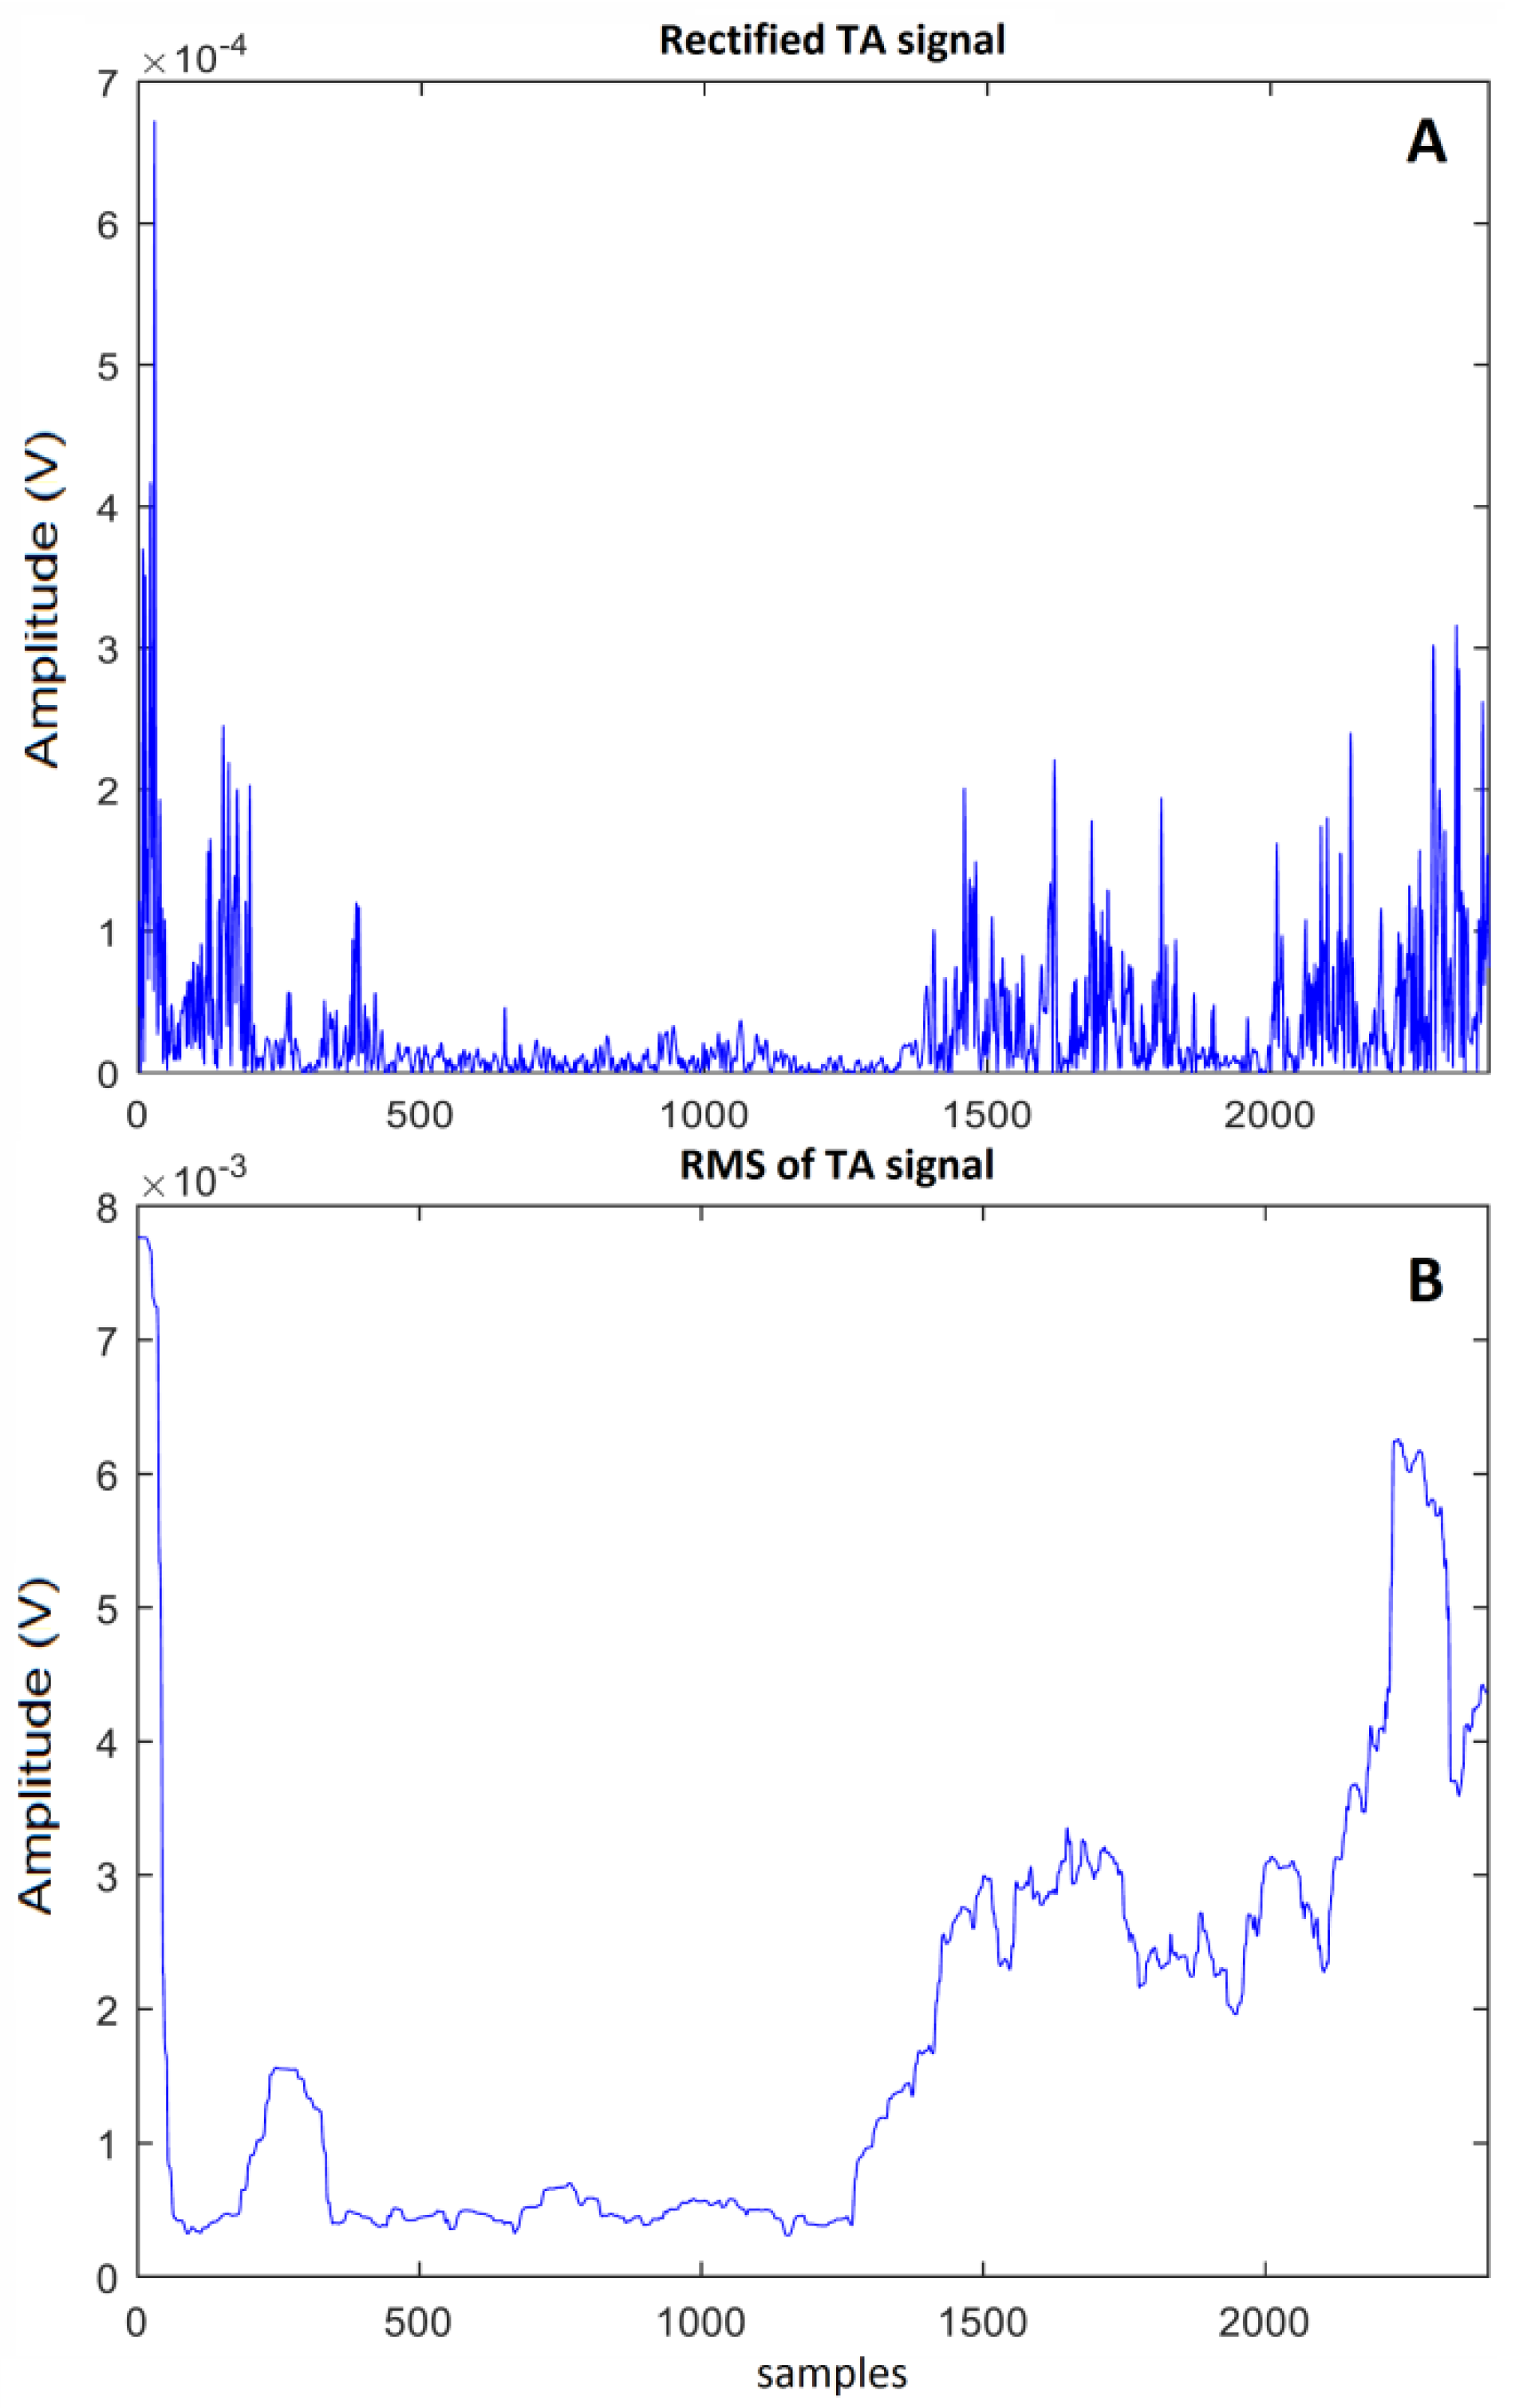
3.3. Signal Processing
3.4. Variability Index
3.5. Statistics
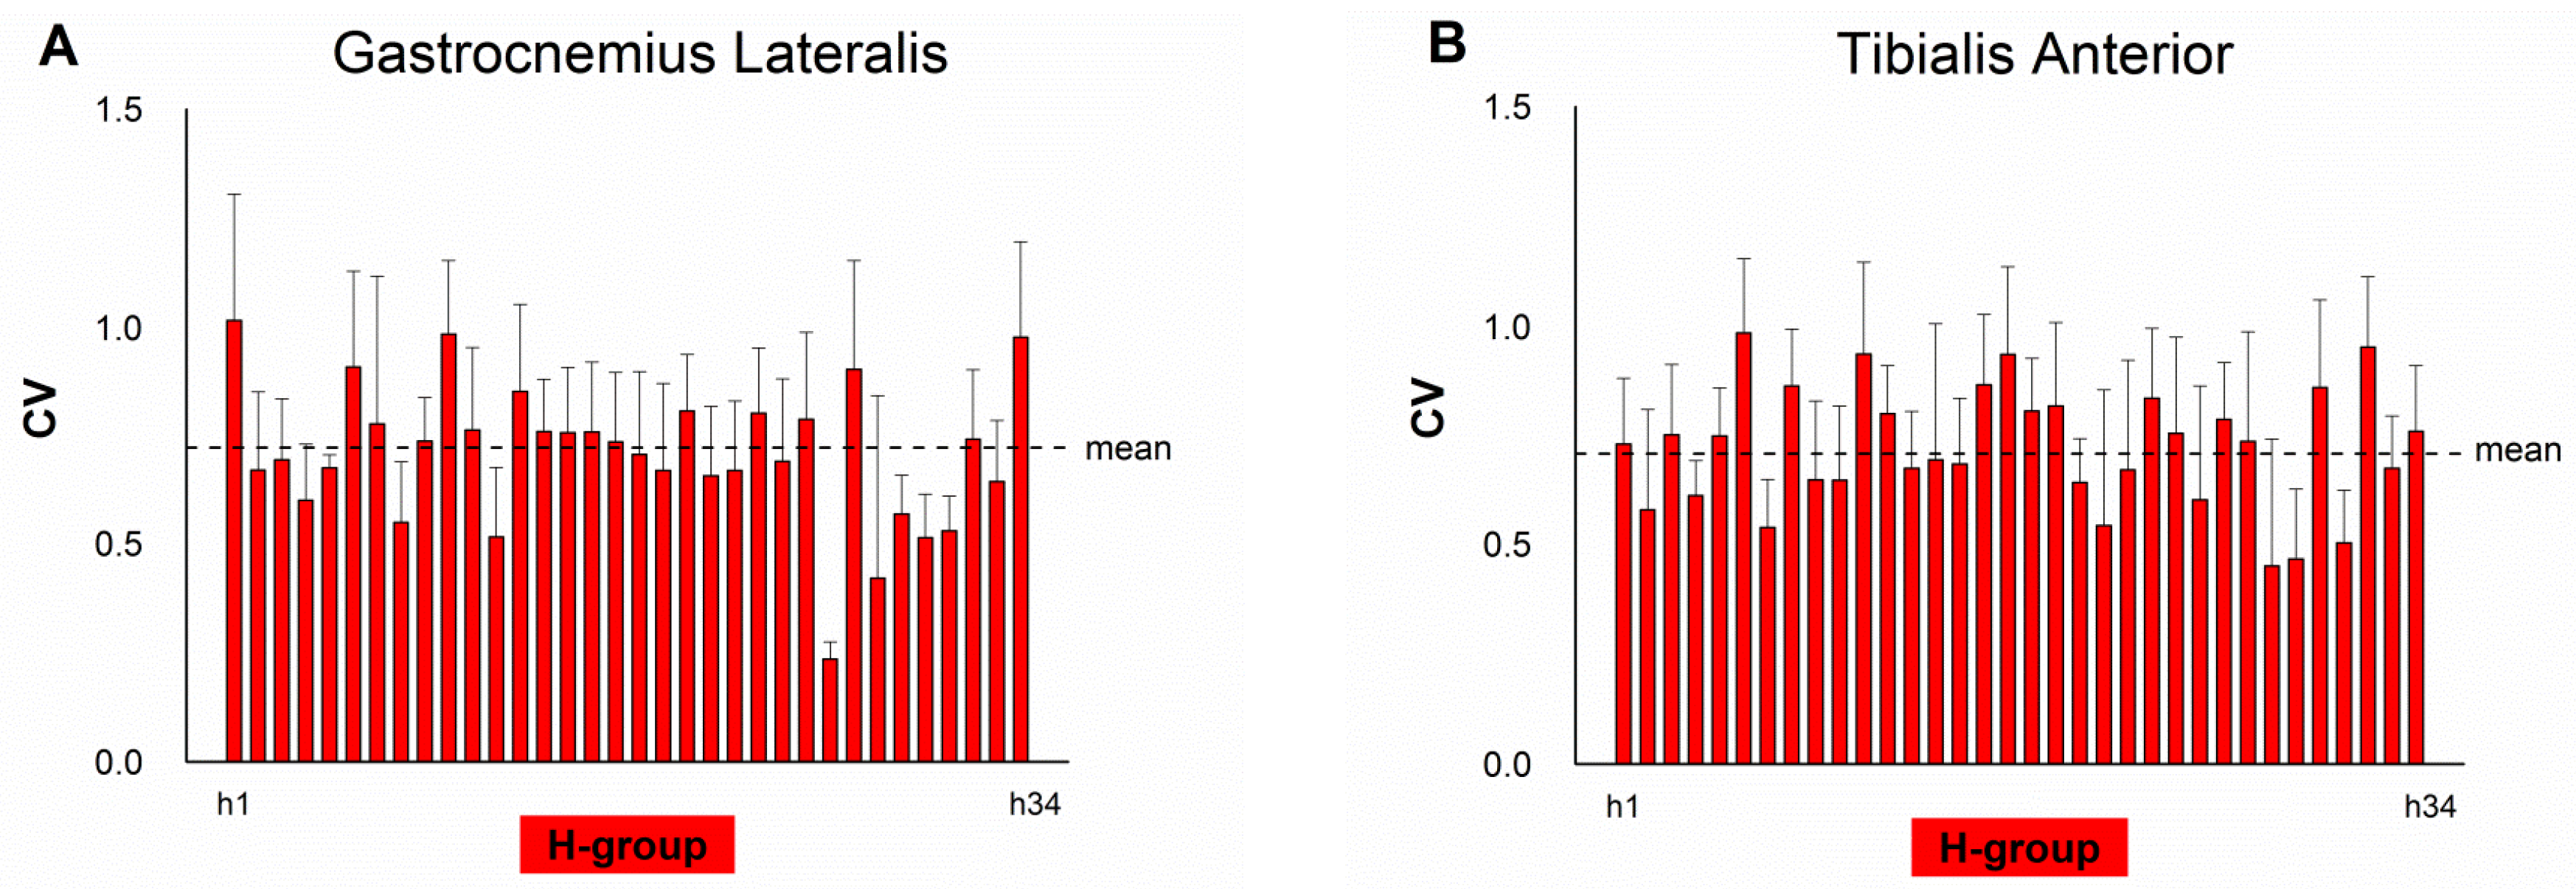
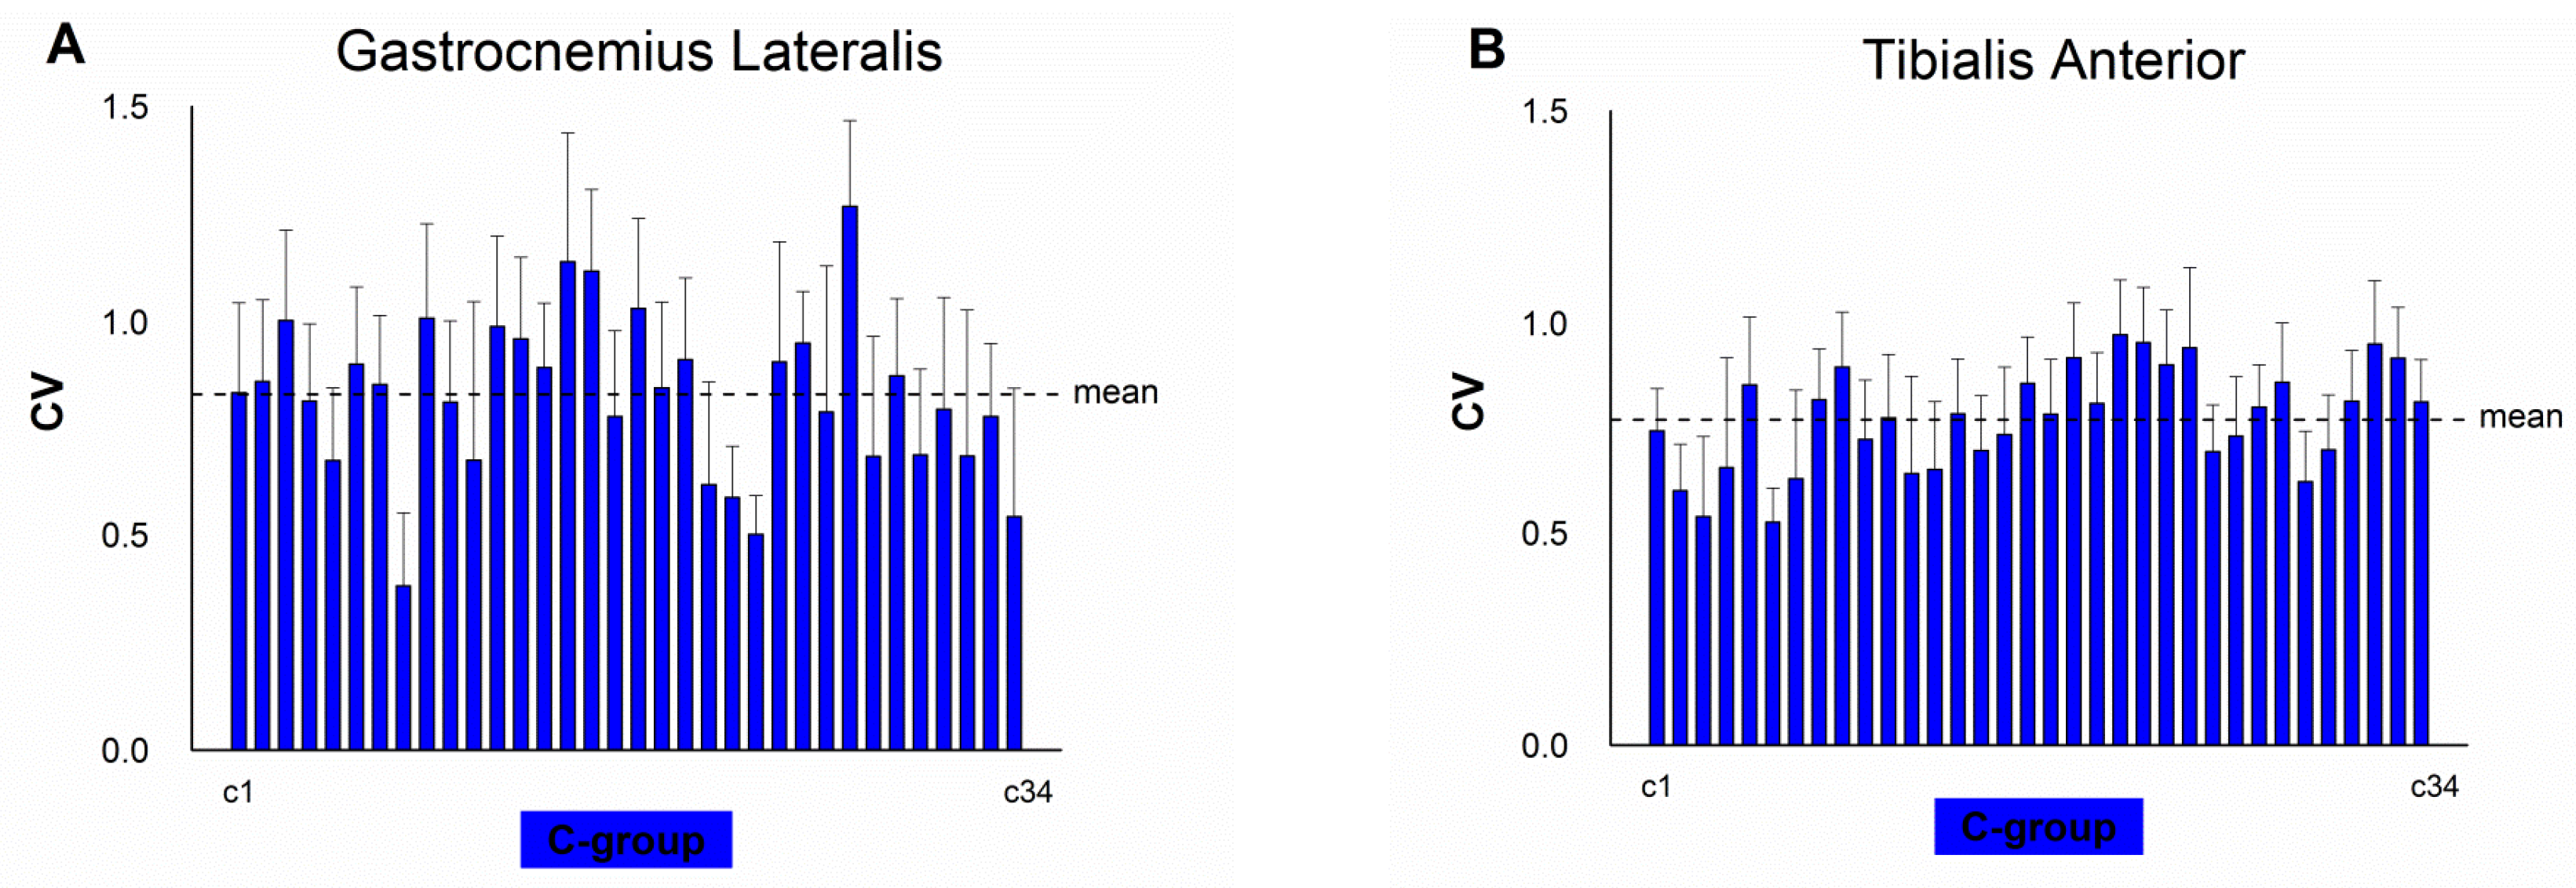
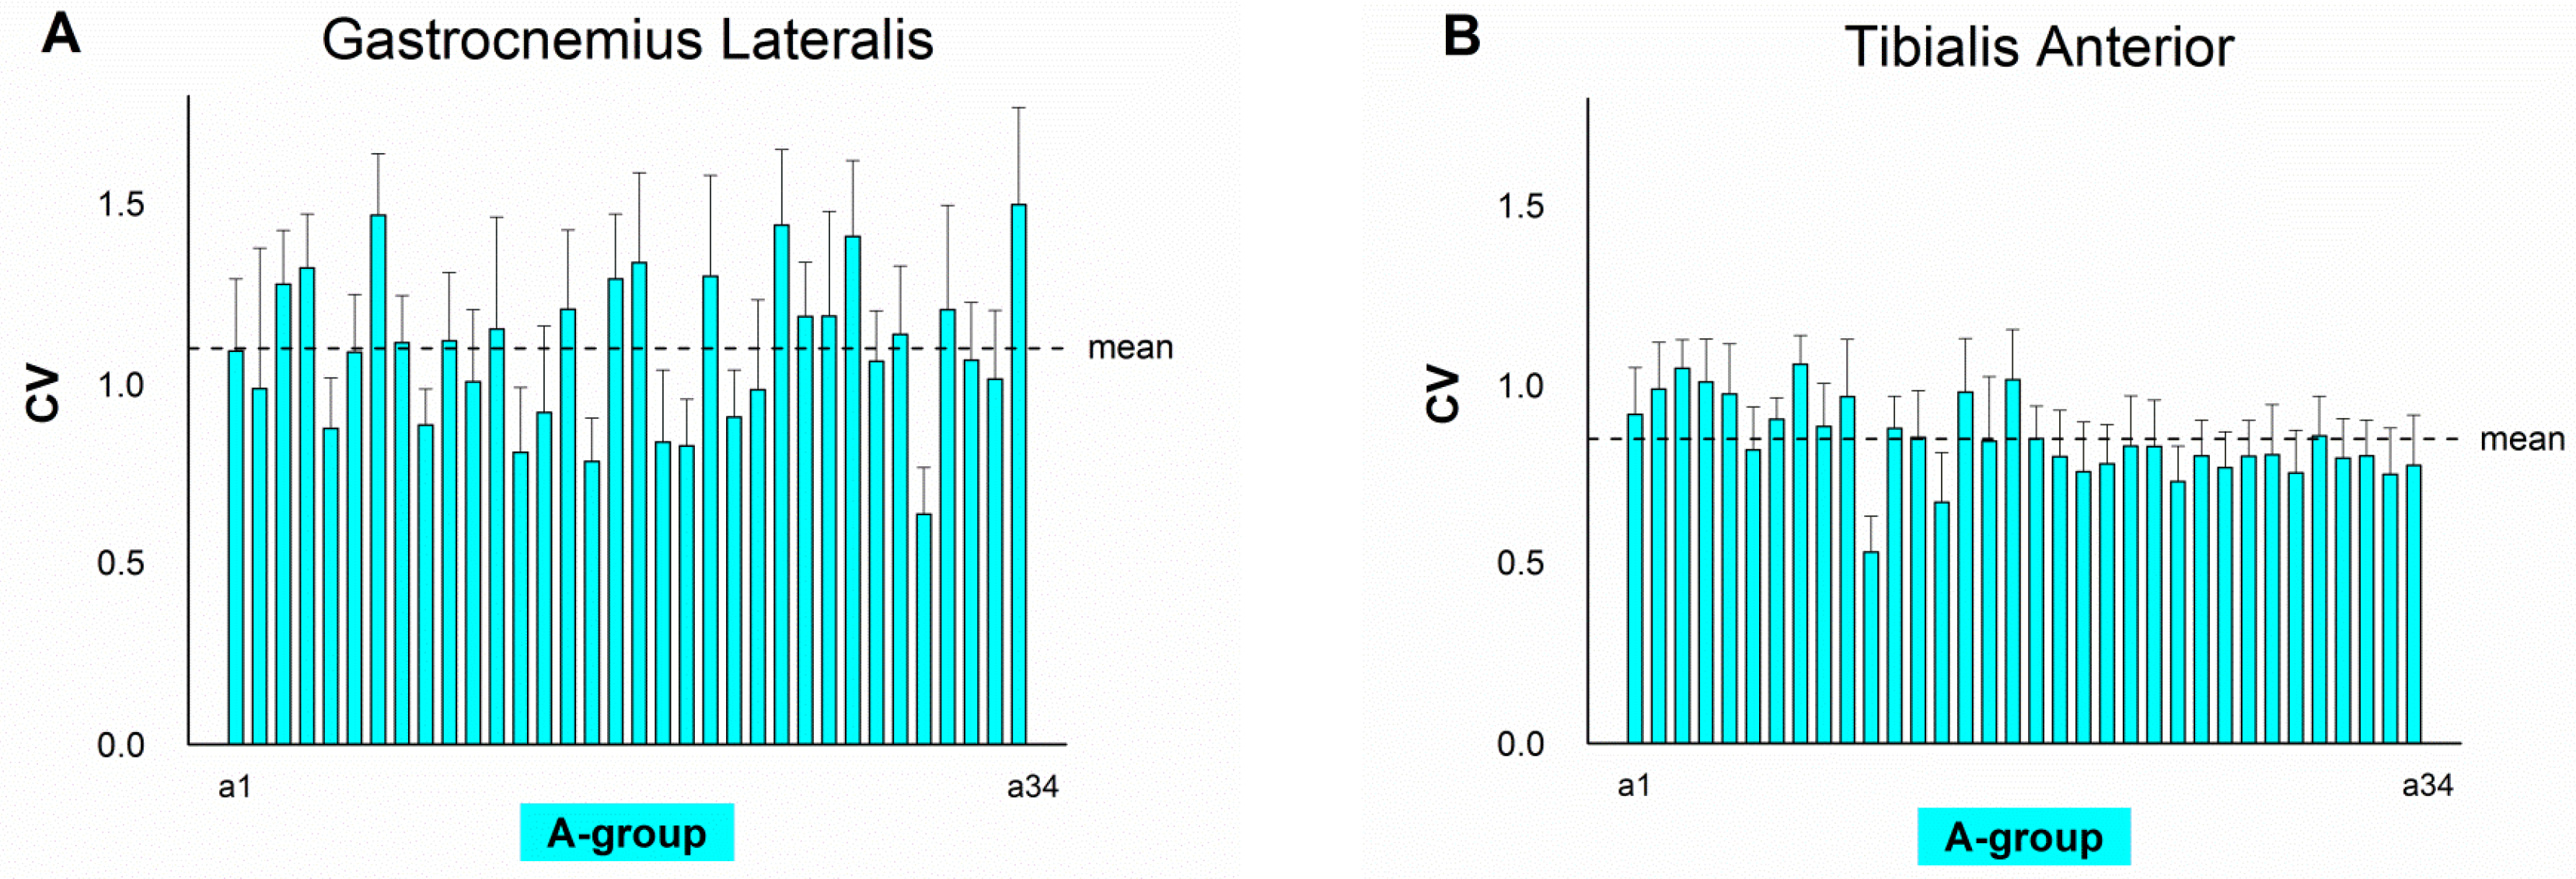
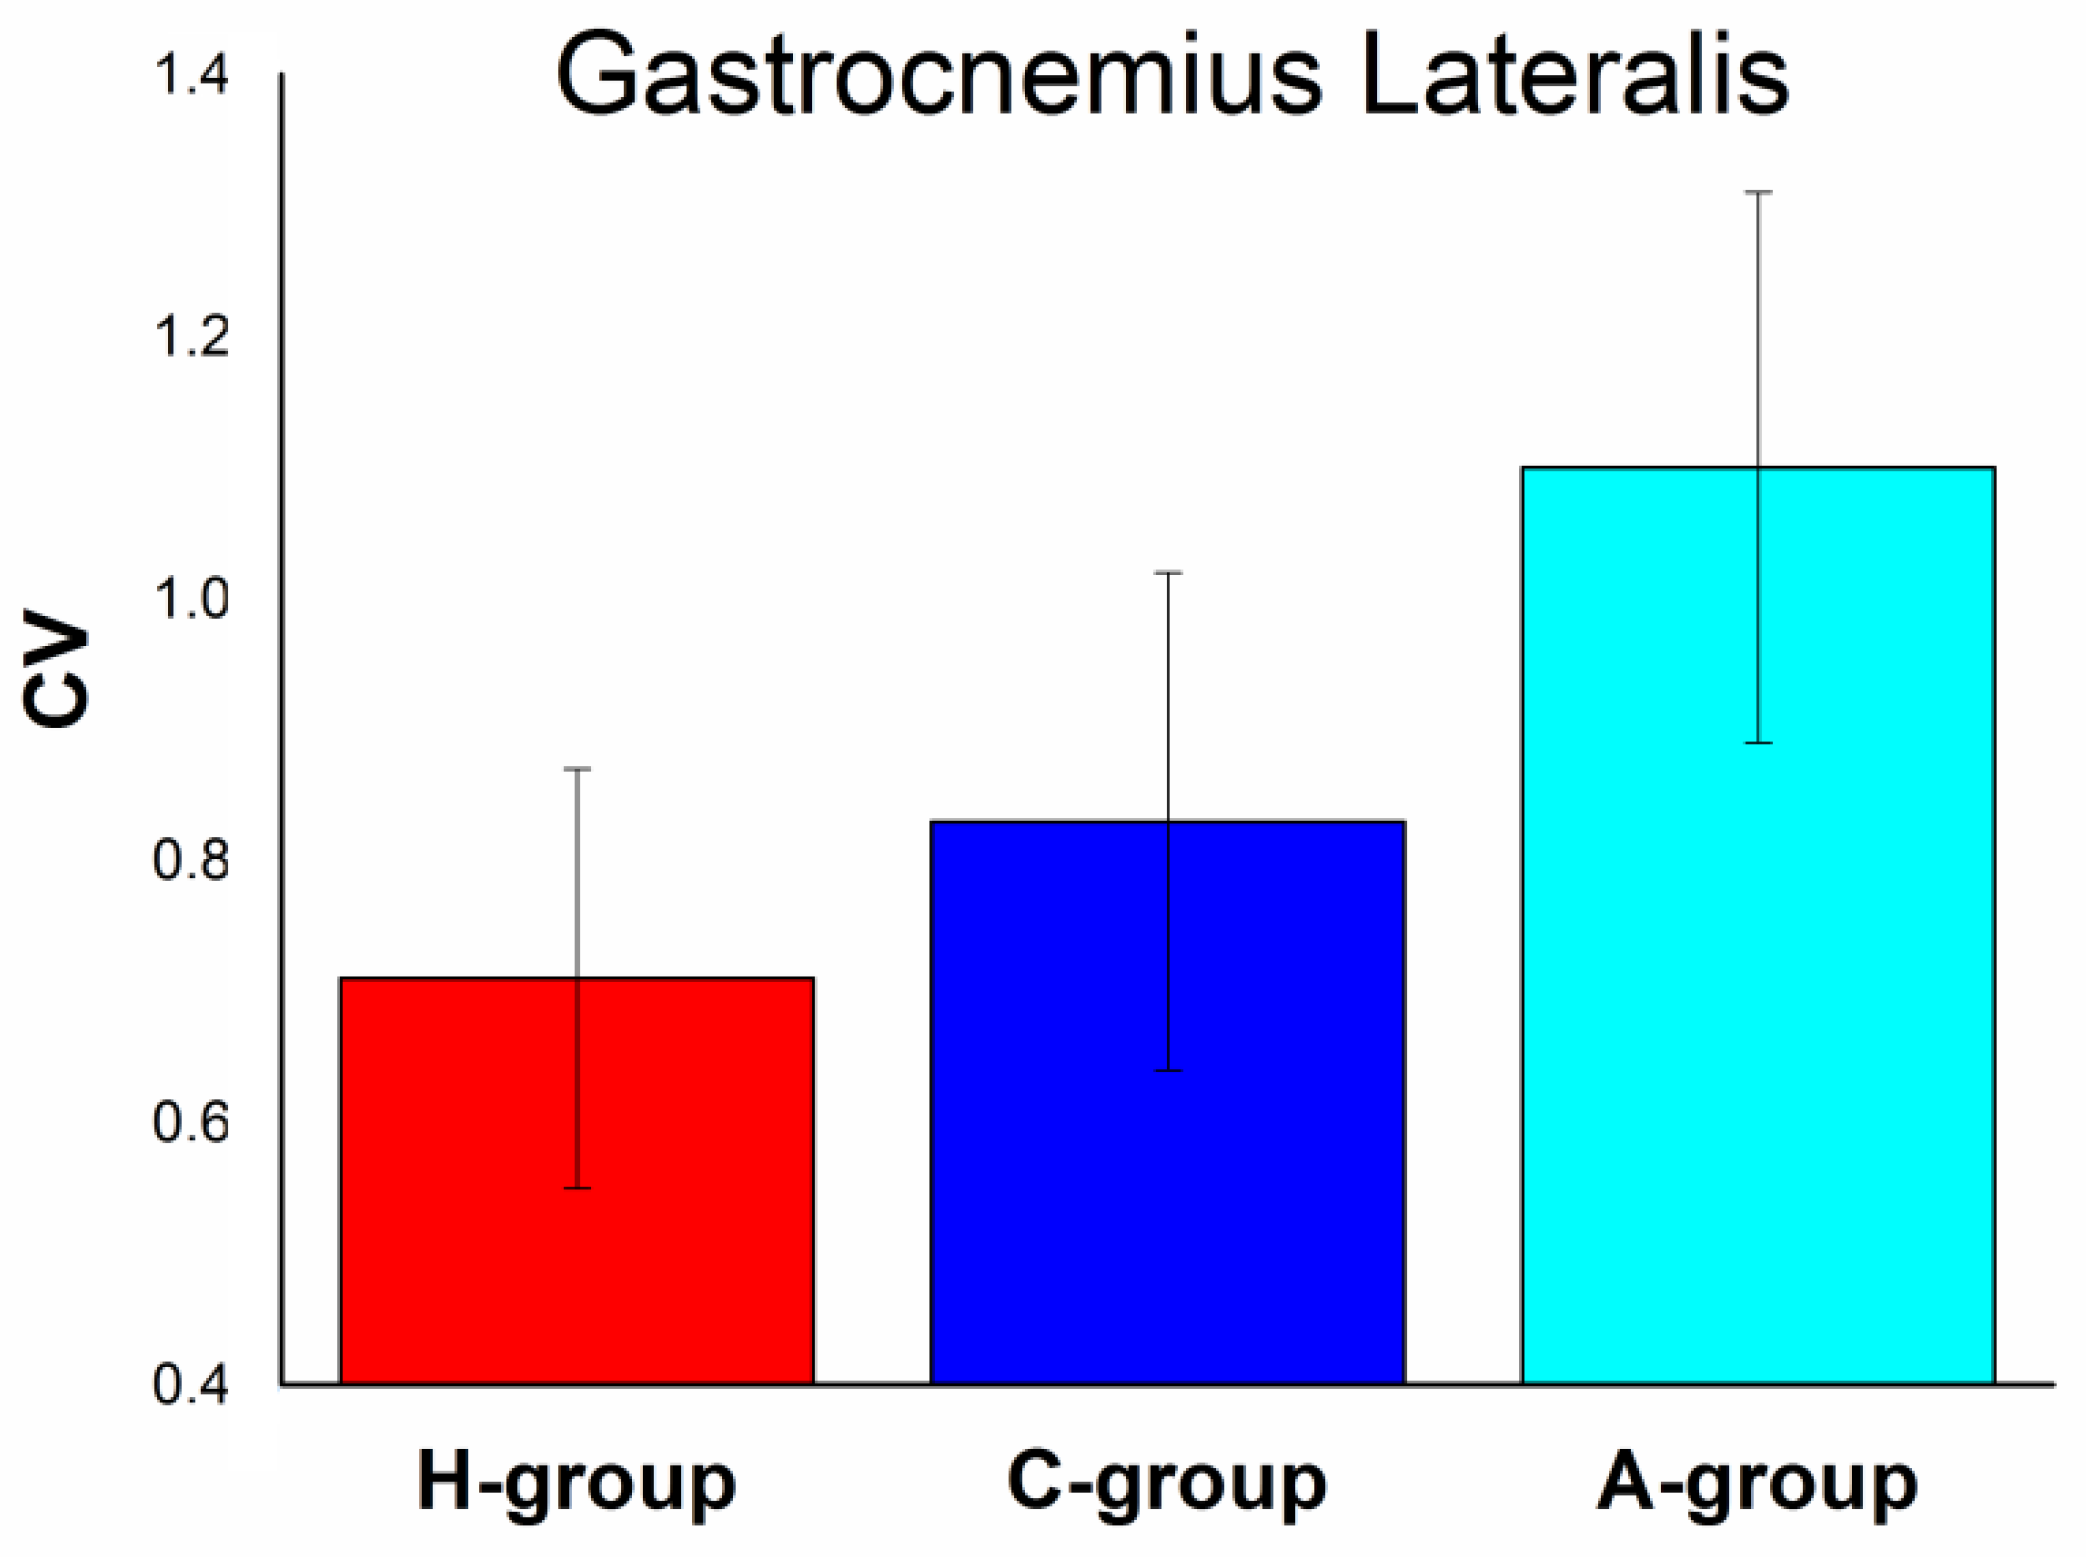
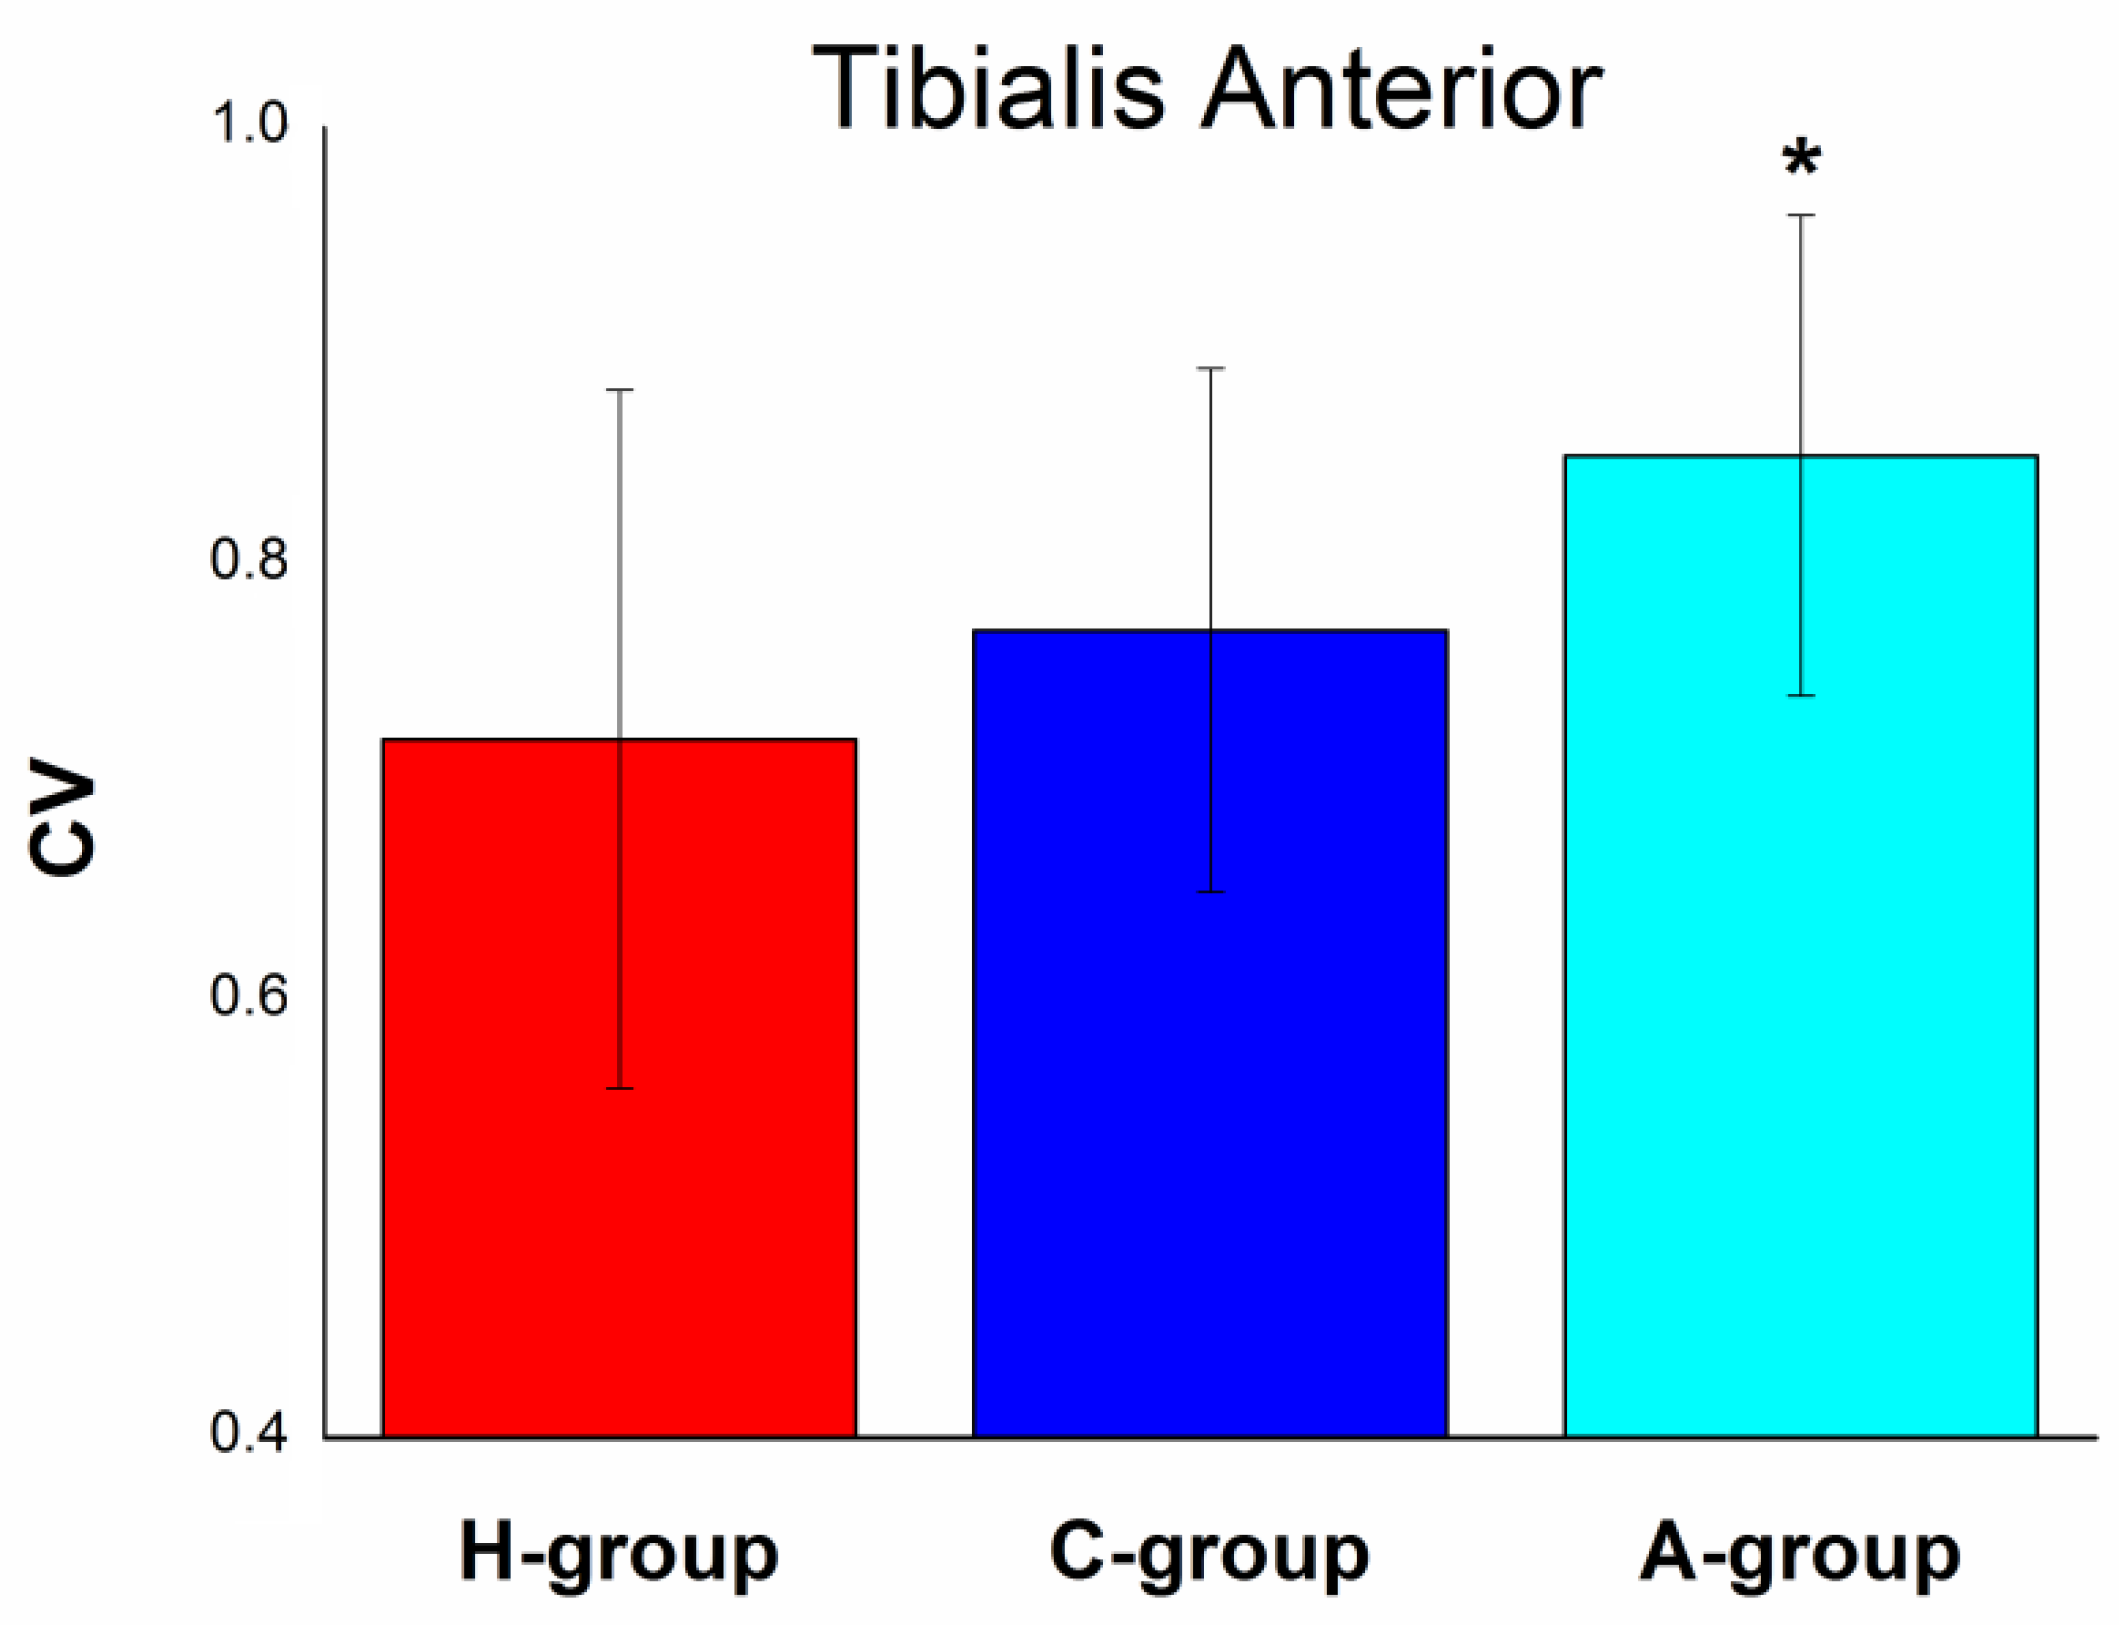
4. Results
5. Discussion
6. Conclusions and Future Work
Author Contributions
Funding
Conflicts of Interest
References
- Ostensjø, S.; Carlberg, E.B.; Vøllestad, N.K. Motor impairments in young children with cerebral palsy: Relationship to gross motor function and everyday activities. Dev. Med. Child Neurol. 2004, 46, 580–589. [Google Scholar] [CrossRef] [PubMed]
- Winters, T.F.; Gage, J.R.; Hicks, R. Gait patterns in spastic hemiplegiain children and young adults. J. Bone Joint Surg. 1987, 69, 437–441. [Google Scholar] [CrossRef] [PubMed]
- McDowell, B.C.; Kerr, C.; Kelly, C.; Salazar, J.; Cosgrove, A. The validity of an existing gait classification system when applied to a representative population of children with hemiplegia. Gait Posture 2008, 28, 442–447. [Google Scholar] [CrossRef] [PubMed]
- Agostini, V.; Nascimbeni, A.; Gaffuri, A.; Knaflitz, M. Multiple gait patterns within the same Winters class in children with hemiplegic cerebral palsy. Clin Biomech. 2015, 30, 908–914. [Google Scholar] [CrossRef]
- Riad, J.; Haglund-Akerlind, Y.; Miller, F. Power generation in children with spastic hemiplegic cerebral palsy. Gait Posture 2008, 27, 641–647. [Google Scholar] [CrossRef]
- Di Nardo, F.; Strazza, A.; Mengarelli, A.; Cardarelli, S.; Tigrini, A.; Verdini, F.; Nascimbeni, A.; Agostini, V.; Knaflitz, M.; Fioretti, S. EMG-Based Characterization of Walking Asymmetry in Children with Mild Hemiplegic Cerebral Palsy. Biosensors 2019, 9, 82. [Google Scholar] [CrossRef]
- Frigo, C.; Crenna, P. Multichannel SEMG in clinical gait analysis: A review and state-of-the-art. Clin. Biomech. 2009, 24, 236–245. [Google Scholar] [CrossRef]
- Bojanic, D.M.; Petrovacki-Balj, B.D.; Jorgovanovic, N.D.; Ilic, V.R. Quantification of dynamic EMG patterns during gait in children with cerebral palsy. J. Neurosci. Methods 2011, 198, 325–331. [Google Scholar] [CrossRef]
- Galli, M.; Cimolin, V.; Rigoldi, C.; Tenore, N.; Albertini, G. Gait patterns in hemiplegic children with cerebral palsy: Comparison of right and left hemiplegia. Res. Dev. Disabil. 2010, 31, 1340–1345. [Google Scholar] [CrossRef]
- Patikas, D.; Wolf, S.; Döderlein, L. Electromyographic evaluation of the sound and involved side during gait of spastic hemiplegic children with cerebral palsy. Eur. J. Neurol. 2005, 12, 691–699. [Google Scholar] [CrossRef]
- Patikas, D.S.; Wolf, I.; Schuster, W.; Armbrust, P.; Dreher, T.; Döderlein, L. Electromyographic patterns in children with cerebral palsy: Do they change after surgery? Gait Posture 2007, 26, 362–371. [Google Scholar] [CrossRef] [PubMed]
- Turvey, M.; Fitzpatrick, P. Commentary: Development of Perception-Action Systems and General Principles of Pattern Formation. Child Dev. 1993, 64, 1175–1190. [Google Scholar] [CrossRef]
- Hadders-Algra, M. Variation and Variability: Key Words in Human Motor Development. Phys. Ther. 2010, 90, 1823–1837. [Google Scholar] [CrossRef] [PubMed]
- Spinsante, S.; Di Nardo, F.; Strazza, A.; Verdini, F.; Poli, A. A Simple sEMG-Based Measure of Muscular Recruitment Variability during Pediatric Walking. In Proceedings of the 2019 IEEE International Symposium on Medical Measurements and Applications (MeMeA), Istanbul, Turkey, 26–28 June 2019; pp. 1–6. [Google Scholar]
- Anders, C.; Wagner, H.; Puta, C.; Grassme, R.; Petrovitch, A.; Scholle, H.C. Trunk muscle activation patterns during walking at different speeds. J. Electromyogr. Kinesiol. 2007, 17, 245–252. [Google Scholar] [CrossRef] [PubMed]
- Bailey, C.; Corona, F.; Pilloni, G.; Porta, M.; Fastame, M.; Hitchcott, P.; Penna, M.; Pau, M.; Côté, J. Sex-dependent and sex-independent muscle activation patterns in adult gait as a function of age. Exp. Gerontol. 2018, 110, 1–8. [Google Scholar] [CrossRef]
- Available online: https://www.myon.ch/ (accessed on 7 August 2020).
- Available online: https://www.btsbioengineering.com/products/freeemg-surface-emg-semg/ (accessed on 7 August 2020).
- Agostini, V.; Ghislieri, M.; Rosati, S.; Balestra, G.; Knaflitz, M. Surface electromyography applied to gait analysis: How to improve its impact in clinics? Front Neurol. 2020. [Google Scholar] [CrossRef]
- Campanini, I.; Disselhorst-Klug, C.; Rymer, W.Z.; Merletti, R. Surface EMG in Clinical Assessment and Neurorehabilitation: Barriers limiting its use. Front Neurol. 2020. [Google Scholar] [CrossRef]
- Donaldson, S.; Donaldson, M.; Snelling, L. SEMG Evaluations: An Overview. Appl. Psychophysiol Biofeedback 2003, 28, 121–127. [Google Scholar] [CrossRef]
- Hermens, H.; Bruggen, T.; Baten, C.; Rutten, W.; Boom, H. The median frequency of the surface EMG power spectrum in relation to motor unit firing and action potential properties. J. Electromyogr. Kinesiol. 1992, 2, 15–25. [Google Scholar] [CrossRef]
- Davies, B.T. A review of “The Co-ordination and Regulation of Movements” By N. Bernstein. Ergonomics 1968, 11, 95–97. [Google Scholar] [CrossRef]
- Guidetti, L.; Rivellini, G.; Figura, F. EMG patterns during running: Intra- and inter-individual variability. J. Electromyogr. Kinesiol. 1996, 6, 37–48. [Google Scholar] [CrossRef]
- Hug, F.; Drouet, J.M.; Champoux, Y.; Couturier, A.; Dorel, S. Interindividual variability of electromyographic patterns and pedal force profiles in trained cyclists. Eur. J. Appl. Physiol. 2008, 104, 667–678. [Google Scholar] [CrossRef] [PubMed]
- Hershler, C.; Milner, M. An optimality criterion for processing electromyographic (EMG) signals relating to human locomotion. IEEE Trans. Biomed. Eng. 1978, 25, 413–420. [Google Scholar] [CrossRef] [PubMed]
- Martens, J.; Daly, D.; Deschamps, K.; Fernandes, R.J.P.; Staes, F. Intra-Individual Variability of Surface Electromyography in Front Crawl Swimming. PLoS ONE 2015, 10, e0144998. [Google Scholar] [CrossRef]
- Raydonal, O.; Marmolejo-Ramos, F. Performance of Some Estimators of Relative Variability. Front. Appl. Math. Stat. 2019, 5, 43. [Google Scholar] [CrossRef]
- Gabel, R.H.; Brand, R.A. The effects of signal conditioning on the statistical analyses of gait EMG. Electroencephalogr. Clin. Neurophysiol. 1994, 93, 188–201. [Google Scholar] [CrossRef]
- Kendell, C.; Lemaire, E.D.; Losier, Y.; Wilson, A.; Chan, A.; Hudgins, B. A novel approach to surface electromyography: An exploratory study of electrode-pair selection based on signal characteristics. J. NeuroEng. Rehabil. 2012, 9, 24. [Google Scholar] [CrossRef]
- Hemingway, M.A.; Biedermann, H.J.; Inglis, J. Electromyographic recordings of paraspinal muscles: Variations related to subcutaneous tissue thickness. Biofeedback Self Regul. 1995, 20, 39–49. [Google Scholar] [CrossRef]
- Agostini, V.; Nascimbeni, A.; Gaffuri, A.; Imazio, P.; Benedetti, M.; Knaflitz, M. Normative EMG activation patterns of school-age children during gait. Gait Posture 2010, 32, 285–289. [Google Scholar] [CrossRef]
- Di Nardo, F.; Laureati, G.; Strazza, A.; Mengarelli, A.; Burattini, L.; Agostini, V.; Nascimbeni, A.; Knaflitz, M.; Fioretti, S. Is child walking conditioned by gender? surface emg patterns in female and male children. Gait Posture 2017, 53, 254–259. [Google Scholar] [CrossRef]
- Available online: https://www.who.int/growthref/who2007_bmi_for_age/en/ (accessed on 17 September 2020).
- Winter, D.A. Biomechanics and Motor Control of Human Movement; John Wiley & Sons: Hoboken, NJ, USA, 2009. [Google Scholar]
- Hermens, H.J.; Freriks, B.; Merletti, R. European recommendations for surface electromyography, SENIAM. Enschede (NL). Roessingh Res. Dev. 1999, 8, 13–54. [Google Scholar]
- Agostini, V.; Balestra, G.; Knaflitz, M. Segmentation and classification of gait cycles. IEEE Trans. Neural. Syst. Rehabil. Eng. 2014, 22, 946–952. [Google Scholar] [CrossRef] [PubMed]
- Lord, S.; Howe, T.; Greenland, J.; Simpson, L.; Rochester, L. Gait variability in older adults: A structured review of testing protocol and clinimetric properties. Gait Posture 2011, 34, 443–450. [Google Scholar] [CrossRef] [PubMed]
- Di Nardo, F.; Mengarelli, A.; Strazza, A.; Agostini, V.; Knaflitz, M.; Burattini, L.; Fioretti, S. A new parameter for quantifying the variability of surface electromyographic signals during gait: The occurrence frequency. J. Electromyogr. Kinesiol. 2017, 36, 25–33. [Google Scholar] [CrossRef] [PubMed]
- Tirosh, O.; Sangeux, M.; Wong, M.; Thomason, P.; Graham, H.K. Walking speed effects on the lower limb electromyographic variability of healthy children aged 7–16 years. J. Electromyogr. Kinesiol. 2013, 23, 1451–1459. [Google Scholar] [CrossRef]
- Romkes, J.; Brunner, R. An electromyographic analysis of obligatory (hemiplegic cerebral palsy) and voluntary (normal) unilateral toe-walking. Gait Posture 2007, 26, 577–586. [Google Scholar] [CrossRef]
- Agostini, V.; Knaflitz, M.; Nascimberi, A.; Gaffuri, A. Gait measurements in hemiplegic children: An automatic analysis of foot–floor contact sequences and electromyographic patterns. In Proceedings of the 2014 IEEE International Symposium on Medical Measurements and Applications (MeMeA), Lisbon, Portugal, 11–12 June 2014. [Google Scholar]


| Index | Definition | Parameters |
|---|---|---|
| One-dimension CV: it permits comparison of the variability of a data set with a larger and a smaller mean and SD | k = no. of intervals (*) over a cycle; = mean of the sEMG values at the i-th interval calculated over all the cycles; = standard deviation of the sEMG values calculated over all the cycles. | |
| Two-dimension CV | CV at the i-th interval (*). Note that CV is defined as the mean value of CVi’s over the number of intervals in a cycle (k). | |
| Variance Ratio (VR) | where | k = no. of intervals(*) over the cycle; n = no. of cycles; = sEMG value at the i-th interval for the j-th cycle, = mean of sEMG values at the i-th interval over j cycles; = mean of sEMG values. |
| Coefficient of Quartile Variation (CQV) | Q1 = 25th percentile, Q3 = 75th percentile of the n sEMG values at a given interval (*). |
| Study | Subject/Patient | EMG Processing | Aim | Results | Contributions of the Present Study |
|---|---|---|---|---|---|
| Agostini 2010 [35] | 100 able-bodied school-age children | Statistical Gait Analysis (SGA) | To assess variability of muscular timing in numerous strides during walking | Variability was quantified by identifying 5 main activation patterns and their occurrence frequency | Quantification of intra- subject sEMG variability in numerous strides not only in control children, but also in hemiplegic children. |
| Agostini 2014 [42] | 30 hemiplegic children—Winters’ type I and II and 100 control children | Statistical Gait Analysis (SGA) | Automatic determination of sEMG patterns of hemiplegic children during gait. | Curtailed activity of tibialis anterior during terminal swing and a lack of activity at loading response in both Winters’ class. Class II showed abnormal gastrocnemius activity both at initial contact and in terminal swing | Providing an index for asssessing sEMG variability in order to supply concomitant assessment of sEMG activity and variability |
| Agostini 2015 [4] | 38 hemiplegic children—Winters’ type I and II and 100 control children | Statistical Gait Analysis (SGA) | Assessment of variability of muscular timing in numerous strides within each Winters’ class during walking | Variability was quantified by identifying 4–5 distinct muscle activation patterns. It cannot be defined a predominant muscle activation pattern for characterizing each specific Winters’ class. | (1) Quantification of the decreased intra-subject EMG variability in hemiplegic children compared to both control children and healthy adults (2) Assessment of EMG variability in numerous strides by means of an easy-to-compute index |
| Di Nardo 2017 [36] | 100 able-bodied children and 33 adults | Statistical Gait Analysis (SGA) | Age- and gender-related assessment of EMG variability during walking in control subject to analyze maturation of gait | Increased EMG variability in adult but not in children female, compared to the correspondent male population. | Quantification of the reduced sEMG variability in hemiplegic children compared to both control children and able-bodied adults, providing new insights in maturation of gait and in the effect of hemiplegia on it |
| Di Nardo2017 [39] | 20 able-bodied children and 20 adults | Statistical Gait Analysis (SGA) | To propose the occurrence frequency as a new parameter for assessing sEMG signal variability during walking. | Occurrence frequency is able to provide further information on sEMG variability, besides those supplied by classical temporal sEMG parameters. | Providing an index for asssessing sEMG variability in time domain in order to integrate the information coming from the occurrence frequency |
| Spinsante 2019 [14] | 30 able-bodied children and 30 adults | CV computation | To measure variability of EMG signal in motor development and test the reliability of CV index to this aim | CV index is shown to be able to effectively discriminate pediatric motor capabilities | Extending the reliability of CV index in assessing EMG variability also to hemiplegic-children population |
| Di Nardo 2019 [6] | 16 hemiplegic children—Winters’ type I and 100 control children | Statistical Gait Analysis (SGA) | Assessment of variability of muscular timing and asymmetric behavior of muscle recruitment in hemiplegic-children walking | Increased EMG variability in the hemiplegic side due to a reduced activity in terminal swing and a lack of activity at heel-strike of ankle dorsi-flexors. | Testing the reliability in EMG variability assessment of CV index, in a large population including Winters’ type I and type II hemiplegic children. This index could be used for an easy-to-compute assessment of hemiplegic asymmetry |
© 2020 by the authors. Licensee MDPI, Basel, Switzerland. This article is an open access article distributed under the terms and conditions of the Creative Commons Attribution (CC BY) license (http://creativecommons.org/licenses/by/4.0/).
Share and Cite
Di Nardo, F.; Spinsante, S.; Pagliuca, C.; Poli, A.; Strazza, A.; Agostini, V.; Knaflitz, M.; Fioretti, S. Variability of Muscular Recruitment in Hemiplegic Walking Assessed by EMG Analysis. Electronics 2020, 9, 1572. https://doi.org/10.3390/electronics9101572
Di Nardo F, Spinsante S, Pagliuca C, Poli A, Strazza A, Agostini V, Knaflitz M, Fioretti S. Variability of Muscular Recruitment in Hemiplegic Walking Assessed by EMG Analysis. Electronics. 2020; 9(10):1572. https://doi.org/10.3390/electronics9101572
Chicago/Turabian StyleDi Nardo, Francesco, Susanna Spinsante, Chiara Pagliuca, Angelica Poli, Annachiara Strazza, Valentina Agostini, Marco Knaflitz, and Sandro Fioretti. 2020. "Variability of Muscular Recruitment in Hemiplegic Walking Assessed by EMG Analysis" Electronics 9, no. 10: 1572. https://doi.org/10.3390/electronics9101572
APA StyleDi Nardo, F., Spinsante, S., Pagliuca, C., Poli, A., Strazza, A., Agostini, V., Knaflitz, M., & Fioretti, S. (2020). Variability of Muscular Recruitment in Hemiplegic Walking Assessed by EMG Analysis. Electronics, 9(10), 1572. https://doi.org/10.3390/electronics9101572