Abstract
Recently, the statistical analysis of muscle activation patterns highlighted that not only one, but several activation patterns can be identified in the gait of healthy adults, with different occurrence. Although its potential, the application of this approach in pathological populations is still limited and specific implementation issues need to be addressed. This study aims at applying a statistical approach to analyze muscle activation patterns of gait in Parkinson’s Disease, integrating gait symmetry and co-activation. Surface electromyographic signal of tibialis anterior and gastrocnemius medialis were recorded during a 6-min walking test in 20 patients. Symmetry between right and left stride time series was verified, different activation patterns identified, and their occurrence (number and timing) quantified, as well as the co-activation of antagonist muscles. Gastrocnemius medialis presented five activation patterns (mean occurrence ranging from 2% to 43%) showing, with respect to healthy adults, the presence of a first shorted and delayed activation (between flat foot contact and push off, and in the final swing) and highlighting a new second region of anticipated activation (during early/mid swing). Tibialis anterior presented five activation patterns (mean occurrence ranging from 3% to 40%) highlighting absent or delayed activity at the beginning of the gait cycle, and generally shorter and anticipated activations during the swing phase with respect to healthy adults. Three regions of co-contraction were identified: from heel strike to mid-stance, from the pre- to initial swing, and during late swing. This study provided a novel insight in the analysis of muscle activation patterns in Parkinson’s Disease patients with respect to the literature, where unique, at times conflicting, average patterns were reported. The proposed integrated methodology is meant to be generalized for the analysis of muscle activation patterns in pathologic subjects.
1. Introduction
Surface electromyography (sEMG) is widely used in clinical gait analysis [1,2]: amplitude-, time-, frequency-based parameters, and conduction velocity of muscle fibers can be investigated to characterize muscle activity from sEMG [3,4]. In particular, temporal parameters, i.e., the on/off timing of muscle activation, have become a de-facto standard for the clinical assessment of gait [5,6,7]. On/off timing of activation of each analyzed muscle is calculated from the raw sEMG signal through passband filtering, rectification, envelope computation, and thresholding [8,9,10], and used to identify the pattern of activation during the gait cycle. Then, the subject-specific pattern can be compared to that of healthy/reference populations for functional assessment [11]. Therefore, the approach used for the identification of such patterns plays a critical role in the resulting functional assessment.
In common practice, a single reference activation pattern is considered, resulting from the analysis of a limited number of strides (i.e., usually few units over a limited number of trials) acquired in laboratory conditions [11]. Recently, the statistical analysis of muscle activity over multiple decades of consecutive strides in ecological conditions highlighted that not only one, but several activation patterns can be identified with different statistical occurrence in the same walking trial, usually one prevalent pattern accompanied by few less frequent, but still statistically significant ones [4,12,13,14,15,16]. Studies performed on healthy adults [4,13,16] found for the rectus femoris a pattern of three activations per gait cycle (i.e., at the beginning of gait cycle, around foot-off, and in the terminal swing) in 53% of total strides, of two activations (i.e., as the previous but lacking activation around foot-off) in 26%, and of two (or three) small activations only around stance-to-swing transition in 17% [13].The identification of this variable behavior is crucial for characterizing motor function and control strategies in healthy subjects, and even more to better understand the modifications occurring in pathological conditions. Therefore, the statistical approach has also been applied in preliminary studies analyzing the muscle activation pattern of pathologic gait; in hemiplegic children, for instance, a reduced frequency in the activation of the tibialis anterior (TA) during terminal swing and a lack of activity of the same muscle at heel-strike compared to healthy controls were identified [17].
Besides the promising preliminary results, and the potential of a better insight in motor control mechanisms provided by the application of a statistical approach for the analysis of sEMG [18,19], some methodological aspects of its implementation still need to be better investigated, especially as referred to the analysis of pathological gait, where changes in the activation pattern can be related to other kinematic and/or kinetic modifications. Gait asymmetry [20,21], for instance, can appear in certain pathological conditions, and can significantly affect the implementation of a statistical approach for the analysis of sEMG, differentiating or not the specific behavior of muscles in the two limbs. Although it is relevant, a specific indication regarding how to take gait symmetry into account is still missing.
Among motor disorders that influence gait performance, Parkinson’s Disease (PD) is one of the most investigated in clinical research [22,23,24,25,26,27,28,29]. Usually, authors assess muscle activation during gait of PD patients with amplitude-based parameters [23,24], focusing mainly on distal muscles of the lower limbs, i.e., gastrocnemius (GA) and TA [25,26,27,28,29]. Few recent studies analyzed the on/off timing of these muscles within the gait cycle without identifying a representative activation pattern in PD patients. Cioni et al. [25] observed the absence or extreme reduction in TA activations in early stance or during the early and late swing phases, while Dietz et al. [28] found well preserved timing in the activations of the GA and TA comparable to healthy reference values, and some other authors [27,29] observed the co-activation of the two antagonist muscles (i.e., overlapping periods of on/off timings): Ferrarin et al. [27] reported maintained reciprocity between antagonist muscles, while Dietz et al. [28] observed larger co-activations during the support phase in PD compared to the healthy elderly. These contradictory results can depend on differences in the analyzed PD populations, including different pharmacological treatments and severity of the pathology, but the most important limitation can be identified in the limited number of analyzed strides, preventing the actual identification of significant patterns. Given the intrinsic variability of the muscle activation pattern identified in healthy subjects [10,13], the application of a statistical approach over multiple decades of strides can help to properly take intra-subject variability into account and provide more reliable assessment [30,31] also in pathological gait [17,32].
The aim of the present study was to apply a statistical approach to the analysis of sEMG to identify gastrocnemius medialis (GM) and TA activation patterns in the gait of PD patients, taking potential stride asymmetries into account. More specifically, using data acquired during a 6-min walking test, first, temporal gait symmetry was verified, then occurrence of the different activation patterns, in terms of number and timing within each stride per muscle, and the co-activation of antagonist muscles were quantified.
2. Materials and Methods
2.1. Participants
Twenty PD patients (12 females, 8 males; age 67.2 ± 9.1 years; height 1.65 ± 0.12 m; body mass 67.3 ± 13.1 kg; Hoehn-Yahr stage III, 10 with diagnosis of freezing) participated in the study. All patients were in ON state of Levodopa treatment during the assessment. The study was approved by the local scientific committee and institutional review board (Comitato Etico Interaziendale delle Provincie di Lecco, Como, Sondrio, Italy), and was in accordance with the Code of Ethics of the World Medical Association (Declaration of Helsinki, 1967). A complete explanation of the study protocol was provided to the patients, who signed a written informed consent before their participation in the study. This trial was registered on ClinicalTrials.gov NCT03015714.
2.2. Data Acquisition
Each participant performed a 6-min walking test along a 15 m straight pathway at a self-selected speed wearing own comfortable footwear. Angular velocities of the shanks, used for gait temporal segmentation, were collected using two tri-axial synchronized inertial sensors (OPALs, Apdm, Portland, USA, sampling frequency = 128 Hz) attached to the lateral aspect of each ankle, approximately 0.05 m above the lateral malleolus, using elastic straps.
sEMG signals of GM and TA of both legs were acquired using wireless bipolar surface electromyograph, (Mini Wave, Cometa, Milan, Italy, sampling frequency = 2000 Hz). Sensor placement was performed following SENIAM guidelines [33]: for GM, the electrodes of the sensor were placed on the most prominent bulge of the muscle, aligned longitudinally along the leg [34]; for TA, at 1/3 along the line joining the head of the fibula and the tip of the medial malleolus [34]; bipolar sEMG electrodes are applied around the recommended sensor location with an inter electrode distance of 20 mm.
To synchronize the two systems, the accelerometers embedded in both sEMG sensors (Mini Wave, Cometa, Milan, Italy, sampling frequency = 2000 Hz) and inertial measurement units were used: before acquisition, one of the OPAL sensors was tapped three times on one of the Mini Wave sensor; synchronization was implemented during data processing matching the 3 acceleration peaks acquired by the two systems.
2.3. Data Analysis
Only continuous strides walked along straight paths were considered for the analysis, excluding turns and freezing episodes. Gait events (i.e., foot contact and foot off) were automatically identified from the angular velocity around the medio-lateral axis of the shank [35]. For each subject, stride time was calculated as the difference between two consecutive foot contacts of the same leg.
For the assessment of gait symmetry, the difference between left and right leg of stride time sequences was tested per subject using the Kruskal–Wallis test (statistical significance 5%), since normality of distribution was not verified (Shapiro–Wilk test).
sEMG data were bandpass filtered at 20–450 Hz [36,37], then processed by a double threshold statistical detector to provide the onset and offset time instants of TA and GM activity [38]: per muscle, an amplitude threshold ζ and a numerosity threshold were defined; if at least out of m consecutive samples, in absolute value, are above ζ, activation is considered on and set to 1; elsewhere activation is considered OFF and set to 0. On-set instants are identified with transitions of the activation from 0 to 1, off-set from 1 to 0.
The behavior of the double-threshold detector is determined by three parameters: the amplitude threshold ζ, the numerosity threshold , and the length of the observation window m. The values of ζ and are statistically selected to minimize the value of false-alarm probability and maximize probability of detection for specific signal-to-noise ratio (SNR) and background noise. To guarantee the performance of the threshold detector, only signals with a minimum SNR value of 10 were considered; the value was chosen according to literature [38]. The values of the background noise level and the SNR were estimated using the statistical approach proposed by Agostini et al. [39]. The length duration of the observation window m was set to 60, i.e., 30 ms, as suitable value for the study of muscle activation in gait analysis [38].
Muscle activation events and intervals (off-set—on-set) per gait cycle were normalized with respect to the corresponding gait cycle duration, then, the number n of times the muscle was activate within a single gait cycle was calculated to define the n-activation pattern per gait cycle and per muscle.
To quantify the frequency of occurrence of each n-activation pattern, muscle activations of each muscle were gathered according to the number of detected intervals within each gait cycle and the occurrence frequency of the single n-activation pattern was calculated per muscle and per subject as:
Then, mean and standard dispersion (SD, i.e., standard deviation divided by the square root of the number of strides) values of occurrence frequency of each n-activation patter of each muscle were calculated over subjects.
To characterize the timing of each n-activation pattern, mean and SD of normalized activation events were calculated per n-activation pattern, per muscle, and per patient.
For the co-activation investigation, only patients showing a SNR greater than 10 for both muscles in at least one of the two limbs were considered.
To characterize co-activation [4], per GM n-activation pattern:
- GM activation signal of all gait cycles, normalized with respect to gait cycle duration, were summed up and divided by the number of corresponding gait cycles per subject, then, the resulting subject specific normalized n-activation patterns were summed up and divided by number of subjects.
- The same procedure was replicated per TA n-activation pattern occurring during the same gait cycle of certain GM n-activation pattern.
Coactivation was identified when both concurrent GM and TA normalized n-activation patterns were above 0.1. Matlab R2018a (MathWorks BV, USA) was used for data analysis.
3. Results
Among the 20 subjects, the SNR resulted above the minimum selected value of 10 was in: (i) 5 subjects for both muscles of both legs, (ii) 8 subjects for both muscles of at least for one leg, (iii) 16 subjects for GM and 13 for TA for at least one leg. Therefore, a median of 159 (minimum 48, maximum 208) strides were considered per leg and per subject. For each subject, muscles that showed SNR greater than 10 and considered strides was reported in Table 1.

Table 1.
For each subject, the muscles that showed a signal-to-noise ratio (SNR) larger than 10 are indicated with a cross. The number of strides considered per leg are reported in the bottom line.
Analyzing gait symmetry: no statistical difference was found between the stride time data series of the left and right leg among subjects (maximum difference for 25th percentile, median and 75th percentile between left and right side for each subject, 0,01 s). Since kinematic symmetry (i.e., stride time) was verified for all subjects, data from left and right leg together were analyzed to calculate n-activation pattern occurrence frequency and timing per subject and per muscle.
For GM, the most frequent (42.9 ± 0.8% occurrence frequency) was the 2-activation pattern: the first activation for all patients at the transition between flat foot contact and push-off; the second activation in 9 out of 16 subjects (1, 3, 6, 8, 12, 13, 14, 16, 19) at the turn of pre- and initial swing, in 2 (17 and 18) during terminal stance, in 1 (4) at initial swing, and in 4 (2, 10, 15, 20) during mid-swing.
The second most frequent (28.0 ± 1.0%) was 1-activation pattern, with a timing similar to the 2-activation pattern for all patients but with no activation during the swing phase.
The third most frequent (21.0 ± 0.9%) was the 3-activation pattern: the first two activations during stance in all subjects but with the exception of 3 (2, 10, 15), around stance-swing transition, in the first half, and at the beginning of swing, respectively; the third during initial and mid-swing for all subjects but 4 (2, 3, 4, 10) during final swing.
The fourth most frequent (7.5 ± 0.6%) was the 4-activation pattern: with an activation scheme similar to the 3-activation pattern during the stance phase and a high variability of the timing of very short activations during the swing phase.
The least frequent (2.5 ± 0.4%) was the 5-activation pattern that, with respect to the other patterns described above, showed several discontinuous activations with high variability during both stance and swing phases, with in some cases (1, 2, 14, and 19) a prolonged activation during mid-stance together with shorter ones.
Occurrence frequency of GM activation pattern is depicted in Figure 1, and timing over gait cycle of the 5 activation patterns for GM in Figure 2.
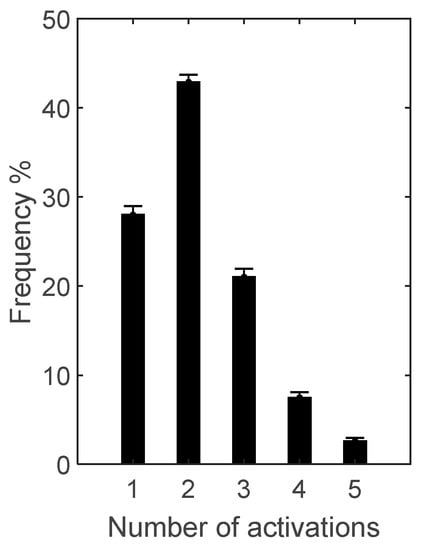
Figure 1.
Occurrence frequency (mean ± SD) of the 5 activation patterns of gastrocnemius medialis (GM) over the 16 subjects for whom GM signal-to-noise ratio resulted above the selected threshold of 10.
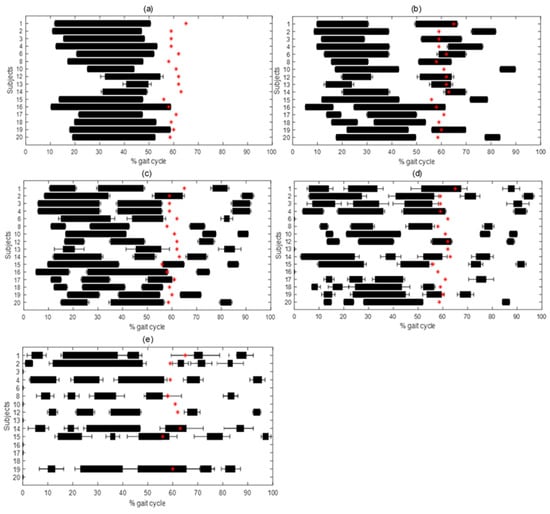
Figure 2.
Mean ± SD activation intervals in percentage of gait cycle for 1- (a), 2- (b), 3- (c), 4- (d) and 5- (e) activation pattern in GM. Mean value of foot-off in percentage of gait cycle is represented with a red star, representing the beginning of swing phase.
For TA, the most frequent (39.5 ± 0.7%) was the 3-activation pattern: in 8 subjects out of 13 (1, 3, 6, 11, 15, 16, 17, 18) the first activation at the beginning, and in 5 (5, 8, 9, 12, 20) during mid/final stance; the second in the first half of the swing phase in 6 (3, 5, 6, 8, 15, 18, 20), around the stance to swing-transition in 5 (1, 9, 11, 12, 17), only in 1 subject (16) in the second half of the stance phase; the third in terminal swing for all subjects but 1 (16), anticipating the activation to initial swing phase.
The second most frequent (28.7 ± 0.9%) was the 4-activation pattern: the first at the beginning of stance for all subjects but 1 (20) at mid-stance; the second from mid- to final stance in 9 subjects (1, 3, 6, 9, 11, 12, 16, 17, 18), in 2 (15, 20) around stance to swing transition, and in 2 (5, 8) at the beginning of swing; the third in 5 subjects (5, 6, 15, 18, 20) at mid-swing, in 4 (1, 11, 16, 17) around stance to swing transition, and in 4 (3, 8, 9, 12) in the first half of swing; the fourth at the end of swing in all subjects but 1 (16) at mid-swing.
The third most frequent (17.9 ± 1.0%) was the 2-activation pattern: the first in 5 subjects (1, 9, 11, 12, 18) during the second half of stance, in 4 (3, 5, 8, 17) around stand to swing transition, in 2 (6, 16) during the first half pf stance, in 1 (15) at midstance, and in 1 (20) during the first half of the swing phase; the between mid- or final swing for all subjects but 2 (6, 16) during initial swing.
The fourth (9.8 ± 0.6%) was the 5-activation pattern: first activation at the beginning of stance for all subjects; second variably distributed from initial to late stance in all subjects; third in 6 subjects (1, 9, 11, 12, 16, 17) in the second half of stance, in 2 (3, 8) at the stance to swing transition, in 5 (5, 6, 15, 18, 20) at the beginning of swing; the fourth between initial and mid-swing for all subjects but 2 around stance to swing transition (1) and in late swing (6); the fifth at the end of swing in 10 subjects (1, 3, 6, 8, 9, 11, 15, 17, 18, 20), at mid-swing in 2 (5, 16), and at early swing in 1 (12).
The least frequent (3.0 ± 0.4%) was the 1-activation pattern, exhibited only by 6 out of 13 subjects (1, 3, 5, 9, 12, 18), varying largely between the end of stance and the end of swing.
Occurrence frequency of TA activation pattern is depicted in Figure 3, and timing over gait cycle of the five activation patterns for TA in Figure 4.
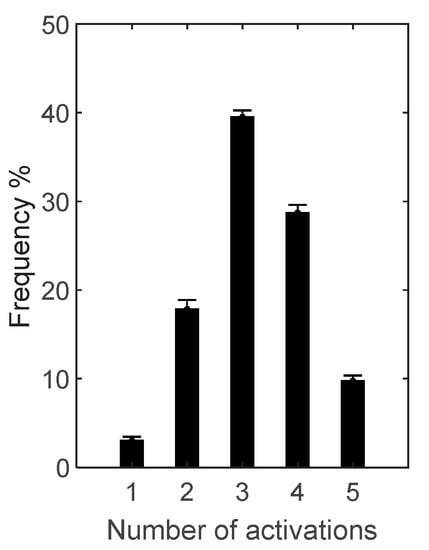
Figure 3.
Occurrence frequency (mean ± SD) of the 5 activation patterns of tibialis anterior (TA) over the 13 subjects for whom TA signal-to-noise ratio resulted above the selected threshold of 10.
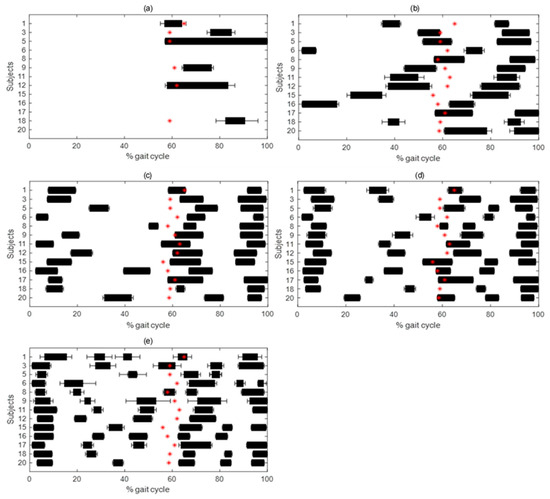
Figure 4.
Mean ± SD activation intervals in percentage of gait cycle for 1- (a), 2- (b), 3- (c), 4- (d), and 5- (e) activation pattern in TA. Mean value of foot-off in percentage of gait cycle is represented with a red star, representing the beginning of swing phase.
All GM n-activation patterns showed TA coactivation, for TA 2-, 3-, 4-activation patterns, at the beginning of stance from foot contact, approximately from 0% to 20% of the gait cycle, and in preparation of foot off, approximately from 55% to 65% of the gait cycle. With more than 1 GM activation (i.e., 2, 3, 4-activation patterns) a third TA coactivation phase was identified from mid-swing to foot contact again, approximately from 75% to 100% of the gait cycle.
Coactivation for TA 1-activation and 5-activation patterns was not reported due to rare occurrence of the former and large variability of intermediate activations in the latter.
Normalized n-activation patterns of GM and TA and corresponding coactivation intervals are depicted in Figure 5.
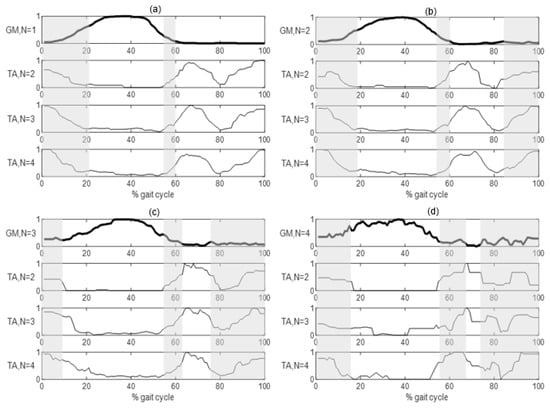
Figure 5.
Normalized activation intervals of TA detected strides where GM (thicker lines) showed 1- (a), 2- (b), 3- (c) and 4- (d) activation pattern. Co-contractions intervals, where both concurrent patterns are above 0.1, are highlighted by vertical grey bands.
4. Discussion
The present work analyzed sEMG in a population of 20 PD patients for the assessment of GM an TA activation patterns during gait using a statistical approach for the processing of a large number of strides.
Previous studies [25,26,27,28,29,40] evaluating muscle activation in PD patients reported non-concordant results probably due to the limited (from few units to a couple of tens) number of gait cycles per subject, indicating a single reference activation pattern for each muscle.
The relatively recent application of a statistical approach for the analysis of sEMG from long gait sequences (i.e., multiple decades of gait cycles) highlighted that different activation patterns can occur even in healthy gait [4,12,13,14,15,16] and in hemiplegic children [32], as preliminary application to pathological conditions. In the present study, the application of a statistical approach was applied in PD patients to long gait sequences from a 6-min walking test (i.e., in the order of multiple decades of gait cycles) to identify the different possible gait patterns.
Approaching the analysis of gait in pathology, specific conditions have to be addressed. Previous studies that applied statistical EMG analysis to the gait of healthy subjects did not tackle the issue of gait symmetry, as in healthy subjects no difference between left and right sides is reasonably considered [15,16]. Considering the pathological population under investigation in the present study, this hypothesis must be verified exploiting an approach coherent with the further statistical analysis on the on/off timing activation pattern. In the present study, overall symmetry was investigated using stride time as a discrete temporal indicator in accordance with previous studies [20].
The application of the statistical approach [38] to sEMG in the analyzed PD population after gait symmetry assessment allowed us to identify different activation patterns for both GM and TA, supporting the existence of an intrinsic variability in EMG activation schemes even in a paradigmatic motor task as gait, as already observed in healthy subjects [10,12,17] and hemiplegic children [32]. In more detail, 5 activation patterns were identified by the computational procedure for both muscles, although, based on the quantification of occurrence frequency, only four can be considered significant for GM (i.e., the 5-activation pattern excluded having an occurrence frequency below 3%), and four for TA (i.e., the 1-activation pattern excluded due to occurrence frequency below 4% and in a minority of subjects), although the TA 5-activation pattern presented a low but significant occurrence frequency (in the order of 10%), resulted too variable in timing to allow a systematic characterization.
As already observed in healthy subjects, GM activity was centered between flat foot contact and push off, and in the final swing: even if shorter and delayed, the first activation is also found in PD, highlighting the active participation in stabilizing ankle dorsiflexion during the forward progression [3,11]; the second region of activity mainly occurred during the early- and mid-swing, anticipating the activation timing observed in healthy adults [12]. When no statistical approach was applied and only the triceps surae mean single timing pattern was estimated, this second region of activity was not observed [31]. For TA, the muscular activity of healthy subjects resulted to be centered from the pre-swing to the following loading response and during the mid-stance [12]. In the analyzed PD subjects, the activity at the beginning of the gait cycle was absent or delayed, showing alterations that normally contribute to foot positioning at the touch down [27]. Moreover, the activations during the swing phase were generally shorter and anticipated, showing a compensation of the anticipation in the activation of GM during the swing phase [27]. These differences in the TA activation pattern were not observed previously with the mean single pattern approach [31].
The coactivation analysis of the two antagonist muscles, GM vs TA, was applied to understand the mechanisms of regulation of joint stiffness and stability [41,42]. To the authors’ knowledge, only one study assessed the coactivation of antagonist muscles using statistical approaches, investigating GA and quadriceps femoris during gait of healthy adults [15]. Following the same methodological approach [15], the co-contraction between GM and TA was quantified as the overlapping of activation intervals. In the analyzed PD subjects, results showed two or three GM-TA co-activation intervals within the single gait cycle (Figure 5), confirming the maintained reciprocity of antagonist nature of considered muscles [27]: the first coactivation lasted from heel strike to mid-stance and can be associated to ankle stabilization during the early stance [43]; the second activation occurred from the pre—to initial swing, when TA contributes to rapid dorsi-flexion of the foot during swing phase [44], while GM activity is commonly related to the plantar-flexion needed for the heel raising [45]; the third and last coactivation occurred during late swing, when TA acts as ankle dorsi-flexor and GM as foot-invertor [12], to properly positioning and stabilizing the foot for the following foot contact [11,46]. First and second coactivations occurred for every GM and TA n-activation pattern, while the third coactivation did not occur for the GM 1-activation pattern, independently from the associated TA n-activation pattern.
Due to the number of analyzed PD subjects and their specific characteristics (e.g., severity and ON state of Levodopa therapy), the results of the present study cannot be generalized to PD population; nevertheless, the exploited statistical approach, applied to a large number of strides acquired in ecological conditions, demonstrated the capability to also identify different activation patterns in the target pathologic population, allowing to quantify the occurrence frequency of each, analyze activation timing distribution per activation pattern, and coactivation as related to specific activation patterns, supporting the methodological aim of the present study.
The use of a statistical approach to identify activation patterns from sEMG in the selected pathologic population supported a better insight in the analysis of muscle activation and control, and can be used for monitoring and understanding how muscle activity changes with the development of the pathology. Moreover, it provided quantitative parameters to support further analysis (e.g., occurrence frequency of each n-activation pattern, presence/absence of a certain muscle activity in a specific gait phase) that can also be exploited to size sample and gait duration or can be included, together with spatio-temporal parameters, in the statistical methods/models for the general analysis of gait in PD patients [47,48,49].
In addition, the approach allows for the estimate of SNR on the signal, and the constraint on SNR allows us to guarantee the quality of the analyzed data and of the resulting outcome, although the constraint can lead to the discarding of part of the acquired data, as not all gait cycles can be included in the analysis (Table 1). Therefore, for the application of statistical approach, not only do long sequences of gait have to be acquired, but also great care must be paid during the experimental procedure (e.g., skin preparation, electrode placement etc.) to minimize the loss of acquired data. The verification of symmetry, as in the present study, allows us to increment the statistical power of the data-set, computing data from the right and left side together, nevertheless, this verification is not guaranteed in pathologic subjects and specific inspection must be previously performed.
5. Conclusions
The present study evaluated GM and TA activation in PD patients, proposing a comprehensive step-to-step analysis procedure based on a statistical approach from the detection of activation patterns from long gait sequences acquired in ecological conditions, integrated with verification of gait symmetry and coactivation analysis. The analysis allowed to identify different muscle activation patterns and their relative occurrence frequency, as well as coactivation schemes, in PD subjects, providing novel insight with respect to literature, where unique average patterns were identified, providing at times conflicting results. The improved methodology, here applied as an example to GM and TA in 20 PD subjects, is meant to be considered as a general procedure to be applied for the analysis of muscle activation patterns in pathologic subjects.
Author Contributions
Data curation, G.P.P., M.F.; Formal analysis, S.F. and R.S.; Methodology, G.P.P., S.F., R.S.; Project administration, D.F., G.F., S.F., R.S.; Software, G.P.P.; Supervision, S.F., R.S.; Writing—original draft, G.P.P.; Writing—review and editing, G.P.P., M.C.B., S.F., R.S. All authors have read and agreed to the published version of the manuscript.
Funding
This research received no external funding.
Conflicts of Interest
The authors declare no conflict of interest.
References
- Mortka, K.; Wiertel-Krawczuk, A.; Lisiński, P. Muscle Activity Detectors—Surface Electromyography in the Evaluation of Abductor Hallucis Muscle. Sensors 2020, 20, 2162. [Google Scholar] [CrossRef] [PubMed]
- Türker, H.; Sze, H.; Sözen, H.T.A.H. Surface Electromyography in Sports and Exercise. Electrodiagnosis New Front. Clin. Res. 2013. [Google Scholar] [CrossRef]
- Sutherland, D. The evolution of clinical gait analysis part l: Kinesiological EMG. Gait Posture 2001, 14, 61–70. [Google Scholar] [CrossRef]
- Di Nardo, F.; Agostini, V.; Knaflitz, M.; Mengarelli, A.; Maranesi, E.; Burattini, L.; Fioretti, S. The occurrence frequency: A suitable parameter for the evaluation of the myoelectric activity during walking. In Proceedings of the 2015 37th Annual International Conference of the IEEE Engineering in Medicine and Biology Society (EMBC), Milan, Italy, 25–29 August 2015; pp. 6070–6073. [Google Scholar] [CrossRef]
- Zhang, X.; Zhou, P. Sample entropy analysis of surface EMG for improved muscle activity onset detection against spurious background spikes. J. Electromyogr. Kinesiol. Off. J. Int. Soc. Electrophysiol. Kinesiol. 2012, 22, 901–907. [Google Scholar] [CrossRef]
- Liu, J.; Ying, D.; Rymer, W.Z.; Zhou, P. Robust Muscle Activity Onset Detection Using an Unsupervised Electromyogram Learning Framework. PLoS ONE 2015, 10, e127990. [Google Scholar] [CrossRef]
- De Luca, C.J. The Use of Surface Electromyography in Biomechanics. J. Appl. Biomech. 1997, 13, 135–163. [Google Scholar] [CrossRef]
- Tirosh, O.; Sangeux, M.; Wong, M.; Thomason, P.; Graham, K. Walking speed effects on the lower limb electromyographic variability of healthy children aged 7–16 years. J. Electromyogr. Kinesiol. 2013, 23, 1451–1459. [Google Scholar] [CrossRef]
- Chang, W.N.; Lipton, J.S.; Tsirikos, A.I.; Miller, F. Kinesiological surface electromyography in normal children: Range of normal activity and pattern analysis. J. Electromyogr. Kinesiol. 2007, 17, 437–445. [Google Scholar] [CrossRef]
- Agostini, V.; Nascimbeni, A.; Gaffuri, A.; Imazio, P.; Benedetti, M.G.; Knaflitz, M. Normative EMG activation patterns of school-age children during gait. Gait Posture 2010, 32, 285–289. [Google Scholar] [CrossRef]
- Perry, J.; Burnfield, J. Gait Analysis: Normal and Pathological Function, 2nd ed.; Slack Inc: Thorofare, NJ, USA, 2010. [Google Scholar]
- Di Nardo, F.; Ghetti, G.; Fioretti, S. Assessment of the activation modalities of gastrocnemius lateralis and tibialis anterior during gait: A statistical analysis. J. Electromyogr. Kinesiol. Off. J. Int. Soc. Electrophysiol. Kinesiol. 2013, 23, 1428–1433. [Google Scholar] [CrossRef]
- Di Nardo, F.; Fioretti, S. Statistical analysis of surface electromyographic signal for the assessment of rectus femoris modalities of activation during gait. J. Electromyogr. Kinesiol. 2013, 23, 56–61. [Google Scholar] [CrossRef] [PubMed]
- Di Nardo, F.; Maranesi, E.; Mengarelli, A.; Ghetti, G.; Burattini, L.; Fioretti, S. Assessment of the variability of vastii myoelectric activity in young healthy females during walking: A statistical gait analysis. J. Electromyogr. Kinesiol. 2015, 25, 800–807. [Google Scholar] [CrossRef] [PubMed]
- Mengarelli, A.; Gentili, A.; Strazza, A.; Burattini, L.; Fioretti, S.; Di Nardo, F. Co-activation patterns of gastrocnemius and quadriceps femoris in controlling the knee joint during walking. J. Electromyogr. Kinesiol. 2018, 42, 117–122. [Google Scholar] [CrossRef] [PubMed]
- Di Nardo, F.; Mengarelli, A.; Maranesi, E.; Burattini, L.; Fioretti, S. Gender differences in the myoelectric activity of lower limb muscles in young healthy subjects during walking. Biomed. Signal Process. Control 2015, 19, 14–22. [Google Scholar] [CrossRef]
- Di Nardo, F.; Strazza, A.; Mengarelli, A.; Cardarelli, S.; Tigrini, A.; Verdini, F.; Nascimbeni, A.; Agostini, V.; Knaflitz, M.; Fioretti, S. EMG-Based Characterization of Walking Asymmetry in Children with Mild Hemiplegic Cerebral Palsy. Biosensors 2019, 9, 82. [Google Scholar] [CrossRef]
- Grazia, M.; Knaflitz, M.; Agostini, V.; Bonato, P. Muscle Activation Patterns During Level Walking and Stair Ambulation. Appl. EMG Clin. Sports Med. 2012. [Google Scholar] [CrossRef]
- Conti, M.; Martínez Madrid, N.; Seepold, R.; Orcioni, S. Mobile Networks for Biometric Data Analysis; Springer International Publishing: Cham, Switzerland, 2016. [Google Scholar] [CrossRef]
- Vitečková, S.; Kutilek, P.; Svoboda, Z.; Krupička, R.; Kauler, J.; Szabó, Z. Gait symmetry measures: A review of current and prospective methods. Biomed. Signal Process. Control 2018, 42, 89–100. [Google Scholar] [CrossRef]
- Moevus, A.; Mignotte, M.; De Guise, J.A.; Meunier, J. Evaluating perceptual maps of asymmetries for gait symmetry quantification and pathology detection. In Proceedings of the 2014 36th Annual International Conference of the IEEE Engineering in Medicine and Biology Society, Chicago, IL, USA, 26–30 August 2014; pp. 3317–3320. [Google Scholar] [CrossRef]
- Patikas, D.A. EMG Activity in Gait: The Influence of Motor Disorders. In Handbook of Human Motion; Müller, B., Wolf, S.I., Brueggermann, G.P., Deng, Z., McIntosh, A., Miller, F., Selbie, W.S., Eds.; Springer International Publishing: Cham, Switzerland, 2016; pp. 1–26. [Google Scholar]
- Bailey, C.A.; Corona, F.; Murgia, M.; Pili, R.; Pau, M.; Côté, J.N. Electromyographical Gait Characteristics in Parkinson’s Disease: Effects of Combined Physical Therapy and Rhythmic Auditory Stimulation. Front. Neurol. 2018, 9. [Google Scholar] [CrossRef]
- Nieuwboer, P.A.; Dom, R.; De Weerdt, W.; Desloovere, K.; Janssens, L.; Stijn, V. Electromyographic profiles of gait prior to onset of freezing episodes in patients with Parkinson’s disease. Brain 2004, 127, 1650–1660. [Google Scholar] [CrossRef]
- Cioni, M.; Richards, C.L.; Malouin, F.; Bedard, P.J.; Lemieux, R. Characteristics of the electromyographic patterns of lower limb muscles during gait in patients with Parkinson’s disease when OFF and ON L-Dopa treatment. Ital. J. Neurol. Sci. 1997, 18, 195–208. [Google Scholar] [CrossRef]
- Mitoma, H.; Hayashi, R.; Yanagisawa, N.; Tsukagoshi, H. Characteristics of parkinsonian and ataxic gaits: A study using surface electromyograms, angular displacements and floor reaction forces. J. Neurol. Sci. 2000, 174, 22–39. [Google Scholar] [CrossRef]
- Ferrarin, M.; Carpinella, I.; Rabuffetti, M.; Rizzone, M.; Lopiano, L.; Crenna, P. Unilateral and Bilateral Subthalamic Nucleus Stimulation in Parkinson’s Disease: Effects on EMG Signals of Lower Limb Muscles During Walking. IEEE Trans. Neural Syst. Rehabil. Eng. 2007, 15, 182–189. [Google Scholar] [CrossRef] [PubMed]
- Dietz, V.; Zijlstra, W.; Prokop, T.; Berger, W. Leg muscle activation during gait in Parkinson’s disease: Adaptation and interlimb coordination. Electroencephalogr. Clin. Neurophysiol. Mot. Control. 1995, 97, 408–415. [Google Scholar] [CrossRef]
- Dietz, V.; Quintern, J.; Berger, W. Electrophysiological Studies of Gait in Spasticity and Rigidity Evidence that Altered Mechanical Properties of Muscle Contribute to Hyperonia. Brain 1981, 104, 431–449. [Google Scholar] [CrossRef] [PubMed]
- Agostini, V.; Balestra, G.; Knaflitz, M. Segmentation and Classification of Gait Cycles. IEEE Trans. Neural Syst. Rehabil. Eng. 2014, 22, 946–952. [Google Scholar] [CrossRef]
- Rosati, S.; Agostini, V.; Knaflitz, M.; Balestra, G. Muscle activation patterns during gait: A hierarchical clustering analysis. Biomed. Signal Process. Control 2017, 31, 463–469. [Google Scholar] [CrossRef]
- Agostini, V.; Nascimbeni, A.; Gaffuri, A.; Knaflitz, M. Multiple gait patterns within the same Winters class in children with hemiplegic cerebral palsy. Clin. Biomech. 2015, 30, 908–914. [Google Scholar] [CrossRef]
- Hermens, H.; Freriks, B. The State of the Art on Sensors and Sensor Placement Procedures for Surface Electromyography: A Proposal for Sensor Placement Procedures; Roessingh Research and Development: Enschede, The Netherlands, 1997. [Google Scholar]
- Welcome to SENIAM. Available online: http://www.seniam.org/ (accessed on 16 September 2020).
- Salarian, A.; Russmann, H.; Vingerhoets, F.; Dehollain, C.; Blanc, Y.; Burkhard, P.; Aminian, K. Gait Assessment in Parkinson’s Disease: Toward an Ambulatory System for Long-Term Monitoring. IEEE Trans. Biomed. Eng. 2004, 51, 1434–1443. [Google Scholar] [CrossRef]
- Liu, J.; Ying, D.; Rymer, W.Z. EMG burst presence probability: A joint time-frequency representation of muscle activity and its application to onset detection. J. Biomech. 2015, 48, 1193–1197. [Google Scholar] [CrossRef]
- Rashid, U.; Niazi, I.K.; Signal, N.E.J.; Farina, D.; Taylor, D. Optimal automatic detection of muscle activation intervals. J. Electromyogr. Kinesiol. 2019, 48, 103–111. [Google Scholar] [CrossRef]
- Bonato, P.; D’Alessio, T.; Knaflitz, M. A statistical method for the measurement of muscle activation intervals from surface myoelectric signal during gait. IEEE Trans. Biomed. Eng. 1998, 45, 287–299. [Google Scholar] [CrossRef] [PubMed]
- Agostini, V.; Knaflitz, M. An Algorithm for the Estimation of the Signal-To-Noise Ratio in Surface Myoelectric Signals Generated During Cyclic Movements. IEEE Trans. Biomed. Eng. 2012, 59, 219–225. [Google Scholar] [CrossRef] [PubMed]
- Albani, G.; Sandrini, G.; Künig, G.; Martin-Soelch, C.; Mauro, A.; Pignatti, R.; Pacchetti, C.; Dietz, V.; Leenders, K.L. Differences in the EMG pattern of leg muscle activation during locomotion in Parkinson’s disease. Funct. Neurol. 2003, 18, 165–170. [Google Scholar] [PubMed]
- Schmitz, A.; Silder, A.; Heiderscheit, B.; Mahoney, J.; Thelen, D.G. Differences in lower-extremity muscular activation during walking between healthy older and young adults. J. Electromyogr. Kinesiol. Off. J. Int. Soc. Electrophysiol. Kinesiol. 2009, 19, 1085–1091. [Google Scholar] [CrossRef]
- Hortobágyi, T.; DeVita, P. Muscle pre- and coactivity during downward stepping are associated with leg stiffness in aging. J. Electromyogr. Kinesiol. 2000, 10, 117–126. [Google Scholar] [CrossRef]
- Cardarelli, S.; Gentili, A.; Mengarelli, A.; Verdini, F.; Fioretti, S.; Burattini, L.; Di Nardo, F. Ankle Muscles Co-Activation Patterns During Normal Gait: An Amplitude Evaluation. In EMBEC & NBC 2017. EMBEC 2017, NBC 2017. IFMBE Proceedings; Eskola, H., Väisänen, O., Viik, J., Hyttinen, J., Eds.; Springer: Singapore, 2017; Volume 65. [Google Scholar] [CrossRef]
- Lichtwark, G. The role of the tibialis anterior muscle and tendon in absorbing energy during walking. J. Sci. Med. Sport 2014, 18, e129. [Google Scholar] [CrossRef]
- Winter, D.A. The Biomechanics and Motor Control of Human Gait; University of Waterloo Press: Waterloo, ON, Canada, 1987. [Google Scholar]
- Mengarelli, A.; Maranesi, E.; Burattini, L.; Fioretti, S.; Di Nardo, F. Co-contraction activity of ankle muscles during walking: A gender comparison. Biomed. Signal Process. Control 2017, 33, 1–9. [Google Scholar] [CrossRef]
- Wu, Y.; Krishnan, S. Statistical Analysis of Gait Rhythm in Patients with Parkinson’s Disease. IEEE Trans. Neural Syst. Rehabil. Eng. Publ. IEEE Eng. Med. Biol. Soc. 2010, 18, 150–158. [Google Scholar] [CrossRef]
- Khajuria, A.; Joshi, P.; Joshi, D. Comprehensive Statistical Analysis of the Gait Parameters in Neurodegenerative Diseases. Neurophysiology 2018, 50, 38–51. [Google Scholar] [CrossRef]
- Arcolin, I.; Corna, S.; Giardini, M.; Giordano, A.; Nardone, A.; Godi, M. Proposal of a new conceptual gait model for patients with Parkinson’s disease based on factor analysis. Biomed. Eng. Online 2019, 18, 70. [Google Scholar] [CrossRef]
© 2020 by the authors. Licensee MDPI, Basel, Switzerland. This article is an open access article distributed under the terms and conditions of the Creative Commons Attribution (CC BY) license (http://creativecommons.org/licenses/by/4.0/).