Article

Exposing Speech Resampling Manipulation by Local Texture Analysis on Spectrogram Images

1
School of Electronic and Electrical Engineering, Shanghai University of Engineering Science, Shanghai 201620, China
2
Shanghai Key Laboratory of Integrated Administration Technologies for Information Security, Shanghai Jiao Tong University, Shanghai 200240, China
*
Author to whom correspondence should be addressed.
Electronics 2020, 9(1), 23; https://doi.org/10.3390/electronics9010023
Submission received: 23 November 2019 / Revised: 9 December 2019 / Accepted: 16 December 2019 / Published: 25 December 2019
(This article belongs to the Section Artificial Intelligence)

Abstract

:
Speech tampering may be aided by the resampling operation. It is significant for speech forensics to effectively detect the resampling; however, there are few studies on speech resampling detection. The purpose of this paper was therefore to provide a new training ideal to detect speech resampling. After resampling, the speech signal changes regularly in the time–frequency domain. In this paper, we theoretically analyzed the corresponding relationship between time domain and frequency domain of the resampled speech. Compared with the original speech, the bandwidth of resampled speech was stretched or compressed. First, the spectrogram was generated by short-time Fourier transform (STFT) from the speech. Then, the local binary pattern (LBP) operator was applied to model the statistical changes in the spectrogram and the LBP histogram was calculated as discriminative features. Finally, a support vector machine (SVM) was applied to classify the developed features to identify whether the speech had undergone the resampling operation. The experimental results show that the proposed method has superior detection performance in different resampling scenarios than some existing methods, and the proposed features are very robust against the commonly used compression post-processing operation. This highlights the promising potential of the proposed method as a speech resampling detection tool in practical forensics applications.

1. Introduction

The digital information age has accelerated the development of multimedia, which is now universally present in people’s daily lives. Common multimedia includes video, image, audio, and so on. Due to the popularity and intelligence of media editing tools, people can edit and spread media easily, making the primitiveness and authenticity of multimedia unguaranteed. Multimedia forensics technology has become a leading research topic in the field of information security. Multimedia forensics can be divided into active forensics and passive forensics. Active forensics requires embedding prior information (called a watermark) into the media before the media is released. The extracted watermark is compared with the original watermark at the receiving end, and the primitiveness and authenticity of the media are identified according to the changes in the watermark. On the contrary, passive forensics is a direct detection of media information without prior information. The application scenario of passive forensics is more extensive, but its technical requirements are also higher. Recently, passive image forensics has been the subject of many state-of-the-art studies [1,2,3,4], but the research on passive audio forensics is still in its infancy [5]. Forensic scenarios such as speech source detection [6], speech steganalysis [7], and speech recapture [8], etc., are the categories of passive speech forensics.
Speech tampering tricks include copy-paste, splicing, recompression, recapture, and so on. In recent years, the detection of copy-paste is receiving more attention in speech forensics, which can be detected by principal component analysis (PCA) [6], discrete Fourier transform (DFT) [9], and other algorithms. Speech recompression can be detected by frame inconsistency [10]. According to the high-order correlation in frequency domain, speech recapture identification can achieve promising results [8]. In the field of digital signal processing, the conversion of sampling rate is often encountered. Some forging tricks such as splicing, electronic disguising, and quality faking require the adjustment of the sampling rate to create a realistic speech. It is difficult for the human ear to distinguish whether an audio is resampled or not. Therefore, the detection of speech resampling can be a good assistant for speech forensics.
So far, the detection of speech resampling is still a challenge. Most of the existing detection methods of speech resampling are inspired by image resampling detection methods. In some existing work, speech resampling is detected by analyzing interpolation. Yao et al. [11] analyzed the discrete peak value of speech in frequency to detect speech resampling under the assumption that resampling would introduce periodic artifacts to original speech. However, such a method is only effective for linear interpolation. Chen et al. [12] improved the performance in the cases of different interpolation kernels. The methods [11,12] are greatly influenced by the initial values of parameters and have unsatisfactory detection rates for down-sampling. To avoid this problem, Shi and Ma [13] analyzed the resampling interpolation and detected it by researching the varieties in the linear relationship between the sampling points. After the speech is analyzed by singular value decomposition, a statistical zero singular value average is generated to describe the statistical change, which avoids the problem of high complexity of expectation maximization (EM) algorithms. Unlike analyzing interpolation, Qi and Peng [14] put forward the concept of sub-band smoothing. Based on the fact that the resampled signal loses part of the high-frequency information after low-pass filtering, they computed the smoothness of different sub-bands to detect the speech resampling. However, linear interpolation and nearest-neighbor interpolation have a larger smoothness in the high-frequency part, which affects the detection performance of the method. Inspired by the periodic neighborhood correlation of the image after resampling, Hou et al. [15] analyzed the periodicity of the second-order difference of the speech signal and used the absolute value to replace the variance of second-order difference for automatic detection. However, this method needs to set a threshold to search for the peak value, which is greatly influenced by different interpolation methods. Wang et al. [16] proposed a resampling detection method based on inconsistency between bandwidth and sampling ratio from the perspective of speech characteristics, using the receiver operating characteristic curve to find the best threshold to judge speech resampling based on the logarithmic energy ratio. This method does not work well in the case of speech down-sampling.
Based on the existing research, this paper started with the relationship between the period and frequency of speech in the resampling process, and used a local binary pattern (LBP) operator to extract the features from the spectrogram. Further, it used the statistical histogram of LBPs to distinguish the resampled speech from the original one by using a support vector machine (SVM). Experimental results show that the proposed method can detect speech resampling effectively under different sample factors and compression bit rates.
The rest of this article is arranged as follows. In Section 2, the principle of resampling is briefly introduced. In Section 3, the relationship between resampling in time domain and frequency domain is studied theoretically. In Section 4, this paper introduces the proposed feature extraction method. In Section 5, the experimental results of the resampling detection under the different interpolation conditions are considered, and the experimental comparison for different compression bit rates are also given. Finally, in Section 6, conclusions are drawn and future work directions are pointed out.

2. Principle of Resampling

For this paper, the characteristics of signal resampling were taken as the starting point, in order to detect the tampering features. In this section, the principle of resampling is analyzed, which leads to the rule of change on the spectrogram image. The change in the signal’s integer multiple only involves up-sampling, interpolation, or down-sampling, and changes in any multiple requires the combination of up-sampling, interpolation, and down-sampling. Suppose the original signal x ( n ) has m sampling points, p is the interpolation factor, q is the decimation factor, and the resampling factor is expressed as p / q :
(1) Up-sampling: p 1 zero points are inserted between every two points of the signal, and the sampling point of the changed signal x u ( n ) becomes p ( m 1 ) + 1 , which enlarges the signal x ( n ) by a factor of p in the time domain. When n = 1 , 2 , , m , x u ( p ( n 1 ) + 1 ) = x ( n ) ; otherwise, x u ( n ) = 0 .
(2) Interpolation: By convoluting the signal x u ( n ) with the low-pass linear interpolation filter h ( n ) , the interpolated signal x c ( n ) = x ( n ) * h ( n ) can be obtained, which can be divided into linear interpolation, spline interpolation, and cubic interpolation according to the different filters [17].
(3) Down-sampling: Take one point for each q point, that is, the interval between two points is q 1 , and this reduces the signal x c ( n ) by a factor of q in the time domain. The changed signal is x d ( n ) = x c ( 1 + q ( n 1 ) ) ; when n = 1 , 2 , , ( p 1 ) m p , ( p 1 ) m p + 1 , the resampled signal is y ( n ) = x d ( n ) .
Therefore, if p > q, there is an increase in the signal in the time domain, whereas if p < q, there is a decrease in the signal in the time domain. Different types of resampling algorithms can be divided into the above three steps. The difference between speech resampling methods lies in the interpolation filters used in step (2). In this paper, we also discuss the influence of several common interpolation methods on the spectrogram.

3. Effect on the Spectrogram of Speech Resampling
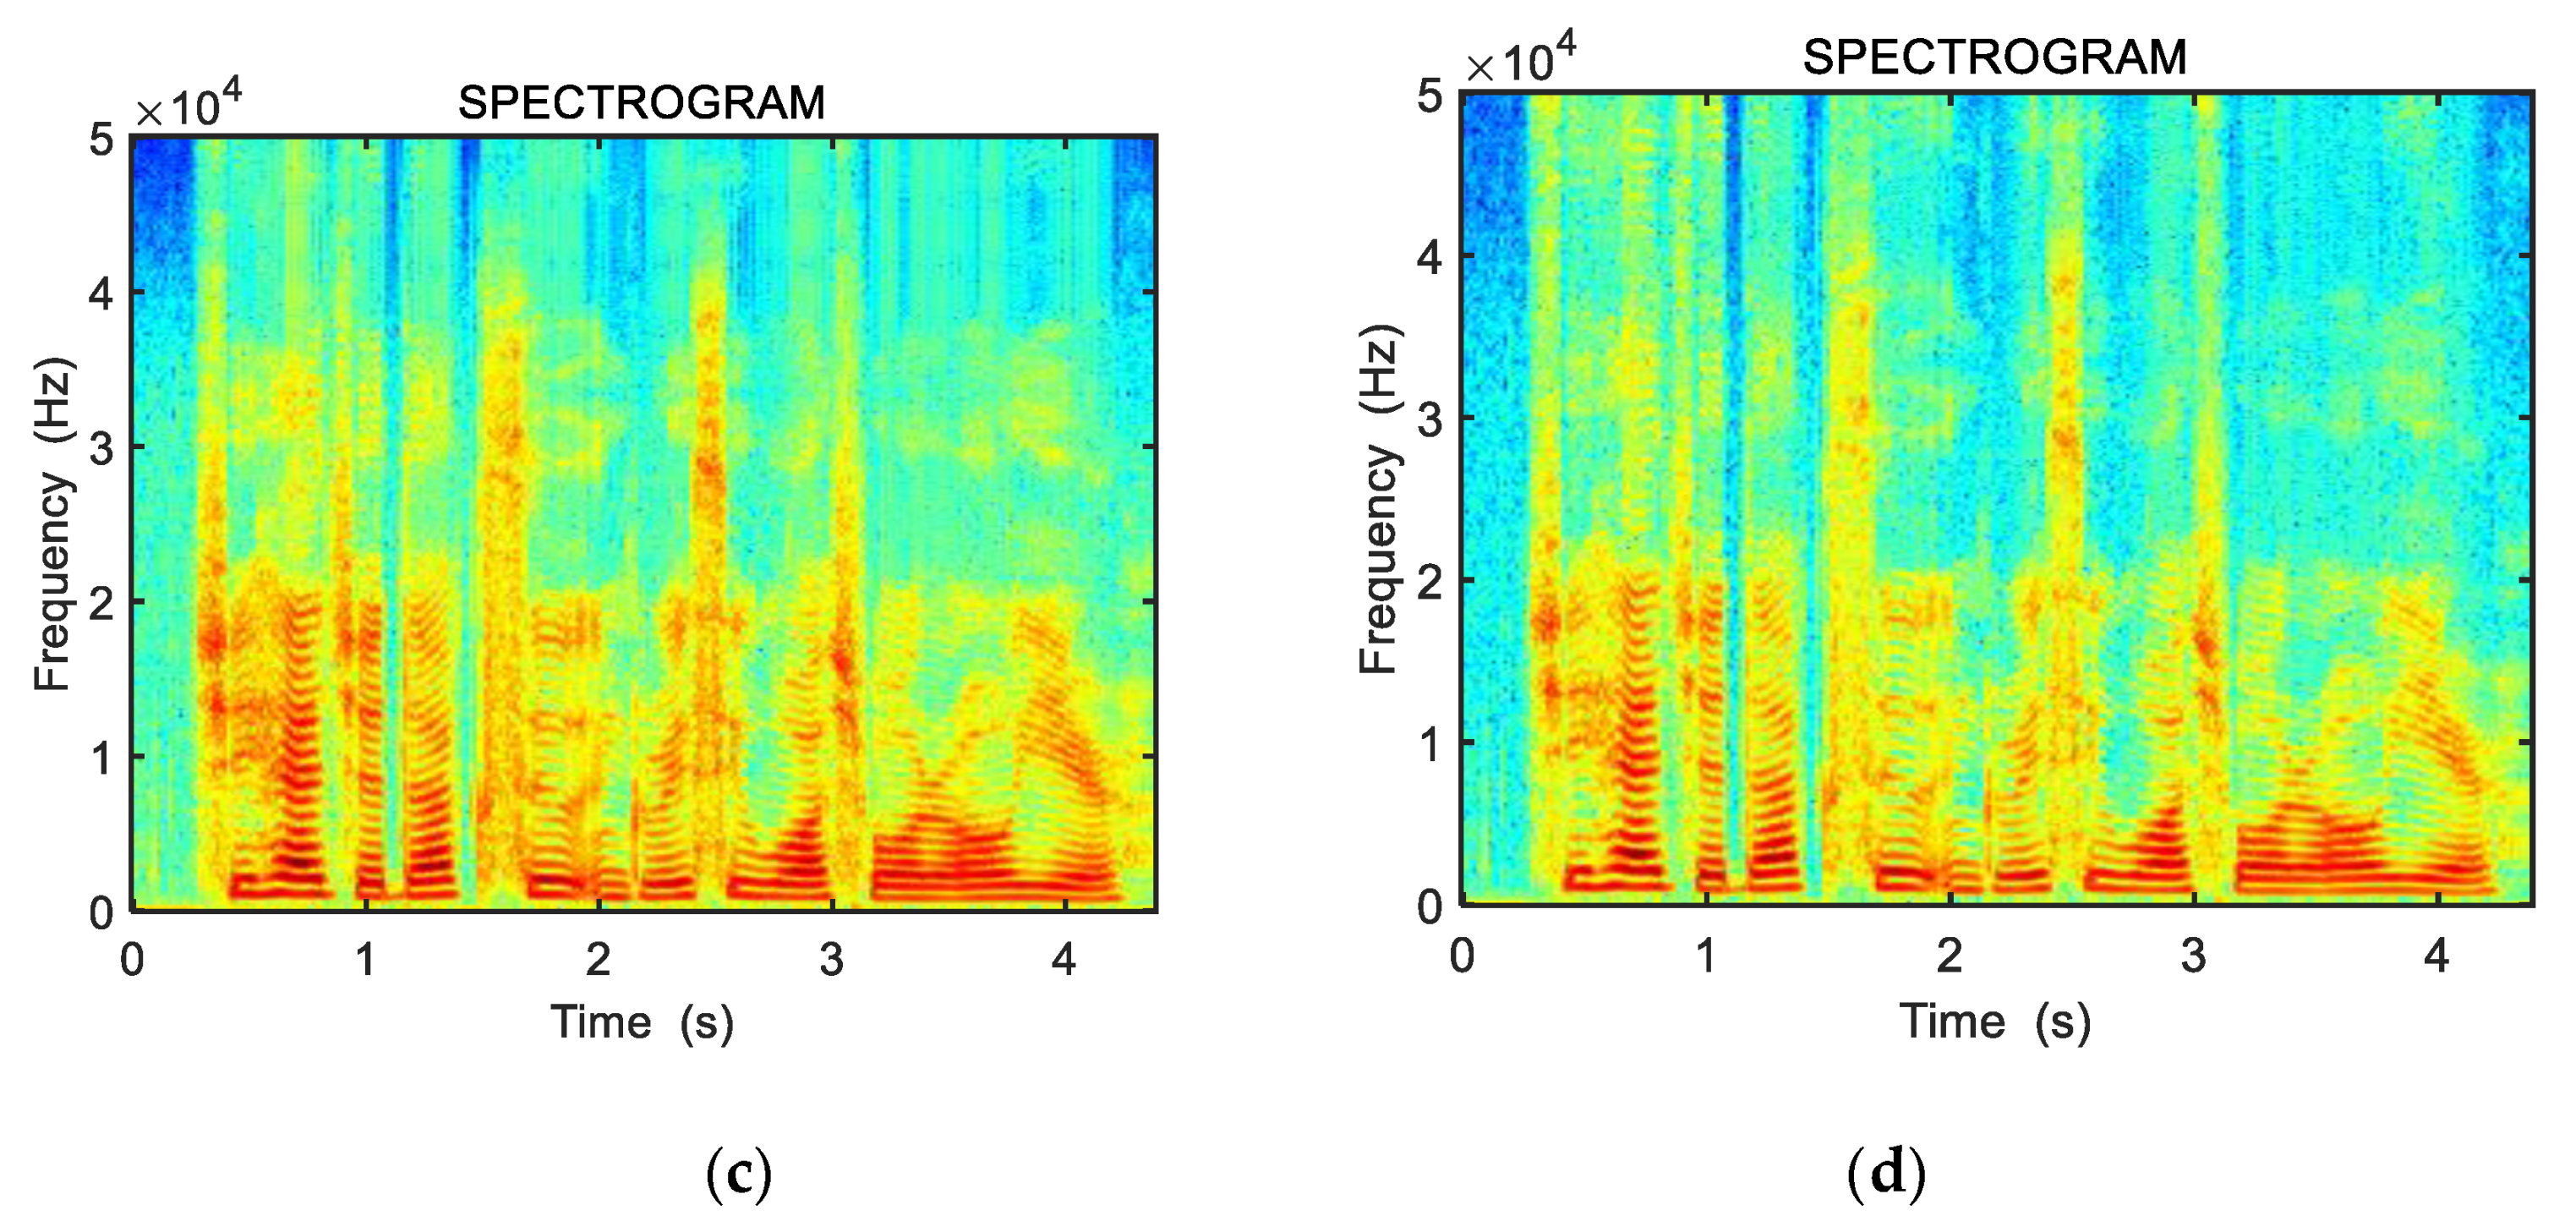
3.1. Spectrogram

It is well known that speech is a nonstationary signal, so the premise of generating a spectrogram is that the speech can be considered stable for a certain period of time. First, we framed the speech signal x ( n ) . The frame length used in this paper was set to 50 ms and the value of the frame shift was 25 ms. The Fourier transform was performed on each frame, and the Fourier transform form X ( k , t ) related to the t-th frame is given by the following:
X ( k , t ) = n = 0 d 1 x ( n ) w ( n ) e 2 k n π d , k = 0 , , d 1 ,
where d is the frame length and w ( n ) is the Hamming window function. Each frame is arranged in a frame shift time to form a linear spectrogram L ( k , t ) , which can be formulated as follows:
L ( k , t ) = | X ( k , t ) | ,
where |·| stands for the amplitude operator and t { 1 , , n 25 50 25 } . A logarithmic spectrogram S ( k , t ) can be generated by taking the logarithm of the linear spectrogram [18], which can be expressed as follows:
S ( k , t ) = l o g ( L ( k , t ) ) .
The purpose of converting a linear spectrogram to a logarithmic one is to reduce the dynamic range of amplitude components by using logarithmic compression. In fact, what the spectrogram presents is three-dimensional information. The horizontal axis represents time, that is, the length of speech; the vertical axis represents frequency; and the depth of color represents the frequency amplitude [19]. Pitch period, frequency band width, and fundamental frequency can be extracted from the spectrogram.

3.2. Relationship between Resampling and Spectrogram

As can be seen from Section 3.1, Fourier transform is a crucial part of the spectrogram generation, so the traces introduced by speech resampling will also be reflected on the spectrogram. Speech can be regarded as a complex signal consisting of k-order harmonics. This section analyzes the relationship between the time domain and frequency domain of k-order harmonics to illustrate the relevant phenomena after the resampling manipulation on the spectrogram.
For harmonic periodic function x ( t ) , for example:
x ( t ) = A c o s ( w t + φ ) ,
where A is the magnitude, φ is the phase angle, and w / ( 2 π ) is the frequency of the function, which can be written using trigonometric equations:
x ( t ) = A c o s φ × c o s w t A s i n φ × s i n w t .
Since φ is a constant, let a = A c o s φ ,   b = A s i n φ ; it can be simplified as follows:
x ( t ) = a c o s w t + b s i n w t .
The Fourier expansion f ( n ) of the signal is as follows:
f ( n ) = a 0 2 + k = 1 ( a k c o s ( k π n l ) + b k s i n ( k π n l ) ) .
Sampling must be introduced between the processes where signals convert analog signals into digital signals. This processes that for the sampling interval for Δ t , k is the order of harmonic, l is one half of the period, N is the sampling number, and n corresponds to the time sequence of time, so the n i Δ t , therefore:
k π n l k π i Δ t N Δ t / 2 = 2 k π i N .
Applying it to the above equation, the discrete Fourier series can be obtained as follows:
n i = a 0 2 + k = 1 m ( a k c o s ( 2 k π i N ) + b k s i n ( 2 k π i N ) )
In the equations:
a 0 = ( 2 N ) i = 1 N 1 x i , a k = ( 2 N ) i = 0 N 1 x i c o s ( 2 k π i N ) ,
b k = ( 2 N ) i = 0 N 1 x i s i n ( 2 k π i N ) , k = 1 , 2 , , m ,
where k = 0 , a 0 is the DC component, and the k-order harmonic of x i can be obtained as follows:
a k c o s ( 2 k π N Δ t ( i Δ t ) ) + b k s i n ( 2 k π N Δ t ( i Δ t ) ) .
The frequency f k and period T k of the k-order harmonic are as follows:
f k = k N Δ t , T k = 1 f k = T k ,
where T is the time of the speech taken. It can be observed from the equation that the frequency of each harmonic function is inversely related to the total time length, which also confirms the scaling characteristics in the Fourier transform:
F ( f ( c t ) ) = 1 | c | F ( w c ) , ( c 0 ) ,
where f is the signal in the time domain, F represents the Fourier transform of the signal, and c is a constant. Therefore, it can be concluded in this paper that when the time domain period changes in multiples, the range of frequency domain also changes correspondingly. For example, when the speech is up-sampled by the factor p, it is equivalent to stretching p times in the time domain, and the frequency of the harmonics will compress p times. At the time of down-sampling, q is applied to the discrete signal again. As shown in Figure 1, the signal shortens by q times in the time domain and stretches by q times in the frequency domain.
From Figure 1, it can be confirmed that the bandwidth of resampled speech is stretched or compressed in the frequency domain, which can be extended to the spectrogram. With the change in the sampling factor, the period of speech in the time domain changes, the bandwidth on the longitudinal axis changes correspondingly, and each harmonic has the same positional movement.
Figure 2 shows the influence of different sampling factors and compression bit rates on the spectrogram. In the bottom left corner is the spectrogram of the original speech. The horizontal axis represents the change in the sampling factor, and the vertical axis represents the change in the MP3 compression bit rate. It can be observed from the horizontal axis and the frequency positions of each harmonic that, after the down-sampling process, the corresponding spectrogram is stretched and the characteristics of the spectrogram are changed when compared with the original speech. At the time of speech up-sampling, the spectrogram is compressed correspondingly, which can be observed from the bandwidth of the whole spectrogram. We observe from the vertical axis that different compression bit rates have no negative effect on the spectrogram, but the effect of resampling still exists. Therefore, the spectrogram-based resampling detection method has a better anti-mp3 compression performance.
Figure 3 shows the changes in the spectrogram under different interpolation methods of the resampled speech, and the resampling factors are all 1.5. It can be seen that except for the zero-complementing interpolation, the common three interpolation methods leave energy residue in the blank band of the spectrogram, but the change pattern still exists. In Section 5, we present the experimental comparison for different interpolation cases.

4. Feature Extraction

After the speech is resampled, the spectrogram is compressed or stretched, and the texture features of the image change accordingly. An LBP histogram is a kind of texture description operator, which is used to extract rich local texture information from images [20]. It puts more emphasis on texture features and the variation of elements in adjacent areas, and can extract local features of the spectrogram well, thereby reflecting the variation pattern of the resampled speech. Therefore, this paper used the LBP histogram to model the local texture change in the spectrogram image.
The change information in the arbitrary direction of the spectrogram was then represented by the difference between the eight-neighborhood elements and the center element. The steps to extract the spectral features using an LBP operator are as follows.
First, the spectrogram was divided into 3 × 3 regions, as shown in Figure 4a. The LBP compares the value of the center element with the surrounding eight elements; the neighborhood element smaller than the center element is marked as 0, otherwise it is marked as 1. The binary value output is calculated using Equation (16). The binary value is multiplied by the weight and then added to obtain the LBP code L C of the central element [21]. The L C represents the LBP code of the central element, T is the threshold, S i stands for the value of each element in the spectrogram, and C i is the binary value output of the LBP.
L C = i = 1 7 C i × 2 i ,
C i = { 0 , S i S c < T 1 , S i S c T ,
where the value of the threshold T is set to 0.
Finally, the histogram of these codes is calculated to represent the characteristic image [22]. Figure 5 is the comparison of the LBP histograms computed from an original speech and its resampled versions.
As can be seen from Figure 5, the local texture features extracted from the spectrogram of the original speech are significantly different from those of the resampled speech. The underlying reason is that the spectrogram is stretched or compressed after resampling manipulation, which leads to the changes in the statistical correlation between the spectrogram’s elements. Therefore, the local details and local textures are correspondingly changed, which can be depicted effectively by the LBP operator. Furthermore, the obtained LBP histogram feature can be fed into the LIBSVM [23] to distinguish the original speech from the resampled one. The LIBSVM is a software package based on the support vector machine.
For the proposed method in this paper, we consider the maximum complexity of each part as the entire complexity of the algorithm, then the time complexity of the spectrogram is T (n) = O (nlog2n) and the LBP is T (n) = O (n2). Thus, the time complexity of the proposed algorithm can be written as T (n) = O (n2). The proposed speech resampling detection process is as follows and shown in Figure 6.
(1) Use short-time Fourier transform to transform input speech into a spectrogram;
(2) Then divide the spectrogram into 3 × 3 regions to calculate the LBP code;
(3) Subsequently, calculate the histogram of these codes for feature representation.
(4) Finally, the obtained LBP histogram feature can be fed into the LIBSVM to distinguish the original speech from the resampled one.

5. Experimental Results and Analysis

The original speech dataset in the experiment was selected from the TIMIT corpus. This corpus contains 6300 utterances, with an average duration of three seconds, from 630 participants in different regions of the United States. The original speech files are mono, PCM encoding, 16 kHz sampling ratio, and 16-bit quantization [16]. In this paper, 3000 original speech samples were selected from the TIMIT corpus. The original speech was resampled by linear, spline, and cubic interpolations separately and the sampling factor was changed from 0.6 to 2 with a step of 0.1 to achieve the resampled databases with linear, splines and cubic interpolations. Then, we used MP3 compression with three different bit rates, namely 32 kbps, 64 kbps, and 128 kbps, to compress the original speech and resampled speech, yielding a compressed speech database with MP3 compression. In order to facilitate the experiment, a mixed corpus was constructed by randomly selecting resampled speech from different interpolation databases (i.e., linear, spline, and cubic interpolations). There was a total of 684,000 speech samples used for the experiment, and the process of making the corpus is shown in Figure 7.

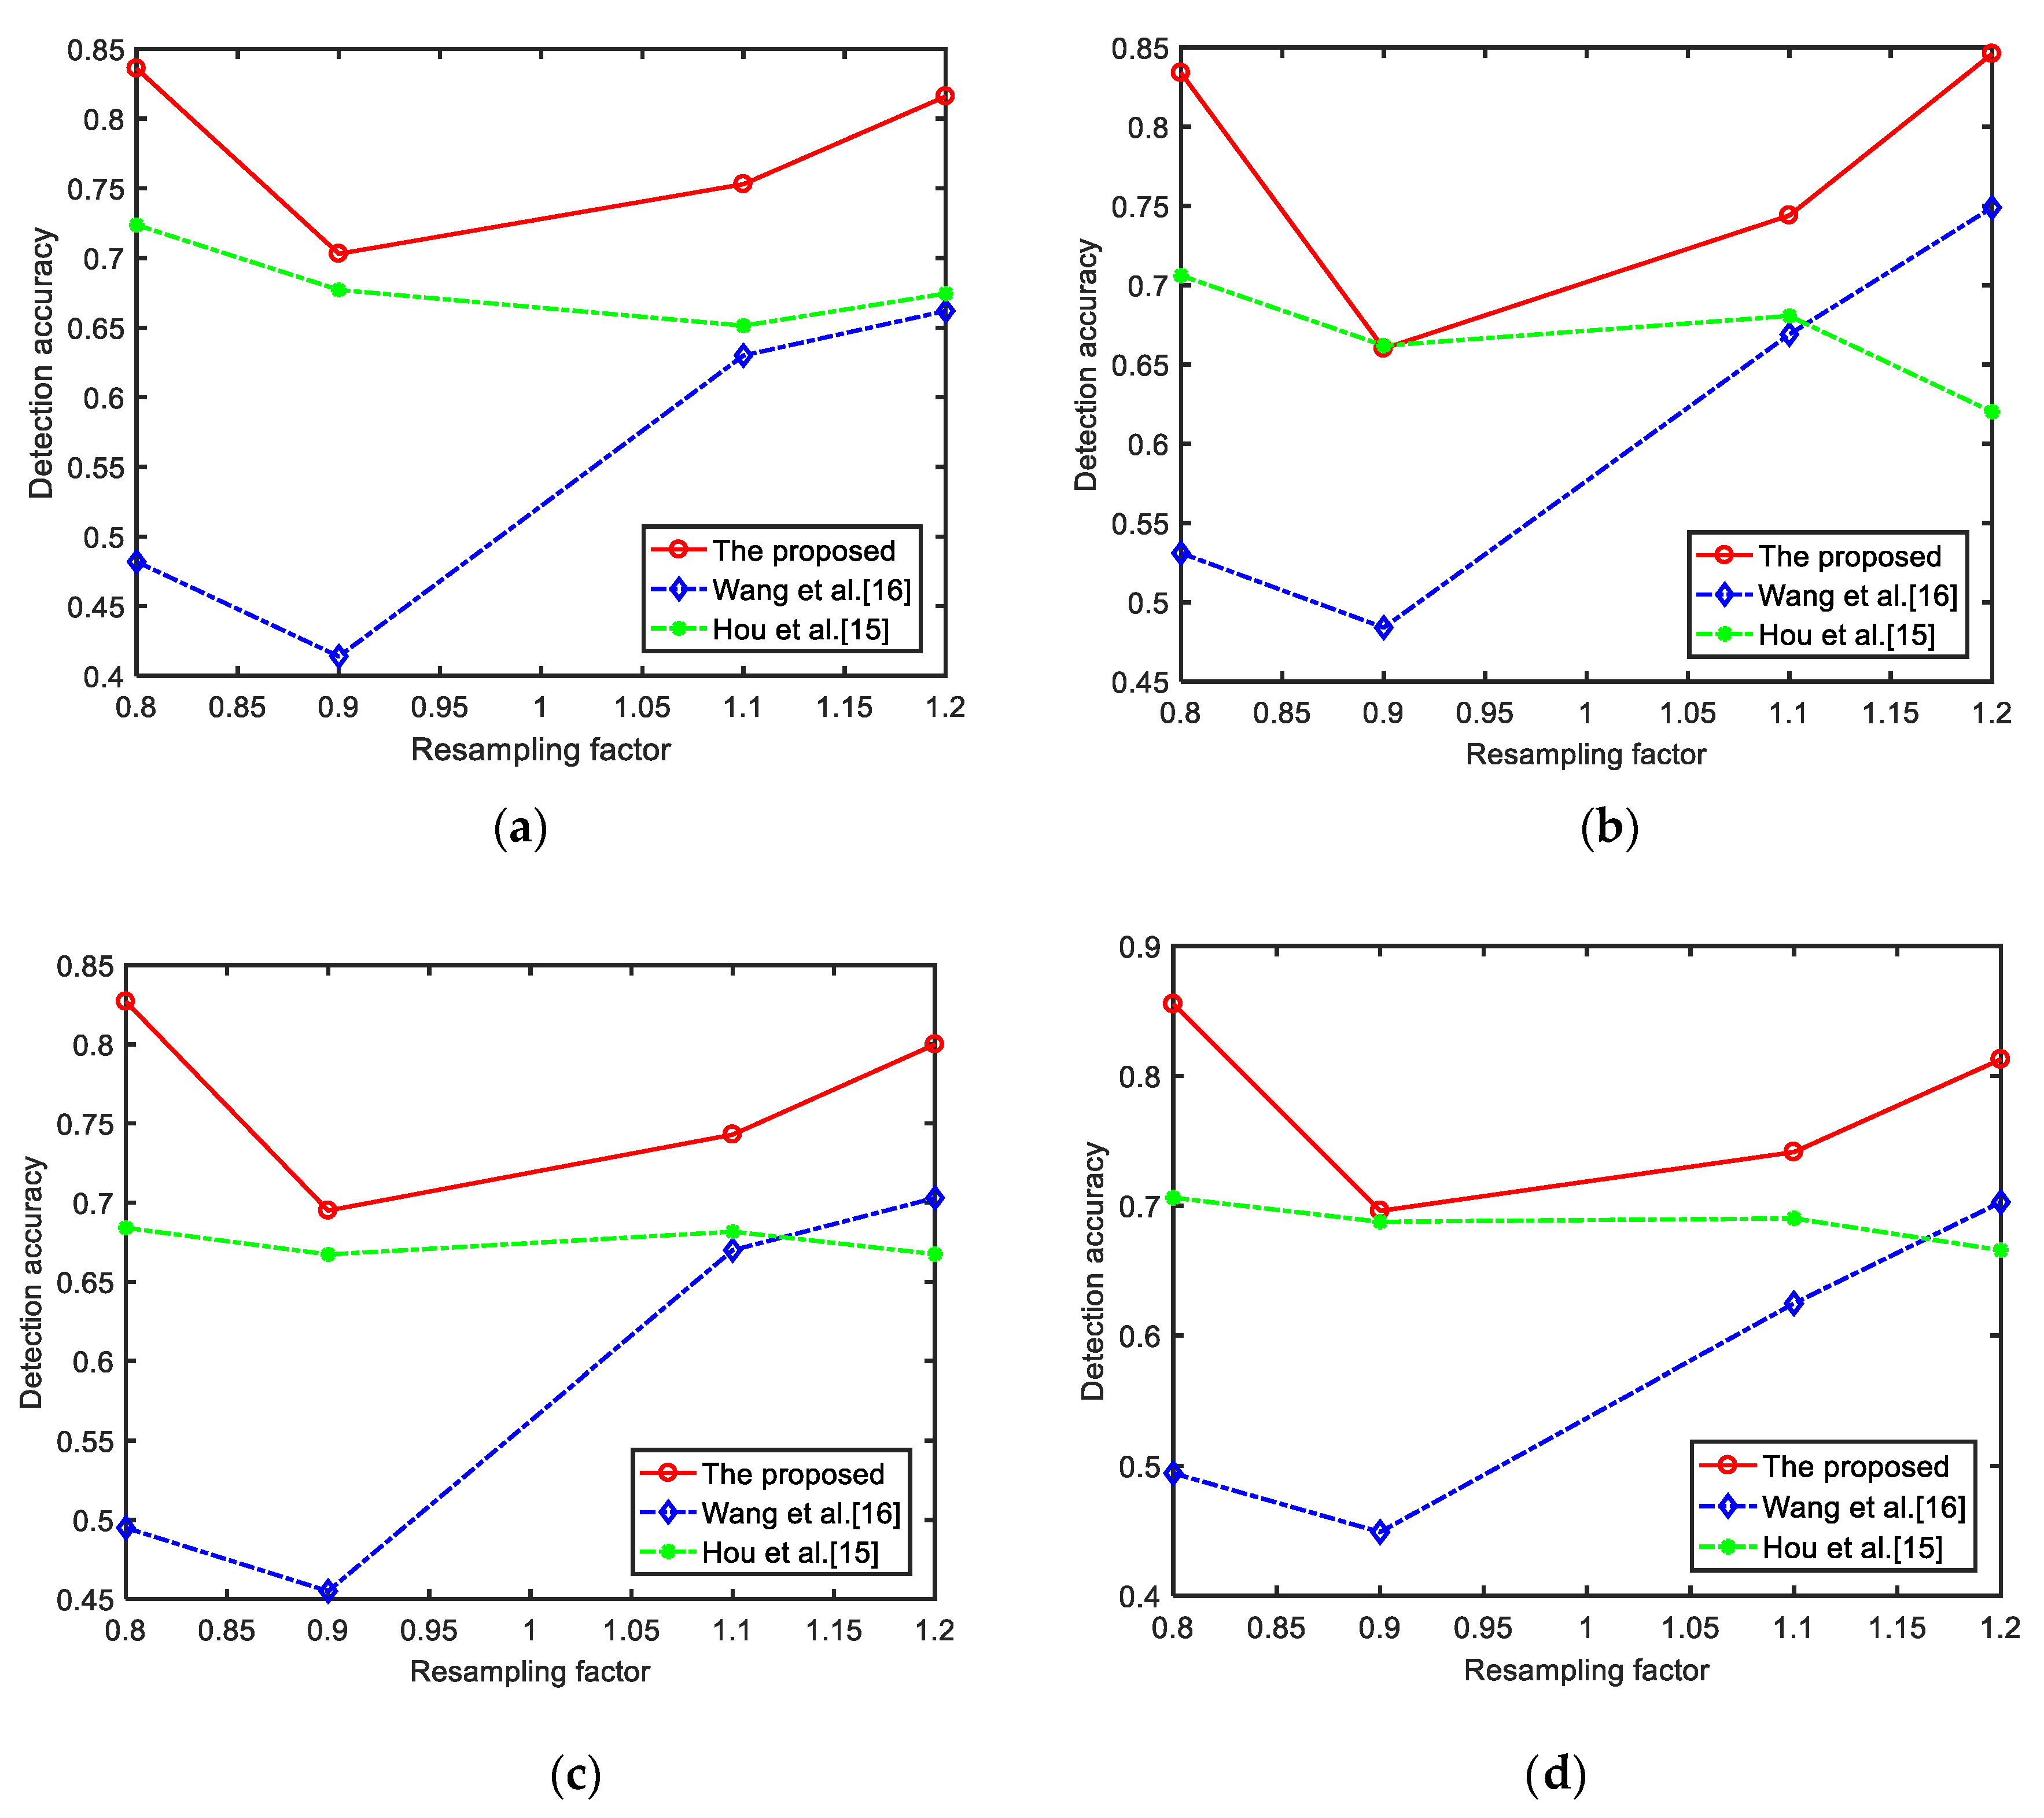
5.1. Experimental Results under Different Compression Interpolation Methods

In Section 2, this paper introduced three steps of speech resampling, namely up-sampling, interpolation, and down-sampling. There are several interpolation methods in resampling, which mainly include linear interpolation, spline interpolation, and cubic interpolation. Therefore, this paper also discusses the influence of various interpolation methods on the detection accuracy of resampling. When the resampling factors are 0.8, 0.9, 1.1, and 1.2, the speech tampering degree is so small that it is difficult to detect. Consequently, this section uses these four representative sampling factors for a comparative study. The kernel of LIBSVM is a radial basis function (RBF), and we use the multiplicative grid of five-fold cross-validation to select the parameters with the smallest error, and the ranges of the parameters c and g are all from 2−5 to 25. It can be concluded from Table 1, Table 2 and Table 3 and Figure 8 that when the resampling factor is greater or smaller than 1, the detection accuracy of all methods is high. Generally speaking, under different interpolation methods, it can be seen that the detection accuracy of the proposed algorithm is higher than that in Wang’s and Hou’s work. It is indicated that the proposed algorithm significantly outperforms these state-of-the-art studies.
For experimental convenience, except for this section, the following experiments in this paper use the mixed resampling corpus of linear interpolation, spline interpolation, and cubic interpolation for the research.

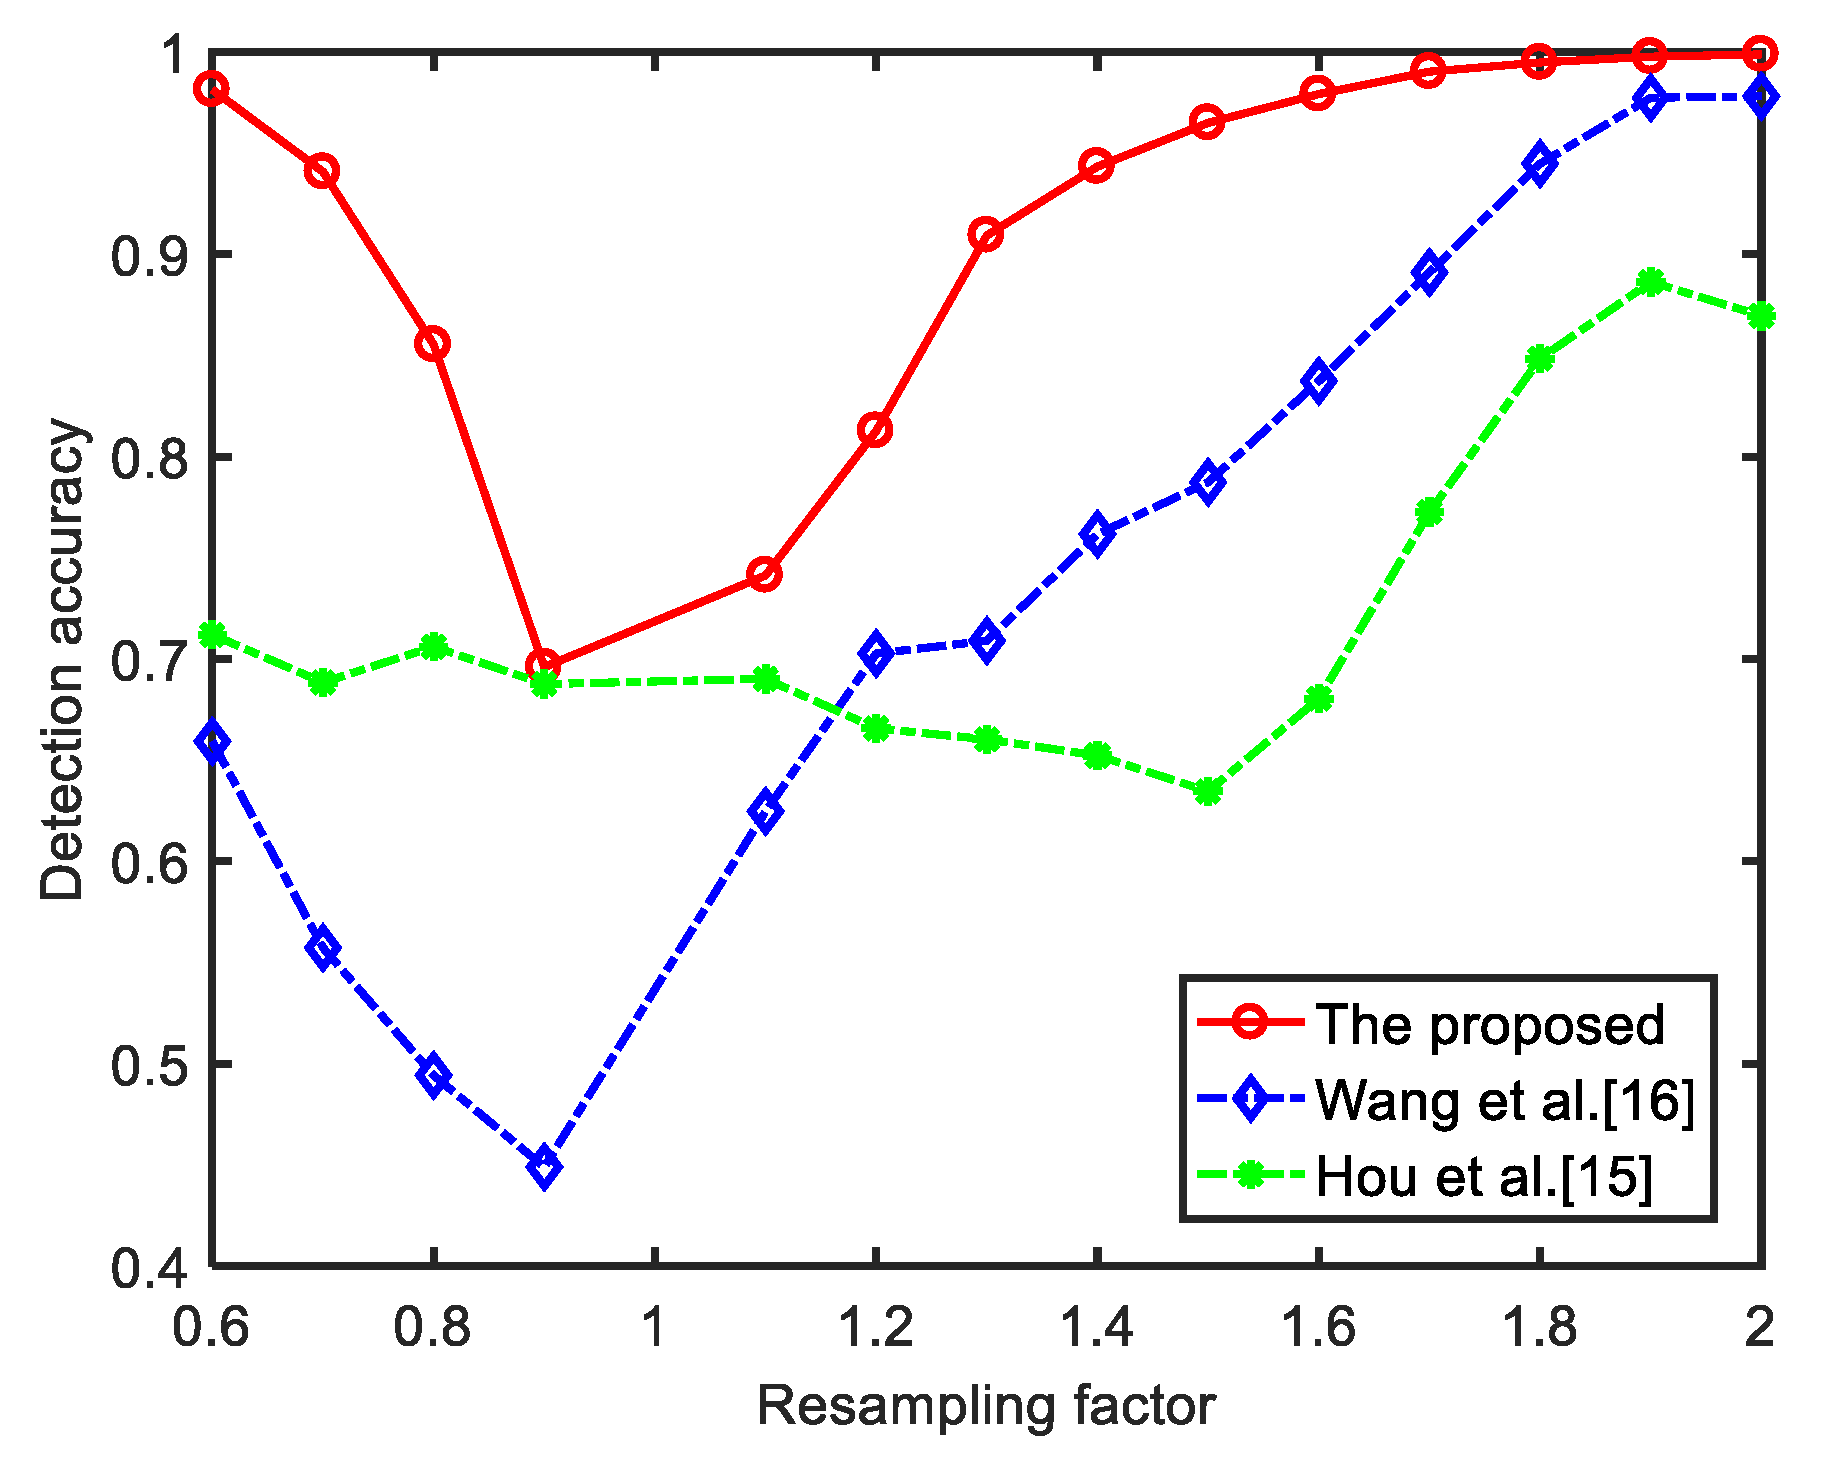
5.2. Experimental Results under Different Compression Sampling Factors

In previous work, Wang et al. used the logarithmic ratio of statistical energy to find the best threshold for resampling detection based on the inconsistency between bandwidth and sampling ratio. Hou et al. [15]. employed the periodicity of the second-order difference of the speech signal to identify resampling. When the sampling factor is greater than 1.2, these methods can achieve better detection results. In the case of a sampling factor from 0.8 to 1.1, their method cannot achieve the satisfactory performance. Therefore, this paper used the mixed corpus to carry out the detection accuracy in the case of a sampling factor from 0.6 to 2, and the detection accuracy was improved to a certain extent. The experimental results are shown in Table 4 and Figure 9.
The following observations can be made from Table 4 and Figure 9:
(1) The detection accuracy is improved notably with the increase of the up-resampling factor. This is because the local texture difference between the original and resampled speech becomes more obvious as the compression degree of the spectrogram increases.
(2) The detection performance degrades when the resampling factor is close to 1.0. The potential reason is that the local texture difference between the original and resampled speech is getting smaller and smaller, which makes the resampled speech hard to detect.
(3) Among these three methods, the proposed method always outperforms the other two methods, which demonstrates that the proposed features are more discriminative for speech resampling detection, especially in small-scale resampling.

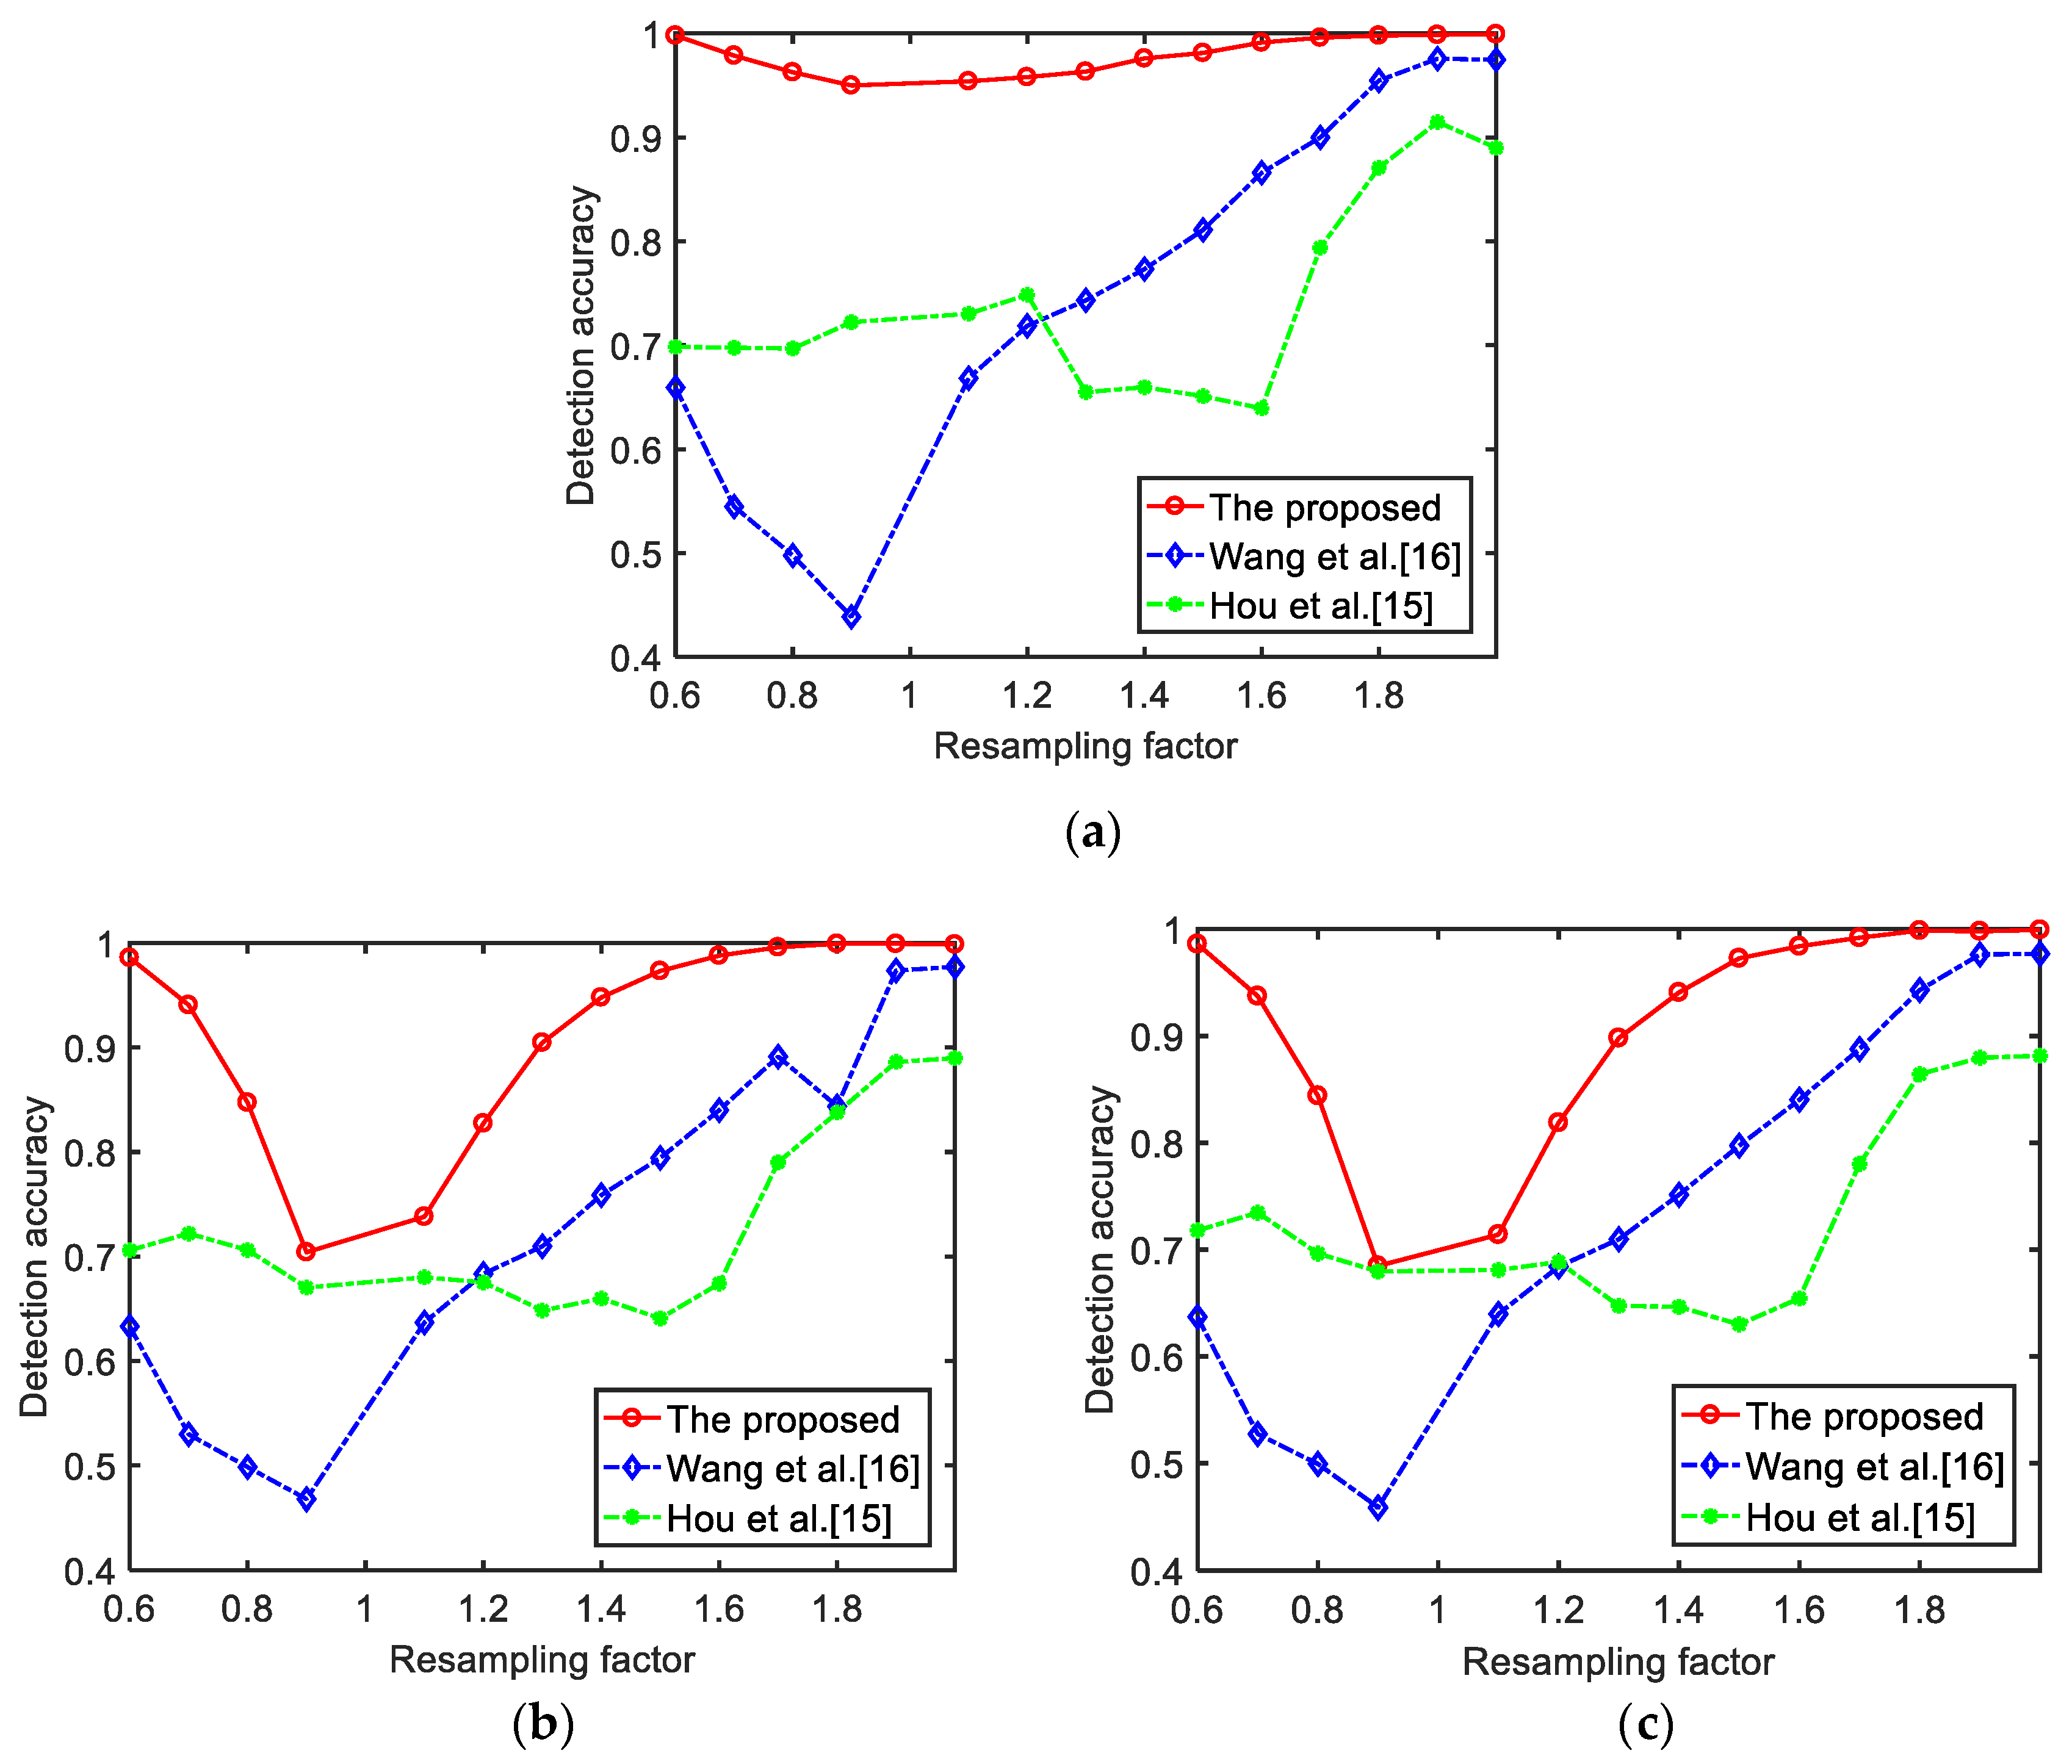
5.3. Experimental Results under Different Compression Scenarios

MP3 compression has become the most popular compression format in recent years. The compression principle is that low-frequency speech carries much information and compression removes some of the redundant information [24,25]. Therefore, the speech compressed by MP3 has no obvious distortion. The resampled speech is often compressed by MP3 in the transmission process. As a result, the detection of speech resampling under compression is meaningful in speech forensics. The higher the MP3 compression bit rate, the better the speech quality and vice versa. This paper used the standardized MPEG-I layer 3 codec to carry out the experiments [26] with the LAME tool. Three commonly used compression bit rates, that is, 32 kbps, 64 kbps, and 128 kbps, were investigated in this paper to evaluate the robustness of the algorithms. The detection rates with the proposed method and the two investigated methods are shown in Table 5 and Figure 10.
As can be seen in Table 5 and Figure 10, the proposed detector also worked well against Mp3 compression. The performance of the proposed detector is still better than that of the other two detectors, which indicates that the proposed detector is more robust in MP3 compression scenarios. Furthermore, when the compression bit rate is fixed, the detection result is better with the increase of the up/down sampling scale. Moreover, it can be seen that the detection rate is slightly improved with the increase in the compression level. Since interpolation introduces some residual traces in the high-frequency component of the spectrogram, the details related to the high-frequency information are weakened after compression. Hence, the partial influence introduced by interpolation is offset in the high-frequency component [27], which slightly increases the detector’s performance.

6. Conclusions

This paper presented a novel forensic method for speech resampling identification. Since the change in the spectrogram is regular with the speech resampling scale, we theoretically analyzed the corresponding relationship between time domain and frequency domain of the resampled speech. For the above analysis, an LBP operator was used to model the local statistical change in the spectrogram caused by speech resampling. Experimental results showed that the proposed method is universal in different interpolation methods and robust to MP3 compressions. Compared with some existing methods, the detection performance was improved notably under various sampling factors, especially when the sampling scale was small. In future work, we will focus on feature optimization to further improve the performance of the algorithm.

Author Contributions

Conceptualization, Y.Z. and S.D.; methodology, Y.Z.; software, Y.Z. and S.D.; validation, Y.Z.; resources, Y.Z.; writing—original draft preparation, Y.Z. and S.D.; writing—review and editing, Y.Z., W.S., L.Z., and D.L.; supervision, Y.Z.; project administration, Y.Z.; funding acquisition, Y.Z. All authors have read and agreed to the published version of the manuscript.

Funding

This work was mainly funded by the Natural Science Foundation of Shanghai (grant no. 17ZR1411900), the Opening Project of Shanghai Key Laboratory of Integrated Administration Technologies for Information Security (grant no. AGK2015006), the Funding Program for the Cultivation of Young University Teachers of Shanghai (grant no. ZZGCD15090), and the Research Start-Up Foundation of Shanghai University of Engineering Science (grant no. 2016-56).

Conflicts of Interest

The authors declare no conflict of interest. The funders had no role in the design of the study; in the collection, analyses, or interpretation of data; in the writing of the manuscript; or in the decision to publish the results.

References

  1. Li, F.; Xin, M.; Li, J.; Yu, J. Improved detection for copy-move forgery with multi-scale sliding windows. In Proceedings of the 2017 International Symposium on Intelligent Signal Processing and Communication Systems (ISPACS), Xiamen, China, 6–9 November 2017; pp. 231–236. [Google Scholar]
  2. Chen, C.L.; Ni, J.Q.; Shen, Z.Y.; Shi, Y.Q. Blind Forensics of Successive Geometric Transformations in Digital Images Using Spectral Method: Theory and Applications. IEEE Trans. Image Process. 2017, 26, 2811–2824. [Google Scholar] [CrossRef] [PubMed]
  3. Bappy, J.H.; Simons, C.; Nataraj, L.; Manjunath, B.S.; Roy-Chowdhury, A.K. Hybrid LSTM and Encoder–Decoder Architecture for Detection of Image Forgeries. IEEE Trans. Image Process. 2019, 28, 3286–3300. [Google Scholar] [CrossRef] [PubMed] [Green Version]
  4. Tang, W.; Li, B.; Tan, S.; Barni, M.; Huang, J. CNN-Based Adversarial Embedding for Image Steganography. IEEE Trans. Inf. Forensics Secur. 2019, 14, 2074–2087. [Google Scholar] [CrossRef] [Green Version]
  5. Ali, Z.; Imran, M.; Alsulaiman, M. An Automatic Digital Audio Authentication/Forensics System. IEEE Access 2017, 5, 2994–3007. [Google Scholar] [CrossRef]
  6. Luo, D.; Korus, P.; Huang, J.W. Band energy difference for source attribution in audio forensics. IEEE Trans. Inf. Forensics Secur. 2018, 13, 2179–2189. [Google Scholar] [CrossRef]
  7. Luo, W.Q.; Li, H.D.; Yan, Q.; Yang, R. Improved audio steganalytic feature and its applications in audio forensics. ACM Trans. Multimed. Comput. Commun. Appl. (TOMM) 2018, 14, 1–14. [Google Scholar] [CrossRef]
  8. Lin, X.; Kang, X. Exposing speech tampering via spectral phase analysis. Digit. Signal Process. 2017, 60, 63–74. [Google Scholar] [CrossRef]
  9. Yan, Q.; Yang, R.; Huang, J. Robust Copy–Move Detection of Speech Recording Using Similarities of Pitch and Formant. IEEE Trans. Inf. Forensics Secur. 2019, 14, 2331–2341. [Google Scholar] [CrossRef]
  10. Yan, D.; Wang, R.; Zhou, J.; Jin, C.; Wang, Z. Compression history detection for MP3 audio. Ksii Trans. Internet Inf. Syst. 2018, 12, 662–675. [Google Scholar]
  11. Yao, Q.M.; Chai, P.Q.; Xuan, G.R.; Yang, Z.Q.; Shi, Y.Q. Audio re-sampling detection in audio forensics based on EM algorithm. J. Comput. Appl. 2006, 26, 2598–2601. [Google Scholar]
  12. Chen, Y.X.; Xi, W.U. A method of detecting re-sampling based on expectation maximization applied in audio blind forensics. J. Circuits Syst. 2012, 17, 118–123. [Google Scholar]
  13. Shi, Q.; Ma, X.H. Detection of audio interpolation based on singular value decomposition. In Proceedings of the 2011 3rd International Conference on Awareness Science and Technology (iCAST), Dalian, China, 27–30 September 2011; pp. 287–290. [Google Scholar]
  14. Qi, D.; Peng, X.J. Audio Tampering Detection Based on Band-Partitioning Spectral Smoothness. Appl. Sci. Electron. Inf. Eng. 2010, 28, 142–146. [Google Scholar]
  15. Hou, L.M.; Wu, W.Q.; Zhang, X.P. Audio re-sampling detection in audio forensics based on second-order derivative. J. Shanghai Univ. 2014, 20, 304–312. [Google Scholar]
  16. Wang, Z.F.; Yan, D.; Wang, R. Speech resampling detection based on inconsistency of band energy. CMC-Comput. Mater. Contin. 2018, 56, 247–259. [Google Scholar]
  17. Wang, F.; Li, C.; Tian, L. An algorithm of detecting audio copy-move forgery based on DCT and SVD. In Proceedings of the 2017 IEEE 17th International Conference on Communication Technology (ICCT), Chengdu, China, 27–30 October 2017; pp. 1652–1657. [Google Scholar]
  18. Mulimani, M.; Koolagudi, S.G. Segmentation and characterization of acoustic event spectrograms using singular value decomposition. Expert Syst. Appl. 2019, 120, 413–425. [Google Scholar] [CrossRef]
  19. Mulimani, M.; Koolagudi, S.G. Extraction of MapReduce-based features from spectrograms for audio-based surveillance. Digit. Signal Process. 2019, 87, 1–9. [Google Scholar] [CrossRef]
  20. Ojala, T.; Pietikäinen, M.; Harwood, D. A comparative study of texture measures with classification based on featured distributions. Pattern Recognit. 1996, 29, 51–59. [Google Scholar] [CrossRef]
  21. Liu, X.; Xue, F.; Teng, L. Surface Defect Detection Based on Gradient LBP. In Proceedings of the 2018 IEEE 3rd International Conference on Image, Vision and Computing (ICIVC), Chongqing, China, 27–29 June 2018; pp. 133–137. [Google Scholar]
  22. Song, T.; Li, H.; Meng, F.; Wu, Q.; Cai, J. LETRIST: Locally Encoded Transform Feature Histogram for Rotation-Invariant Texture Classification. IEEE Trans. Circuits Syst. Video Technol. 2018, 28, 1565–1579. [Google Scholar] [CrossRef]
  23. Chang, C.; Lin, C. LIBSVM: A library for support vector machines. ACM Trans. Intell. Syst. Technol. 2007, 2, 62–71. [Google Scholar] [CrossRef]
  24. Wang, K.; Li, C.; Tian, L. Audio zero watermarking for MP3 based on low frequency energy. In Proceedings of the 2017 6th International Conference on Informatics, Electronics and Vision & 2017 7th International Symposium in Computational Medical and Health Technology (ICIEV-ISCMHT), Himeji, Japan, 1–7 September 2017; pp. 1–5. [Google Scholar]
  25. Erfani, Y.; Pichevar, R.; Rouat, J. Audio Watermarking Using Spikegram and a Two-Dictionary Approach. IEEE Trans. Inf. Forensics Secur. 2017, 12, 840–852. [Google Scholar] [CrossRef]
  26. Brandenburg, K.; Stoll, G. ISO/MPEG-1 Audio: A Generic Standard for Coding of High-Quality Digital Audio. J. Audio Eng. Soc. 1994, 42, 780–792. [Google Scholar]
  27. Zhang, Q.Y.; Zhang, T.; Qiao, S.B.; Wu, D.F. Spectrogram-based Efficient Perceptual Hashing Scheme for Speech Identification. Int. J. Netw. Secur. 2019, 21, 259–268. [Google Scholar]
Figure 1. Discrete Fourier transform (DFT) amplitude spectra of (a) the original speech, (b) the resampled speech with p/q = 0.5, and (c) the resampled speech with p/q = 2.
Electronics 09 00023 g001
Figure 2. Spectrogram distribution in different situations.
Electronics 09 00023 g002
Figure 3. Spectrograms under different interpolation methods. (a) Resampled speech generated by zero-complementing interpolation; (b) resampled speech generated by linear interpolation; (c) resampled speech generated by spline interpolation; (d) resampled speech generated by cubic interpolation.
Electronics 09 00023 g003aElectronics 09 00023 g003b
Figure 4. The value of the local binary pattern (LBP) is 8 + 16 + 32 + 64 = 120. (a) The 3 × 3 region; (b) the calculation of the LBP.
Electronics 09 00023 g004aElectronics 09 00023 g004b
Figure 5. Comparison of the LBP histograms. LBP histograms computed from (a) an original speech, (b) the down-resampled speech (p/q = 0.6), and (c) the up-resampled speech (p/q = 2.0).
Electronics 09 00023 g005
Figure 6. Proposed speech resampling detection process.
Electronics 09 00023 g006
Figure 7. Production process of the corpus.
Electronics 09 00023 g007
Figure 8. Influence of different interpolation conditions on resampling detection. (a) The detection accuracy in the case of linear interpolation; (b) the detection accuracy in the case of spline interpolation; (c) the detection accuracy in the case of cubic interpolation; (d) the detection accuracy in the case of mixed interpolation.
Electronics 09 00023 g008
Figure 9. Comparison of the accuracy of p/q from 0.6 to 2.
Electronics 09 00023 g009
Figure 10. Influence of different compression rates on speech resampling detection. (a) The detection accuracy of the MP3 compression bit rate at 32 kbps; (b) the detection accuracy of the MP3 compression bit rate at 64 kbps; (c) the detection accuracy of the MP3 compression bit rate at 128 kbps.
Electronics 09 00023 g010
Table 1. Detection results of the method proposed in this paper under different interpolation methods.
p/qMixed InterpolationLinear InterpolationSpline InterpolationCubic Interpolation
0.80.83600.83400.82700.8553
0.90.70300.66000.69500.6960
1.10.75300.74400.74300.7413
1.20.81600.84600.80000.8127
Table 2. Detection results of Wang et al. [16] under different interpolation methods.
p/qMixed InterpolationLinear InterpolationSpline InterpolationCubic Interpolation
0.80.49430.48200.53100.4950
0.90.44900.41400.48400.4550
1.10.62470.63000.66900.6700
1.20.70270.66200.74900.7030
Table 3. Detection results of Hou et al. [15] under different interpolation methods.
p/qMixed InterpolationLinear InterpolationSpline InterpolationCubic Interpolation
0.80.70610.72370.70610.6841
0.90.68760.67710.66190.6673
1.10.69020.65140.68060.6817
1.20.66570.67450.62010.6675
Table 4. Mixed resampling detection results of the proposed method and the state-of-the art studies.
p/qProposed MethodWang et al. [16]Hou et al. [15]
0.60.98130.65930.7120
0.70.94070.55730.6884
0.80.85530.49430.7061
0.90.69600.44900.6876
1.10.74130.62470.6902
1.20.81270.70270.6657
1.30.90930.70900.6603
1.40.94330.76170.6523
1.50.96490.78730.6346
1.60.97910.83730.6804
1.70.99020.89100.7725
1.80.99470.94470.8484
1.90.99760.97730.8863
2.00.99870.97800.8696
Table 5. Detection results under different compression bit rates.
p/qProposed Method at 32 kbpsWang et al. [16] at 32 kbpsHou et al. [15] at 32 kbpsProposed Method at 64 kbpsWang et al. [16] at 64 kbpsHou et al. [15] at 64 kbpsProposed Method at 128 kbpsWang et al. [16] at 128 kbpsHou et al. [15] at 128 kbps
0.60.99800.65930.69840.98600.63300.70590.98600.63700.7179
0.70.97870.54470.69770.94070.52970.72190.93730.52730.7346
0.80.96270.49770.69680.84730.49830.70610.84400.49930.6963
0.90.95000.43870.72220.70400.46770.67020.68470.45870.6795
1.10.95400.66830.73030.73800.63670.68000.71400.63970.6809
1.20.95800.71870.74850.82730.68330.67520.81870.68400.6884
1.30.96330.74330.65490.90470.70970.64820.89800.70970.6473
1.40.97600.77330.65960.94800.75870.65960.94070.75130.6464
1.50.98130.81100.65100.97330.79430.64070.97270.79730.6299
1.60.99130.86600.63930.98800.84000.67390.98400.84030.6543
1.70.99600.90000.79390.99600.89130.79010.99200.88770.7803
1.80.99800.95470.87080.99930.84370.83770.99870.94300.8642
1.90.99870.97570.91480.99930.97370.88620.99800.97630.8796
2.00.99930.97470.89000.99870.97730.88990.99930.97700.8815

