Article

A Hierarchical Modeling and Analysis Framework for Availability and Security Quantification of IoT Infrastructures

1
Office of Research, University-Industry Cooperation Foundation, Konkuk University, Seoul 05029, Korea
2
Department of Computer Science and Engineering, College of Engineering, Konkuk University, Seoul 05029, Korea
3
School of Software, College of Computer Science, Kookmin University, Seoul 02707, Korea
*
Author to whom correspondence should be addressed.
Electronics 2020, 9(1), 155; https://doi.org/10.3390/electronics9010155
Submission received: 30 November 2019 / Revised: 29 December 2019 / Accepted: 3 January 2020 / Published: 14 January 2020
(This article belongs to the Special Issue Cloud Computing and Applications)

Abstract

:
Modeling a complete Internet of Things (IoT) infrastructure is crucial to assess its availability and security characteristics. However, modern IoT infrastructures often consist of a complex and heterogeneous architecture and thus taking into account both architecture and operative details of the IoT infrastructure in a monolithic model is a challenge for system practitioners and developers. In that regard, we propose a hierarchical modeling framework for the availability and security quantification of IoT infrastructures in this paper. The modeling methodology is based on a hierarchical model of three levels including (i) reliability block diagram (RBD) at the top level to capture the overall architecture of the IoT infrastructure, (ii) fault tree (FT) at the middle level to elaborate system architectures of the member systems in the IoT infrastructure, and (iii) continuous time Markov chain (CTMC) at the bottom level to capture detailed operative states and transitions of the bottom subsystems in the IoT infrastructure. We consider a specific case-study of IoT smart factory infrastructure to demonstrate the feasibility of the modeling framework. The IoT smart factory infrastructure is composed of integrated cloud, fog, and edge computing paradigms. A complete hierarchical model of RBD, FT, and CTMC is developed. A variety of availability and security measures are computed and analyzed. The investigation of the case-study’s analysis results shows that more frequent failures in cloud cause more severe decreases of overall availability, while faster recovery of edge enhances the availability of the IoT smart factory infrastructure. On the other hand, the analysis results of the case-study also reveal that cloud servers’ virtual machine monitor (VMM) and virtual machine (VM), and fog server’s operating system (OS) are the most vulnerable components to cyber-security attack intensity. The proposed modeling and analysis framework coupled with further investigation on the analysis results in this study help develop and operate the IoT infrastructure in order to gain the highest values of availability and security measures and to provide development guidelines in decision-making processes in practice.

1. Introduction

Internet of Things (IoT) has recently emerged as a mainstream computing infrastructure with a rapidly growing interest both in industry and academia due to the pervasiveness and ubiquitous features of IoT sensors/devices which play the role of a software-defined gateway to the physical world [1]. In addition, the concept of IoT has been adopted across a variety of practical eco-systems including digital healthcare (e-Health), digital precision agriculture (e-Agriculture), smart grids, smart home, smart transportation, etc. successfully [2]. An IoT infrastructure often features with a huge number of heterogeneous Internet-connected objects (e.g., IoT sensors/actuators) at the edge while the infrastructure’s computing backbones are powerful computing paradigms (e.g., cloud/fog/edge) that come along with specific functionalities such as data analysis and/or recommendation [3]. Thus, a practical IoT infrastructure likely consists of a sophisticated and multi-level architecture of heterogeneous software/hardware subsystems and components. Stringent requirements in design and implementation of most IoT infrastructures are that (i) applications and services running on the infrastructure are mostly latency-sensitive, (ii) massive data generated by IoT sensors/devices is seamlessly synchronized, stored, and processed across the infrastructure often at a huge data volume, a high data transaction rate and with an uncertain data variation, and (iii) operations of the IoT infrastructure at all levels must strictly satisfy quality of service (QoS) terms in service level agreement (SLA) including data accuracy, availability and security, operational costs, and user expectations. In literature, most approaches to realize the potentials of IoT computing paradigm are its integration with cloud computing paradigm in the way that a cloud plays as a computing and storage center at the core while the IoT is merely a data source at the edge [4,5,6]. Nevertheless, the wide-geographical distribution and allocation of both cloud centers and IoT devices are the hurdles for the IoT infrastructure to fulfil the above-mentioned stringent requirements. However, we believe that existing technologies are mature enough to distribute the computing and storage power of the cloud computing paradigm at the core and to utilize at most the potentials of IoT infrastructures by using emerging computing paradigms such as fog/edge computing paradigms.
Availability and security attributes are of paramount importance to secure QoS requirements of IoT infrastructures in mission-critical scenarios. Availability is a QoS metric representing the system readiness by the probability that a system functions properly at a specific instant or over a predefined period of time. Consequences due to service failures in IoT infrastructure are inevitably severe, probably causing resource damage, huge business revenue loss or even more severely, loss of human life. For that reason, quantification and assessment of availability and security metrics of IoT infrastructure must be considered an intrinsic stage in the architecture design and system development of the IoT infrastructure. In literature, very few works studied availability and security quantification of IoT infrastructures, especially only some works considered the integration of cloud/fog/edge computing paradigms in the evaluation of IoT infrastructure. The work [7] presented a comprehensive systematic literature review on the dependability of fog computing. The work highlighted the existing consideration of dependability metrics (availability, reliability) of fog computing systems, but the safety and security metrics and the trade-offs between dependability and security metrics have not been investigated in a complete manner. In another work [8], Andrade et al. explored dependability of a cloud-based disaster recovery solution for e-health IoT infrastructure using stochastic petri net (SPN). The most recent works [9,10] on the availability and performance evaluation of IoT infrastructures considered the integration of cloud/fog/edge computing paradigms in an e-health system. However, these works only considered the failure/repair of cloud/fog/edge as a whole when developing stochastic models for availability/performance evaluation and the hierarchical nature of the overall system architecture was completely not taken into account.
To the best of our knowledge, the majority of the previous works in the area did not pay a careful consideration on the evaluation of trade-offs between availability and security metrics of IoT infrastructures, especially there has not been a proposal of a modeling and analysis methodology for IoT infrastructures with the integration and interoperability of cloud/fog/edge computing paradigms. Thus, the studies on availability and security quantification of hierarchical IoT infrastructures are still at the very preliminary stage in the area. This existing research gap in the area of availability and security evaluation for IoT infrastructure motivates us to explore a novel modeling and analysis methodology for availability and security quantification of hierarchical IoT infrastructures. Different from the existing works, we aim to design a hierarchical modeling methodology for availability and security quantification of IoT infrastructures consisting of integrated cloud/fog/edge computing ecosystems. Our approach helps provide in-depth availability and security trade-off analysis results for the decision-making process. Our approach to develop a complete hierarchical framework for availability and security quantification of IoT infrastructures featured by the hierarchical nature of cloud/fog/edge computing ecosystems can be distinguished as the first study up to date.
Main contributions based on the above discussion on the current status of existing studies in literature are described as follows:
  • proposed a hierarchical framework for availability and security quantification of IoT infrastructures consisting of integrated cloud/fog/edge computing paradigms. The hierarchical modeling and analysis framework for IoT infrastructures is composed of three phases, (i) phase I. requirements: to comprehend system architecture and operative behavior hypotheses and extract necessary parameters and system configuration information, (ii) phase II. modeling: to develop hierarchical models of subsystems, member systems and the overall IoT infrastructure, and (iii) phase III. analysis: to compute analysis results for evaluation and assessment.
  • proposed a three-level hierarchical model for a three-layer cloud/fog/edge architecture of IoT infrastructures. In accordance with the three-layer hierarchical nature of the IoT infrastructures in consideration, the developed hierarchical model consists of three-level models including (i) RBD model at the top level to involve the IoT infrastructure’s member systems under a pre-defined relevance to each other, (ii) FT model at the middle level to capture the detailed architectures of the member systems, and (iii) CTMC model at the bottom level to capture operative states and transitions of the subsystems in a complete manner.
  • applied and demonstrated the feasibility of the proposed hierarchical modeling and analysis framework on availability and security quantification and assessment of a specific case study of IoT smart factory infrastructure.
  • performed different analyses to comprehend the characteristics of the IoT smart factory infrastructure and to show the trade-offs between availability and security. The numerical analyses include (i) steady state availability (SSA), (ii) sensitivity analysis of availability wrt. selected impacting factors (mean time to failure equivalent (MTTFeq) or mean time to recovery equivalent (MTTReq)), and (iii) security analysis wrt. attack intensity (mean time to an attack (MTTA)).
  • pinpointed essential parameters representing operative properties of subsystems that expose the most impact on availability and security of the IoT smart factory infrastructure in order to support the decision-making process in design and implementation in practice.
Through the analysis results of the case-study of an IoT smart factory infrastructure, we conclude the findings for the availability and security assessment of the IoT smart factory infrastructure in consideration as follows:
  • More frequent failures in cloud can cause more severe drops of the considered IoT infrastructure’s overall availability in comparison to the failures in other member systems.
  • Quick recovery of edge can help avoid severe drop of the overall availability compared to the recovery of other member systems.
  • In the cloud, hardware failures of cloud servers, cloud gateway, and cloud storage expose great impact of decreasing the IoT smart factory infrastructure’s availability, while fast recovery of cloud servers’ VM and VMM secure higher values of the availability.
  • In fog, hardware failures of the fog server cause severe consequences while recoveries of fog gateway’s software and fog server’s OS help avoid severe drops of the overall availability.
  • In edge, failures of IoT devices cause higher impact on the overall availability compared to failures in IoT sensors or IoT gateway. On the other hand, quick recovery of IoT gateway’s software secures higher values of availability for the IoT smart factory infrastructure.
  • In terms of security measures, cloud servers’ VMM and VM, and fog server’s OS are the most vulnerable to cyber-attack intensity in comparison to other subsystems in the considered IoT smart factory infrastructure.
  • In general, failures of hardware components and recovery of software components are significant factors to secure higher availability for the IoT smart factory infrastructure in consideration, while necessary countermeasures should be implemented in cloud and fog’s software components to reduce attack intensity and enhance the overall availability.
The content of this paper is organized as follows. In Section 1, in-depth discussions on availability and security quantification of IoT infrastructures based on previous works in literature were presented in this section. The main contributions and impact of this work in the research area were also detailed. In Section 2, a number of previous works relating availability and security quantification as well as hierarchical models in practice is discussed to provide sufficient understanding on the methodology and ideas similar to our approach in this paper. In Section 3, we provide a necessary understanding on cloud/fog/edge computing paradigms and their promising integration and interoperability in IoT infrastructures. A general hierarchical architecture of IoT infrastructure consisting of cloud/fog/edge computing systems is also presented adopting proposed architectures of integrated IoT infrastructure in previous works. In Section 4, a hierarchical modeling and analysis framework along with a hierarchical model dedicated to availability and security quantification of hierarchical IoT infrastructures are proposed and detailed. In Section 5, we present a case-study of IoT infrastructures. An IoT smart factory infrastructure is chosen to demonstrate the feasibility in modeling and analysis of hierarchical IoT infrastructures using the proposed quantification framework. In Section 6, numerical analysis results and further discussions are presented. The paper is concluded in Section 7.

2. Related Work

Availability and security quantification is of paramount importance in assessing the satisfaction of designed system architectures to realistic service requirements. The assessment is possibly performed (i) by practical measurements on real prototypes or developed system, or (ii) by analytical models developed based on a proposed architecture of the IoT infrastructure [11]. The measurement-based assessment tends to be expensive and time-consuming due to the complexity of a multi-level system architecture and sophisticated system behaviors. Ones have to observe continuous operations of the IoT infrastructure over a long period of time, perform different experiments (e.g., fault injections [12]) and collect a huge amount of data related to system conditions (e.g., resource consumption) to describe and analyze a phenomena in consideration. On the other hand, model-based quantification techniques of availability and security metrics can have remarkable contributions in evaluation of architecture design alternatives and their QoS metrics thanks to the low-cost development and analysis of analytical models representing the IoT infrastructure’s architecture and operations, and thanks to the coverage of a large parameter space representing design alternatives of the IoT infrastructure. In literature, many works have been proposed to quantify availability and security measures and the trade-offs between the two measures in different computing systems. The work [13] was one of the first studies that proposed a novel approach to integrated security and dependability evaluation using traditional Markov modeling and analysis techniques. Trivedi et al. in [14] presented a profound investigation on a variety of modeling techniques for dependability and security evaluation of systems. In [15], Montecchi et al. presented a model-based evaluation of scalability and security trade-offs of a multi-service web-based platform using stochastic activity network (SAN) formalism. In [16], Ge et al. proposed a graphical security model and a stochastic reward net (SRN) model to evaluate security and capacity oriented availability of multiple redundancy designs when applying security patches in server systems. In a recent work [17], Torquato et al. proposed an availability SPN model to assess the impact of security risks on the overall availability of a virtualized system equipped with a VMM rejuvenation technique enabled by scheduled VM migration. The authors provided an insightful understanding on the trade-offs between availability and security risks when applying VM migration for rejuvenation purposes. The above-mentioned works considered security risks and countermeasures in system evaluation at a very detailed level for specific systems using state-space models. Nevertheless, none of the previous works considered availability and security quantification at an infrastructure level in a complete manner which often requires a comprehensive hierarchical modeling and analysis methodology. Our work aims to propose a hierarchical modeling and analysis framework especially for IoT infrastructures considering both availability and security measures. Furthermore, the hierarchical system model can take into account cyber-security attacks and counter-measures on all software systems in the IoT infrastructure. Impact of the attack intensity on the overall availability is also investigated in detail. The proposed hierarchical modeling and analysis framework can be used for various complex IoT infrastructures consisting of three-fold member systems when considering the modeling of both the IoT infrastructure’s architecture at the top level and the behaviors and operations of subsystems and components at the bottom-most level.
Hierarchical models in practice are often developed in modeling and analysis of sophisticated and large-sized systems and/or multi-fold system of systems in order to reduce largeness of monolithic models and to prevent model computation and analysis processes from state-space explosion problems [18,19]. A hierarchical system model often consists of multi-level models in which (i) the upper levels are composed of non-state-space model types including FT or RBD, especially, for structured modeling of systems/subsystems, or reliability graph (RG) for network modeling [20], and (ii) the lower levels consists of state-space models (e.g., CTMC or SPN, etc.) to capture operative behaviors (which are often represented by states and state transitions) of subsystems/components in a comprehensive manner. In literature, many hierarchical modeling methodologies have been proposed for a variety of practical systems for different computing paradigms. Smith et al. proposed a two-fold hierarchical model of FT and CTMC for availability quantification of a realistic IBM blade server system in [21]. The authors developed a large-sized FT system model to represent the overall system of fourteen blade servers without considering their networking in the top-most level. In the bottom-most level, CTMC models are developed to correspond to physical subsystems including blade servers, cooling devices, chassis, etc. In [22], Matos et al. investigated the impact of system parameters on the availability of a mobile cloud (also known as sensitivity analysis) by using a hierarchical two-fold model of RBD in the upper level and CTMC in the lower level. The paper [23] was one of the first works that proposed a three-fold hierarchical model of mixing RBD and Markov chain models for availability quantification of high availability (HA) platform in the telecommunication industry. The above-mentioned previous works provided us a fundamental understanding on modeling and analysis of complex systems using hierarchical models. In general, an appropriate modeling methodology of multi-fold hierarchy is a proper solution to avoid largeness problems in computation of measures of interest for availability and security quantification of a complex system of multi-levels. Our work advocates a hierarchical modeling and analysis framework consisting of three-level models to assess availability and security of IoT infrastructures.

3. Background on Internet of Things

In this section, a fundamental understanding of the existing cloud/fog/edge computing paradigms is presented to realize the significance of integrating those computing ecosystems in real-world IoT infrastructures. Afterwards, existing system architectures in previous works for integration and interoperability of those computing paradigms in different practical applications are presented to realize the currently existing gap of studies in literature on exploring the integration and interoperability of cloud/fog/edge computing paradigms at once in an IoT infrastructure. As a result, a hierarchical architecture of three-fold cloud/fog/edge member systems for real-world IoT infrastructure is provided adopting proposed architectures of IoT infrastructures in previous works. The hierarchical architecture of IoT infrastructure consisting of three cloud/fog/edge member systems is the baseline for us to develop an appropriate hierarchical modeling and analysis framework for availability and security assessment of the IoT infrastructures.
State-of-the-art computing paradigms:Cloud computing has been accredited as a centralized computing paradigm successfully adopted in many online business services and applications in the past few years featured by its pricing models of pay-as-you-go and its service platforms of Software as a Service (SaaS), Platform as a Service (PaaS) and Infrastructure as a Service (IaaS) [24,25]. Resource virtualization technologies along with fault-tolerance techniques at all levels of the cloud infrastructure help ease centralized operative management and resource scalability, thus maximize service availability, agility and adaptability to the non-uniform variation of service loads and user demands [26,27,28]. Nevertheless, the geographical centralization and the limited amount of huge cloud data centers which are often allocated in specific regions around the world for safety reasons cause various issues in real-time data transactions of latency-sensitive services and applications running in remote areas. Fog computing has emerged as an appropriate computing paradigm to resolve existing problems of many large-scale and distributed services and applications required to cloud computing infrastructures [29]. Featured by the nature of decentralized and open computing, the fog computing paradigm opens opportunities to disperse computing and storage power to the edge of the computing network for notable improvements of latency sensitivity, data processing performance, connectivity, scalability, and adaptability of services and applications in local areas [30]. Furthermore, the concept of fog computing is roughly considered as a combination of Mobile Cloud Computing (MCC) and Mobile Edge Computing (MEC) in the way that computing and data storing capabilities of mobile/peripheral devices are moved to non-virtualized/virtualized fog servers in order to obtain the highest processing efficiency and latency reduction in real-time services/applications of end-devices [31]. Edge computing is a promising distributed computing paradigm at the very edge of a computing network to secure high-speed local data processing and storing capabilities as well as to diminish response time in most of real-time services and critical applications such as surveillance, healthcare monitoring, traffic monitoring and control, augmented reality, location services, video analytics, industrial automation, and smart factory, etc. whose very short response time, ultra-low latency, and real-time access are non-negotiable [32,33,34]. We propose to slightly differentiate fog and edge computing paradigms in the way that fog computing relies mainly on processing for infrastructure and edge computing relies on processing for the things (connected objects). Thus, edge computing is featured by cyber-physical interactions without association of cloud computing services including SaaS, IaaS, and PaaS. In this perspective, edge computing is often built-in with standardized data processing at the edge consisting of end devices (e.g., smart phones, smart objects, etc.) or edge devices (e.g., IoT gateways, edge routers, IoT sensors/devices, etc.), which are all supported with edge computing and storing capabilities [35,36]. Featured with the above-mentioned localization in computing capabilities, the edge computing brings about the agility, flexibility and adaptability in computing to the pervasiveness and heterogeneity of the connected objects/things.
Integration and interoperability of cloud/fog/edge computing paradigms in IoT infrastructures have been a rapidly growing interest in both academia and industry in developing a complete architecture of IoT infrastructures. In literature, the concept of cloud-fog-edge interoperability in IoT infrastructures for the assurance of various QoS and related security measures has been proposed in a number of recent works. Bruneo et al. in [37] proposed a cloud infrastructure merged with IoT facilities (called I/Ocloud) in which the authors’ main idea is to consider geographically dispersed IoT devices as virtualized I/O resources acting as IaaS in cloud with a standardized access to sensors/actuators, thus providing standardized and generalized programming capabilities on top of IoT resources. In [38], Maharaja et al. proposed a fog-cloud computing based security system (FOCUS) featured with a threefold protection mechanism to secure communication channels for IoT devices, to equip with a data traffic analysis mechanism and to provide a challenge-response authentication for IoT systems. To obtain low latency and response time, FOCUS is implemented in a hybrid fog-cloud model in the way that protection and validation requests are directed to fog while excessive requests are processed in cloud in order to effectively avoid long queuing delays and thus favor the processing of significant tasks. In [39], Mahmud et al. presented a cloud-fog based structure for IoT-enabled healthcare solutions. The authors explored the integration and interoperability of cloud-fog services for healthcare solutions in extension upon traditional cloud-based healthcare structures. In [40], Okay et al. proposed a fog computing based smart grid model to monitor and manage tremendous amount of electricity consumption data generated by smart meters. In [41], Rahmani et al. exploited the concept of fog computing in healthcare IoT infrastructures by forming a geographically distributed intermediary layer between IoT sensors/devices and cloud for intelligent computing and storing functionalities featured by smart gateways at the edge of the network in order to perform high-level services including real-time local data processing, embedded data mining, etc. Very few recent works in literature explore the integration and interoperability of cloud-fog-edge services in a complete architecture of an IoT infrastructure. Mancini et al. in a pre-print work [42] proposed an open-source Android library (called iGateLink) for the development of applications acting as a gateway in the integration of cloud/fog/edge computing environments with the two advantages including (i) flexible connectivity to heterogeneous IoT devices acting as data sources and (ii) re-usability of different cloud/fog frameworks for various IoT applications. In [43,44], a novel osmotic computing paradigm has been presented as an appropriate solution for the direct integration of edge and cloud to secure efficient execution of IoT services and applications at the edge. The proposed paradigm enables the deployment of lightweight micro-services on resource-constrained IoT platforms at the edge and at the same time, securing seamless interactions to more complex micro-services running on large-scale data centers supported by specific data transfer protocols.
We observe that many previous works presented in-depth surveys on the advances of existing cloud and emerging fog/edge computing paradigms in developing a complete architecture of IoT infrastructure [30,33,45,46,47]. Only a few recent works as mentioned above discussed the existing integration of cloud-fog or cloud-edge in IoT applications, specifically for e-Healthcare. In addition, a few number of works provided an in-depth study on the integration and interoperability of the cloud/fog/edge computing environments. The most recent works [48,49] presented a comprehensive study on the integration in a hierarchical manner and challenges of cloud/fog/edge continuum. The authors clearly show hierarchical architectures of cloud/fog/edge ecosystems for a variety of IoT applications in practice including urban computing, mobile applications, and industrial IoT. In another most recent work [50], Queiroz et al. proposed a decentralized hierarchical data analysis and computing infrastructure taking advantages of cloud/fog/edge computing paradigms for the development of industrial cyber-physical systems. The authors discussed the concepts, challenges, and technologies for the intelligence distribution throughout the cloud/fog/edge ecosystem in industrial cyber-physical systems.
Based on the works [48,49,50], we propose to adopt a hierarchical architecture of integrated three-layer ecosystems of cloud/fog/edge computing paradigms for an IoT infrastructure as follows:
  • In general, an IoT infrastructure is assumed to consist of a huge number of software/hardware subsystems and components playing in different roles.
  • Cloud member system mainly consists of virtualized server systems connected to a number of network devices (routers/hubs/switches) acting as cloud gateways for bi-directional connectivity with fog member system. The processing of data are often featured with advanced processing capabilities and superior technologies in centralized/multi-hop cloud centers which are remotely located in safe regions far away from data sources. The virtualized cloud servers host cloud services running constantly to perform long-term in-depth data analysis tasks including business intelligence, simulation and scheduling, etc. A huge number of heterogeneous sources are all connected to the cloud while a persistent internet connection is required for uninterrupted access of system users from different parts of the world.
  • Fog member system consists of (mostly) non-virtualized servers or computing devices/platforms or workstation in some cases along with local network equipment to process multiple data streams at mid-volume size. The fog member system is expected to provide distributed and one-hop computing platforms suitable with mid/short-term data processing tasks and mission-critical/near real-time applications that require low-latency and rapid system response in data processing. Furthermore, due to the nature of high-performance computing capabilities, the fog member system is suited to many applications requiring local-context awareness and dynamic adaption, thus it is often located in specific regions for specific applications, for instance, for smart hospitals, smart buildings, or smart factories. The fog member system is expected to play a role of a man in the middle to handle extremely high-rate data transactions generated from many local sources with the lower edge member system.
  • Edge member system consists of IoT sensors/devices and IoT gateways featured with a decentralized and embedded organization. The end devices are at the edge of the computing infrastructure enhanced with the capabilities of monitoring, data pre-processing, and data filtering to handle low-volume of local and raw data streams. The edge member system is featured by autonomy, collaboration and self-awareness built in IoT devices and thus, it is suited with hard real-time/transient tasks, but simple and non-optimal solutions.
  • Software and hardware components might experience a variety of failures such as aging-related failures on software [51], uncertain causes related failures on hardware [52,53,54], or even failures due to cyber-security attacks [55].

4. A Hierarchical Framework for Security and Availability Quantification

4.1. Hierarchical Models

Modeling a multi-layer complex infrastructure requires an appropriate hierarchical framework for security and availability evaluation. A hierarchical model consisting of various sub-models in different levels can actually capture heterogeneous features of overall system architecture as well as detailed operative behaviors of ground-level subsystems and components. The methodology of using a hierarchical modeling framework can utilize (i) the simplicity and rapidity in modeling of combinatorial models and (ii) the capability of the state-based models to capture sophisticated operative behaviors (states and transitions) all together developing a unique hierarchical model in a harmony manner. To model a sophisticated IoT infrastructure, the authors propose a hierarchical modeling framework specifically for the security and availability quantification of IoT infrastructures, which particularly consists of three heterogeneous models including (i) RBD in the top level ( Ξ ) to capture the variation of the infrastructure’s architectures, (ii) FT in the middle level ( Γ ) to model a variety of failure causes of a member system, and (iii) CTMC in the ground-level ( Θ ) to capture detailed operative states and transitions within of subsystems within a member system as shown in Figure 1. The hierarchical model of a IoT infrastructure is then described as a graph of { Ξ , Γ , Θ } , where Ξ is the set of blocks along with a specific RBD representing the member systems in the IoT infrastructure; Γ is the set of failure/recovery events of subsystems along with corresponding FT and Θ is the set of CTMC models capturing detailed operations of subsystems. The formalism of this hierarchical modeling framework is presented as in Equation (1):
Ξ : = ξ 1 , ξ 2 , . . . , ξ n , ζ r b d , π r b d Γ : = γ ξ 1 , π γ ξ 1 f t , γ ξ 2 , π γ ξ 2 f t , . . . , γ ξ n , π γ ξ n f t = γ 1 ξ 1 , γ 2 ξ 1 , . . . , γ j ξ 1 , ζ γ ξ 1 f t , π γ ξ 1 f t , . . . , γ 1 ξ n , γ 2 ξ n , . . . , γ j j ξ n , ζ γ ξ n f t , π γ ξ n f t Θ : = { { θ γ 1 ξ 1 , ζ θ γ 1 ξ 1 c t m c , π θ γ 1 ξ 1 c t m c } , { θ γ 2 ξ 1 , ζ θ γ 2 ξ 1 c t m c , π θ γ 2 ξ 1 c t m c } , . . . , { θ γ j ξ 1 , ζ θ γ j ξ 1 c t m c , π θ γ j ξ 1 c t m c } , . . . , { θ γ 1 ξ n , ζ θ γ 1 ξ n c t m c , π θ γ 1 ξ n c t m c } , { θ γ 2 ξ n , ζ θ γ 2 ξ n c t m c , π θ γ 2 ξ n c t m c } , . . . , { θ γ j j ξ n , ζ θ γ j j ξ n c t m c , π θ γ j j ξ n c t m c } } ,
where ξ 1 , ξ 2 , . . . , ξ n are the blocks in the top RBD model representing n member systems of the infrastructure. ζ r b d is the given architecture of the infrastructure concerning the correlation among its member systems. The item ζ r b d in Ξ may vary in accordance with the change of the infrastructure’s architectures in order to cover various case-studies and realistic system designs for analogy and optimized selection. π r b d is the output measure of interest to be computed after retrieving a complete top model of the infrastructure. γ ξ 1 , π γ ξ 1 f t , γ ξ 2 , π γ ξ 2 f t , . . . , γ ξ n , π γ ξ n f t are two-element pairs representing FTs of the member systems ξ 1 , ξ 2 , . . . , ξ n , respectively, which consist of an FT model γ ξ k and its output measure π γ ξ k f t , ( 1 k n ) . This pair of FT model and its output measure is forwarded to the corresponding member system ξ k in the top RBD model. The expansion of these pairs is performed by a replacement of the FTs’ failure/repair events. For instance, γ 1 ξ 1 , γ 2 ξ 1 , . . . , γ j ξ 1 are the events of the corresponding FT γ ξ 1 , while γ 1 ξ n , γ 2 ξ n , . . . , γ j j ξ n are the events of the FT γ ξ n in an assumption that γ ξ 1 consists of j events and γ ξ n is composed of j j number of events. The three-element unit set { θ γ h ξ k , ζ θ γ h ξ k c t m c , π θ γ h ξ k c t m c } represents a ground-level CTMC model of a subsystem γ h ξ k in the FT model γ ξ k (h is an indexing number of the corresponding event in the FT γ ξ k ). θ γ h ξ k is the CTMC model of the subsystem γ h ξ k , ζ θ γ h ξ k c t m c is the detailed structure of the θ γ h ξ k , while π θ γ h ξ k c t m c is the output measure computed by solving the CTMC model θ γ h ξ k . { θ γ 1 ξ 1 , ζ θ γ 1 ξ 1 c t m c , π θ γ 1 ξ 1 c t m c } , { θ γ 2 ξ 1 , ζ θ γ 2 ξ 1 c t m c , π θ γ 2 ξ 1 c t m c } , . . . , { θ γ j ξ 1 , ζ θ γ j ξ 1 c t m c , π θ γ j ξ 1 c t m c } is the set of CTMC models to be delivered and replaced into corresponding events in the upper FT model γ 1 ξ 1 , γ 2 ξ 1 , . . . , γ j ξ 1 , ζ γ ξ 1 f t , π γ ξ 1 f t , while { θ γ 1 ξ n , ζ θ γ 1 ξ n c t m c , π θ γ 1 ξ n c t m c } , { θ γ 2 ξ n , ζ θ γ 2 ξ n c t m c , π θ γ 2 ξ n c t m c } , . . . , { θ γ j j ξ n , ζ θ γ j j ξ n c t m c , π θ γ j j ξ n c t m c } is the set of CTMC models corresponding to the subsystems in the FT model γ 1 ξ n , γ 2 ξ n , . . . , γ j j ξ n , ζ γ ξ n f t , π γ ξ n f t , and this description goes to other cases of FT and CTMC models in the similar manner.

4.2. Modeling and Analysis Framework

In order to develop and analyze the above-proposed hierarchical model for security and availability quantification of IoT infrastructures, the authors propose a modeling and analysis framework as shown in Figure 2. The proposed framework consists of three main phases including (i) phase I: Requirements, which is to define initial requirements of the IoT infrastructure based on given system architectures and pre-claimed operative behavior hypotheses; (ii) phase II: Modeling, which is to develop a hierarchical model of the overall IoT infrastructure based on the above-defined system requirements, and (iii) phase III: Analysis, which is to solve the developed hierarchical model, investigate the output results and analyze the security and availability measures of interest. In the phase I, a modeling practitioner may receive an architecture of the IoT infrastructure and how its underlying subsystems are expected to operate in real circumstances. The above features of the IoT infrastructure are initially essential inputs of the security and availability quantification of the IoT infrastructure. One may comprehend and extract those features to retrieve necessary input parameters for the development of hierarchical models, including (i) the number of member systems n, (ii) the structure of member systems within an IoT infrastructure ζ r b d , (iii) failure/recovery events representing the involved member systems ξ 1 , . . . , ξ n , (iv) the number of subsystems within each member systems ( j , . . . , j j ), (v) the structure of subsystems ( ζ γ ξ 1 f t , . . . , ζ γ ξ n f t ), (v) failure/recovery events representing the lower subsystems within a member system ( γ 1 ξ 1 , . . . , γ j ξ 1 , . . . , γ 1 ξ n , . . . , γ j ξ n ), and (vi) operative states and transitions of the underlying subsystems ( θ γ 1 ξ 1 , ζ θ γ 1 ξ 1 c t m c , . . . , θ γ j j ξ n , ζ θ γ j j ξ n c t m c ). In phase II, a modeling practitioner develops a unique hierarchical model of the IoT infrastructure consisting of three-level models ( Ξ , Γ , Θ ) based on the above-investigated inputs and data. In phase III, the hierarchical model of the IoT infrastructure can be solved using numerical methods in a bottom-up manner starting from solving CTMC models of subsystems upwards to solving the middle level FT model of member systems and eventually to solving the overall top RBD model to obtain final output measures of interest for security and availability evaluation. The intermediate outputs obtained by solving the CTMC models of subsystems at the bottom level Θ are ( π θ γ 1 ξ 1 c t m c , . . . , π θ γ j ξ 1 c t m c , . . . , π θ γ 1 ξ n c t m c , . . . , π θ γ j j ξ n c t m c ) which are forwarded to the upper FT model ( Γ ) of member systems. In turn, the obtained intermediate measures of interest π γ ξ 1 f t , . . . , π γ ξ n f t in solving the FT model ( Γ ) are transfered to the uppermost RBD model ( Ξ ) which is solved afterwards to obtain final measures of interest ( π r b d ) for the overall security and availability evaluation of the IoT infrastructure.

5. A Case-Study of IoT Infrastructures

5.1. Architecture Description

Practical IoT applications are often hosted on sophisticated computing infrastructures to secure essential metrics of interest claimed between customers and traders in SLA. The IoT infrastructures are nowadays designed to integrate cloud, fog, and edge computing paradigms to serve stringent requirements of constant IoT services and operations. In this section, the authors take into consideration a typical IoT smart factory architecture as shown in Figure 3 which consists of simplified cloud, fog, and edge member systems. The cloud member system is composed of n c S cloud servers (cServers) and n c G cloud gateways (cGateways) all connected to a cloud storage (cStorage). Fog member system consists of n f S fog servers (fServers) and n f G fog gateways (fGateways). In addition, lastly, edge member system comprises IoT equipments in a smart factory including n i S IoT sensors (iSensors) and m i D IoT devices (iDevices).
The assumptions for the sake of modeling simplification are described as follows:
  • Operative dependencies and sophisticated interactions among different member systems and subsystems are usually involved in performance/performability evaluation, and thus diminished in the reliability/availability quantification of the considered IoT smart factory.
  • Networking topologies are not taken into account to avoid complexities in modeling the overall IoT infrastructure.
  • Detailed architectures of building blocks at the lowest level are disregarded to reduce the complexity of the overall model.
  • The authors specifically consider a simplified architecture of the IoT smart factory infrastructure which consists of a limited number of cloud/fog servers, gateways and IoT sensors/devices.
The detailed configuration and operative description of the considered IoT smart factory are as follows.
  • Cloud: A cloud member system consists of two physical cloud servers ( c S 1 and c S 2 ), three cloud gateways ( c G 1 , c G 2 and c G 3 ), and one cloud storage ( c S t o r a g e ). c S 1 comprises underlying physical hardware ( c H W 1 ) and upper VMM ( c V M M 1 ). Similarly, c S 2 is composed of c H W 2 and c V M M 2 . The servers host two VM including c V M 1 and c V M 2 , respectively. The cloud servers enable cloud services to run constantly on the physical cloud platform which is mainly hosted on the cloud storage. The cloud gateways not only perform networking tasks required among the cloud servers and the cloud storage but also secure data communication (send/receive) from/to the fog member system. We assume that, even if a cloud server goes down, the remaining server has a spare space for hosting the two VMs. Furthermore, it is also assumed that, among three cloud gateways, the failure of two different cloud gateways at once is considered to not secure the networking inside the cloud member system and from the cloud to fog member system, thus leading a failure of the cloud. A single failure of the cloud storage is also considered a fatal failure of the cloud. The total outage of all VMs on the physical cloud servers also causes a total failure of the cloud, whereas a cloud goes down if all of its cloud servers reside in a failure state at once.
  • Fog: A fog member system is supposed to simply comprise a fog server f S and a fog gateway f G . A fog server directly handles computing tasks of local data transactions in the IoT smart factory for instant effectiveness and high performance with infinitesimal latency, while a fog gateway takes the role of high-speed communication between the fog and edge member systems and performs asynchronous data transactions to the cloud member systems. A fog server is considered to fail if either its physical hardware ( f H W ) or its operating system with embedded fog applications/services ( f O S ) fails. A fog gateway fails if either its hardware ( f g H W ) or embedded software ( f g S W ) fails.
  • Edge: The edge member system consists of a specific number of IoT sensors ( n i S ) and IoT devices ( m i D ) used in smart factories which are all connected to an IoT gateway ( i G ). A failure of i G causes a fatal failure of the IoT smart factory infrastructure since it plays the role of connecting IoT sensors/devices in a smart factory to fog and cloud member systems. In addition, it is assumed that, in order to secure fundamental functionalities and services provided in an IoT smart factory, at least a specific number of both IoT sensors and IoT devices functions at a time. Therefore, if k o f n i S IoT sensors experience a failure at once or on the other hand if k o f n i D IoT devices fails to function properly, the edge member system is considered to undergo a service outage in the IoT smart factory.

5.2. Hierarchical Models
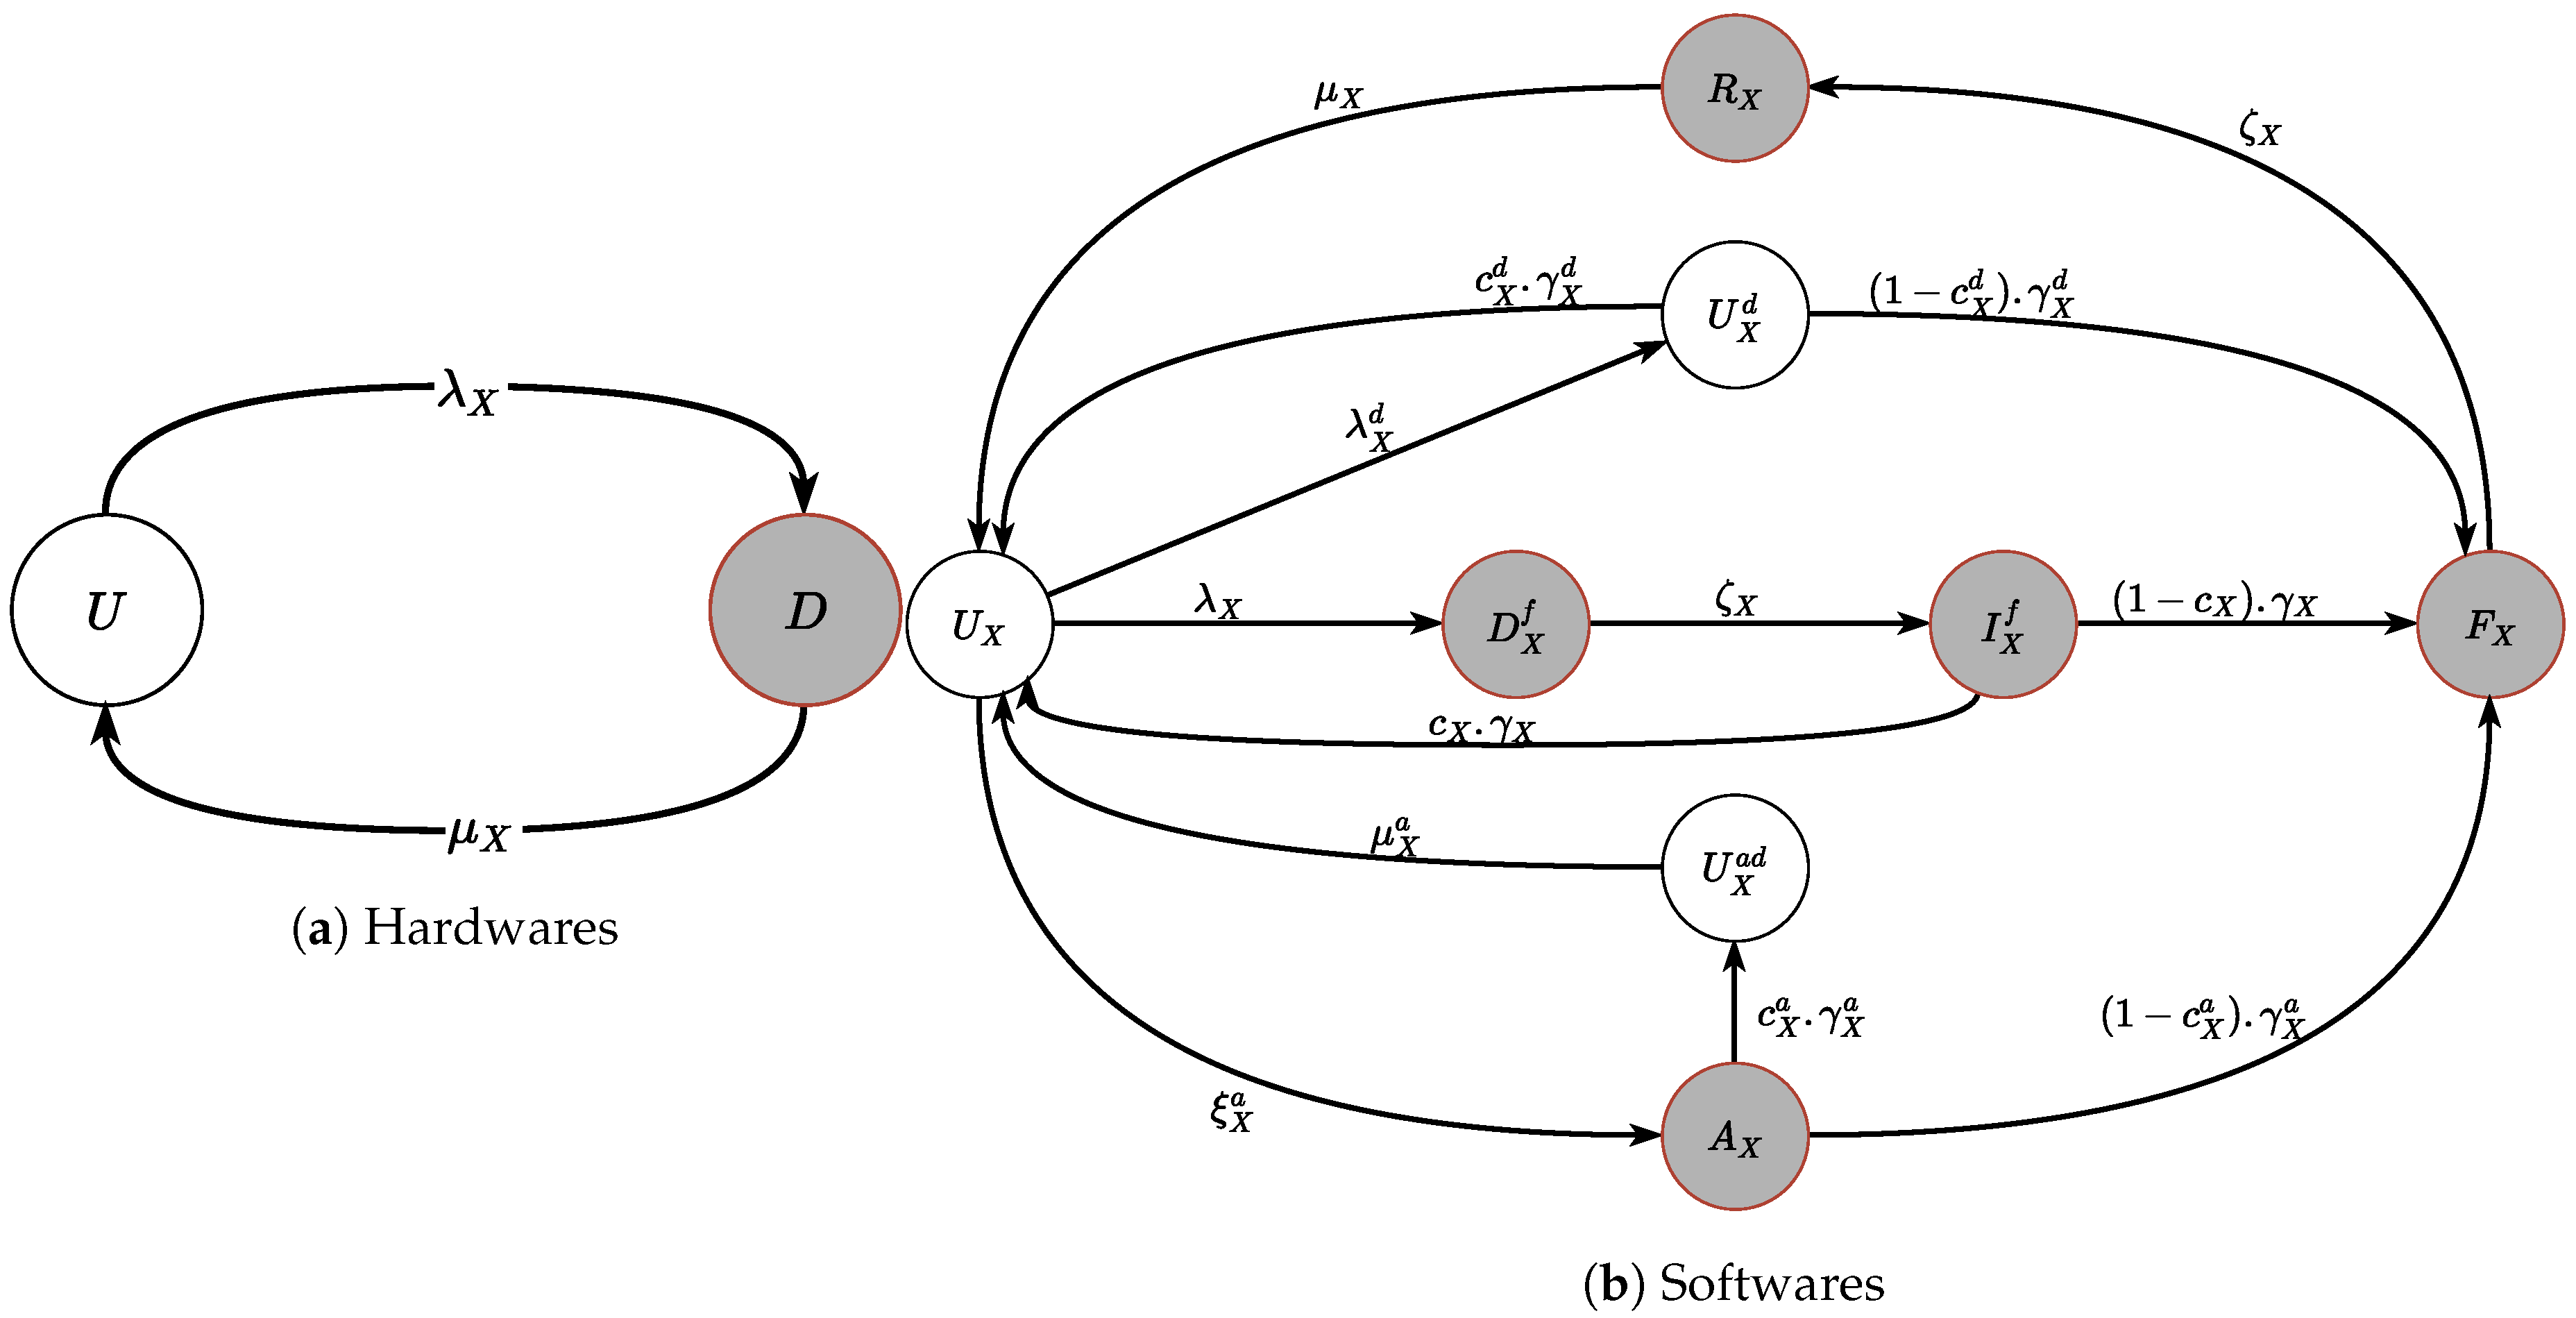
Overall Model of the IoT Smart Factory:
Figure 4 shows a three-level hierarchical model of the case-studied IoT smart factory infrastructure. The model consists of three types of system models including (i) RBD captures the correlation among member systems; (ii) FT captures internal structures of the member system, and (iii) CTMC captures operative dynamics represented by states and transitions of subsystems.
In regard of the considered IoT case-study, the top-level RBD consists of three blocks representing cloud (block C), fog (block F), and edge (block E) member systems, respectively. The assumption here is that a system owner imposes a stringent requirement to the design and development of the IoT infrastructure so that the failures of any of the three member systems severely cause a total failure on the entire IoT infrastructure (even though the remaining member systems still operates). Thus, in order to take into account the above-mentioned requirement, three blocks representing three member systems are drawn in a series in the top-level RBD model.
In the middle level, three FT models are developed in regard to the proposed structure and operations of the member systems considering the respective cloud, fog, and edge failures. In the cloud FT model, a top OR gate with three input gates is used to represent the case that a failure of one of three cloud parts including cloud servers (cServers), cloud storage (cStorage), and cloud gateways (cGateways) causes an entire failure of the cloud member system. Failures of the cloud servers are captured by an OR gate as well to capture the condition that failures of cloud servers’ low-level subsystems (including a cloud server’s hardware (cHW)) and a cloud server’s VMM (cVMM)) or failures of all cloud servers’ VMs (cVMs) lead to an entire failure of the cloud servers. To capture the scenarios that, if both cloud servers ( c S 1 and c S 2 ) must fail at once, the cloud server part (cServers)) in the cloud FT model is considered as residing in a failure, an AND gate with two inputs of c S 1 and c S 2 is used. In addition, the failure of either c S 1 or c S 2 depends on the failures of the respective cloud server’s hardware subsystem (cHW)or VMM (cVMM). Particularly, c S 1 is considered in a failure if its c H W 1 fails or its c V M M 1 fails, while the failures of either c H W 2 or c V M M 2 cause the failure of c S 2 . Thus, two OR gates are used to capture this scenario. On another branch of the cloud FT model, a kofn gate (particularly, 2of3) is used to represent the condition that, if two out of three cloud gateways (cG1, cG2, or cG3 fails at the same time, the whole cloud gateway part (cGateways) is considered being in a failure.
In the fog FT model, the fog failure events are captured by an OR gate with two inputs of fog server (fServer) and fog gateway (fGateway) indicating that the failures of the fog member system are caused by the failures of either fog server or fog gateway.
CTMC Models:
Figure 5 shows two CTMC models of software/hardware components in the IoT infrastructure.
  • Hardware subsystems:
    In order to model physical hardware parts of member systems, a simplification is required to consider only two-state operations (UP or DOWN) of the physical hardware as shown in Figure 5a since those parts often operate constantly in the long run without confronting with severe faults and the maintenance of those parts normally consists of rapid detection and replacement processes [56,57]. The two operative states include up-state (U) and down-state (D). When an uncertain failure occurs, the state transits from U to D with a transition rate λ X , whereas, as a failed physical hardware is recovered, the operative state transits from D to U with a transition rate μ X . The two-state model is used to capture the operative states of physical hardware in the IoT infrastructure over a long period of time including cloud servers’ hardware (cHW), cloud gateways’ hardware (cgHW), fog server’s hardware (fHW), fog gateway’s hardware (fgHW), IoT gateway’s hardware (igHW), IoT sensors’ hardware (iS), and IoT devices’ hardware (iD). The simplification is that, even though the hardware is different from each other, the modeling of these different types of hardware is identical using the above-described two-state model but with different input parameters of MTTFeq ( 1 / λ X ) and MTTReq ( 1 / μ X ) of each corresponding hardware. The values of those input parameters are mainly referred from previous works and some values are referred mostly from based practical experiences. As computing output results, the indicator X is replaced by the notation of the respective hardware. For instance, λ c H W is the failure rate of cloud servers’ hardware while μ i D is the recovery rate of IoT devices. The values of input parameters are presented in Table 1, Table 2 and Table 3.
  • Software Subsystems:
    Due to operative complexity and normally short state transitions, it is required to capture detailed operative states and transitions of the software subsystems at different levels in evaluating availability/security of the overall IoT infrastructure as shown in Figure 5b. A common model is used to model different software subsystems in Figure 4 including cloud servers’ VMM (cVMM), cloud servers’ VM (cVM), cloud gateways’ software (cgSW), fog server’s operating system (fOS), fog gateway’s software (fgSW), and IoT gateway’s software (igSW). The subscript letter X in states is replaced by the corresponding subscript letters representing the respective softwares and the values of transition rates with the respectively replaced subscript letters can be referred to the tables of input parameters in Table 1, Table 2 and Table 3. The description of the analytical models for the above-mentioned software subsystems is based on the description of the common model using the subscript letter X in Figure 5b. In the modeling of software subsystems in the IoT infrastructure, three main causes to software failures are considered and modeled, including: (i) uncertain failures due to flaws in software development stage, (ii) aging failures due to performance-degraded errors during software run-time, and (iii) security failures due to security attacks. We assume to take into account the security attack intensity rather than security attacker’s behaviors and threat model in modeling security related matters. Assuming that all software subsystems initially operate in a normal state depicted by U X . When an uncertain failure happens with a mean time to failure (MTTF) of 1 / λ X , the software’s operations transit to a down state D X f . Afterwards, a repair person is summoned with a rate ζ X , thus the state transits from the down state D X f to the under-investigation state I X f . The subsequent recovery of the software due to uncertain failures may succeed with a coverage factor of c X and a recovery rate of γ X . The successful recovery of a failed software at this time causes a state transition from I X f back to the up state U X . If the recovery process fails to complete, the state of the software transits from the under-investigation state I X f to the complete failure state F X .
    In another case when the software resides in the up state U X , the software often confronts with a variety of software aging-related errors which cause the software to not operate in the healthy state after a mean time of 1 / λ X d but operate in a failure-probable state U X d (but this state is still considered as an up state). In this situation, different software rejuvenation techniques can be performed to recovery the software state from the aging state U X d to the healthy state U X with a coverage factor of c X d and a recovery rate of γ X d . Thus, the mean time of a successful recovery from the aging state U X d is 1 / ( c X d . γ X d ) . If it fails to recover the aging software, the software eventually fails due to performance-degraded failures and its state transits from U X d to F X under the rate ( 1 c X d ) . γ X d .
    In the case that a cyber attacker performs a malicious and active attack which is to damage system resources or to take control of system operations and eventually to take down the software subsystems, the software subsystem’s state transits from the healthy state U X to the under-attack state A X with an assumption of an attack frequency of ξ X a . We assume that several cyber-security attack adaption techniques would be implemented as soon as the software subsystem is recognized as being in under-attack state, the success of these techniques could uphold previously running services thus maintain up-time operations of the software subsystem with existing cyber-security vulnerabilities. The adaption success is supposed to have a coverage factor of c X a and the adaption process to an attack would take a mean time of 1 / γ X a . The state of the software subsystem transits from the under-attack A X to an up state with cyber-security vulnerabilities after a successful adaption. The vulnerabilities can be removed by software patches afterwards with a mean time of 1 / μ X a . Subsequently, the software subsystem state returns to initially healthy state U X . In the case of cyber-security adaption failure, the software subsystem state transits from A X to a complete failure state F X with a transition rate of ( 1 c X a ) . γ X a .
    When the software subsystem resides in the complete failure state F X , it is essential to summon a repair person quickly and it still takes a mean time of 1 / ζ X . The software subsystem goes into a under-recovery state R X which is also a down state. The recovery of a failed software subsystem after that cost a mean time of 1 / μ X and the state of the software subsystem returns to its initially healthy state U X .

6. Numerical Results and Discussion

The proposed hierarchical models of the IoT smart factory infrastructure are all implemented in symbolic hierarchical automated reliability and performance evaluator (SHARPE) [58,59]. The input parameters are mostly based on previous experimental studies and consolidated works [19,27,60,61,62] as shown (i) in Table 1 for default input parameters used in software/hardware sub-models of cloud member system, (ii) in Table 2 for default input parameters of software/hardware sub-models of fog member system, and (iii) in Table 3 for default input parameters of edge member system’s software/hardware sub-models. The developed hierarchical model of the IoT smart factory infrastructure is analyzed in regard to various analysis outputs including (i) SSA, (ii) sensitivity of SSA wrt. significant parameters, and (iii) security analysis and security impact on SSA wrt. attack intensities.

6.1. Steady State Availability Analysis

In Table 4, analysis results are shown regarding fundamental measures of SSA including (i) MTTFeq, (ii) MTTReq, (iii) SSA/#9s (number of nines), and (iv) D N h o u r s / y e a r (downtime hours in a year), where the measures MTTFeq, MTTReq and SSA are all computed by analyzing the composed hierarchical model, and the measures #9s and downtime hours/year are computed using Equations (2) and (3)
# 9 s = log ( 1 A S S ) ,
D N h o u r s / y e a r = 8760 . ( 1 A S S ) .
As per observed, since the design of the considered IoT smart factory infrastructure aims to satisfy prerequisite operative requirements written in SLA documents, the cloud and fog member systems are expected to obtain roughly similar availability measures while the edge member system would obtain a higher availability—moreover, due to a sophisticated architecture of the cloud member system in which its availability often varies in relevance with the availability of virtualized subsystems (VMMs and/or VMs). On the other hand, the fog member system is usually designed to run on bare physical machines to achieve the highest computing capabilities and performance. Furthermore, the edge member system is designed to consist of physical IoT sensors/devices, in which their MTTFeqs and MTTReqs are, in practice, much longer and shorter, respectively, in comparison with those of the other components in cloud and fog member systems. Therefore, the cloud member system in the considered IoT infrastructure is supposed to obtain slightly lower availability in comparison with that of the fog member system, whereas the availability of the edge member system is clearly higher than that measure of other member systems. In the case of computing the availability of the overall IoT infrastructure, a stringent requirement in designing the IoT infrastructure is imposed, in which the IoT infrastructure fails in any of the three member systems (cloud, fog, and edge), entering a period of downtime. As a consequence, the overall availability of the IoT infrastructure is observed much lower than that of the three member systems. In addition, thus the IoT infrastructure undergoes a longer downtime duration in hours per a year. The above analysis demonstrates the capabilities of using the proposed hierarchical modeling framework to assess availability measures of a IoT infrastructure as well as to design an appropriate architecture and system parameters in order to satisfy operative requirements in SLA imposed on the IoT infrastructure.

6.2. Availability Sensitivity with Respect to Impacting Factors

Using the variation of one parameter at a time, sensitivity of SSA with respect to significant factors (MTTFeq and MTTReq of subsystems and member systems) over a range of values can be observed. The sensitivity analysis of a measure of interest is often used (i) to help find the bottlenecks represented by the effects on output measures wrt. variations of selected factors, thus (ii) to help identify the factors which expose the highest impact and, therefore, (iii) to facilitate parametric optimization processes in designing the IoT infrastructure. The analysis results of availability sensitivity wrt. MTTF and mean time to repair (MTTR) of subsystems and member systems are shown in Figure 6a–h. The IoT infrastructure’s SSA is computed as the values of MTTF and MTTR vary in the ranges of (0–1000) h and (0–200) h, respectively.
Figure 6a shows the variation of the IoT infrastructure’s SSA wrt. MTTFeqs of cloud, fog, and edge member systems, respectively. This analysis is aimed to study the impact of failures of the member systems on the IoT infrastructure’s SSA. When failures occur more often in the range of low values of MTTFeq (≤400 h), the failures of the member systems apparently pull down the IoT infrastructure’s SSA. Particularly, the failures of the cloud member system expose the most impact on the IoT infrastructure’s SSA depicted by the lowest graph of diamond markers, while those of the edge member system has the least impact represented by the highest graph of hexagram markers. Nevertheless, there exists a change when failures occur less often in the member systems ( MTTFeq 400 h) in the way that the failures of the edge member system impose the highest impact on the IoT infrastructure’s SSA depicted by the lowest graph of hexagram markers and the failures of the fog member system show the highest impact on the IoT infrastructure’s SSA depicted by the highest graph of pentagram markers.
Figure 6b presents three graphs of the dependence of the IoT infrastructure’s on the recovery rate of the cloud, fog, and edge member systems, respectively. In general, the SSA of the IoT infrastructure gradually decline on a downward slope as the time to recover a failed member system increases. Among the three member systems, the recovery of the failed cloud manifests the highest impact on the IoT infrastructure’s SSA as it enhances the SSA much higher at all values of MTTReq in comparison to the recovery processes of the remaining member systems, depicted by the highest graph with diamond markers. When the recovery process is fast enough ( MTTReq 80 h), the recovery of the fog member system helps obtain higher values of SSA than that of the edge member system, depicted by the higher graph of pentagram markers. Nevertheless, if the recovery process is slower ( MTTReq 80 h), the recovery of the failed edge member system helps gain higher values of SSA than that of the fog member system, depicted by the higher graph of hexagram markers. However, in order to not lose availability of the IoT infrastructure, one had better consider recovering the failed edge and fog member systems at first as fast as possible.
Figure 6c depicts the sensitivity of the IoT infrastructure’s SSA wrt. the MTTFs of subsystems in the cloud member system. This analysis aims to pinpoint the consequences of the cloud subsystems’ failures on the IoT infrastructure’s overall SSA. As per observed, failures in hardware subsystems including cloud server’s hardware, cloud gateway’s hardware, and cloud storage manifest to impose a severe impact on the IoT infrastructure’s SSA over the whole course of the MTTFs’ variation. In particular, the failures of the cloud servers’ hardware expose the most impact in dropping the IoT infrastructure’s SSA as depicted by the lowest graph of diamond markers. The second most impacting case in pulling down the IoT infrastructure’s SSA is the failures of the cloud storage subsystem as depicted by the second lowest graph of asterisk markers. The third one is the failures of the cloud gateway’s hardware as depicted by the third lowest graph of triangle markers. Regarding the impact of the failures of the software subsystems in the cloud member system, the failures of the cloud servers’ VMs (cVM) have the most impact in dragging the IoT infrastructure’s SSA depicted by the graph of hexagram markers which is at the lowest position in comparison with the other graphs of pentagram and right-pointing triangle markers representing the the variation of the IoT infrastructure’s SSA wrt. the MTTFs of the cloud servers’ VMM (cVMM) and the cloud gateway’s software (cgSW), respectively. This is reasonable since all applications and services practically run on cVMs, thus the failures of those cVMs actually contribute direct impact on the IoT infrastructure’s SSA. We also can observe that the failures of cVMMs manifest a similar impact on the IoT infrastructure’s SSA as close as the ones of cVMs do. The lowest impacting case is the failures of cgSW depicted by the highest graph of the right-pointing triangle markers.
Figure 6d shows the dependence of the IoT infrastructure’s SSA wrt. the variation of the cloud subsystems’ MTTRs. In contradiction to the dependence of the IoT infrastructure’s SSA wrt. MTTFs of the cloud subsystems in Figure 6c, as the values of MTTRs of the cloud subsystems increase, the values of the IoT infrastructure’s SSA gradually decline. The SSA values in the recovery cases of software subsystems (cVMM, cVM and cgSW) drop much faster than those of the recovery cases of hardware subsystems (cHW, cgHW and cStorage) do. In more detail, the recovery of a failed cVM manifests the most significant impact on the IoT infrastructure’s SSA, depicted by the graph with hexagram markers. A slow recovery of cVMs directly causes a severe drop of the IoT infrastructure’s SSA, and the faster the recovery of cVMs is performed, the much higher availability the IoT infrastructure can reach. The case which exposes the second most significant impact on the IoT infrastructure’s SSA is the recovery of cVMMs depicted by the graph of pentagram markers at a relatively higher position compared to the graph of hexagram markers representing the recovery of cVMs. In the remaining cases, we observe that a much slower recovery just gradually causes a decline of the IoT infrastructure’s SSA.
Figure 6e presents the impact of MTTFs of the fog subsystems on the IoT infrastructure’s SSA over a course of varied values. As per observed, we also see that the low values of MTTFs of the fog subsystems ( MTTF 400 h) cause a severe drop of the IoT infrastructure’s SSA. While the SSA gradually reaches to a base value as the MTTFs increase up to high values. Moreover, the failures of the hardware subsystems including fHW and fgHW manifest the most severe impact on the IoT infrastructure’s SSA depicted by the lowest graphs of hexagram and diamond markers. While the dependence of the IoT infrastructure’s SSA on the MTTFs of the software subsystems including fOS and fgSW is depicted by the highest graphs of right-pointing triangle and pentagram markers, respectively. In addition, the failures of fOS expose more severe impact than those of fgSW.
Figure 6f shows the variation of the IoT infrastructure’s SSA wrt. the values of MTTRs of the fog subsystems. As per observed, the recovery processes of the software subsystems including fOS and fgSW manifest a significant impact on the IoT infrastructure’s SSA depicted by the graphs of right-pointing triangle and pentagram markers, respectively—in which the recovery of fOS has more impact than that of fgSW does. In particular, a slow recovery of fgSW and fOS causes a huge drop in the values of the IoT infrastructure’s SSA in comparison to a initially fast recovery process of those subsystems. The recovery processes of hardware subsystems in the fog member system including fHW and fgHW are apparently important in enhancing the IoT infrastructure’s SSA but not decisively significant in maintaining the SSA compared to those of software subsystems (fOS and fgSW) do as in the above analysis.
Figure 6g shows the dependence of the IoT infrastructure’s SSA on the variation of the MTTFs of subsystems in the edge member system. As per observed, over the course of the MTTFs’ values, the IoT infrastructure’s SSA is maintained at the level of high values and stable as long as any of the considered MTTFs varies. This is to say that the IoT infrastructure’s SSA is less sensitive to the variation of the MTTFs or, in other words, the failures of the edge subsystems due to the loose requirements in the edge member system in which the subsystems of IoT sensors or devices are considered in failure only if a pre-defined number of IoT sensors/devices is all in failure at once. Only when the failures of the IoT sensors/devices/gateway occur more often ( MTTF 100 h o u r s ), the IoT infrastructure’s SSA vastly drops.
Figure 6h depicts the analysis results of the IoT infrastructure’s SSA wrt. the variation of the MTTRs of edge subsystems. In the edge member system, the IoT gateway’s software is the only software subsystem. Thus, the remaining subsystems including the IoT gateway’s hardware (igHW) and the IoT sensors/devices (iS/iD) are all hardware subsystems with higher values of their MTTFs. Since failures occur in hardware subsystems usually less frequently than those in software subsystems do, the recovery of the hardware subsystems (igHW/iS/iD) are not significant in comparison to the recovery of the software subsystem (igSW) in avoiding a severe drop of the IoT infrastructure’s SSA. This is depicted clearly by the graph of right-pointing triangle markers in which a slow recovery of the igSW causes a huge drop of the overall SSA of the IoT infrastructure, while other graphs representing other cases of the hardware subsystems in the edge member system still stay at a high position.

6.3. Security Analysis with Respect to Attack Intensity

Figure 6i depicts the impact of cyber-security attack intensity on the IoT infrastructure’s SSA. Security attacks are assumed to take down operations and services of targeted software subsystems in the IoT infrastructure. For that reason, this security analysis is aimed at examining the capabilities of software subsystems in maintaining the IoT infrastructure’s availability and to reveal which software subsystems are the most vulnerable points in the IoT infrastructure’s architecture against intensive cyber-security attacks in regard to operative availability. The attack intensity is featured by the MTTA or, in other words, attack frequency f A = 1 MTTA . As per observed in general, when an attack frequency is increased, the IoT infrastructure’s SSA slides down quickly. In addition, the value of the SSA is decreased vastly if a software subsystem is attacked more often while, when the attack intensity is low, the SSA gradually drops. In more detail, the cloud servers’ VMM (cVMM) is the most vulnerable subsystem in the IoT infrastructure in maintaining availability against cyber-security attacks in the way that, under the same attack intensity, attacks on cVMM cause a more severe drop of the IoT infrastructure’s SSA, depicted by the graph of diamond markers. The least one is the IoT gateway’s software, depicted by the graph of plus sign markers. According to the Figure 6i, we can observe the vulnerability level of all software subsystems in the IoT infrastructure based on the position of the graph representing the respective software subsystems. As per observed, the cloud server’s VMs (cVM) and the fog server’s OS (fOS) manifest vulnerabilities at the levels which are very close to each other. In addition, these software subsystems are the second most vulnerable in maintaining the IoT infrastructure’s SSA. The less vulnerable software subsystems are the cloud gateway’s software (cgSW) and the flog gateway’s software (fgSW) depicted by the graphs of hexagram and asterisk markers, respectively.

6.4. Further Discussions

Realistic test-bed of IoT infrastructure: The proposed hierarchical modeling and analysis framework is appropriate for the assessment of availability and security measures of different IoT infrastructures, specifically consisting of three-fold member systems. However, the hierarchical framework can take into consideration and reflect realistic operations of the IoT infrastructures, but there is still an inherent limitation due to assumptions and simplification during the modeling processes of subsystem/components leading to an approximation and deviation of the proposed models from the real-world IoT infrastructures. For that reason, it is for our future works to develop a real-world test-bed for the IoT infrastructure as shown in [63]. Nevertheless, the results of this study is possibly used as a base line for operative prediction and assessment of any realistic IoT infrastructure. For a reference of the modeling and analysis of a real-world existing computing systems using hierarchical models, see [21] for the hierarchical modeling of an IBM blade server system, see [62,64,65] for the availability modeling of a real-world Eucalyptus cloud platform using two-fold hierarchical models, and see [66] for a two-fold hierarchical modeling methodology for real-world mobile cloud computing systems.
Large-scale IoT infrastructure and dependency: Real-world IoT infrastructures in general and the IoT smart factory infrastructure, in particular, often consist of a huge number of heterogeneous IoT devices/sensors as well as sophisticated architectures of member systems and subsystems not mentioning the networking of network devices within the member systems. However, the proposed modeling framework is specific for modeling and analysis of those IoT infrastructures that typically consist of three-fold member systems with an assumption of independence in operations among those member systems. On the other hand, a realistic smart factory IoT infrastructure often includes a variety of production chains and sophisticated dependencies among computing powers in different production divisions. For this reason, a degradation in operative performance or even a failure of a certain member system can actually affect the operative availability of the other relevant systems. In this work, such complicated dependencies are diminished in order to obtain a tractable system model aiming at reflecting the overall architecture of the IoT infrastructure in the top level while capturing the detailed operative states and transitions of hardware and software components at the finest level. The attempts to model a large-scale IoT infrastructure with complicated dependency likely encounter a trade-off between (i) disregarding the overall system architecture of the IoT infrastructure in order to detail operative behaviors focusing on featured measures of interest (reliability/availability/performance), (ii) assuming to not take into account so sophisticated dependencies and all operative behaviors for the sake of modeling the overall system architecture of the IoT infrastructure (which is a significant requirement in evaluation of IoT infrastructures) while still emphasizing featured measures of interest (here, availability and security measures). This study uses a hierarchical modeling methodology to model the overall system architecture of the IoT infrastructure while the operative states and transitions featured for availability and security measures are specifically detailed in state-space Markov models at the bottom-most level. Ones can see [66,67] for similar approaches in modeling complex systems of mobile cloud computing.
Evaluation metrics: In this work, availability and security measures are the main focus of the proposed modeling and analysis framework for IoT infrastructure. The assessment mainly relies on the involvement of failure modes and recovery strategies for availability evaluation while attack intensities along with recovery of attack damage are the main focus being taken into account for security-aware assessment. Further considerations on security attack methods, security risks, and the effectiveness of different security countermeasures (for instance, Moving Target Defense (MTD) [68,69]) are of our future works. In addition, another extension can be the consideration of both performance and availability assessment (which is roughly called, perform-ability). We can see an open avenue in dependability and security evaluation of IoT infrastructures using hierarchical models as so proposed in this work.

7. Conclusions

In this paper, a hierarchical quantification framework has been proposed for availability and security assessment of IoT infrastructures featured by the hierarchical nature of integrated cloud/fog/edge computing paradigms. A hierarchical model of the overall IoT infrastructure has been proposed. The overall IoT infrastructure’s model consists of three-level models including RBD for overall infrastructure, FT for member systems, and (iii) CTMC for subsystems. A case-study of simplified IoT smart factory infrastructure was selected to demonstrate the feasibility of our approach. Various analysis results of the developed model for the IoT smart factory infrastructure in consideration include SSA under default parameters, availability sensitivity analysis wrt. significant MTTFeq and MTTReq of subsystems, and security analysis wrt. attack intensity based on availability level. The analysis results pinpointed the vulnerability levels of all software subsystems in the IoT smart factory infrastructure in which the cloud servers’ VMM and VM, and the fog server’s OS expose the most vulnerability to security attack intensity. In addition, the analysis results also showed the impact of failures and recovery of the subsystems/components on the overall availability of the IoT infrastructures in the way that more frequent failures of cloud can cause a severe drop of overall availability of the IoT smart factory infrastructure while quicker recovery of edge helps avoid decreasing the availability. The proposed hierarchical modeling and analysis framework along with the analysis results of the case-study IoT smart factory infrastructure provided an insightful understanding on availability and security measures of IoT infrastructures. As per applicability, the proposed availability and security quantification framework can help compare alternatives in designing system architecture of IoT infrastructures and find significant operative factors to obtain the highest availability of IoT services.

Author Contributions

Conceptualization, methodology, writing–original draft preparation, T.A.N.; writing–review and editing, E.C.; investigation, supervision, project administration, funding acquisition, D.M. All authors have read and agreed to the published version of the manuscript.

Funding

This paper was supported by KU Brain Pool 2019, Konkuk University, Seoul, South Korea. This research was funded and conducted under ‘The Competency Development Program for Industry Specialist’ of the Korean Ministry of Trade, Industry and Energy (MOTIE), operated by Korea Institute for Advancement of Technology (KIAT) (No. N0002428 and No. N0002431).

Acknowledgments

The authors would like to thank Kishor S. Trivedi and his research team at Duke University, Durham, NC 27708, United States, for providing the tool SHARPE.

Conflicts of Interest

The authors declare no conflict of interest. The funders had no role in the design of the study; in the collection, analyses, or interpretation of data; in the writing of the manuscript, or in the decision to publish the results.

References

  1. Gubbi, J.; Buyya, R.; Marusic, S.; Palaniswami, M. Internet of Things (IoT): A vision, architectural elements, and future directions. Future Gener. Comput. Syst. 2013, 29, 1645–1660. [Google Scholar] [CrossRef] [Green Version]
  2. Lin, J.; Yu, W.; Zhang, N.; Yang, X.; Zhang, H.; Zhao, W. A Survey on Internet of Things: Architecture, Enabling Technologies, Security and Privacy, and Applications. IEEE Internet Things J. 2017. [Google Scholar] [CrossRef]
  3. Ray, P. A survey on Internet of Things architectures. J. King Saud Univ. Comput. Inf. Sci. 2016. [Google Scholar] [CrossRef]
  4. Botta, A.; de Donato, W.; Persico, V.; Pescapé, A. Integration of Cloud computing and Internet of Things: A survey. Future Gener. Comput. Syst. 2016, 56, 684–700. [Google Scholar] [CrossRef]
  5. Botta, A.; de Donato, W.; Persico, V.; Pescape, A. On the Integration of Cloud Computing and Internet of Things. In Proceedings of the 2014 International Conference on Future Internet of Things and Cloud, Barcelona, Spain, 27–29 August 2014; pp. 23–30. [Google Scholar] [CrossRef]
  6. Mineraud, J.; Mazhelis, O.; Su, X.; Tarkoma, S. A gap analysis of Internet-of-Things platforms. Comput. Commun. 2016, 89–90, 5–16. [Google Scholar] [CrossRef] [Green Version]
  7. Sanislav, T.; Mois, G.; Miclea, L. An approach to model dependability of cyber-physical systems. Microprocess. Microsyst. 2016, 41, 67–76. [Google Scholar] [CrossRef]
  8. Andrade, E.; Nogueira, B. Dependability evaluation of a disaster recovery solution for IoT infrastructures. J. Supercomput. 2018. [Google Scholar] [CrossRef]
  9. Tigre, M.F.F.d.S.L.; Santos, G.L.; Lynn, T.; Sadok, D.; Kelner, J.; Endo, P.T. Modeling the availability of an e-health system integrated with edge, fog and cloud infrastructures. In Proceedings of the 2018 IEEE Symposium on Computers and Communications (ISCC), Natal, Brazil, 25–28 June 2018; pp. 00416–00421. [Google Scholar] [CrossRef]
  10. Santos, G.L.; Takako Endo, P.; Ferreira da Silva Lisboa Tigre, M.F.; Ferreira da Silva, L.G.; Sadok, D.; Kelner, J.; Lynn, T. Analyzing the availability and performance of an e-health system integrated with edge, fog and cloud infrastructures. J. Cloud Comput. 2018, 7, 16. [Google Scholar] [CrossRef] [Green Version]
  11. Nicol, D.; Sanders, W.; Trivedi, K. Model-based evaluation: From dependability to security. IEEE Trans. Dependable Secur. Comput. 2004, 1, 48–65. [Google Scholar] [CrossRef]
  12. Matos, R.; Andrade, E.C.; Maciel, P. Evaluation of a disaster recovery solution through fault injection experiments. In Proceedings of the 2014 IEEE International Conference on Systems, Man, and Cybernetics, San Diego, CA, USA, 5–8 Octorber 2014; pp. 2675–2680. [Google Scholar] [CrossRef]
  13. Sallhammar, K.; Helvik, B.; Knapskog, S. Towards a stochastic model for integrated security and dependability evaluation. In Proceedings of the First, International Conference on Availability, Reliability and Security (ARES’06), Vienna, Austria, 20–22 April 2006; pp. 8–165. [Google Scholar] [CrossRef] [Green Version]
  14. Trivedi, K.S.; Kim, D.S.; Roy, A.; Medhi, D. Dependability and security models. In Proceedings of the 2009 7th International Workshop on the Design of Reliable Communication Networks, DRCN 2009, Washington, DC, USA, 25–28 Octorber 2009; pp. 11–20. [Google Scholar] [CrossRef]
  15. Montecchi, L.; Nostro, N.; Ceccarelli, A.; Vella, G.; Caruso, A.; Bondavalli, A. Model-based Evaluation of Scalability and Security Tradeoffs: A Case Study on a Multi-Service Platform. Electron. Notes Theor. Comput. Sci. 2015, 310, 113–133. [Google Scholar] [CrossRef] [Green Version]
  16. Ge, M.; Kim, H.K.; Kim, D.S. Evaluating Security and Availability of Multiple Redundancy Designs when Applying Security Patches. In Proceedings of the 2017 47th Annual IEEE/IFIP International Conference on Dependable Systems and Networks Workshops (DSN-W), Denver, CO, USA, 26–29 June 2017. [Google Scholar]
  17. Torquato, M.; Maciel, P.; Vieira, M. A Model for Availability and Security Risk Evaluation for Systems with VMM Rejuvenation enabled by VM Migration Scheduling. IEEE Access 2019, 7, 138315–138326. [Google Scholar] [CrossRef]
  18. Sahner, R.; Trivedi, K.S.; Puliafito, A. Hierarchical Models. In Performance and Reliability Analysis of Computer Systems; Springer US: Boston, MA, USA, 1996; pp. 261–311. [Google Scholar] [CrossRef]
  19. Nguyen, T.A.; Min, D.; Choi, E.; Thang, T.D. Reliability and Availability Evaluation for Cloud Data Center Networks using Hierarchical Models. IEEE Access 2019, 7, 9273–9313. [Google Scholar] [CrossRef]
  20. Nguyen, T.A.; Eom, T.; An, S.; Park, J.S.; Hong, J.B.; Kim, D.S. Availability Modeling and Analysis for Software Defined Networks. In Proceedings of the 2015 IEEE 21st Pacific Rim International Symposium on Dependable Computing (PRDC), Zhangjiajie, China, 18–20 November 2015; pp. 159–168. [Google Scholar] [CrossRef]
  21. Smith, W.E.; Trivedi, K.S.; Tomek, L.A.; Ackaret, J. Availability analysis of blade server systems. IBM Syst. J. 2008, 47, 621–640. [Google Scholar] [CrossRef] [Green Version]
  22. Matos, R.; Araujo, J.; Oliveira, D.; Maciel, P.; Trivedi, K. Sensitivity analysis of a hierarchical model of mobile cloud computing. Simul. Model. Pract. Theory 2015, 50, 151–164. [Google Scholar] [CrossRef]
  23. Trivede, K.; Vasireddy, R.; Trindale, D.; Nathan, S.; Castro, R. Modeling High Availability. In Proceedings of the 2006 12th Pacific Rim International Symposium on Dependable Computing (PRDC’06), Riverside, CA, USA, 18–20 December 2006; pp. 154–164. [Google Scholar] [CrossRef]
  24. Jaatun, M.G.; Zhao, G.; Rong, C. Cloud Computing; Lecture Notes in Computer Science; Springer: Berlin/Heidelberg, Germany, 2009; Volume 5931. [Google Scholar] [CrossRef]
  25. Wu, C.; Buyya, R.; Ramamohanarao, K. Cloud Pricing Models. ACM Comput. Surv. 2019, 52, 108. [Google Scholar] [CrossRef]
  26. Pham, C.; Kalbarczyk, Z.; Iyer, R.K. Toward a high availability cloud: Techniques and challenges. In Proceedings of the IEEE/IFIP International Conference on Dependable Systems and Networks Workshops (DSN 2012), Boston, MA, USA, 25–28 June 2012; pp. 1–6. [Google Scholar] [CrossRef]
  27. Nguyen, T.A.; Kim, D.S.; Park, J.S. A Comprehensive Availability Modeling and Analysis of a Virtualized Servers System Using Stochastic Reward Nets. Sci. World J. 2014, 2014, 165316. [Google Scholar] [CrossRef] [Green Version]
  28. Nguyen, T.A.; Kim, D.S.; Park, J.S. Availability modeling and analysis of a data center for disaster tolerance. Future Gener. Comput. Syst. 2016, 56, 27–50. [Google Scholar] [CrossRef]
  29. Dasari, K.; Rayaprolu, M. Fog computing: Overview, architecture, security issues and applications. Lecture Notes in Electrical Engineering. In Proceedings of the International Conference on Communications and Cyber Physical Engineering 2018, Hyderabad, India, 24–25 January 2018. [Google Scholar] [CrossRef]
  30. Naha, R.K.; Garg, S.; Georgakopoulos, D.; Jayaraman, P.P.; Gao, L.; Xiang, Y.; Ranjan, R. Fog Computing: Survey of Trends, Architectures, Requirements, and Research Directions. IEEE Access 2018, 6, 47980–48009. [Google Scholar] [CrossRef]
  31. Yi, S.; Li, C.; Li, Q. A Survey of Fog Computing. In Proceedings of the 2015 Workshop on Mobile Big Data—Mobidata ’15; ACM Press: New York, New York, USA, 2015; pp. 37–42. [Google Scholar] [CrossRef]
  32. Yu, W.; Liang, F.; He, X.; Hatcher, W.G.; Lu, C.; Lin, J.; Yang, X. A Survey on the Edge Computing for the Internet of Things. IEEE Access 2018, 6, 6900–6919. [Google Scholar] [CrossRef]
  33. Ai, Y.; Peng, M.; Zhang, K. Edge computing technologies for Internet of Things: A primer. Digit. Commun. Netw. 2018. [Google Scholar] [CrossRef]
  34. Khan, W.Z.; Ahmed, E.; Hakak, S.; Yaqoob, I.; Ahmed, A. Edge computing: A survey. Future Gener. Comput. Syst. 2019, 97, 219–235. [Google Scholar] [CrossRef]
  35. El-Sayed, H.; Sankar, S.; Prasad, M.; Puthal, D.; Gupta, A.; Mohanty, M.; Lin, C.T. Edge of Things: The Big Picture on the Integration of Edge, IoT and the Cloud in a Distributed Computing Environment. IEEE Access 2018, 6, 1706–1717. [Google Scholar] [CrossRef]
  36. Wu, H.; Hu, J.; Sun, J.; Sun, D. Edge Computing in an IoT Base Station System: Reprogramming and Real-Time Tasks. Complexity 2019, 2019, 4027638. [Google Scholar] [CrossRef] [Green Version]
  37. Bruneo, D.; Distefano, S.; Longo, F.; Merlino, G.; Puliafito, A. I/Ocloud: Adding an IoT Dimension to Cloud Infrastructures. Computer 2018, 51, 57–65. [Google Scholar] [CrossRef]
  38. Maharaja, R.; Iyer, P.; Ye, Z. A hybrid fog-cloud approach for securing the Internet of Things. Clust. Comput. 2019, 22, 1–9. [Google Scholar] [CrossRef]
  39. Mahmud, R.; Koch, F.L.; Buyya, R. Cloud–Fog Interoperability in IoT-enabled Healthcare Solutions. In Proceedings of the 19th International Conference on Distributed Computing and Networking—ICDCN ’18; ACM Press: New York, New York, USA, 2018; pp. 1–10. [Google Scholar] [CrossRef]
  40. Okay, F.Y.; Ozdemir, S. A fog computing based smart grid model. In Proceedings of the 2016 International Symposium on Networks, Computers and Communications (ISNCC), Yasmine Hammamet, Tunisia, 11–13 May 2016; pp. 1–6. [Google Scholar] [CrossRef]
  41. Rahmani, A.M.; Gia, T.N.; Negash, B.; Anzanpour, A.; Azimi, I.; Jiang, M.; Liljeberg, P. Exploiting smart e-Health gateways at the edge of healthcare Internet-of-Things: A fog computing approach. Future Gener. Comput. Syst. 2018. [Google Scholar] [CrossRef]
  42. Mancini, R.; Tuli, S.; Cucinotta, T.; Buyya, R. iGateLink: A Gateway Library for Linking IoT, Edge, Fog and Cloud Computing Environments. arXiv 2019, arXiv:1911.08413. [Google Scholar]
  43. Villari, M.; Fazio, M.; Dustdar, S.; Rana, O.; Ranjan, R. Osmotic Computing: A New Paradigm for Edge/Cloud Integration. IEEE Cloud Comput. 2016, 3, 76–83. [Google Scholar] [CrossRef] [Green Version]
  44. Androcec, D. Systematic Mapping Study on Osmotic Computing. In Proceedings of the The 30th Central European Conference on Information and Intelligent Systems (CECIIS), Zagreb, Croatia, 2–4 October 2019; pp. 79–84. [Google Scholar]
  45. Mouradian, C.; Naboulsi, D.; Yangui, S.; Glitho, R.H.; Morrow, M.J.; Polakos, P.A. A Comprehensive Survey on Fog Computing: State-of-the-Art and Research Challenges. arXiv 2018, arXiv:cond-mat/0408151. [Google Scholar] [CrossRef] [Green Version]
  46. Mahmud, R.; Kotagiri, R.; Buyya, R. Fog Computing: A Taxonomy, Survey and Future Directions. In Internet of Everything; Springer: Berlin/Heidelberg, Germany, 2018; pp. 103–130. [Google Scholar] [CrossRef] [Green Version]
  47. Dustdar, S.; Avasalcai, C.; Murturi, I. Invited Paper: Edge and Fog Computing: Vision and Research Challenges. In Proceedings of the 2019 IEEE International Conference on Service-Oriented System Engineering (SOSE), San Francisco, CA, USA, 4–9 April 2019. [Google Scholar] [CrossRef]
  48. Bittencourt, L.; Immich, R.; Sakellariou, R.; Fonseca, N.; Madeira, E.; Curado, M.; Villas, L.; DaSilva, L.; Lee, C.; Rana, O. The Internet of Things, Fog and Cloud continuum: Integration and challenges. Internet Things 2018, 3–4, 134–155. [Google Scholar] [CrossRef] [Green Version]
  49. Memon, R.A.; Li, J.P.; Nazeer, M.I.; Neyaz, A.; Ahmed, J.; Wali, S.; Basit, A. DualFog-IoT: Additional Fog Layer for Solving Blockchain Integration Problem in Internet of Things. IEEE Access 2019, 7, 169073–169093. [Google Scholar] [CrossRef]
  50. Queiroz, J.; Leitão, P.; Barbosa, J.; Oliveira, E. Distributing Intelligence among Cloud, Fog and Edge in Industrial Cyber-physical Systems. In Proceedings of the 16th International Conference on Informatics in Control, Automation and Robotics, Prague, Czech Republic, 29–31 July 2019; pp. 447–454. [Google Scholar] [CrossRef] [Green Version]
  51. Grottke, M.; Trivedi, K.S. Software faults, software aging and software rejuvenation. J. Reliab. Eng. Assoc. Jpn. 2005, 27, 425–438. [Google Scholar]
  52. Schroeder, B.; Gibson, G.A. Disk failures in the real world: What does an MTTF of 1,000,000 hours mean to you? In Proceedings of the 5th USENIX Conference on File and Storage Technologies (FAST ’07), San Jose, CA, USA, 12–13 February 2007. [Google Scholar] [CrossRef]
  53. Rosendo, D.; Leoni, G.; Gomes, D.; Moreira, A.; Gonçalves, G.; Endo, P.; Kelner, J.; Sadok, D.; Mahloo, M. How to Improve Cloud Services Availability? Investigating the Impact of Power and It Subsystems Failures. In Proceedings of the 51st Hawaii International Conference on System Sciences (HICSS 2018), Hilton Waikoloa Village, HI, USA, 3–6 January 2018. [Google Scholar] [CrossRef] [Green Version]
  54. Gill, P.; Jain, N.; Nagappan, N. Understanding network failures in data centers: Measurement, analysis, and implications. In Proceedings of the ACM SIGCOMM, Toronto, ON, Canada, 15–19 August 2011. [Google Scholar] [CrossRef]
  55. Madan, B.; Gogeva-Popstojanova, K.; Vaidyanathan, K.; Trivedi, K. Modeling and quantification of security attributes of software systems. In Proceedings of the International Conference on Dependable Systems and Networks, Washington, DC, USA, 23–26 June 2002; pp. 505–514. [Google Scholar] [CrossRef] [Green Version]
  56. Wang, G.; Zhang, L.; Xu, W. What Can We Learn from Four Years of Data Center Hardware Failures? In Proceedings of the 2017 47th Annual IEEE/IFIP International Conference on Dependable Systems and Networks (DSN), Denver, CO, USA, 26–29 June 2017; pp. 25–36. [Google Scholar] [CrossRef]
  57. Miller, R. Failure Rates in Google Data Centers. Data Center Knowledge, Business. 30 May 2008. Available online: https://www.datacenterknowledge.com/archives/2008/05/30/failure-rates-in-google-data-centers (accessed on 1 December 2019).
  58. Trivedi, K. SHARPE 2002: Symbolic Hierarchical Automated Reliability and Performance Evaluator. In Proceedings of the International Conference on Dependable Systems and Networks, Washington, DC, USA, 23–26 June 2002; p. 544. [Google Scholar] [CrossRef]
  59. Trivedi, K.S.; Sahner, R. SHARPE at the age of twenty two. ACM SIGMETRICS Perform. Eval. Rev. 2009, 36, 52. [Google Scholar] [CrossRef]
  60. Kim, D.S.; Machida, F.; Trivedi, K.S. Availability Modeling and Analysis of a Virtualized System. In Proceedings of the 2009 15th IEEE Pacific Rim International Symposium on Dependable Computing, Shanghai, China, 16–18 November 2009; Volume 1, pp. 365–371. [Google Scholar] [CrossRef]
  61. Sebastio, S.; Trivedi, K.S.; Alonso, J. Characterizing machines lifecycle in Google data centers. Perform. Eval. 2018, 126, 39–63. [Google Scholar] [CrossRef]
  62. Matos, R.; Dantas, J.; Araujo, J.; Trivedi, K.S.; Maciel, P. Redundant Eucalyptus Private Clouds: Availability Modeling and Sensitivity Analysis. J. Grid Comput. 2016, 15, 1–22. [Google Scholar] [CrossRef]
  63. Bruneo, D.; Distefano, S.; Longo, F.; Merlino, G. An IoT Testbed for the Software Defined City Vision: The #SmartMe Project. In Proceedings of the 2016 IEEE International Conference on Smart Computing (SMARTCOMP), St. Louis, MO, USA, 18–20 May 2016; pp. 1–6. [Google Scholar] [CrossRef]
  64. Dantas, J.; Matos, R.; Araujo, J.; Maciel, P. Eucalyptus-based private clouds: Availability modeling and comparison to the cost of a public cloud. Computing 2015, 97, 1121–1140. [Google Scholar] [CrossRef]
  65. Dantas, J.; Matos, R.; Araujo, J.; Maciel, P. An availability model for eucalyptus platform: An analysis of warm-standy replication mechanism. In Proceedings of the 2012 IEEE International Conference on Systems, Man, and Cybernetics (SMC), Seoul, Korea, 14–17 October 2012; pp. 1664–1669. [Google Scholar] [CrossRef]
  66. Raei, H.; Yazdani, N. Analytical performance models for resource allocation schemes of cloudlet in mobile cloud computing. J. Supercomput. 2017, 73, 1274–1305. [Google Scholar] [CrossRef]
  67. Raei, H.; Yazdani, N.; Shojaee, R. Modeling and performance analysis of cloudlet in Mobile Cloud Computing. Perform. Eval. 2017, 107, 34–53. [Google Scholar] [CrossRef]
  68. Ge, M.; Cho, J.H.; Ishfaq, B.; Kim, D.S. Modeling and Analysis of Integrated Proactive Defense Mechanisms for Internet-of-Things. arXiv 2019, arXiv:1908.00327. [Google Scholar]
  69. Hong, J.B.; Enoch, S.Y.; Kim, D.S.; Nhlabatsi, A.; Fetais, N.; Khan, K.M. Dynamic Security Metrics for Measuring the Effectiveness of Moving Target Defense Techniques. Comput. Secur. 2018, 79, 33–52. [Google Scholar] [CrossRef]
Figure 1. A hierarchical model for security and availability evaluation.
Electronics 09 00155 g001
Figure 2. Modeling and analysis framework for security and availability quantification of IoT infrastructures.
Electronics 09 00155 g002
Figure 3. A typical architecture of IoT smart factory integrated with Cloud–Fog Infrastructures.
Electronics 09 00155 g003
Figure 4. Overall hierarchical model of an IoT smart factory infrastructure.
Electronics 09 00155 g004
Figure 5. Submodels of hardware/software subsystems.
Electronics 09 00155 g005
Figure 6. SSA of IoT smart factory infrastructure wrt. impacting factors.
Electronics 09 00155 g006aElectronics 09 00155 g006b
Table 1. Default input parameters for models of the cloud member system.
NameDescriptionValues
Cloud server’s physical hardware (cHW)
1 / λ c H W Mean time to a failure of a cloud server’s physical hardware8 years
1 / μ c H W Mean time to recover a failure of a cloud server’s physical hardware5 days
Cloud server’s VMM (cVMM)
1 / λ c V M M Mean time to a failure of a cloud server’s VMM365 days
1 / ζ c V M M Mean time to summon a repair-person to detect a failure and/or3 h
recover a failed cVMM
1 / γ c V M M Mean time to investigate a failure and detect8 h
1 / λ c V M M d Mean time to a performance-degradation issue of a cVMM120 days
1 / γ c V M M d Mean time to detect and recover failure-probable faults after5 h
performance-degradation
1 / ξ c V M M a Mean time to a cyber-security attack on a cVMM VMM45 days
1 / γ c V M M a Mean time to detect and adapt a security attack in order to restore a12 h
part of operational services
1 / μ c V M M a Mean time to fully recover an attacked cVMM after preliminary adaption24 h
1 / μ c V M M Mean time to recover a failure of a cloud server’s VMM16 h
c c V M M Coverage factor of detection and recovery of uncertain failures of a cVMM0.95
c c V M M d Coverage factor of software rejuvenation techniques against0.95
performance-degradation issues on a cVMM
c c V M M a Coverage factor of attack detection and partial recovery after a0.80
cyber-security attack on a cVMM
Cloud server’s VM (cVM)
1 / λ c V M Mean time to a failure of a cloud server’s VMM180 days
1 / ζ c V M Mean time to summon a repair-person to detect a failure and/or3 h
recover a failed cVM
1 / γ c V M Mean time to investigate a failure and detect uncertain failures of a cVM8 h
1 / λ c V M d Mean time to a performance-degradation issue of a cVM55 days
1 / γ c V M d Mean time to detect and recover failure-probable faults after3 h
performance-degradation
1 / ξ c V M a Mean time to a cyber-security attack on a cVM VMM20 days
1 / γ c V M a Mean time to detect and adapt a security attack in order to restore a8 h
part of operational services
1 / μ c V M a Mean time to fully recover an attacked cVM after preliminary adaption12 h
1 / μ c V M Mean time to recover a failure of a cloud server’s VMM6 h
c c V M Coverage factor of detection and recovery of uncertain failures of a cVM0.90
c c V M d Coverage factor of software rejuvenation techniques against0.90
performance-degradation issues on a cVM
c c V M a Coverage factor of attack detection and partial recovery after a0.85
cyber-security attack on a cVM
Cloud gateway’s physical hardware (cgHW)
1 / λ c g H W Mean time to a failure of a cloud gateway’s physical hardware10 years
1 / μ c g H W Mean time to recover a failure of a cloud gateway’s physical hardware10 days
Cloud gateway’s software (cgSW)
1 / λ c g S W Mean time to a failure of a cloud gateway software400 days
1 / ζ c g S W Mean time to summon a repair-person to detect a failure and/or7 days
recover a failed cgSW
1 / γ c g S W Mean time to investigate a failure and detect uncertain failures of a cgSW12 h
1 / λ c g S W d Mean time to a performance-degradation issue of a cgSW150 days
1 / γ c g S W d Mean time to detect and recover failure-probable faults after8 h
performance-degradation
1 / ξ c g S W a Mean time to a cyber-security attack on a cgSW VMM20 days
1 / γ c g S W a Mean time to detect and adapt a security attack in order to restore a18 h
part of operational services
1 / μ c g S W a Mean time to fully recover an attacked cgSW after preliminary adaption30 h
1 / μ c g S W Mean time to recover a failure of a cloud server’s VMM15 h
c c g S W Coverage factor of detection and recovery of uncertain failures of a cgSW0.90
c c g S W d Coverage factor of software rejuvenation techniques against0.95
performance-degradation issues on a cgSW
c c g S W a Coverage factor of attack detection and partial recovery after a0.90
cyber-security attack on a cgSW
Cloud storage (cStorage)
λ c S t o r a g e Mean time to a failure of a cloud storage5 years
μ c S t o r a g e Mean time to recover a failed cloud storage10 days
Table 2. Default input parameters for models of the fog member system.
NameDescriptionValues
Fog server’s physical hardware (fHW)
1 / λ f H W Mean time to a failure of a fog server’s physical hardware5 years
1 / μ f H W Mean time to recover a failure of a fog server’s physical hardware5 days
Fog server’s bare operating system (fOS)
1 / λ f O S Mean time to an uncertain failure of a fog server’s bare operating system200 days
1 / ζ f O S Mean time to summon a repair-person to detect a failure and/or3 h
recover a failed fOS
1 / γ f O S Mean time to investigate a failure and detect uncertain failures of a fOS15 min
1 / λ f O S d Mean time to a performance-degradation issue of a fOS150 days
1 / γ f O S d Mean time to detect and recover failure-probable faults after90 min
performance-degradation
1 / ξ f O S a Mean time to a cyber-security attack on a fOS45 days
1 / γ f O S a Mean time to detect and adapt a security attack in order to restore3 h
a part of operational services of the fOS
1 / μ f O S a Mean time to fully recover an attacked fOS after preliminary adaption2 h
1 / μ f O S Mean time to recover a failure of a fog operating system fOS6 h
c f O S Coverage factor of detection and recovery of uncertain failures of a fOS0.90
c f O S d Coverage factor of software rejuvenation techniques against0.90
performance-degradation issues on a fOS
c f O S a Coverage factor of attack detection and partial recovery after0.85
a cyber-security attack on a fOS
Fog gateway’s physical hardware (fgHW)
1 / λ f g H W Mean time to a failure of a fog gateway’s physical hardware8 years
1 / μ f g H W Mean time to recover a failure of a fog gateway’s physical hardware3 days
Fog gateway’s software (fgSW)
1 / λ f g S W Mean time to an uncertain failure of a fog gateway’s software250 days
1 / ζ f g S W Mean time to summon a repair-person to detect a failure and/or3 h
recover a failed fgSW
1 / γ f g S W Mean time to investigate a failure and detect uncertain failures of a fgSW15 min
1 / λ f g S W d Mean time to a performance-degradation issue of a fgSW100 days
1 / γ f g S W d Mean time to detect and recover failure-probable faults after90 min
performance-degradation
1 / ξ f g S W a Mean time to a cyber-security attack on an fgSW45 days
1 / γ f g S W a Mean time to detect and adapt a security attack in order to restore3 h
a part of operational services of the fgSW
1 / μ f g S W a Mean time to fully recover an attacked fgSW after preliminary adaption2 h
1 / μ f g S W Mean time to recover a failure of a fog operating system fgSW6 h
c f g S W Coverage factor of detection and recovery of uncertain failures of a fgSW0.90
c f g S W d Coverage factor of software rejuvenation techniques against0.90
performance-degradation issues on an fgSW
c f g S W a Coverage factor of attack detection and partial recovery after0.85
a cyber-security attack on an fgSW
Table 3. Default input parameters for models of a fog member system.
NameDescriptionValues
IoT sensors (iSensors)
1 / λ i S Mean time to a failure of an IoT sensor3 years
1 / μ i S Mean time to recover a failed IoT sensor15 min
IoT devices (iDevices)
1 / λ i D Mean time to a failure of an IoT device1 year
1 / μ i D Mean time to recover a failed IoT device3 days
IoT gateway’s physical hardware (igHW)
1 / λ i g H W Mean time to a failure of a IoT gateway’s physical hardware3 years
1 / μ i g H W Mean time to recover a failure of a IoT gateway’s physical hardware12 h
IoT gateway’s software (igSW)
1 / λ i g S W Mean time to an uncertain failure of a IoT gateway’s software300 days
1 / ζ i g S W Mean time to summon a repair-person to detect a failure and/or2 h
recover a failed igSW
1 / γ i g S W Mean time to investigate a failure and detect uncertain failures of a igSW10 min
1 / λ i g S W d Mean time to a performance-degradation issue of a igSW180 days
1 / γ i g S W d Mean time to detect and recover failure-probable faults after75 min
performance-degradation
1 / ξ i g S W a Mean time to a cyber-security attack on a igSW20 days
1 / γ i g S W a Mean time to detect and adapt a security attack in order to restore75 min
a part of operational services of the igSW
1 / μ i g S W a Mean time to fully recover an attacked igSW after preliminary adaption2 h
1 / μ i g S W Mean time to recover a failure of a IoT gateway’s software igSW135 min
c i g S W Coverage factor of detection and recovery of uncertain failures of a igSW0.95
c i g S W d Coverage factor of software rejuvenation techniques against0.85
performance-degradation issues on a igSW
c i g S W a Coverage factor of attack detection and partial recovery after0.90
a cyber-security attack on a igSW
Table 4. Steady state analysis of IoT infrastructure under default parameters.
SystemsMTTFeqMTTReqSSA#9s DN hours / year
Cloud5.242 × 10 2 1.681 × 10 1 9.689 × 10 1 1.508272.249
Fog3.638 × 10 2 8.003 × 10 0 9.784 × 10 1 1.667188.528
Edge4.336 × 10 2 3.948 × 10 1 9.990 × 10 1 3.0417.970
IoT Infra.1.436 × 10 2 8.005 × 10 0 9.472 × 10 1 1.277462.4

