Communication

Floating Car Data Adaptive Traffic Signals: A Description of the First Real-Time Experiment with “Connected” Vehicles

by
Vittorio Astarita
*,
Vincenzo Pasquale Giofré
,
Demetrio Carmine Festa
,
Giuseppe Guido
and
Alessandro Vitale
Department of Civil Engineering, University of Calabria, Via Bucci Cubo 46/B, 87036 Rende, Italy
*
Author to whom correspondence should be addressed.
Electronics 2020, 9(1), 114; https://doi.org/10.3390/electronics9010114
Submission received: 11 December 2019 / Revised: 27 December 2019 / Accepted: 1 January 2020 / Published: 7 January 2020
(This article belongs to the Special Issue Intelligent Transportation Systems (ITS))

Abstract

:
The future of traffic management will be based on “connected” and “autonomous” vehicles. With connected vehicles it is possible to gather real-time information. The main potential application of this information is in real-time adaptive traffic signal control. Despite the feasibility of using Floating Car Data (FCD), for signal control, there have been practically no real experiments with all “connected” vehicles to regulate traffic signals in real-time. Most of the research in this field has been carried out with simulations. The purpose of this study is to present a dedicated system that was implemented in the first experiment of an FCD-based adaptive traffic signal. For the first time in the history of traffic management, a traffic signal has been regulated in real time with real “connected” vehicles. This paper describes the entire path of software and system development that has allowed us to make the steps from just simulation test to a real on-field implementation. Results of the experiments carried out with the presented system prove the feasibility of FCD adaptive traffic signals with commonly-used technologies and also establishes a test-bed that may help others to develop better regulation algorithms for these kinds of new “connected” intersections.

1. Introduction

Connected vehicles will become an important element of the forthcoming Internet of Things (IoT) and of Intelligent Transportation Systems (ITS) [1]. The various sensors that “connected” vehicles will carry will bring an enormous amount of data that could be useful for real-time traffic regulation.
Connected vehicles may help to solve traffic congestion problems which were hardly solved with traditional methodologies. Traditional traffic engineering practice was based on attempts to shift demand on transit systems [2] and on better road traffic control by adopting tools such as: traffic simulation [3,4,5,6,7,8] dynamic network loading equilibrium and dynamic models [9,10,11,12] and the study and attempt to affect user route choice [13,14,15,16,17].
All these methodologies, that often do not require the use of advanced technologies, were applied by road administrations with varying results. Some city administrations (especially in Italy) do not always deal properly with the task of providing well-adjusted traffic signal settings. Traffic signal regulation very often is not real-time adjusted and is very badly performed with outdated fixed time traffic signal settings. This can cause traffic congestion that is a serious problem in cities and also a great cause of air pollution [18,19,20,21].
The introduction of “connected” vehicles and the use of spread out sensors data could help city administrations to manage traffic in cities better and launch a new generation of adaptive traffic signals which can be controlled on the base of real-time traffic data obtained directly from “connected” probe vehicles.
Many scientific works have been presented where “connected” vehicles act as floating probe vehicles. These systems are usually defined as based on: “Floating Car Data” (FCD). First FCD-based papers have proposed the use of specific Radio-frequency identification (RFID) systems [22,23]. Other papers have proposed the use of dedicated local wireless networks using vehicle to infrastructure (V2I) communication data [24]. Smartphones also have been used in different applications to connect vehicles [25,26] to infrastructures.
The use of the existing wireless mobile phone networks could prove to be cost efficient since ad hoc developed wireless systems could have to bear sensibly higher costs. For this reason, and since smart phones are so pervasive, some scientific works have explored the use of a smart phone as a means to obtain FCD.
The concept of FCD obtained by counting the flow of smartphones on vehicles was anticipated in the patent [27] and was implemented starting in 2008 by the use of Bluetooth protocol as a means to detect the smartphones. Some scientific works were published on Bluetooth as a means of gathering FCD [28,29,30,31,32] and the methodology is currently still applied in many cities.
The first works on smartphone-based FCD did not take advantage of satellite positioning systems: [33,34,35,36,37]. Subsequently, other scientific works were based on using Global Navigation Satellite Systems (GNSS) which nowadays are available on every mobile phone.
Today, mobile phones can act as sensors and transmitters; and with them it is possible to estimate travel times [38,39], speeds [40,41], assess safety [42,43], give assistance in safer driving [44,45], estimate fuel consumption [46,47,48,49] measure road pavement quality and recognize specific problems [50,51,52] and also model route choice behavior [53].
In [54] buses are used as FCD and in [55] low frequency FCD are applied to estimate traffic conditions. Some papers have also explored the use of FCD data in traffic safety to evaluate the characteristics of different driving styles and for real-time incident detection: [43,56,57].
The satellite localization system of smartphones was also used to obtain vehicle trajectories and estimate the traffic signal timings in real-time. The idea is to assist the drivers to achieve a better driving approach at traffic signals with increased safety and reduced fuel consumption [58,59].
Many works have been presented on the specific issue of this paper: the use of FCD data coming from smartphone to regulate adaptive traffic signals in real-time [60,61,62,63,64,65,66,67,68,69]. In some cases, the adaptive traffic signal system is used in combination with driver assistance, so that both driver behavior and traffic signals are real-time adjusted.
In all the above-cited studies on adaptive traffic signals there is no real experimental implementation with real vehicles. Practically all preceding FCD studies for adaptive signals were simulation-based. In this paper we intend to illustrate the first case of FCD-based adaptive traffic signal implemented in real-time in the field with real vehicles.
This paper presents both the software and the hardware development of a dedicated system for traffic signal real time regulation based on data coming from “connected” vehicles.
The steps that were taken to obtain the experimental results that are described below were:
  • Development of a simulation platform for the evaluation and development of control algorithms.
  • Development of a connected traffic signal.
  • Development of a specific smart- phone application.
  • Development of a specific traffic signal control server.
  • Planning and mapping of the experimental site.
  • Conclusive implementation of all the different parts of the system in the final experiment.
As a result of these steps a three-legs intersection was regulated in real-time on the basis of FCD data. This paper describes this first experiment and the controlling system.
Many research activities can be stimulated by this paper, yet we believe that the more important contribution is in the detailed description of all the steps and concepts that allowed carrying out the first successful experiment, with a traffic signal regulated by FCD of 100% of connected vehicles, since this information can be very valuable to reproduce our results in other situations.
New experiments can, in fact, involve more experts to accept the feasibility of this concept, to grasp the advantages of FCD adaptive traffic signals and develop better systems and algorithms for these kinds of new “connected” intersections.

2. Materials and Methods

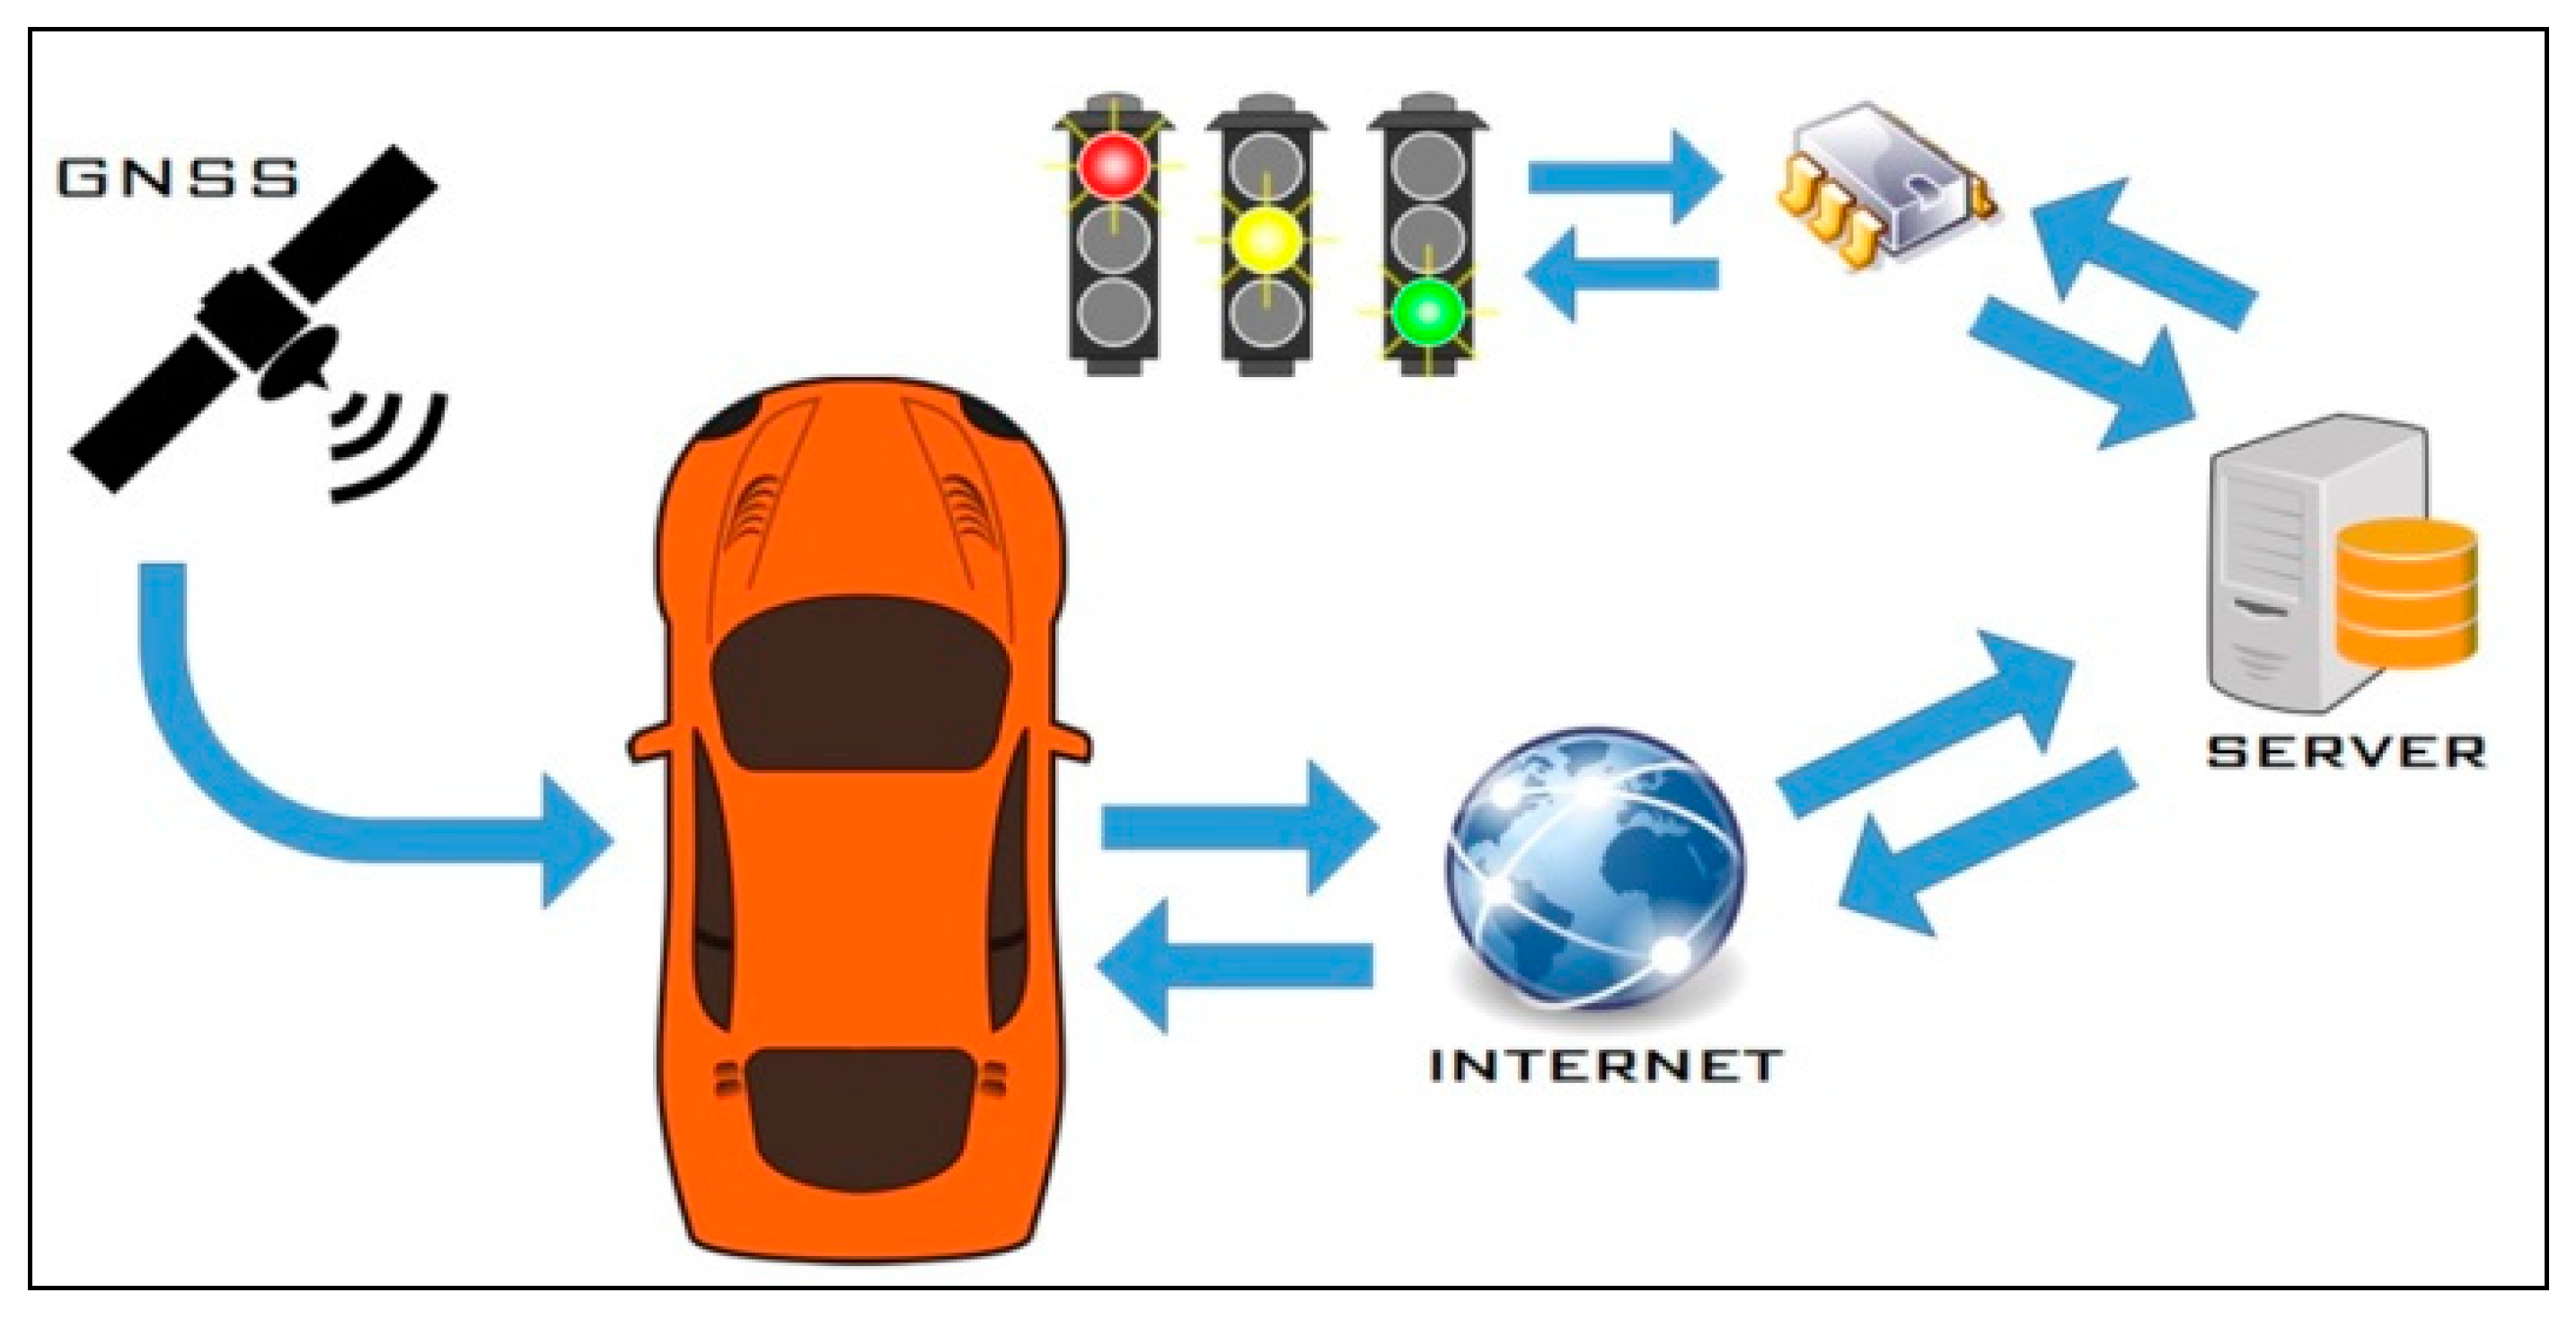
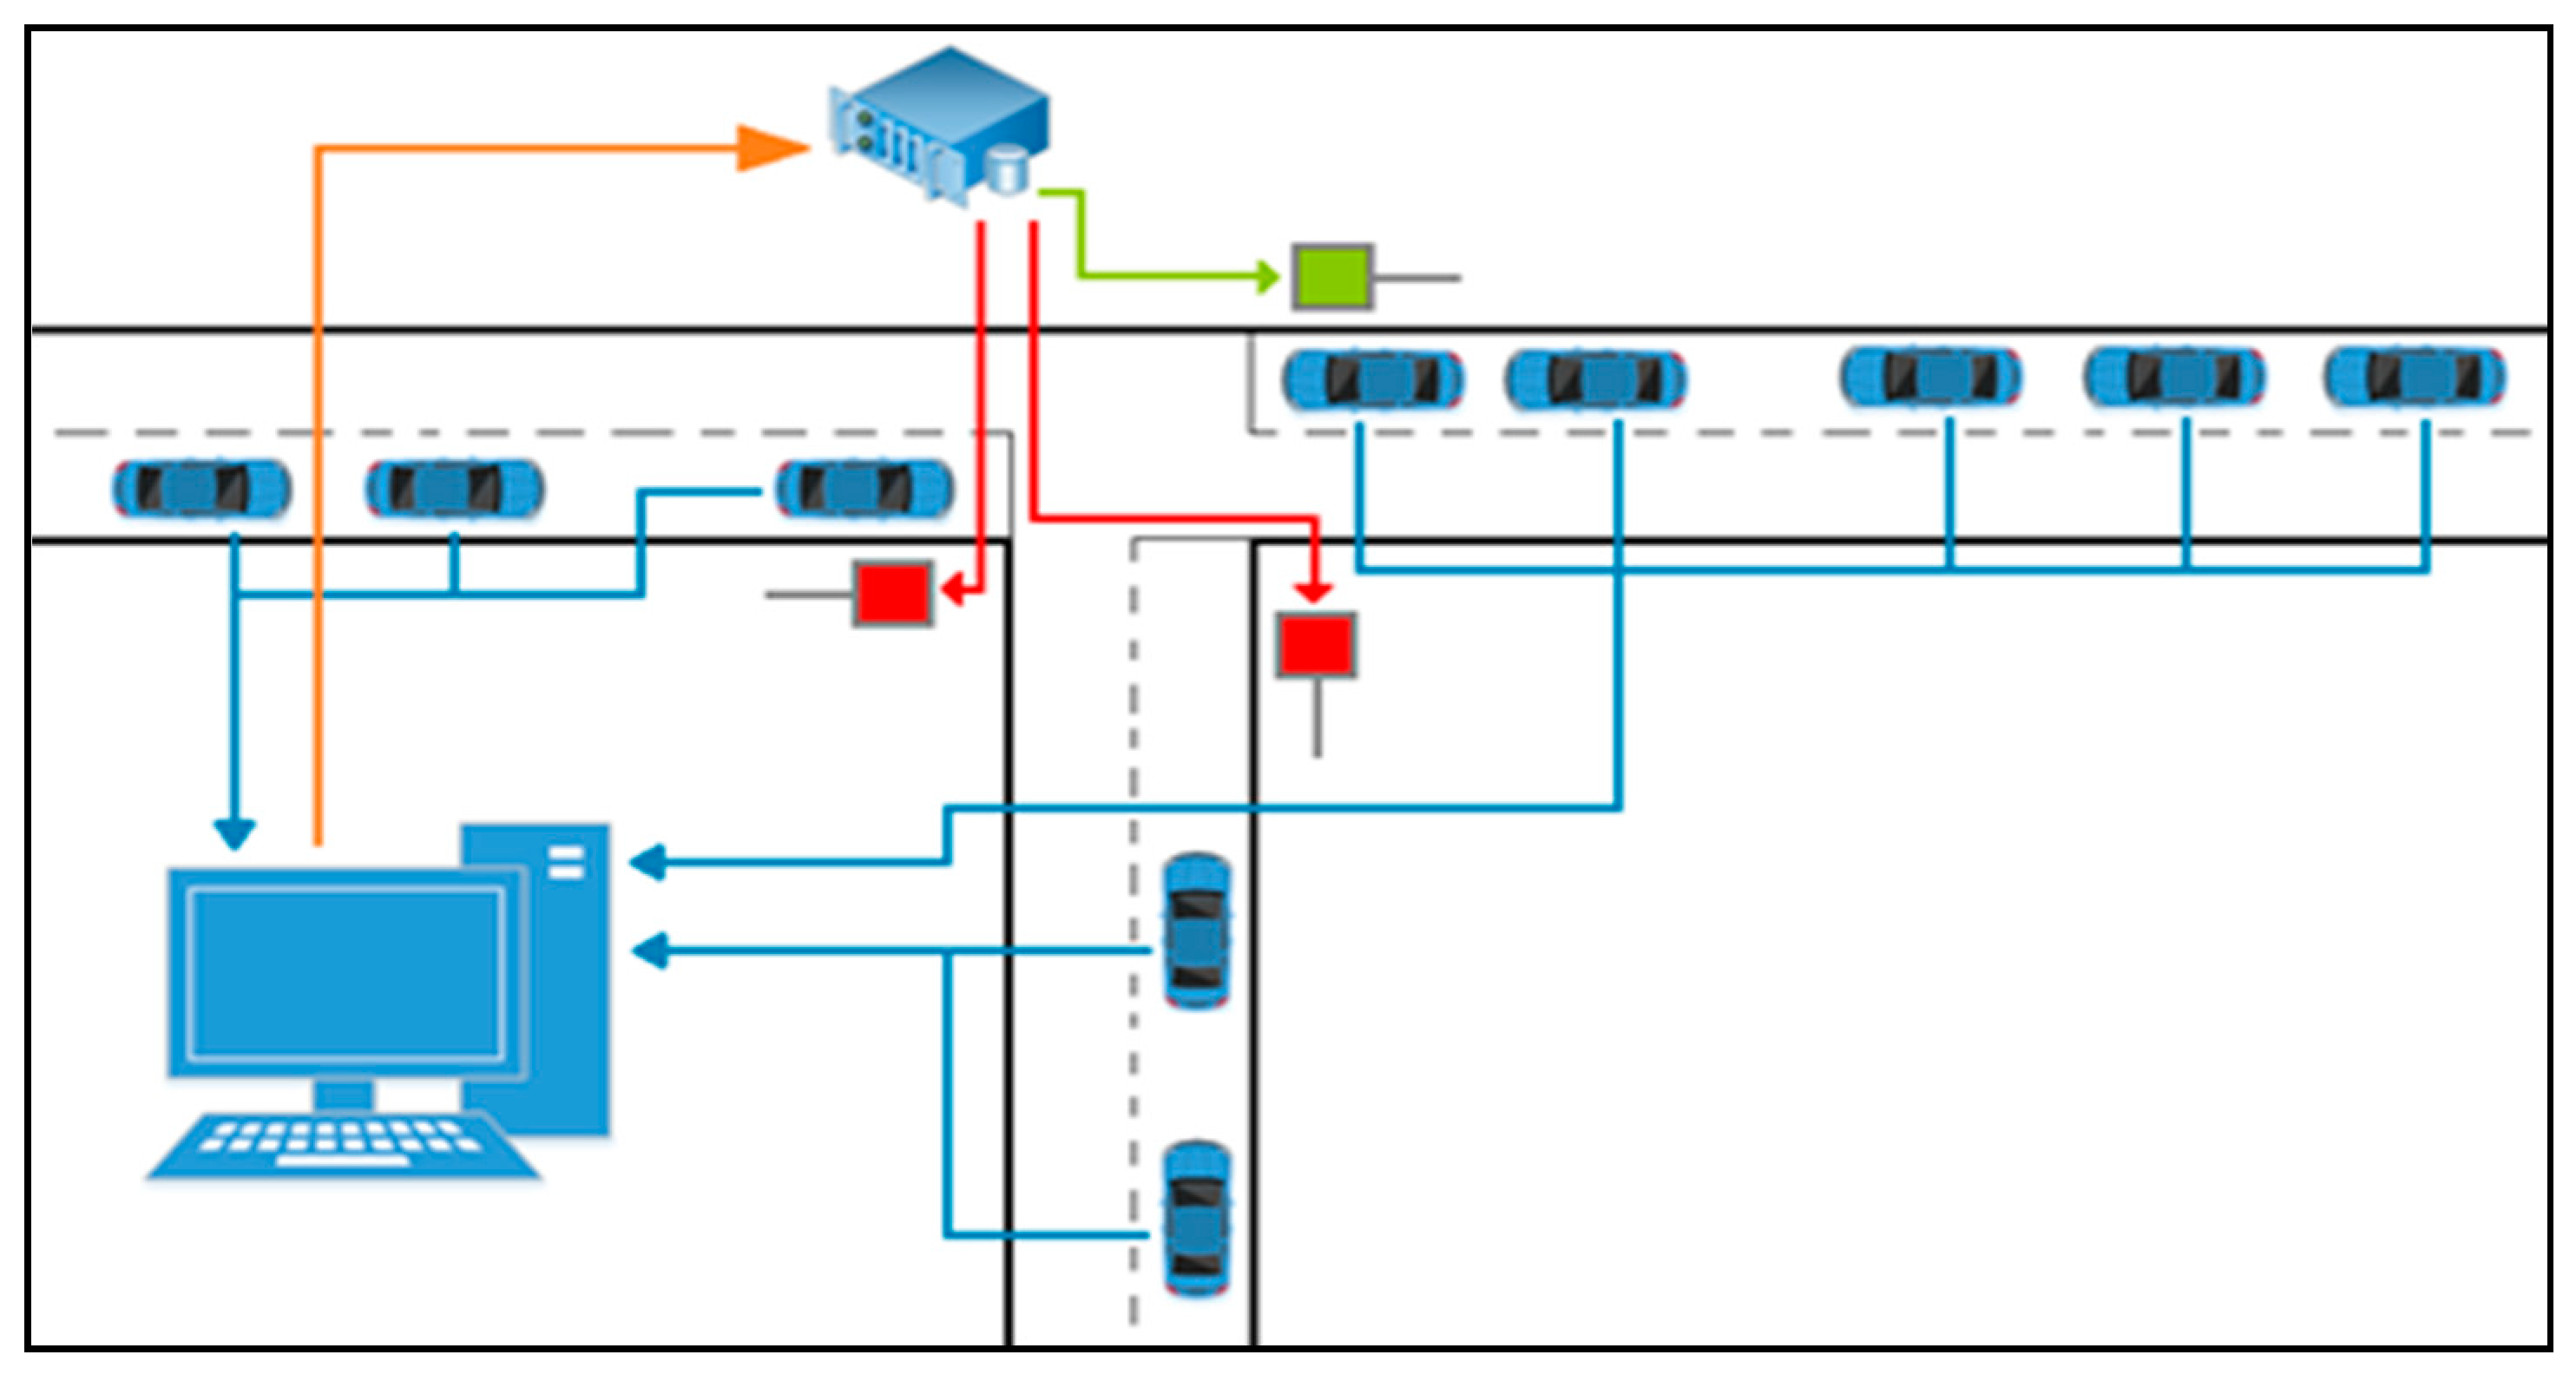
2.1. The Proposed Cooperative FCD-Based Adaptive Traffic Signal System

In many countries the traffic signal systems that are adopted are low-technology fixed-time control units, where the signal timing is preset according to historic traffic counts. More advanced countries deploy high-priced real-time traffic signals that apply a real-time control technology based on data coming from sensors embedded in the road. Sensors installation is time-consuming and expensive, moreover, sensors have a very high maintenance cost.
The proposed system relies on a mobile phone application that can transform any vehicle into a “connected” vehicle. Traditional sensors use magnetic loop detector measurements to obtain traffic flow counts. In our system information on traffic flows is not directly obtained, instead it is extrapolated from “connected” vehicle trajectories. The data obtained is different and to some extent more detailed since from vehicle trajectories it is possible to evaluate directly the queue length for every maneuver at the intersection [70].
Moreover, the presented system can be considered a cooperative intelligent transportation system (one of the first being actually implemented in the field) since it requires the cooperation of connected vehicles in communicating their position in real time. The following issues regarding cooperation and competition have been thoroughly discussed in [63]:
  • In traffic signal regulation there is competition between drivers coming from different approaches of the same intersection, they compete for the available green time. In FCDATS there is also competition between “connected” vehicles and traditional vehicles, “connected” vehicles in fact could receive more green time at the expense of not “connected” vehicles that cannot be considered by FCDATS systems.
  • Cooperation is naturally present in FCDATS since a “connected” vehicle sends useful information on the current state of the traffic network. This information could advantage also other vehicles which are not connected. The findings of previous works [63,64,66] based on simulation showed that when a percentage of 30% is reached all vehicles take advantage from the shared information coming from “connected” vehicles.
For these two issues FCDATS could be defined as “coopetitive” systems since both competitive and cooperative aspects have a great importance. Drivers have the choice of participating in the system by “connecting” the driven vehicle or to stay out of the system and take advantage of other drivers that are connected. This kind of issue has a great importance when the system rewards “connected” vehicles or when there are costs to go through to participate in the system (green light fees in a pay-per-green scheme or, in any case, the costs of acquiring new equipment or a vehicle that can connect to the system).
All issues regarding competition-cooperation in FCDATS can be studied in simulation. In our experiment all the vehicles were connected since the scope was that of proving the feasibility and ease of implementation of these systems and the consistency of simulated results with real on-field results.
The general structure of the experimented system is presented in Figure 1, where the following physical parts are depicted:
  • the traffic lights of the intersection that are actuated by a local controller;
  • the local electronic controller (Raspberry microcomputer) that is connected on the internet and that acts as a web server regulating the traffic signals at request;
  • a central server that collects data from “connected” vehicles” and establishes the best traffic signal cycle according to data processing and the algorithm that are described in the following;
  • the “connected” vehicles with a smartphone application that receive data relative to positions and speeds from the GNSS system and transmit them to the central server (on the common local wireless phone data network).

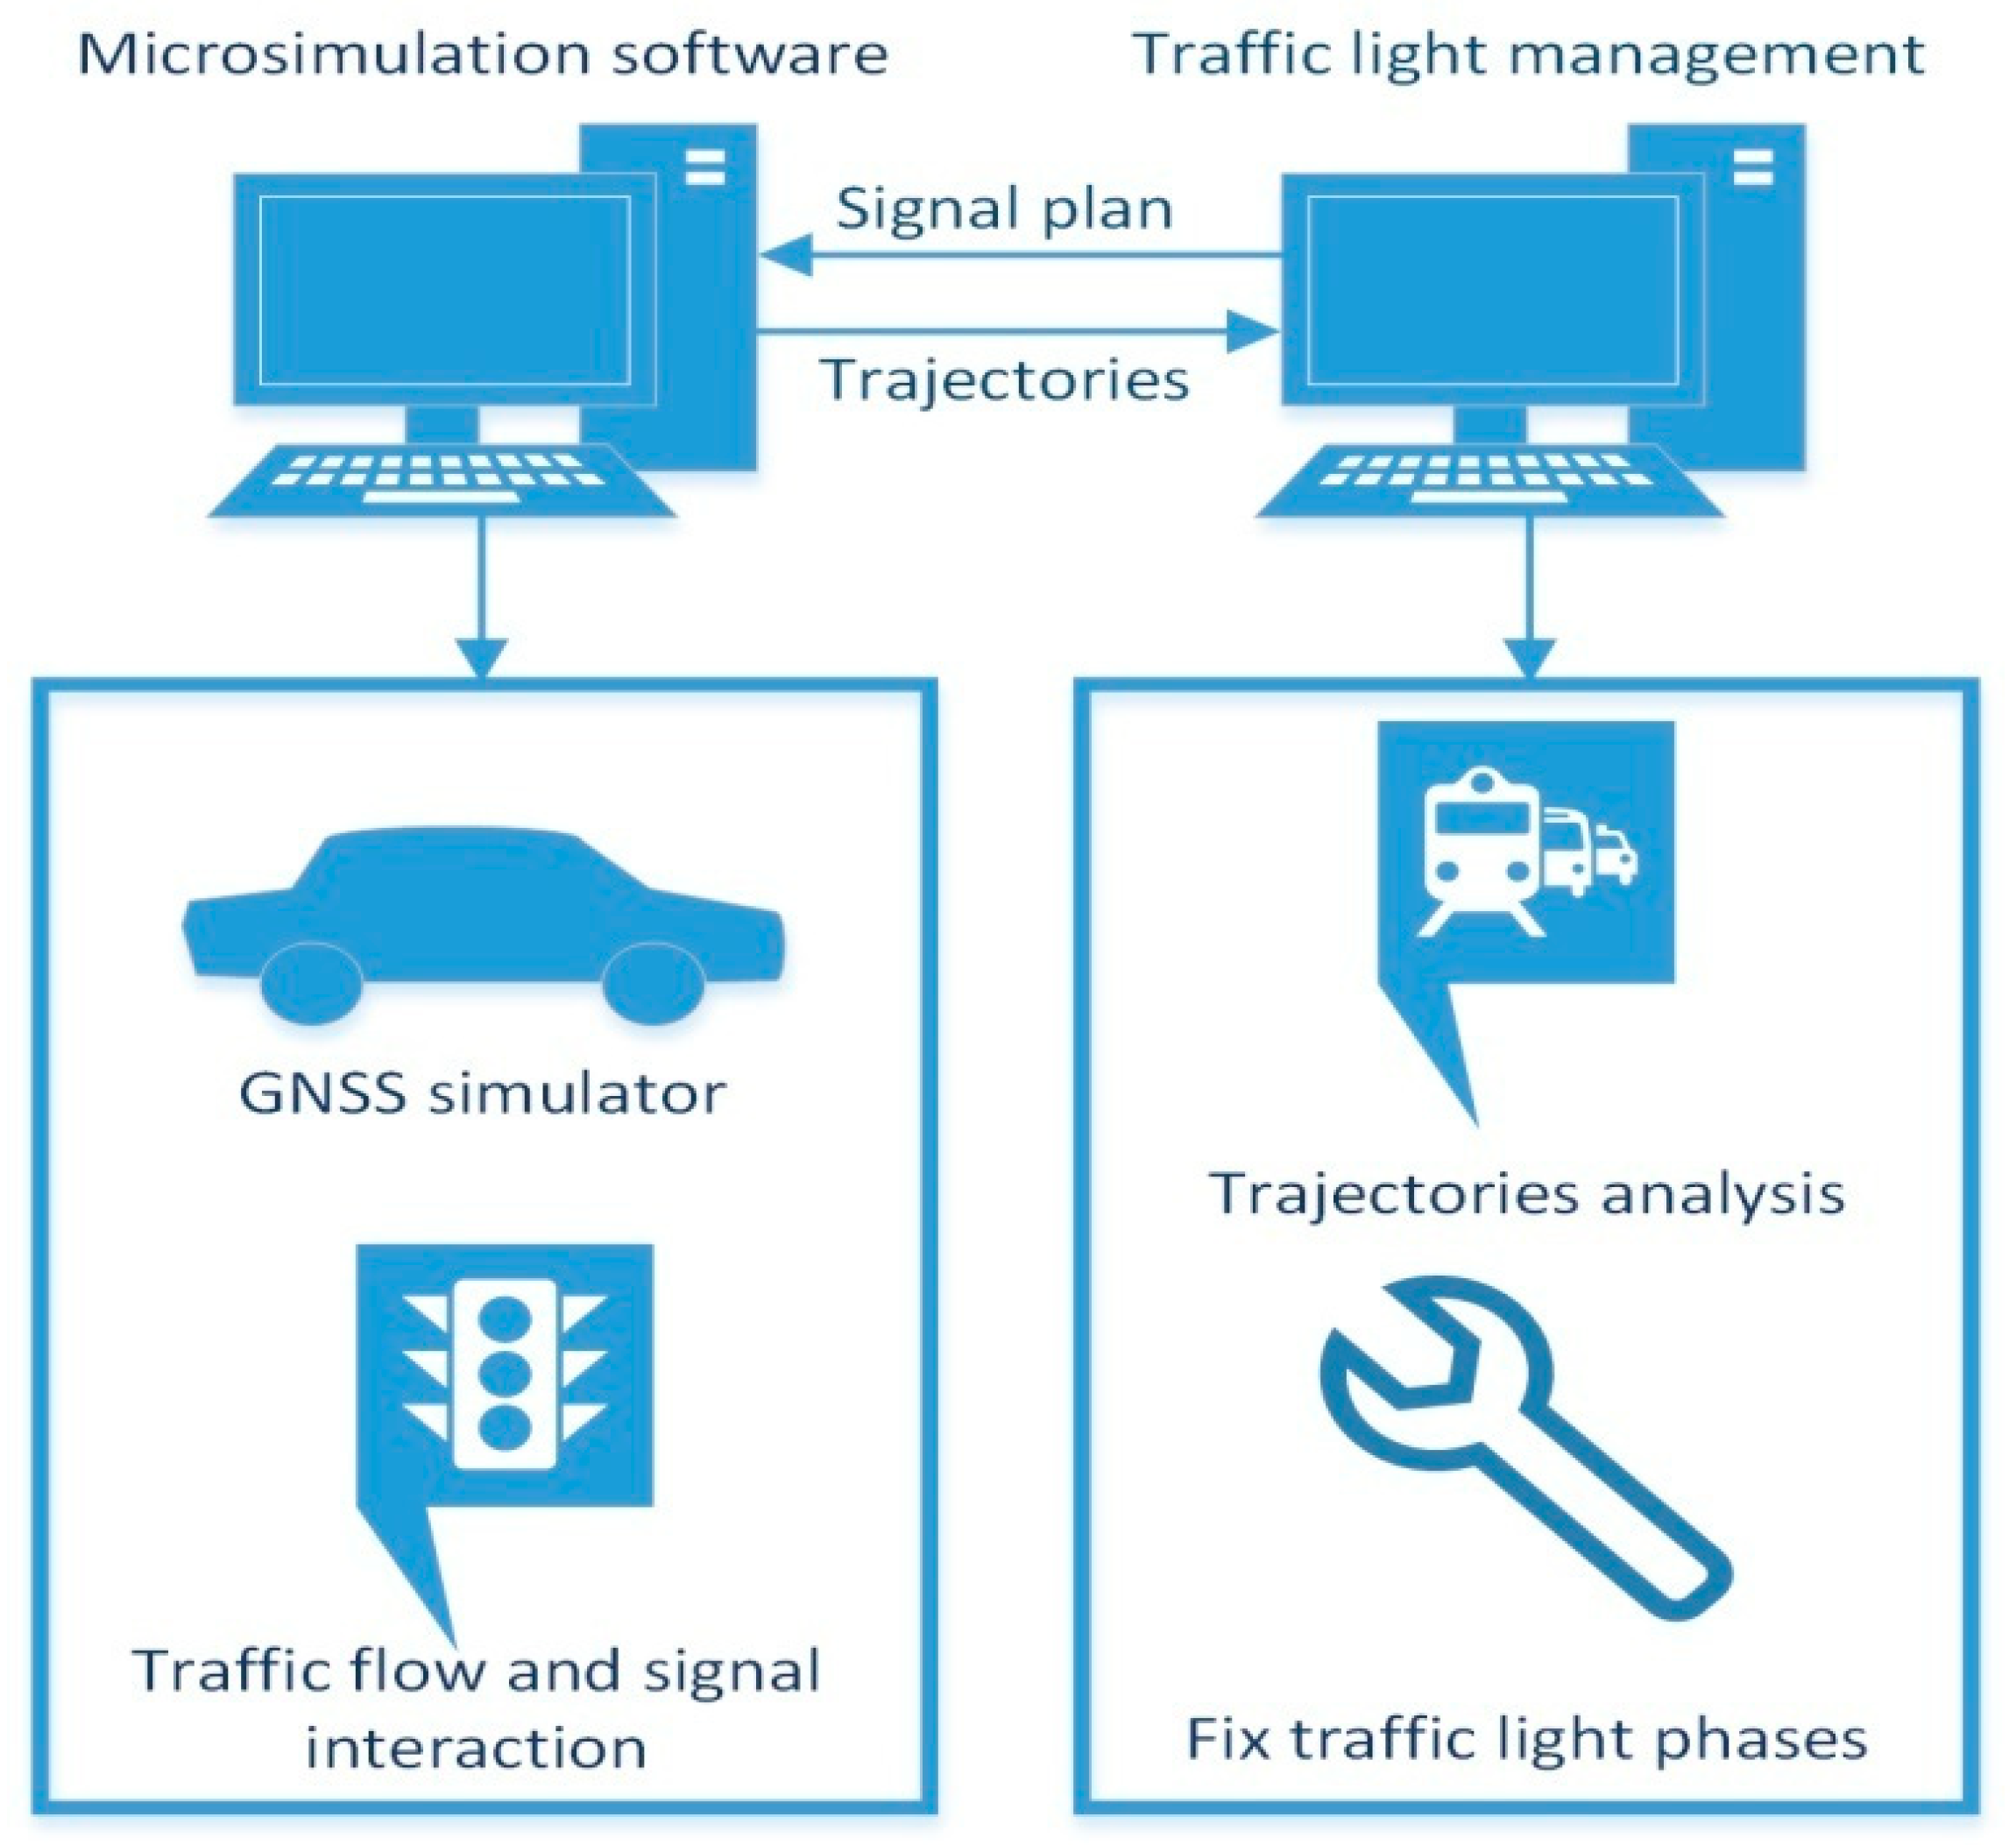
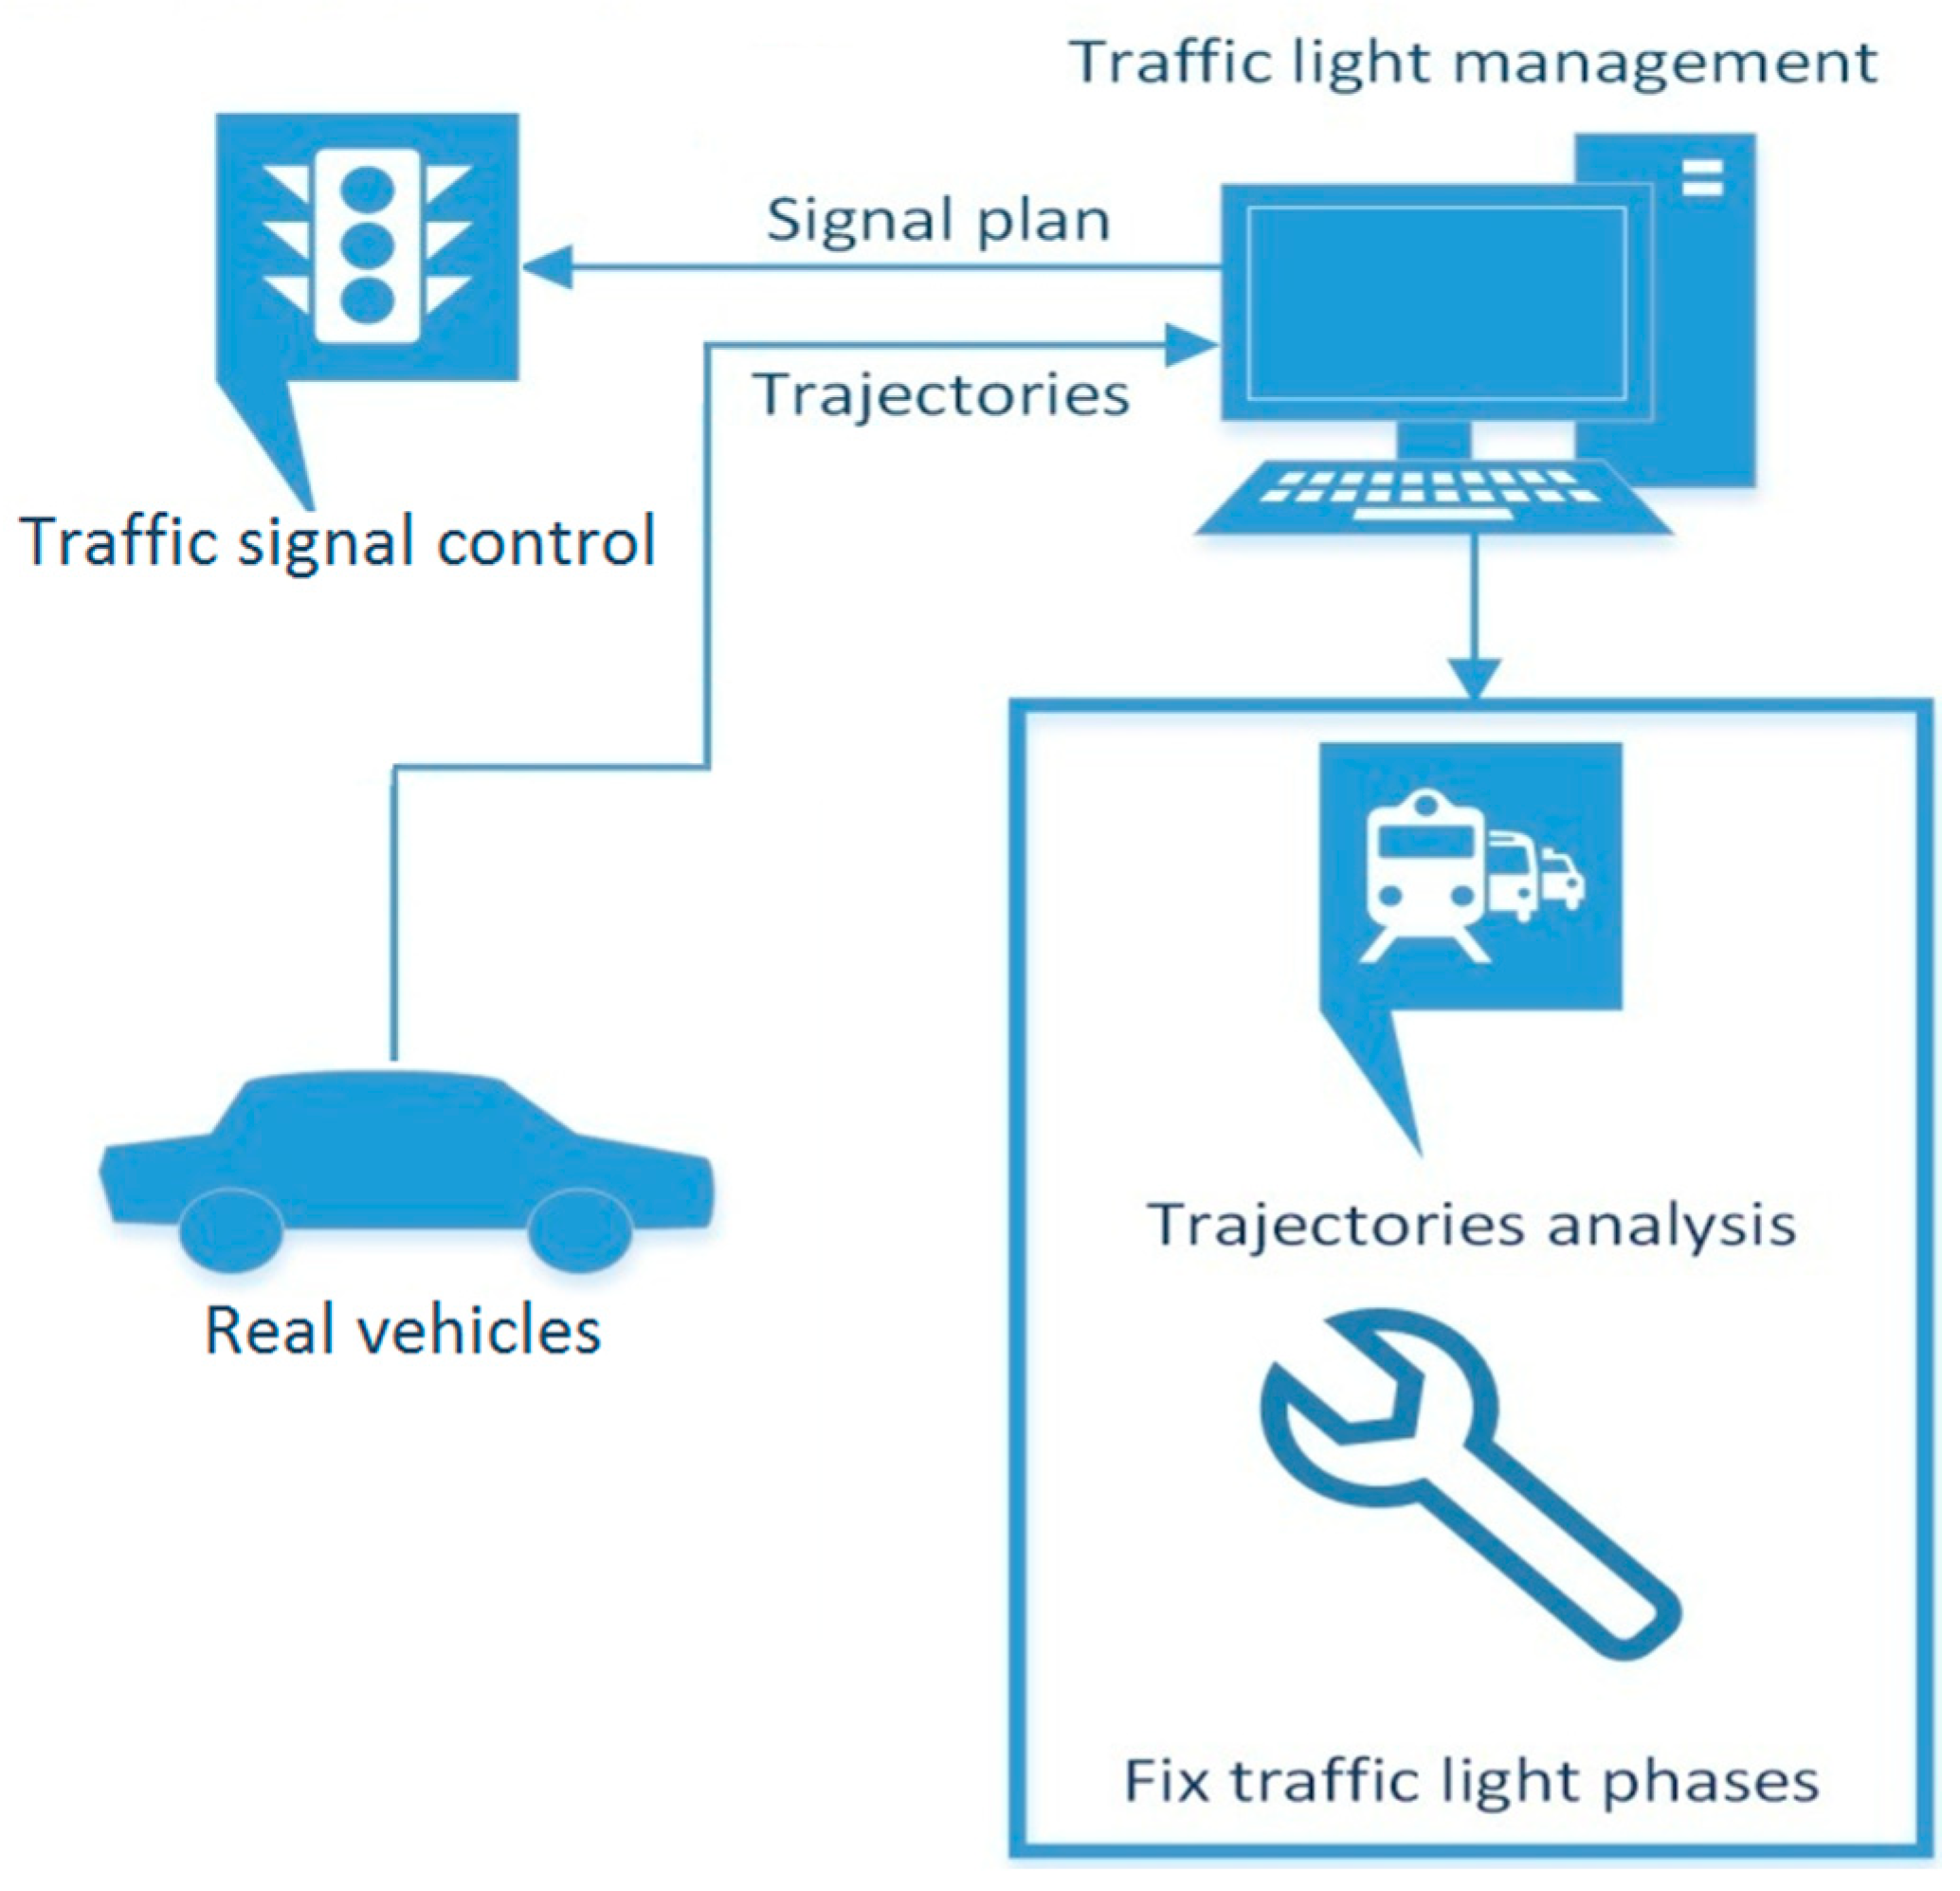
2.2. Development of a Simulation Platform and a Dedicated ITS Laboratory

A complete simulation platform had to be developed to test the system offline. The simulation platform allowed testing algorithms and understanding the behavior of the proposed system in a simulated reality.
All previous studies (cited in the introduction) on adaptive traffic signals based on FCD have been developed only in simulation without having in mind a real deployment in the field. Moving from simulation to a real implementation in the field requires including, in the simulation platform, all the details that are often not considered in academic works.
The main novelty introduced in our simulation platform is the module that simulates GNSS errors. Simulation of GNSS errors has been introduced in the paper [71] and at the moment there are no other academic works on this issue. This issue and other details in simulation are very important when the objective is that of a final real implementation in the field. A control algorithm that could work in a simulation environment bringing perfect results could possibly fail in a real implementation as shown in the following pages.
To test our system we had previously to implement and develop specifically our dedicated microsimulation model TRITONE [72,73,74,75], since other traffic microsimulation packages do not have the possibility of easily implementing FCDATS control algorithms and there is no simulation package where the GNSS error is simulated (a possibility for the researcher who wants to replicate our results without using TRITONE is that of using SUMO [76], which is open source, adding necessary modules as described in the following).
The microsimulation TRITONE was the core of our simulation platform and one of the two modules of our ITS laboratory. The ITS laboratory was designed with two physically separated computers (having in mind the final implementation in the field):
  • a first computer that was host for the TRITONE package combined with the GNSS error simulator. These two softwares together created a virtual reality environment based on microsimulation;
  • a second computer that was designed to be the central signal control server which was designed to regulate traffic signals from vehicles trajectories. The central server was structured so that it would work, in real time, both in simulation and connected with real traffic signals.
The whole laboratory structure is depicted in Figure 2, more details on the microsimulation software TRITONE can be found in the above-cited works.
The GNSS error simulator module is based on the results of experimental surveys on the field with GPS receivers on common smartphones [71]. GNSS device error (GPS) was found to be correlated to different causes but the most important was the occlusion of the sky caused by buildings. For this reason, we differentiated three different scenarios:
  • Scenario type A, where the satellite localization is almost perfect as the sky is almost completely clear.
  • Scenario type B, where moderate urbanization can create sight disturbances that can partially reduce satellite signals (buildings on only one side of the street).
  • Scenario type C, where urbanization creates disturbances with tall buildings at least 18 m on both sides of the street (urban canyon).
The experiment illustrated in this paper was conducted in a scenario which could be classified as being in all types of scenario: A, B and C since buildings were present (some higher than 18 m), but buildings were localized only on one side of the intersection. Taller buildings were localized at a distance of around 40 m from the central line of lanes; smaller buildings (5 m high) were localized at 10 m from the central line of lanes.
Following the procedure presented in [71] the error in the position of a vehicle is considered as the sum of two errors a distance error and an angle error. Distance errors are generated according to the Rayleigh distribution while the uniform distribution is used to generate angle errors. The first position on the network of every vehicle that is generated in the microsimulation is corrected adding these two errors:
The first distance error of every vehicle is generated according to the following distribution:
f ( x ) R a y l e i g h = x σ 2 e x 2 2 σ 2
where the variance is chosen among three different values corresponding to the three above indicated case scenarios.
The first angle error is generated according to a uniform distribution:
f ( x ) U n i f o r m = 1 n   , ( n = 2 π )
After the first error is generated when the vehicle appears in the network the procedure continues updating the distance error following a normal distribution with mean and standard deviation that are relative to one of the three scenarios and also relative to the error absolute value in the preceding time step (this is an empirical procedure that considers autocorrelation with little approximation). The experimental data showed, in fact, that autocorrelation translates into a different standard deviation of the error at time t+1 according to the absolute value of the error at time t.
A similar procedure is carried out for the angle simulation. In this case the autocorrelation is simply reproduced by using a normal distribution for each of the three scenarios. The angle error simulation completely follows theory with no approximation (this happens since the angle distribution is a uniform distribution).
With the indicated procedure distance and angle errors are added to the exact simulated position obtained from the simulation model. In the laboratory the trajectories that are generated in this way are transferred with internet protocol from the simulation computer to the traffic light (signal) management computer server. The server elaborates again trajectories with a map-matching algorithm. Elaborated position data are then fed into the adaptive traffic signal algorithm (FCDATS).
The traffic signal management server was used both in the laboratory testing phase and in the final experiment. The flow of information for the final experiment is depicted in Figure 3, where, in this case, the information is exchanged between the traffic signal management server and the external reality.

2.3. Evaluation and Development of Control Algorithms

With the above described ITS laboratory some algorithms for FCDATS were tested on test networks. It was important to test algorithms in simulation since the control system can work on trajectories of “connected” vehicles and most of the literature on adaptive traffic signals is based on traditional traffic flow measures. Algorithms were tested on test networks to establish the advantages of the proposed system and the effects of different percentages of “connected” vehicles.
Mainly two control algorithms have been simulated in the ITS laboratory before testing them in the on-field experiment against a static optimized cycle:
  • a greedy algorithm [66];
  • an algorithm based on Nash bargaining equilibrium [63].

2.3.1. Greedy Algorithm

The first algorithm that was tested was a greedy algorithm that counts the number of “connected” vehicles that are present on every approach of the intersection and allocates green giving priority to the approach loaded with the greater number of vehicles. The position of the last “connected” vehicle is used to calculate the queue length and enough green time is assigned to let the queue dissipate considering also the other vehicles that may have arrived since the moment this last “connected” vehicle stopped. The estimation procedure is similar to that applied in [77].
In other words, in the proposed greedy algorithm connected vehicles are treated like priority vehicles. More details on the implementation of this greedy algorithm are in [66].

2.3.2. An Algorithm Based on Nash Bargaining Equilibrium

The Nash bargaining algorithm applied to traffic signal regulation was first developed in [78,79].
The bargaining problem has been investigated in game theory where there is some resource that is generated by reaching an agreement between different parties. The solution to the bargaining problem is how this resource must be divided among the agreeing parts. The bargaining game theory was introduced in regulating traffic signals on the assumption that the signal phases are like different players that need to find an agreement on how to split the total green time of the intersection. Phases will end up finding dynamical agreements which tends to an equilibrium point that is consistent with the Nash bargaining equilibrium solution.
The Nash bargaining equilibrium solution in traffic signal regulation represents a tendency for the system towards the agreement that rational players should reach. In general, it could be said that the Nash equilibrium approach is an axiomatic approach which simplifies the problem since there is no need to evaluate in detail the process of the game. The best agreement is the equilibrium point and all actions should be devoted to move the system toward that point. More details on the implementation of this algorithm can be found in [63].

2.3.3. Fallback on Fixed Cycle, Green Requirements

With both the greedy algorithm and the Nash bargaining algorithm the control strategy goes back to the fixed cycle when there is no “connected” vehicle” at the intersection. Fallback on a fixed cycle is also programmed in the local signal controller in case of communication malfunctions. In a real commercial application, it is desirable that the local signal controller can perform a more sophisticated check on the signal commands coming from the server: in case an error is detected the local signal controller will take charge over the central server. In our experiment, we imposed only the minimum and maximum requirements for the green time of each phase. The minimum green time was 4 s and the maximum green time was established at 180 s.

2.3.4. Obtained Results

From simulations the following results were obtained:
  • The overall performance in terms of total average travel time is good since average travel time is always decreasing with the increase in the percentage of “connected” vehicles.
  • The overall performance in terms of total average travel time can go from a mere 5% reduction (when few vehicles are connected) to over 70% reduction (with 100% of connected vehicles and with a badly regulated intersection). This depends on different conditions of the intersection considered, it must be noted that the reduction in travel times was calculated in our simulations on real urban intersections with real measured flows and signal cycles. Moreover, we did not confront our system with a traditional real time adaptive traffic signal system.
  • With a low percentage of “connected” vehicles (under 30%) these “connected” vehicles would take advantage of the system and would obtain priority over other drivers who would be slightly delayed at the traffic signals. It is important to note that in all our simulations the total travel time reduction for “connected” vehicles was always greater than the small delay that traditional vehicles have to suffer;
  • With a percentage of over 30% of “connected” vehicles the system works very efficiently and offers convenient cycle lengths and phase times for all users;
  • The system can potentially reduce overall traffic congestion and pollution emissions;
  • The system works also for multiple intersections and can automatically coordinate green times at different intersections [64].
These results demonstrated that according to simulations, the reduction in overall travel time justifies the implementation of the proposed system by city administrations that would be able to regulate traffic signals using inexpensive Floating Car Data (FCD).

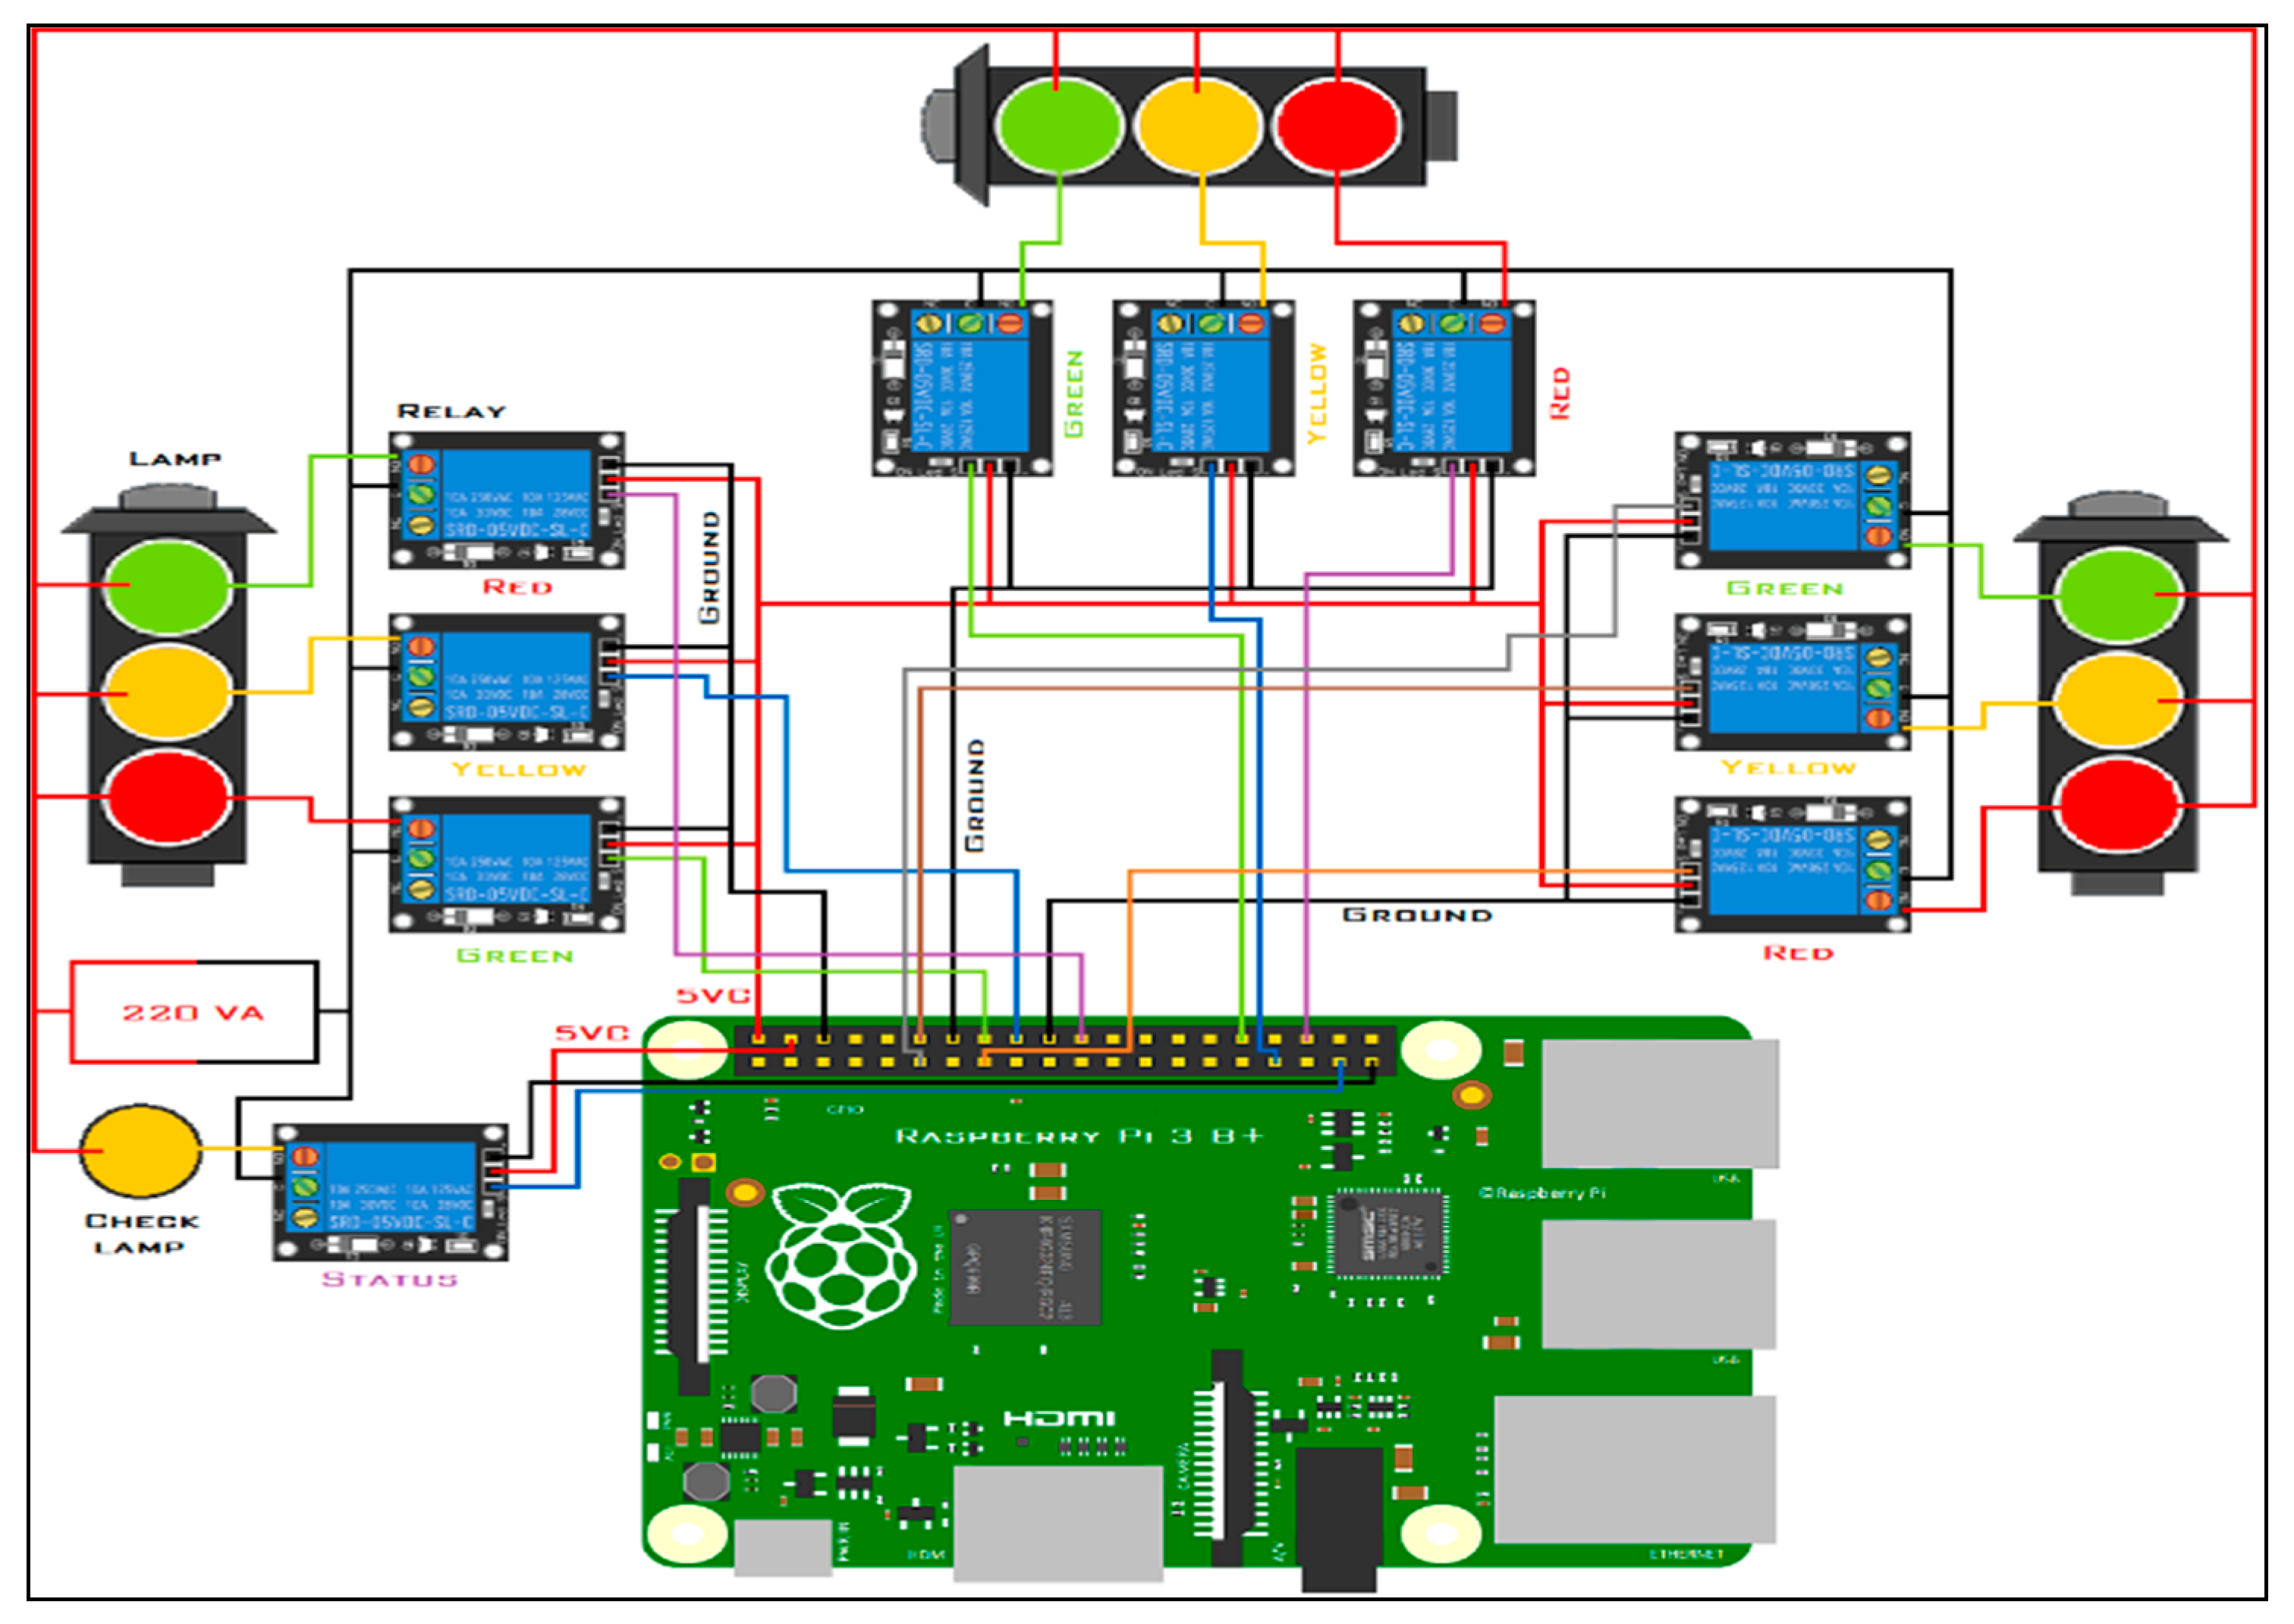
2.4. Development of a Connected Traffic Signal

The traffic signal used for our experiment was directly connected to the internet with an Ethernet cable and was designed with two parts: the traffic lights and the local electronic controller.
The traffic lights in our prototype system have been mounted on a dedicated pole structure and completed using a single strip multicolor LED (for the three colors display in the same lamp). Each one of the three lamps (one for each of the three approaches of the intersection) was controlled by three relays actuated by the local electronic controller. The local electronic controller was composed of a Raspberry Pi3B+ card equipped with its own ethernet connection port and powered by a 5 V-3 A power supply. This local controller was connected to 9 controlled 5 V relays which activate the individual traffic light lamps (Figure 4).
The local controller device is not equipped with a monitor, but in the start-up phase, after the system is operational, a tenth relay is used to activate an operational light. From that moment, the device acts as a web server that is ready to receive the commands of the central system through a binary string. The web server is based on an open source architecture running apache and a PHP script. This web server commands the lights accordingly to this binary string sent by the traffic signal control management server.
The relays to be activated are represented in this string by a simple bit which consequently serves to actuate the colors to be assigned to the lanterns. In detail, the Raspberry with its Rasbian operating system and Apache web server runs a series of PHP scripts that are able to recognize the instructions of the central server and decide which General Purpose Input/Output (GPIO) to activate or deactivate.
The exchange of information between the local controller and the server takes place only every time a phase is changed, or an extension of the green is established, therefore with variable frequency.
The local controller receives control requests from the central server through internet connection and directly activates the relays which switch on the right colors of three traffic lights.

2.5. Development of a Specific Smartphone Application

A specific smartphone application was developed to connect the vehicles with the traffic signal control server. The “connected” vehicles in this way can provide the system with their own position through this dedicated smartphone application, capable of retrieving information from the GNSS chip and transferring it, via a standard wireless phone internet connection and a GET/POST protocol, to the traffic central control system.
The application developed for the smartphones was written for the Google Android system. Constantly, at 1Hz frequency, it requires satellite location information, which is returned in WGS84 format to be sent to the central system as a string. The exchange of information between smartphones and the central system also occurs at a frequency of 1 Hz. The information that is transferred is the latitude, longitude and speed.

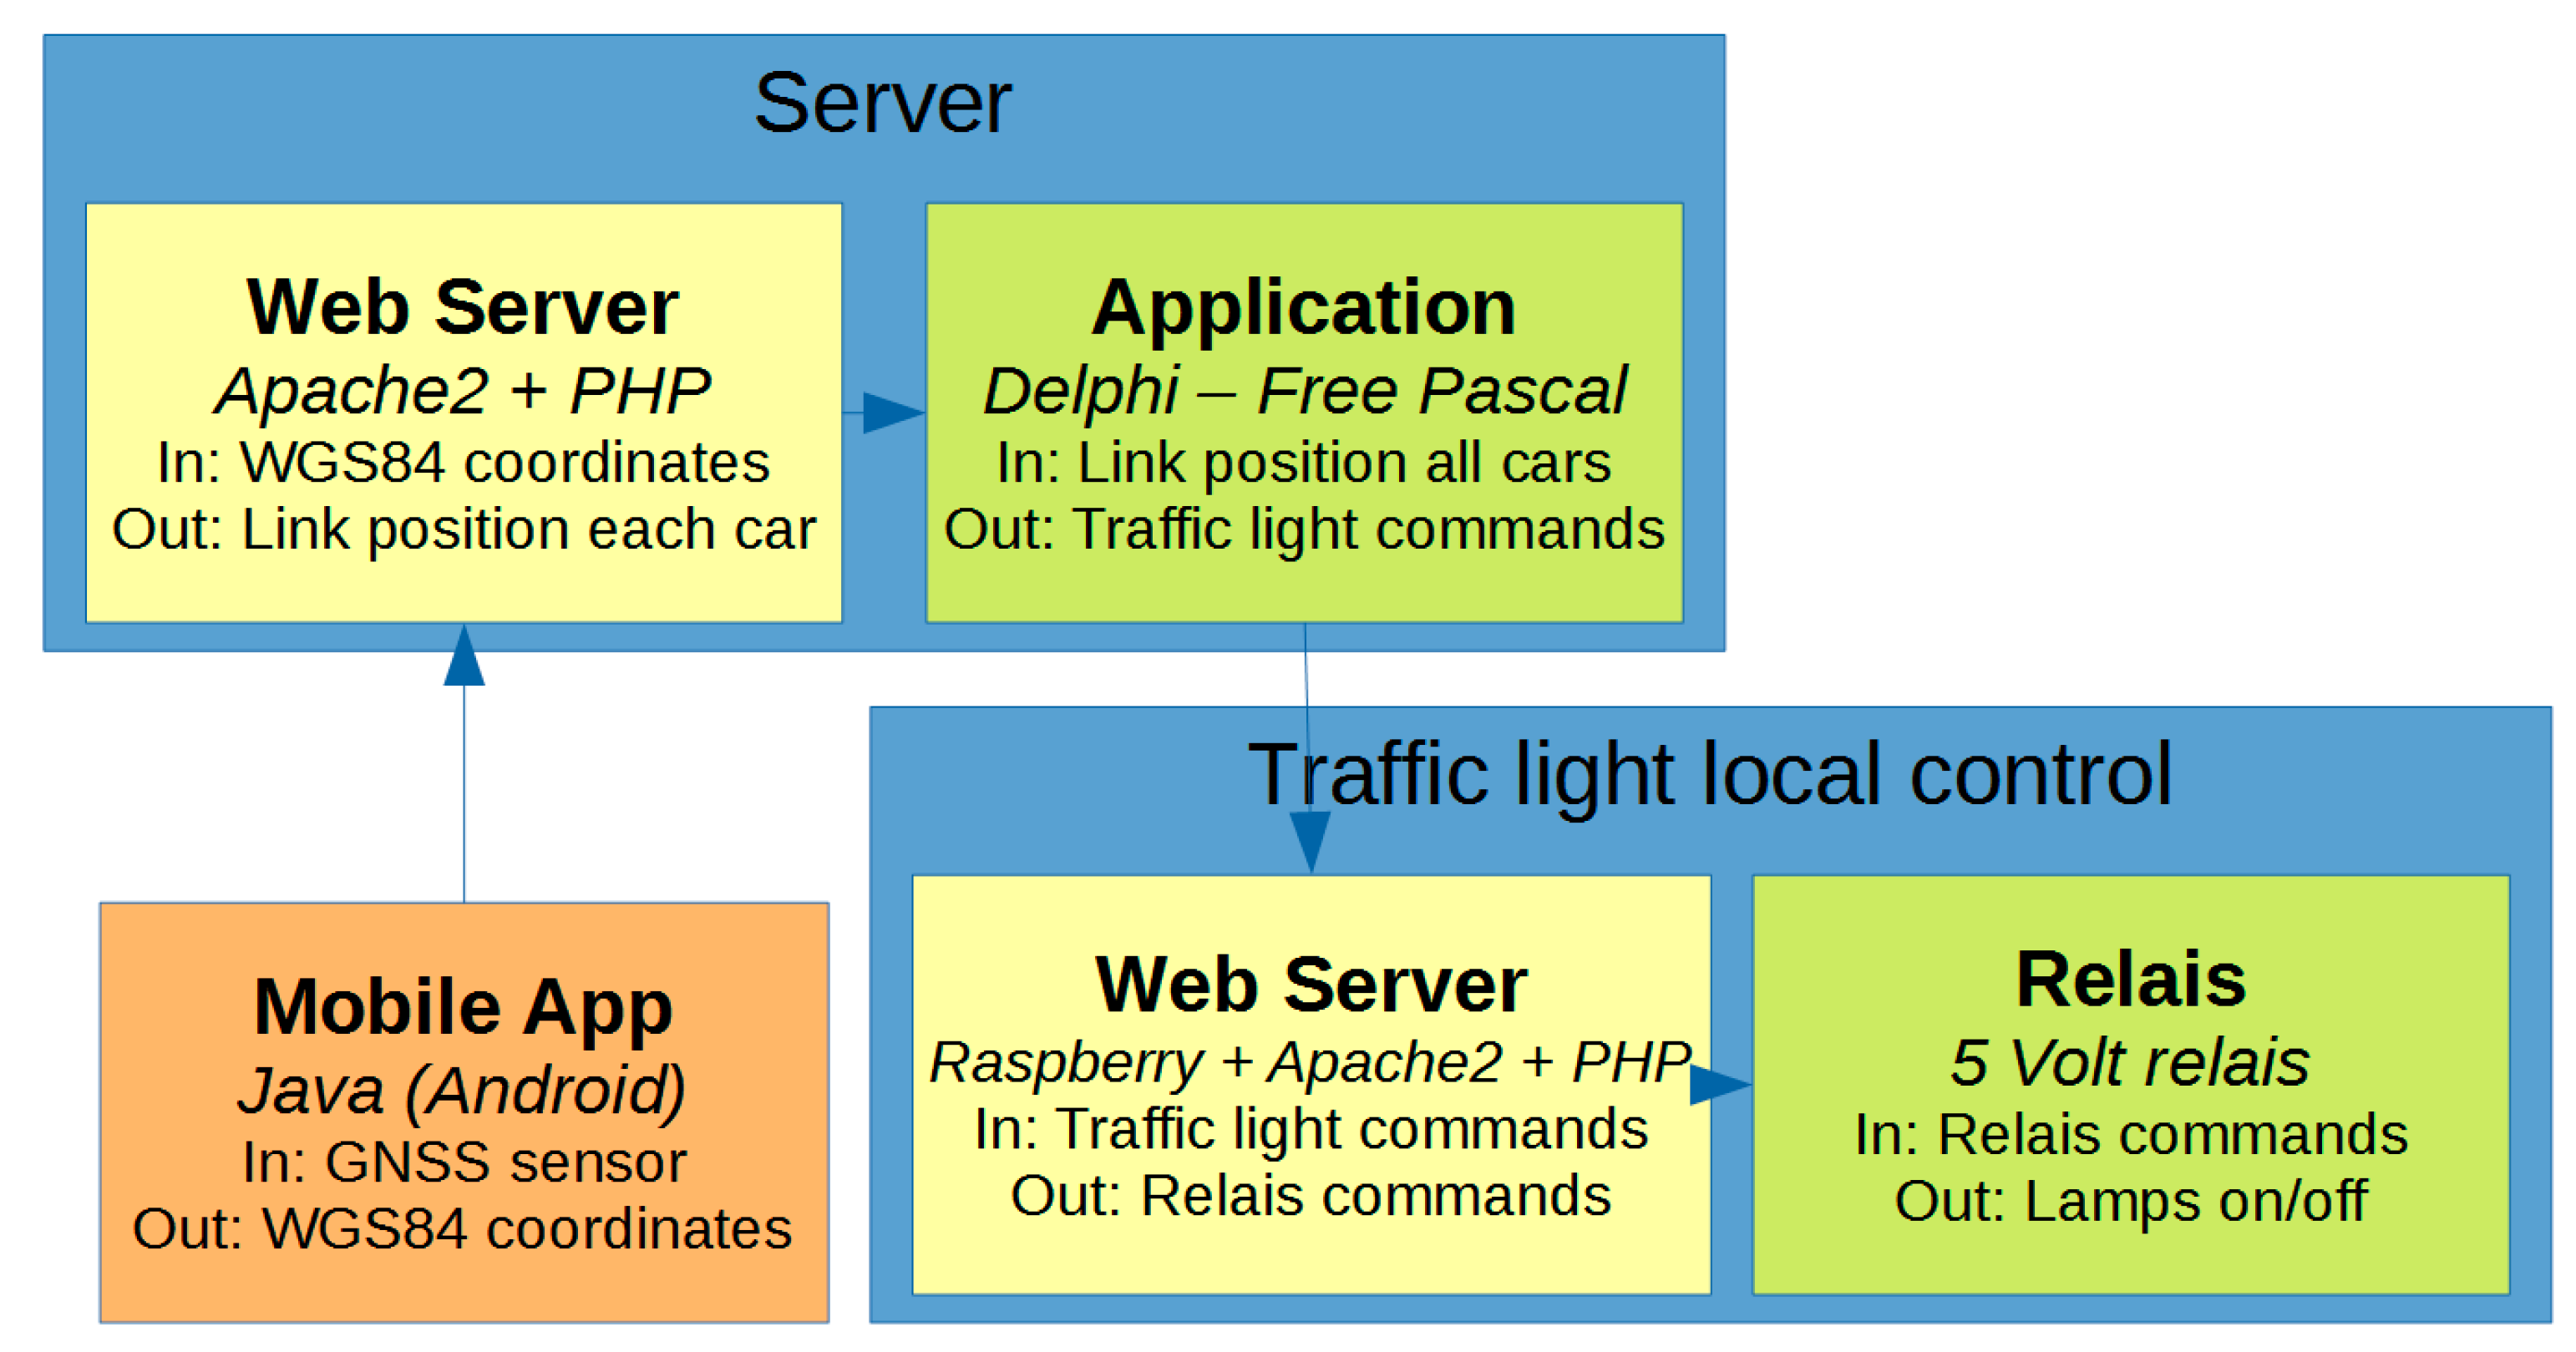
2.6. Development of a Specific Traffic Signal Control Server

The central control system was implemented on a Dell PowerEdge 2650 server connected on a 1000 GHz optical fiber. The hardware of this device was equipped with a 2.8 GHz Intel® Xeon ™ processor with 32 bit technology, 512 MB ECC DDR SDRAM and 5 HDD 146 GB. On the software side, the system is based on the Microsoft Windows Server 2008 system, MySQL database and web server scripts compiled using Delphi language. The server is programmed to receive the positions of the various smartphones and send control requests to the local traffic signal control unit.
The traffic central control system stores the received positions of the vehicles on the network, recreating the trajectories of approach to the intersection with a map-matching algorithm. These trajectories are obtained with the positions of the vehicle in which the speed was positive (discarding the points of vehicles that are stopped in a queue). This is done in order to establish optimally the direction of origin of the vehicles. The system then uses this data to estimate the number of vehicles queuing in the various maneuvers and generates the new traffic signal plan using one of the two dedicated algorithms described above. All this procedure is repeated every second, deciding whether to prolong the green of the active phase or to grant the green to another phase. Once a change of phase is decided by the traffic control system the information is sent via internet to the local management system of the traffic signal system using the GET/POST protocol in the form of a 9-bit binary string. Each new phase is introduced following the sequence green -> yellow -> all red -> red for the previous active phase, the sequence red-> all red > green for the new active phase and the sequence red-> all red -> red phase for the phases which were not active before and after the phase change. The light changes are established so as to guarantee the correct and safe passage from one phase to another.

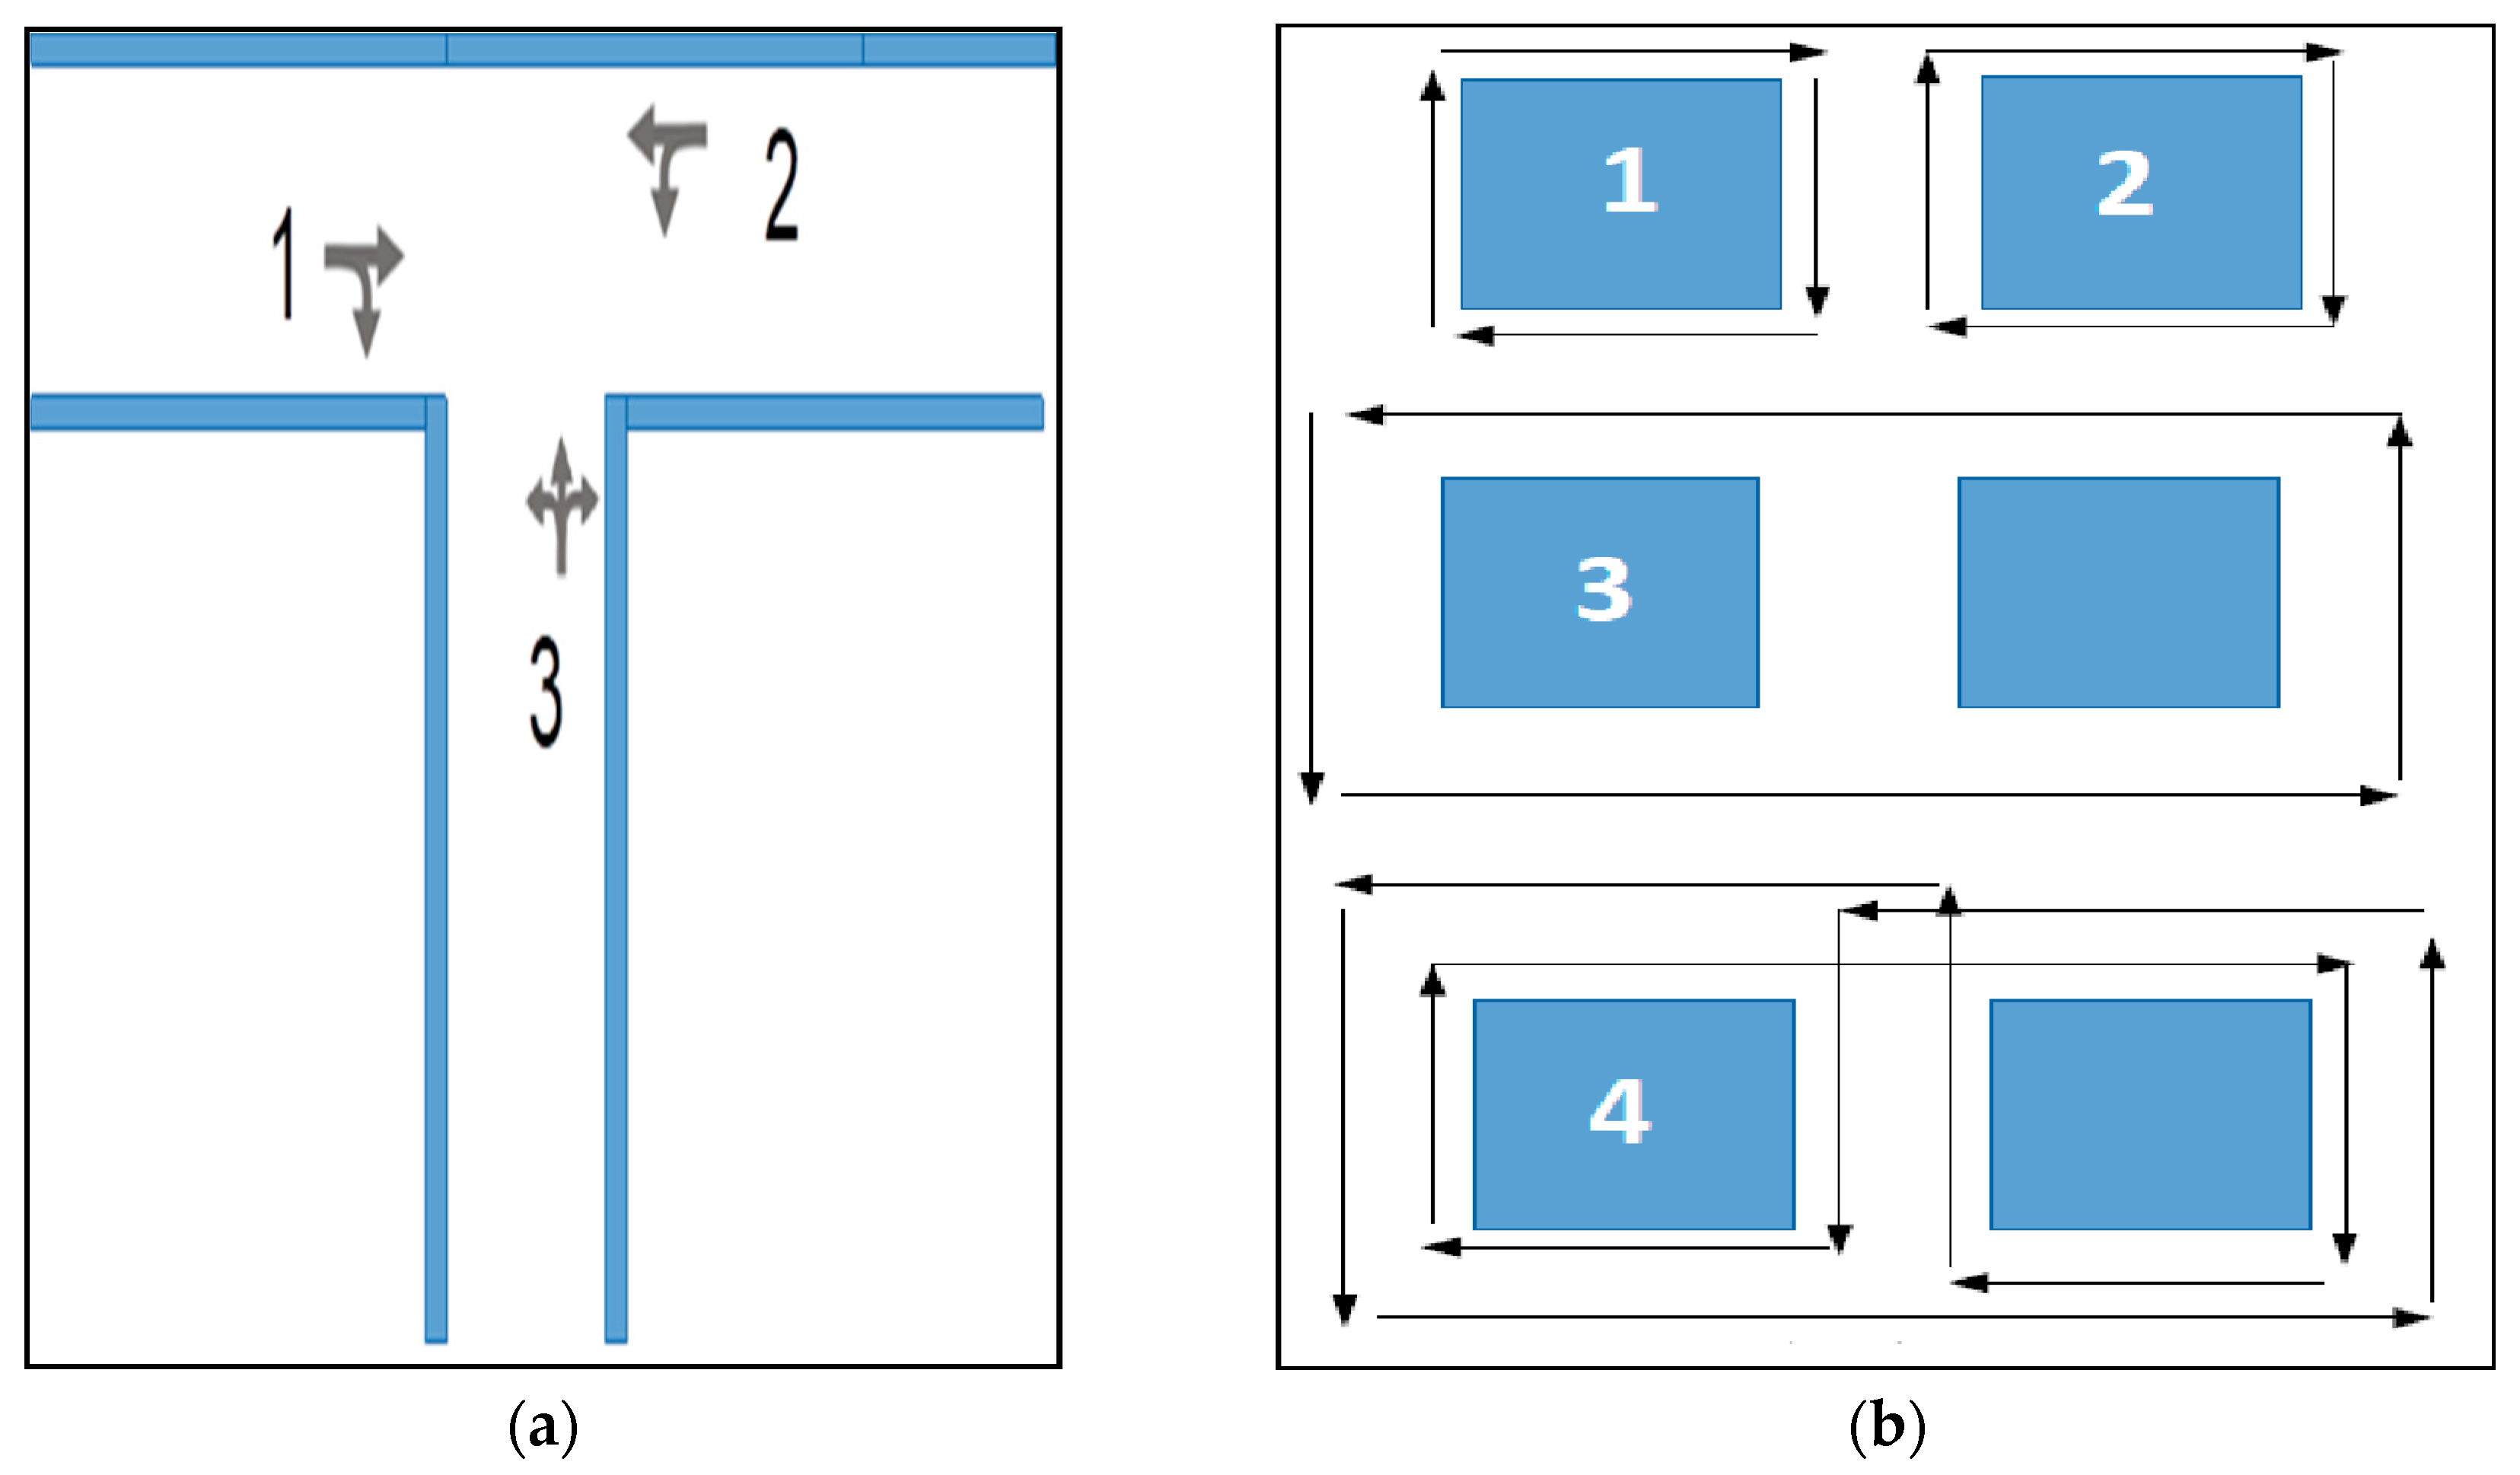
2.7. Planning and Mapping of the Experimental Site

A dedicated experimental site, which is depicted in Figure 5, was set up in a parking lot area of the University of Calabria.
The intersection is a three-legs intersection with single lanes approaches so that the three traffic lights control all maneuvers of an approach at the same time for a single shared lane. The traffic signal phases are the three depicted in Figure 6a. Drivers were instructed to repeat the same path to avoid the formation of cluster of vehicles moving along the same path. It was possible to identify 9 different paths among which 5 were assigned to a total number of 5 drivers. Four of these different paths are presented in Figure 6b.
The same experimental setting could be used for more complicated intersections with a different lane structure. Since the main objective of this first implementation is mostly the demonstration of feasibility of such a prototype system it was decided to keep the intersection lay out as simple as possible.
Before starting with the experiment involving drivers in the intersection, the informatics platform was tested to avoid the DeadLock problem. Moreover, some test runs were completed with “connected” vehicles to test the GNSS signal strength and the ability of the traffic signal control server to load the trajectories sent by the mobile phone application.

2.8. The Whole Assembled System

The whole prototypal system is depicted in Figure 7. The connections between the traffic signal management server and the local controller are cable-based while the connections directed to the central server from the mobile applications are through wireless internet data 3G phone lines (blue lines).
Different coded software in different languages has been applied on the different instances of hardware as described in the following Figure 8 where the data flow is clearly depicted.

3. Results

In this section the experiment that was thoroughly prepared and tested in the simulation laboratory is presented. Before the experiment was carried out there were some doubts and the possible causes of failure in the experiment were identified:
  • the algorithms would be unable to work with real trajectories since the localization errors could be different from the laboratory simulated errors;
  • the server would fail to receive all the trajectories in real time;
  • the traffic signal controller would fail to activate the phases according to the signal control server.
  • the signal control server would fail.
  • the mobile phone applications (which were uploaded on drivers’ smartphones just before the experiment) would suffer from compatibility issues or not work properly.
  • the driver would not be able to follow the given paths.
The experiment had, in fact, the following failures: the mobile phone applications showed compatibility issue when coupled with driver’s smartphones and in the end only 5 vehicles could participate in the experiment (at the experiment site there were more vehicles than working smartphones); one of the three test runs we conducted (when the Nash bargaining equilibrium algorithm was used) failed, possibly since the signal control server did not work properly.
Apart from these two failures, the experiment was a complete success. Results were beyond expectations in terms of performance of the system as shown in the following.
The experiment was conducted and three test runs of the system were completed: with a fixed traffic light plan, with a greedy algorithm and with the Nash bargaining based algorithm. Unfortunately, as indicated above, the Nash bargaining-based algorithm did not work at the experiment site, we have not surely identified the specific cause of failure which could be related to the implementation of the specific algorithm in the control server or with the failure of one of the components of the system (software, hardware or communication link). For this reason, the following results are relative only to the static cycle and the adaptive greedy algorithm case.
In this work, we have included a brief description of the Nash bargaining equilibrium-based algorithm since the fact that it worked perfectly in the simulation laboratory and it did not work in the real experiment might be of interest for the reader and reveals the concept that some algorithms that have to be implemented in a real FCDATS road setting might need some special adjustment before they work as expected from simulation.
All the three experimented scenarios were also simulated in the described laboratory applying the Gazis-Herman (GH) car-following model in the simulation software Tritone. The main parameters of the simulations and of the car-following models were established by applying the GEH function.
The performance measures that were used to make a confrontation between different scenarios were: total outflow, average travel time and average speed.
It must be noted that the vehicles circulated in the experimental intersection in such a way that every driver had an assigned circular path to repeat again and again. In this way the formation of stable platoons of vehicles was avoided. As a result of this methodology the traffic flow that arrived at the intersection was a function of the chosen traffic signal regulation. A badly regulated traffic signal would, in fact, increase the waiting times and consequently reduce the total traffic flow through the intersection. For this reason, the total outflow can be seen as a good measure of performance.
Two drones were used during all the experiment to document all the scene; the drones were suspended high above the intersection and in a fixed position, in this way two videos were taken and allowed the measure of performance for the traffic system to be extracted (see video at Supplementary Materials).
According to simulations, the results in terms of system performances were expected to be as depicted in the following Table 1.
The simulation showed a percentage increase of 44% for the total outflow of the intersection in veh/h and a percentage reduction of around 55% for the average travel time.
As anticipated, the experiment went beyond expectations as depicted in the following Table 2. The increase in total outflow was 116% instead of 44% obtained in simulation, the reduction in terms of average travel time was around 73% instead of around 55% from the simulated reality. The increase in average speed was up to 271% instead of the simulated 120%.
In terms of performance the experiment was a success and the use of 100% “connected” vehicles has guaranteed that for every approach at the intersection there was an increase of performances.
Total measures of performances are also shown in the following Figure 9 and Figure 10.
The results for the single links of the networks corresponding to the three different approaches (indicated in Figure 6a) are presented in the following Table 3 and Table 4.
Data of the single maneuvers shows how from the simulation a slightly better performance of the intersection with higher outflows and speeds and lower travel times was expected. Results from simulations are quite similar, but different, from real experimental values.
More experimental runs with a different level of congestion would be needed to assess the capacity of microsimulation statistically to foresee the performance of control algorithms.

4. Discussion

This paper demonstrates the feasibility of floating car data adaptive traffic signal (FCDATS) with current technologies such as common smartphones connected on 3G wireless mobile phone networks. All the research in this area is based on simulation and this work is the first attempt to experiment existing technologies for real-time adaptive regulation of traffic signals with “connected” vehicles. In this paper, the benefit of using FCD in a cooperative system for adaptive traffic signal is proved with a real implementation with real “connected” vehicles.
As an example of previous works: the Colombo project [62] where “developed algorithms for traffic surveillance and traffic lights control” are evaluated, only in simulation, within the COLOMBO system with the aid of complex modules such as the micro-simulator SUMO and the vehicular emissions model PHEM.
This work was also based on simulation, though simulation was used not as a means to evaluate the proposed system but as a means to support the development of the system which reached its final stage of a real experimentation with real “connected” vehicles.
Sustainability of the traffic system is the final goal of the proposed system. This can be obtained by a reduction of fuel consumption and pollutants emissions connected with the enhancement of traffic signal performances and drivers’ comfort. The following results were obtained for the proposed system:
  • Especially with low traffic volumes, drivers who are driving through intersections regulated by FCD data will practically always receive the green light.
  • Combined results of previous works based on simulation and of the experiment of this work prove that FCD for adaptive traffic signal control not only can be very effective in reducing average travel time and pollution emissions but it is also absolutely feasible with current widespread technologies.
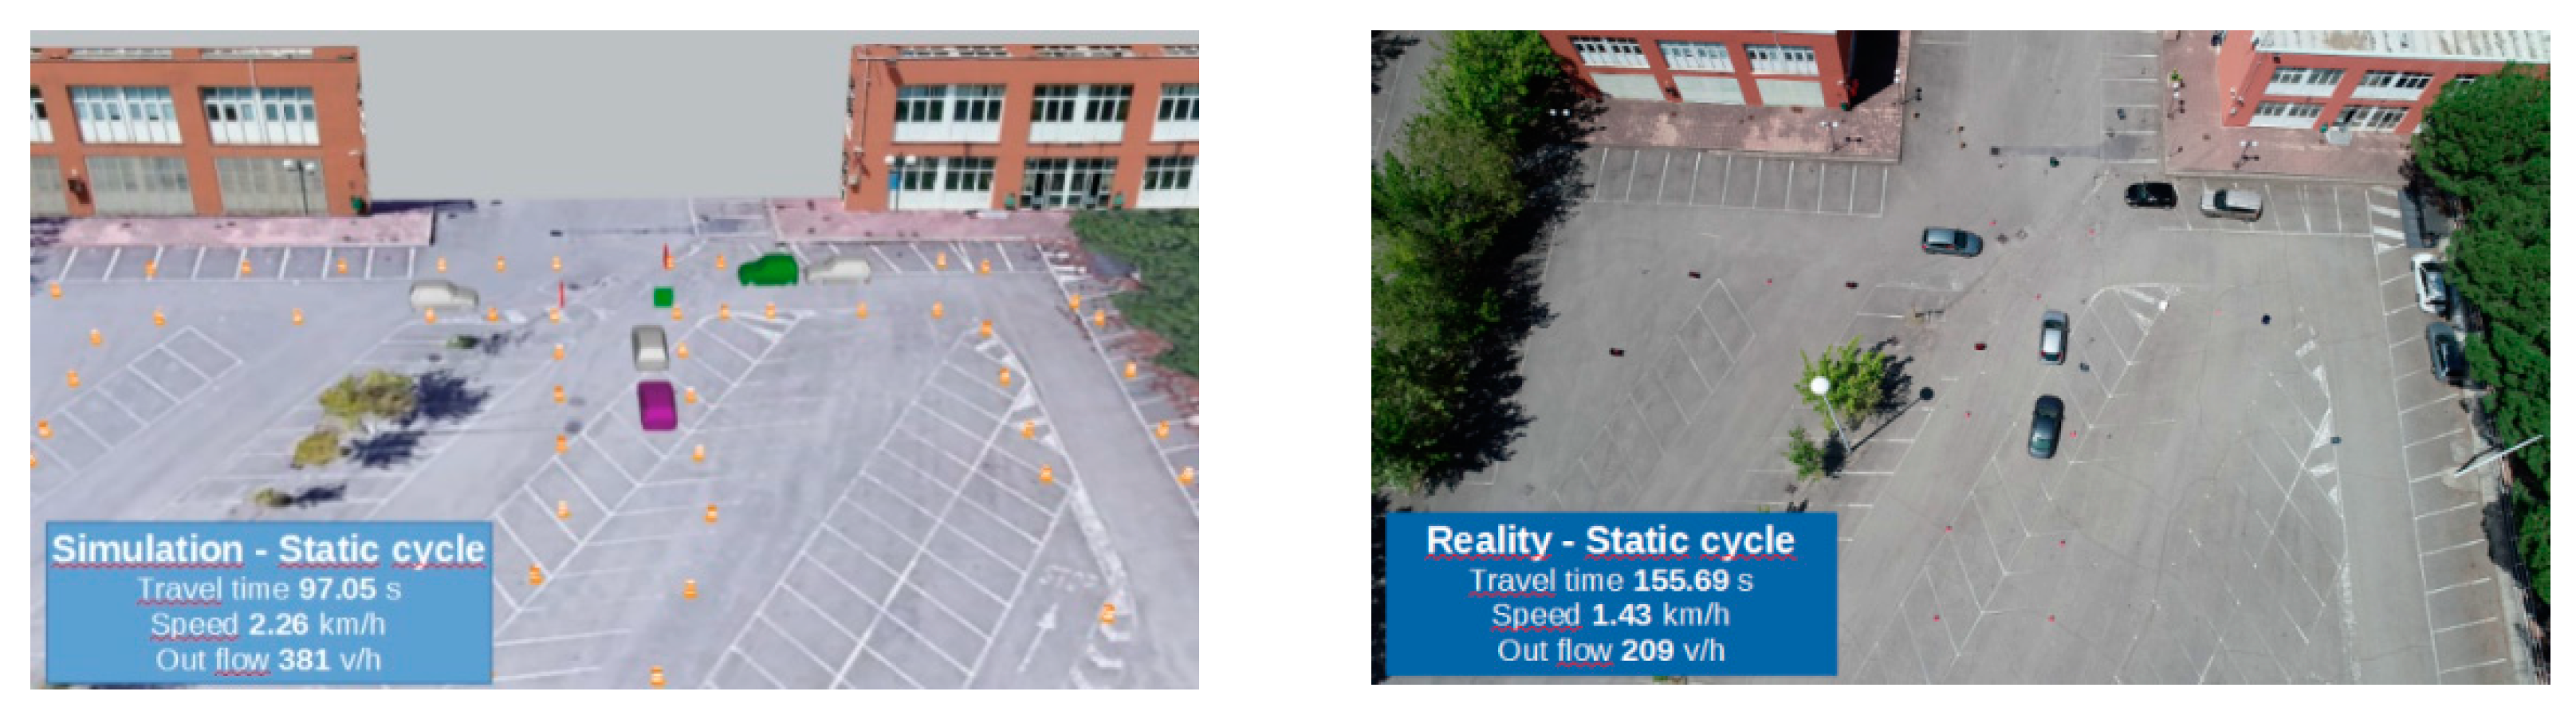
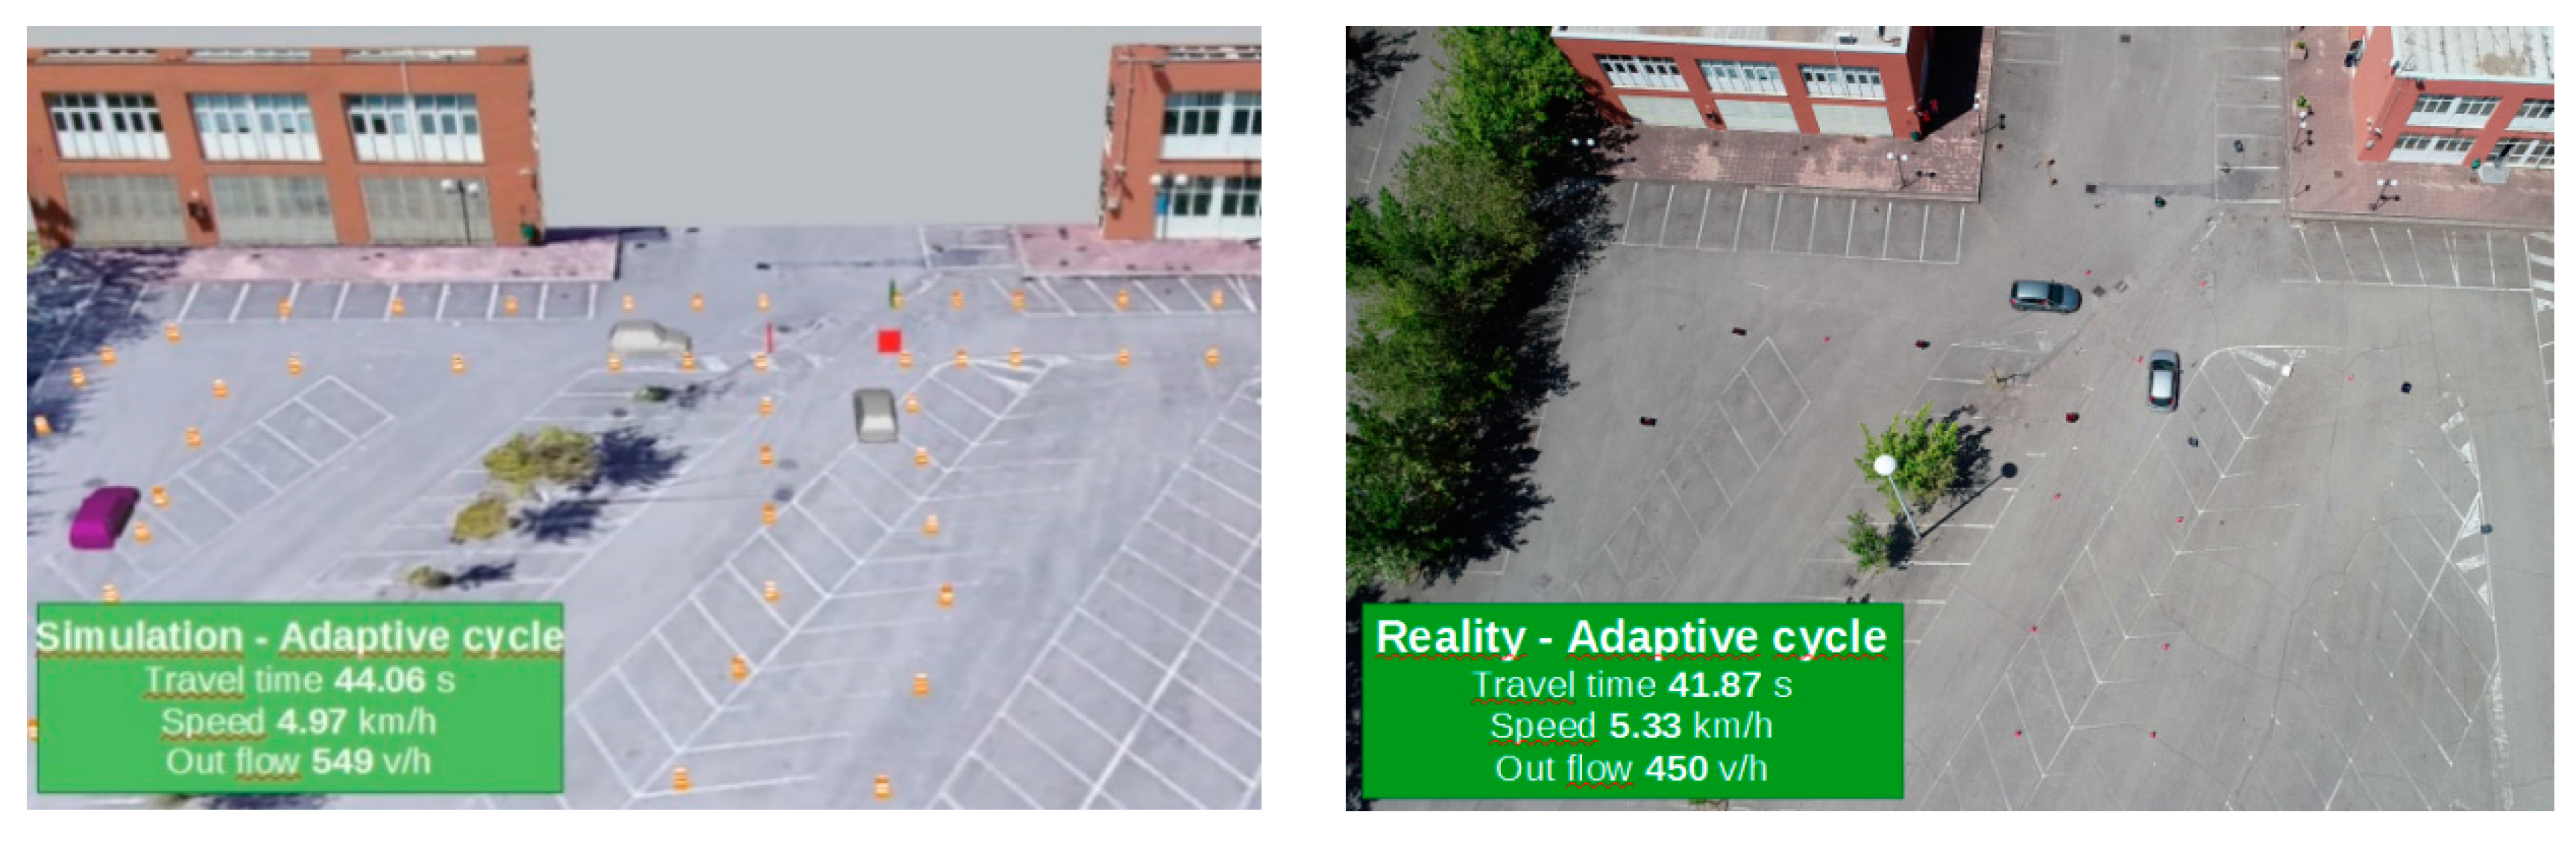
  • Another result of this work is that simulation as a tool to evaluate FCDATS control algorithms brings results which are very similar to the results obtained in the real on-field experiment. The result is only partial since a definitive proof would need experimenting different conditions in terms of traffic flows, percentage of connected vehicles and different intersection layouts. Once this result is completely achieved it will be possible to test new algorithms and control logics just in simulation (the use of simulation is obviously less resource consuming). Once a good simulation test-bed is established a deployment of the proposed system in real city intersections can be easily performed with a good confidence that the FCDATS tested system can help to regulate traffic signals better.
  • The experiment we performed involved the collaboration of more than 20 people at the experimental site involving: personnel occupied in the outline of the vehicle paths and intersection that was outlined in a big parking area, drivers, drone pilots and system operation management. This work was completed without specific funding and future development of this research is definitely possible in the direction of more experiments with different conditions.
  • Adaptive real-time control of traffic signals is currently performed with data coming from induction loop detectors. The information that is elaborated is based on traffic flow counts at some given locations. The use of FCD data allows using trajectories of vehicles in adaptive traffic signal control. This information is much richer since detailed data of speeds and positions of single vehicles can be used. In other words, the proposed system is not only cheaper and simpler in the implementation it is also potentially more advanced since optimization of the traffic signal can be performed on a potentially more extended data set.
  • In this work in a realistic setting with a real case study, the authors also investigated the “Deadlock” problem that is very frequent in simulation contests. Deadlock is a situation in which the informatics platform is busy because two or more competing actions are each waiting for the other to finish. In our experiment there was no case of deadlock and we met no difficulty managing the data coming from smartphones. This problem might still reveal itself with higher traffic flows and an interesting development of the research would be to exclude this possibility with other specific experiments.
The introduction of this system in a real city could happen with some drivers subscribing to the system by downloading the application on the smartphone and other drivers not adopting the system. Since the system can only consider “connected” vehicles this would require an extensive analysis of how such a system would work when traditional not “connected” vehicles are present. The contemporary presence of both connected and not connected vehicles involves concepts of cooperation and competition. Concepts of cooperation and competition have been studied using simulation in: [63,64]. The performed simulations demonstrated that there are benefits for all drivers when the percentage of connected vehicles reaches around 30% and that even under this percentage the drivers that are not using the system would not receive too much delay. Simulation showed that independently from the penetration rate of the system when FCD adaptive traffic signals (FCDATS) are implemented there is an overall reduction of travel times and reduced pollution emissions and fuel consumption. Producing these results also on the road with the proposed experimental prototype system and the proposed experimental setting is possible but goes beyond the scope of this first experimental test that mainly aimed to demonstrate the feasibility of these kinds of system and to propose a methodology that also others can reproduce and extend.
New developments of this research will possibly carry out more experimental runs with different intersection layouts, a different percentage of connected vehicles and different control algorithms.

Supplementary Materials

The following are available online at https://drive.google.com/file/d/16EYfgP__JjXflRqcowbSuqKOyRbaO4-l/view?usp=sharing. There are two videos available taken with two different drones of all the experimental runs.

Author Contributions

V.A., V.P.G. and G.G. were responsible for conceptualization and methodology, V.P.G. carried on all the software development, D.C.F. and A.V. performed supervision, review and editing. A.V. performed supervision at the experimental site. All authors have read and agreed to the published version of the manuscript.

Funding

This research received no external funding.

Acknowledgments

The authors wish to thanks Gianfranco Salfi and Claudio Capalbo for managing drone video footage, all the students that participated in the experiment, the rector of the University of Calabria and all the other UNICAL staff that made this experiment possible without external funding.

Conflicts of Interest

The authors declare no conflict of interest.

References

  1. Mokaddem, Y.E.; Jawab, F. Researches and Applications of Intelligent Transportations Systems in Urban Area: Systematic Literature Review. ARPN J. Eng. Appl. Sci. 2019, 14, 639–652. [Google Scholar]
  2. Marzano, V.; Tocchi, D.; Papola, A.; Aponte, D.; Simonelli, F.; Cascetta, E. Incentives to freight railway undertakings compensating for infrastructural gaps: Methodology and practical application to Italy. Transp. Res. Part A Policy Pract. 2018, 110, 77–188. [Google Scholar] [CrossRef]
  3. Astarita, V.; Florian, M.; Musolino, G. A microscopic traffic simulation model for the evaluation of toll station systems. In Proceedings of the IEEE Conference on Intelligent Transportation Systems, Oakland, CA, USA, 25–29 August 2001. [Google Scholar]
  4. Astarita, V.; Giofré, V.; Guido, G.; Vitale, A. Investigating road safety issues through a microsimulation model. Procedia Soc. Behav. Sci. 2011, 20, 226–235. [Google Scholar] [CrossRef] [Green Version]
  5. Young, W.; Sobhani, A.; Lenné, M.G.; Sarvi, M. Simulation of safety: A review of the state of the art in road safety simulation modelling. Accid. Anal. Prev. 2014, 66, 89–103. [Google Scholar] [CrossRef]
  6. Astarita, V.; Giofré, V.P. From traffic conflict simulation to traffic crash simulation: Introducing traffic safety indicators based on the explicit simulation of potential driver errors. Simul. Model. Pract. Theory 2019, 94, 215–236. [Google Scholar] [CrossRef]
  7. Osorio, C.; Punzo, V. Efficient calibration of microscopic car-following models for large-scale stochastic network simulators. Transp. Res. Part B Methodol. 2019, 119, 156–173. [Google Scholar] [CrossRef]
  8. Martinez, F.J.; Toh, C.K.; Cano, J.C.; Calafate, C.T.; Manzoni, P. A survey and comparative study of simulators for vehicular ad hoc networks (VANETs). Wirel. Commun. Mob. Comput. 2011, 11, 813–828. [Google Scholar] [CrossRef]
  9. Gentilea, G. New formulations of the stochastic user equilibrium with logit route choice as an extension of the deterministic model. Transp. Sci. 2018, 52, 1531–1547. [Google Scholar] [CrossRef]
  10. Gentile, G. Solving a Dynamic User Equilibrium model based on splitting rates with Gradient Projection algorithms. Transp. Res. Part B Methodol. 2016, 92, 120–147. [Google Scholar] [CrossRef]
  11. Cantarella, G.E.; Di Febbraro, A.; Di Gangi, M.; Giannattasio, O. Stochastic Multi-Vehicle Assignment to Urban Transportation Networks. In Proceedings of the MT-ITS 2019—6th International Conference on Models and Technologies for Intelligent Transportation Systems, Cracow, Poland, 5–7 June 2019. [Google Scholar]
  12. Cantarella, G.E.; Watling, D.P. A general stochastic process for day-to-day dynamic traffic assignment: Formulation, asymptotic behaviour, and stability analysis. Transp. Res. Part B Methodol. 2016, 92, 3–21. [Google Scholar] [CrossRef]
  13. Trozzi, V.; Gentile, G.; Kaparias, I.; Bell, M.G.H. Effects of Countdown Displays in Public Transport Route Choice Under Severe Overcrowding. Netw. Spat. Econ. 2015, 15, 823–842. [Google Scholar] [CrossRef] [Green Version]
  14. Kucharski, R.; Gentile, G. Simulation of rerouting phenomena in Dynamic Traffic Assignment with the Information Comply Model. Transp. Res. Part B Methodol. 2018, 126, 414–441. [Google Scholar] [CrossRef]
  15. Marzano, V.; Papola, A.; Simonelli, F.; Papageorgiou, M. A Kalman Filter for Quasi-Dynamic o-d Flow Estimation/Updating. IEEE Trans. Intell. Transp. Syst. 2018, 19, 3604–3612. [Google Scholar] [CrossRef]
  16. Papola, A.; Tinessa, F.; Marzano, V. Application of the Combination of Random Utility Models (CoRUM) to route choice. Transp. Res. Part B Methodol. 2018, 111, 304–326. [Google Scholar] [CrossRef]
  17. Papola, A. A new random utility model with flexible correlation pattern and closed-form covariance expression: The CoRUM. Transp. Res. Part B Methodol. 2016, 94, 80–96. [Google Scholar] [CrossRef]
  18. Martin, C. NO IDLE MATTER: Signal-Controlled or Signal-Free. TRAFFIC Technol. Int. 2007, 56–59. [Google Scholar]
  19. Steve Huntingford Traffic Lights Cause More Harm than Good. Available online: https://www.telegraph.co.uk/cars/comment/traffic-lights-cause-more-harm-than-good/ (accessed on 12 October 2018).
  20. Cassini, M. In your car no one can hear you scream! Are traffic controls in cities a necessary evil? Econ. Aff. 2006, 26, 75–78. [Google Scholar] [CrossRef]
  21. Cassini, M. Traffic lights: Weapons of mass distraction, danger and delay. Econ. Aff. 2010, 30, 79–80. [Google Scholar] [CrossRef]
  22. Ban, X.J.; Li, Y.; Skabardonis, A.; Margulici, J.D. Performance evaluation of travel-time estimation methods for real-time traffic applications. J. Intell. Transp. Syst. Technol. Plan. Oper. 2010, 14, 54–67. [Google Scholar] [CrossRef]
  23. Wright, J.; Dahlgren, J. Using Probe Vehicles Equipped with Toll Tag as Probes for Providing Travel Times; California PATH Program, Institute of Transportation Studies, University of California at Berkeley: Berkeley, CA, USA, 2001; ISSN 1055-1417. [Google Scholar]
  24. Priemer, C.; Friedrich, B. A decentralized adaptive traffic signal control using V2I communication data. In Proceedings of the IEEE Conference on Intelligent Transportation Systems, St. Louis, MO, USA, 4–7 October 2009. [Google Scholar]
  25. Astarita, V.; Festa, D.C.; Giofrè, V.P. Mobile Systems applied to Traffic Management and Safety: A state of the art. Procedia Comput. Sci. 2018, 134, 407–414. [Google Scholar] [CrossRef]
  26. Wahlstrom, J.; Skog, I.; Handel, P. Smartphone-Based Vehicle Telematics: A Ten-Year Anniversary. IEEE Trans. Intell. Transp. Syst. 2017, 18, 2802–2825. [Google Scholar] [CrossRef] [Green Version]
  27. Astarita, V.; Danieli, G.; D’Elia, S. Sistema di Rilievo del Deflusso Veicolare per il Monitoraggio e Controllo del Traffico Basato Sulla Registrazione della Localizzazione dei Terminali di Telefonia Mobile. Patent 0001322707, 26 January 2000. [Google Scholar]
  28. Wasson, J.S.; Sturdevant, J.R.; Bullock, D.M. Real-time travel time estimates using media access control address matching. ITE J. (Institute Transp. Eng.) 2008, 78, 20–23. [Google Scholar]
  29. Young, S. Bluetooth Traffic Monitoring Technology: Concept of Operation & Deployment Guidelines; University of Maryland: College Park, MD, USA, 2008. [Google Scholar]
  30. Barceló, J.; Montero, L.; Marqués, L.; Carmona, C. Travel Time Forecasting and Dynamic Origin-Destination Estimation for Freeways Based on Bluetooth Traffic Monitoring. Transp. Res. Rec. J. Transp. Res. Board 2010, 2175, 19–27. [Google Scholar] [CrossRef] [Green Version]
  31. Barceló, J.; Montero, L.; Bullejos, M.; Serch, O.; Carmona, C. A kalman filter approach for exploiting bluetooth traffic data when estimating time-dependent od matrices. J. Intell. Transp. Syst. Technol. Plan. Oper. 2013, 17, 123–141. [Google Scholar] [CrossRef]
  32. Bachmann, C.; Roorda, M.J.; Abdulhai, B.; Moshiri, B. Fusing a bluetooth traffic monitoring system with loop detector data for improved freeway traffic speed estimation. J. Intell. Transp. Syst. Technol. Plan. Oper. 2013, 17, 152–164. [Google Scholar] [CrossRef]
  33. Ygnace, J.L.; Drane, C.; Yim, Y.B.; De Lacvivier, R. Travel Time Estimation on the San Francisco Bay Area Network Using Cellular Phones as Probes; California PATH Program, Institute of Transportation Studies, University of California at Berkeley: Berkeley, CA, USA, 2000; ISSN 1055-1417. [Google Scholar]
  34. Bolla, R.; Davoli, F.; Giordano, A. Estimating Road Traffic Parameters from Mobile Communications. In Proceedings of the 7th World Congress on Intelligent Systems, Turin, Italy, 6–9 November 2000; pp. 1107–1112. [Google Scholar]
  35. Rose, G. Mobile Phones as Traffic Probes: Practices, Prospects and Issues. Transp. Rev. 2006, 26, 275–291. [Google Scholar] [CrossRef]
  36. Astarita, V.; Bertini, R.L.; d’Elia, S.; Guido, G. Motorway traffic parameter estimation from mobile phone counts. Eur. J. Oper. Res. 2006, 175, 1435–1446. [Google Scholar] [CrossRef]
  37. Sohn, K.; Hwang, K. Space-based passing time estimation on a freeway using cell phones as traffic probes. IEEE Trans. Intell. Transp. Syst. 2008, 9, 559. [Google Scholar] [CrossRef]
  38. Herrera, J.C.; Work, D.B.; Herring, R.; Ban, X.; Jacobson, Q.; Bayen, A.M. Evaluation of traffic data obtained via GPS-enabled mobile phones: The Mobile Century field experiment. Transp. Res. Part C Emerg. Technol. 2010, 18, 568–583. [Google Scholar] [CrossRef] [Green Version]
  39. Bar-Gera, H. Evaluation of a cellular phone-based system for measurements of traffic speeds and travel times: A case study from Israel. Transp. Res. Part C Emerg. Technol. 2007, 15, 380–391. [Google Scholar] [CrossRef]
  40. Guido, G.; Vitale, A.; Saccomanno, F.F.; Carmine, F.D.; Astarita, V.; Rogano, D.; Gallelli, V. Using Smartphones As a Tool to Capture Road Traffic Attributes. Appl. Mech. Mater. 2013, 432, 513–519. [Google Scholar] [CrossRef]
  41. Guido, G.; Saccomanno, F.F.; Vitale, A.; Gallelli, V.; Festa, D.C.; Astarita, V.; Rogano, D.; Carvelli, D. Extracting vehicle tracking data from smartphone sensors. In Proceedings of the 92th Annual Meeting of Transportation Research Board, Washington, DC, USA, 13–17 January 2013. [Google Scholar]
  42. Jiang, Y.; Zhang, J. Influence of Smartphone Apps with Driving Safety Related Diagnosis Functions on Expressway Driving Speed Changes. J. Transp. Eng. Part A Syst. 2017, 144, 04017069. [Google Scholar] [CrossRef]
  43. Guido, G.; Vitale, A.; Astarita, V.; Saccomanno, F.; Giofré, V.P.; Gallelli, V. Estimation of Safety Performance Measures from Smartphone Sensors. Procedia Soc. Behav. Sci. 2012, 54, 1095–1103. [Google Scholar] [CrossRef] [Green Version]
  44. Jiang, Y.; Zhang, J.; Wang, Y.; Wang, W. Drivers’ behavioral responses to driving risk diagnosis and real-time warning information provision on expressways: A smartphone app–based driving experiment. J. Transp. Saf. Secur. 2018, 1–29. [Google Scholar] [CrossRef]
  45. Astarita, V.; Guido, G.; Giofrè, V.P. Co-operative ITS: Smartphone based measurement systems for road safety assessment. Procedia Comput. Sci. 2014, 37, 404–409. [Google Scholar] [CrossRef] [Green Version]
  46. Astarita, V.; Guido, G.; Mongelli, D.; Giofrè, V.P. A co-operative methodology to estimate car fuel consumption by using smartphone sensors. Transport 2015, 30, 307–311. [Google Scholar] [CrossRef] [Green Version]
  47. Astarita, V.; Guido, G.; Mongelli, D.W.E.; Giofrè, V.P. Ecosmart and TutorDrive: Tools for fuel consumption reduction. In Proceedings of the 2014 IEEE International Conference on Service Operations and Logistics, and Informatics, SOLI, Qingdao, China, 8–10 October 2014. [Google Scholar]
  48. Astarita, V.; Festa, D.C.; Mongelli, D.W.E. EcoSmart: An Application for Smartphones for Monitoring Driving Economy. Adv. Mat. Res. 2014, 827, 360–367. [Google Scholar] [CrossRef]
  49. Astarita, V.; Festa, D.C.; Mongelli, D.W.E.; Mongelli, N.; Ruffolo, O.; Servino, A. EcoSmart: A Survey and Sector Analysis of Mobile Phone Application Market for Fuel Consumption Reduction; Trans Tech Publications Ltd.: Stafa-Zurich, Switzerland, 2014; Volume 519–520, ISBN 9783038350194. [Google Scholar]
  50. Astarita, V.; Caruso, M.V.; Danieli, G.; Festa, D.C.; Giofrè, V.P.; Iuele, T.; Vaiana, R. A Mobile Application for Road Surface Quality Control: UNIquALroad. Procedia Soc. Behav. Sci. 2012, 54, 1135–1144. [Google Scholar] [CrossRef] [Green Version]
  51. Mohan, P.; Padmanabhan, V.N.; Ramjee, R. Nericell: Rich monitoring of road and traffic conditions using mobile smartphones. In Proceedings of the 6th ACM Conference on Embedded Network Sensor Systems, Raleigh, NC, USA, 5–7 November 2008. [Google Scholar]
  52. Festa, D.C.; Mongelli, D.W.E.; Astarita, V.; Giorgi, P. First results of a new methodology for the identification of road surface anomalies. In Proceedings of the 2013 IEEE International Conference on Service Operations and Logistics, and Informatics, SOLI, Dongguan, China, 28–30 July 2013. [Google Scholar]
  53. Bierlaire, M.; Chen, J.; Newman, J.P. Modeling Route Choice Behavior From Smartphone GPS Data; Report TRANSP-OR 101016; Ecole Polytechnique Fédérale de Lausanne: Lausanne, Switzerland, 2010. [Google Scholar]
  54. Dailey, D.J.; Cathey, F.W. Virtual speed sensors using transit vehicles as traffic probes. In Proceedings of the IEEE Conference on Intelligent Transportation Systems, Singapore, 6 September 2002. [Google Scholar]
  55. Axer, S.; Friedrich, B. Level of service estimation based on low-frequency floating car data. Transp. Res. Procedia 2014, 3, 1051–1058. [Google Scholar] [CrossRef] [Green Version]
  56. Biral, F.; Da Lio, M.; Bertolazzi, E. Combining safety margins and user preferences into a driving criterion for optimal control-based computation of reference maneuvers for an ADAS of the next generation. In Proceedings of the IEEE Intelligent Vehicles Symposium, Las Vegas, NV, USA, 6–8 June 2005. [Google Scholar]
  57. Vaiana, R.; Iuele, T.; Astarita, V.; Caruso, M.V.; Tassitani, A.; Zaffino, C.; Giofrè, V.P. Driving behavior and traffic safety: An acceleration-based safety evaluation procedure for smartphones. Mod. Appl. Sci. 2014, 8, 88. [Google Scholar] [CrossRef]
  58. Barthauer, M.; Friedrich, B. Evaluation of a signal state prediction algorithm for car to infrastructure applications. Transp. Res. Procedia 2014, 3, 982–991. [Google Scholar] [CrossRef] [Green Version]
  59. Olaverri-Monreal, C.; Errea-Moreno, J.; Díaz-Álvarez, A. Implementation and Evaluation of a Traffic Light Assistance System Based on V2I Communication in a Simulation Framework. J. Adv. Transp. 2018. [Google Scholar] [CrossRef] [Green Version]
  60. Hu, J.; Fontaine, M.D.; Park, B.B.; Ma, J. Field evaluations of an adaptive traffic signal—Using private-sector probe data. J. Transp. Eng. 2015, 142, 04015033. [Google Scholar] [CrossRef]
  61. Saust, F.; Bley, O.; Kutzner, R.; Wille, J.M.; Friedrich, B.; Maurer, M. Exploitability of vehicle related sensor data in cooperative systems. In Proceedings of the IEEE Conference on Intelligent Transportation Systems, Funchal, Portugal, 19–22 September 2010. [Google Scholar]
  62. Krajzewicz, D.; Heinrich, M.; Milano, M. COLOMBO: Investigating the Potential of V2X for Traffic Management Purposes assuming low penetration Rates. In Proceedings of the 9th ITS European Congress, Dublin, Ireland, 4–7 June 2013. [Google Scholar]
  63. Astarita, V.; Vincenzo Pasquale, G.; GUIDO, G.; Vitale, A. A Single Intersection Cooperative-Competitive Paradigm in Real Time Traffic Signal Settings Based on Floating Car Data. Energies 2019, 12, 409. [Google Scholar] [CrossRef] [Green Version]
  64. Astarita, V.; Festa, D.C.; Vincenzo, G. Cooperative-competitive paradigm in traffic signal synchronization based on floating car data. In Proceedings of the 2018 IEEE International Conference on Environment and Electrical Engineering and 2018 IEEE Industrial and Commercial Power Systems Europe (EEEIC/I&CPS Europe), Palermo, Italy, 12–15 June 2018. [Google Scholar]
  65. Gradinescu, V.; Gorgorin, C.; Diaconescu, R.; Cristea, V.; Iftode, L. Adaptive traffic lights using car-to-car communication. In Proceedings of the IEEE Vehicular Technology Conference, Dublin, Ireland, 22–25 April 2007. [Google Scholar]
  66. Astarita, V.; Giofrè, V.P.; Guido, G.; Vitale, A. The Use of Adaptive Traffic Signal Systems Based on Floating Car Data. Wirel. Commun. Mob. Comput. 2017, 2017, 1–13. [Google Scholar] [CrossRef]
  67. Chandan, K.; Seco, A.M.; Silva, A.B. Real-time Traffic Signal Control for Isolated Intersection, using Car-following Logic under Connected Vehicle Environment. Transp. Res. Procedia 2017, 25, 1610–1625. [Google Scholar] [CrossRef]
  68. Zhang, R.; Ishikawa, A.; Wang, W.; Striner, B.; Tonguz, O. Intelligent Traffic Signal Control: Using Reinforcement Learning with Partial Detection. arXiv 2018, arXiv:1807.01628. [Google Scholar]
  69. Sharma, S.; Lubmann, J.; So, J. Controller Independent Software-in-the-Loop Approach to Evaluate Rule-Based Traffic Signal Retiming Strategy by Utilizing Floating Car Data. IEEE Trans. Intell. Transp. Syst. 2019, 20, 3585–3594. [Google Scholar] [CrossRef]
  70. Marinelli, M.; Palmisano, G.; Astarita, V.; Ottomanelli, M.; Dell’Orco, M. A Fuzzy set-based method to identify the car position in a road lane at intersections by smartphone GPS data. Transp. Res. Procedia 2017, 27, 444–451. [Google Scholar] [CrossRef]
  71. Giofre, V.P.; Astarita, V.; Guido, G.; Vitale, A. Localization issues in the use of ITS. In Proceedings of the 5th IEEE International Conference on Models and Technologies for Intelligent Transportation Systems, Naples, Italy, 26–28 June 2017. [Google Scholar]
  72. Giofrè, V.P.; Maciejewski, M.; Merkisz Guranowska, A.; Piątkowski, B.; Astarita, V. Real road network application of a new microsimulation tool TRITONE. Arch. Transp. 2013, 27, 111–121. [Google Scholar] [CrossRef]
  73. Astarita, V.; Giofrè, V.; Guido, G.; Vitale, A.; Festa, D.; Vaiana, R.; Iuele, T.; Mongelli, D.; Rogano, D.; Gallelli, V. New features of Tritone for the evaluation of traffic safety performances. In Transport Infrastructure and Systems; Taylor & Francis Group: London, UK, 2017; pp. 625–632. [Google Scholar]
  74. Astarita, V.; Giofré, V.; Guido, G.; Vitale, A. Calibration of a new microsimulation package for the evaluation of traffic safety performances. PROCEDIA Soc. Behav. Sci. 2012, 54, 1019–1026. [Google Scholar] [CrossRef] [Green Version]
  75. Astarita, V.; Guido, G.; Vitale, A.; Giofré, V. A new microsimulation model for the evaluation of traffic safety performances. Eur. Transp. Trasp. Eur. 2012, 51, 1–16. [Google Scholar]
  76. Krajzewicz, D.; Erdmann, J.; Behrisch, M.; Bieker, L. Recent Development and Applications of {SUMO—Simulation of Urban MObility}. Int. J. Adv. Syst. Meas. 2012, 5, 128–138. [Google Scholar]
  77. Ekeila, W.; Sayed, T.; El Esawey, M. Development of Dynamic Transit Signal Priority Strategy. Transp. Res. Rec. J. Transp. Res. Board 2009. [Google Scholar] [CrossRef] [Green Version]
  78. Tan, L.; Zhao, X.; Hu, D.; Shang, Y.; Wang, R. A study of single intersection traffic signal control based on two-player cooperation game model. In Proceedings of the 2010 WASE International Conference on Information Engineering, ICIE, Beidaihe, China, 14–15 August 2010. [Google Scholar]
  79. Abdelghaffar, H.M.; Yang, H.; Rakha, H.A. Isolated traffic signal control using a game theoretic framework. In Proceedings of the IEEE Conference on Intelligent Transportation Systems, Rio de Janeiro, Brazil, 1–4 November 2016. [Google Scholar]
Figure 1. General structure of the proposed system.
Electronics 09 00114 g001
Figure 2. Intelligent Transportation Systems (ITS) laboratory for traffic signal algorithms testing and development.
Electronics 09 00114 g002
Figure 3. Traffic signal management in the on-field experiment.
Electronics 09 00114 g003
Figure 4. Local controller and connections with traffic lights.
Electronics 09 00114 g004
Figure 5. The experimental site: a three-legs intersection.
Electronics 09 00114 g005
Figure 6. (a) Phase diagram; (b) Four of the five different paths implemented in the proposed first experimental setting.
Electronics 09 00114 g006
Figure 7. The whole prototypal system for the experiment.
Electronics 09 00114 g007
Figure 8. Data flow and general structure of the different software modules in the proposed system.
Electronics 09 00114 g008
Figure 9. Simulation and experimental results of static cycle.
Electronics 09 00114 g009
Figure 10. Simulation and experimental results of floating car data adaptive traffic signal (FCDATS).
Electronics 09 00114 g010
Table 1. Simulation results for the whole intersection.
Total Outflow
[veh/h]
Average Travel Time
[s]
Average Speed
[km/h]
Static cycle381972.26
FCDATL549444.97
Percentage gain44.09%54.60%120.28%
Table 2. Experimental results for the whole intersection.
Total Outflow
[veh/h]
Average Travel Time
[s]
Average Speed
[km/h]
Static cycle2091561.43
FCDATL450425.33
Percentage gain115.97%73.11%271.83%
Table 3. Simulation results for maneuver.
Approach n°Static CycleFCDATL
Outflow [veh/h]Average Travel Time [s]Average Speed [km/h]Total Outflow [veh/h]Average Travel Time [s]Average Speed [km/h]
1102.034.242.44148.015.965.24
291.039.911.94149.015.235.08
3188.022.902.53252.012.884.50
Table 4. Experimental results for maneuver.
Approach n°Static CycleFCDATL
Outflow [veh/h]Average Travel Time [s]Average Speed [km/h]Total Outflow [veh/h]Average Travel Time [s]Average Speed [km/h]
141.768.201.32119.914.736.11
275.140.942.02138.013.975.93
391.846.551.08192.513.173.83

