1. Introduction
The time-dependent dielectric breakdown (TDDB) phenomenon is a major issue affecting the reliability of semiconductor devices, often limiting their high voltage applications. In particular, the reduction of lifetime in high voltage devices such as power semiconductors, as a result of TDDB, is crucial to device development [
1]. Accordingly, many theories have been proposed for interpreting TDDB. Previously published research confirms that the effect of TDDB varies with respect to semiconductor device structure, process variation and physical degradation mechanism [
2]. The most widely used and prominent concepts among the physical theories of TDDB are the thermo-chemical (TC) model, anode hole injection (AHI) model, and hydrogen release (HR) model. Each TDDB model has the following characteristics: (i) TC model for analyzing the trap with bond breakage; (ii) an HR model, where the released hydrogen from the Si–H bond manifests itself at the interface of Si/SiO2 and acts as a trap in the oxide; and (iii) the AHI model, where hot holes are generated by impact ionization, creating defects in the oxide. These three theories of TDDB have been designed differently, depending on the structure of the device, the electrical condition, and the oxide material. In other words, the TDDB models are highly influenced by the device environment elements, which differ with the semiconductor material. Based on this theoretical background, there have been many attempts to explain the measured device lifetime in presence of the TDDB phenomenon and to predict their lifetime in different operating conditions, such as temperature, bias, and stress time.
A single TDDB model cannot adequately describe the temperature dependence; there is a discrepancy between the predicted lifetime and the actual measured data at high temperatures. Hence, the temperature-dependence, in the high temperature range, is described using a mixture of several TDDB models. This is because, in the high temperature region, more than one TDDB model becomes dominant and trap generations, by each TDDB mechanism becomes active: (i) in TC model, the trap generation increases because the bond breakage rate is increased by the thermal energy; (ii) in AHI mode, hot holes, generated by impact ionization, drift into the oxide increasing trap generation rate, due to thermal energy. Thus, there is a limitation in estimating the lifetime using a single traditional model of TDDB. Therefore, in this paper, we propose a hybrid TDDB model, in which two mechanisms operate simultaneously.
Additionally, the hybrid TDDB model, proposed in this paper, is used to simulate the percolation path of oxide, using a cell-based analytical method, and to analyze the lifetime by using a lifetime prediction model incorporating temperature variables. The results of this model were compared with measured TDDB data, both under low and high temperatures, and were found to closely agree. Thus, the developed model is useful in performing early failure detection by using an accelerated lifetime test and in providing long-term quality assurance [
3].
2. TDDB Hybrid Model
In this paper, we propose a TDDB hybrid model in which the TC and AHI models operate simultaneously.
Figure 1 shows the behavior model that is changed by oxide thickness (
) and oxide electric field (
), when predicting lifetime, using a single TDDB model. Among the three TDDB models (TC/AHI/HR), the HR model is the proposed model for hyper-thin oxide with
less than 5nm as the TDDB effect on thick oxide with
> 5 nm can be negligible. In addition, the HR model operates when the energy of the injected electron from the substrate (
) is 3 eV or more, the threshold energy (
) of the HR model. The threshold energy of the AHI model, which is affected by hot holes generated from impact ionization, is 6 eV [
4]. This is the highest impact ionization among the three TDDB models (i.e., it operates mainly in highest electric fields). In the TC model, the TDDB phenomenon is interpreted as a trap, due to breakage of oxide bonding; therefore, the threshold energy is extremely low (i.e., it operates mainly in lowest electric fields). The red line in
Figure 1 means the threshold energy of the HR model (
), according to the
, and the black line means the threshold energy of the AHI model (
).
In summary, for thin-oxides with
< 5 nm, the behavior single TDDB model, which operates as the electric field increases, predicts the device lifetime in the order of TC–HR–AHI model. For thick oxides with
> 5 nm, the behavior single TDDB model predicts the device lifetime in order of the TC–AHI model, since the influence of the HR model is negligible. In this paper, the target oxide was a thick oxide with a
Tox of 9.9 nm. For power devices (e.g., lateral double diffused MOS (LDMOS), etc.), the channel length is still longer, and thick oxides are often used [
5]. This paper analyzed the oxide reliability of these power devices. TC model operates under low field condition and AHI model operates under high field condition. Thus, the modeling process in this study was performed with TC modeling and AHI modeling. In this process,
is obtained by summing the number of traps per unit volume, due to the TC mechanism, denoted as
, and the number of traps caused by the AHI mechanism, denoted as
.
is calculated from the TC model. Polarization, denoted as
, occurs when an external electric field,
, is applied to a dielectric with polarity. The local electric field,
, applied to the bonding of the oxide because of this polarization, is calculated as follows [
6],
where
is the permittivity of free space,
is the electric susceptibility, and
is a dielectric constant. With this local electric field, the activation energy,
, of the bond breakage is defined by the following equation,
where
is the field free activation energy and
is the effective dipole moment. According to the TC model, the field-enhanced thermal bond-breakage (
) can be expressed by the first-order reaction rate equation as,
where
is a trap number per 1 cm
3 under given conditions (time, temperature, and electric field) and
is the bond breakage rate.
can be expressed using the Boltzmann probability of a molecule in an insulator, due to its interaction with the surrounding lattice, by,
where
v0 is a lattice vibration frequency (~10
13/sec),
is the activation energy due to the local electric field,
kb is the Boltzmann constant,
r is the fitting parameter, and
T is the temperature. Therefore,
can be obtained using (1)–(4).
In addition,
is calculated as follows [
4]: first, we calculate the injected current from the substrate due to the Fowler–Nordheim (FN) tunneling current density equation by,
where
A and
B are the FN tunneling coefficients. Then, quantum yield can be expressed as
[
7]. Because the current density of the generated holes is
, the charge amount of the generated holes is
(where
Aox is the insulator area and
t is the observation time). This value, when divided by elementary charge,
q, gives the number of generated holes. As the generated holes drift to the insulator, they can generate defects. The defect generation probability, denoted as
Pdefect, is a newly defined fitting parameter. If the number of defects generated in the insulator is divided by the insulator volume
, the expected value of defects per unit volume in the insulator can be defined as:
Then, the summation of the two values yields the number of traps per unit volume calculated using the two models simultaneously, i.e., .
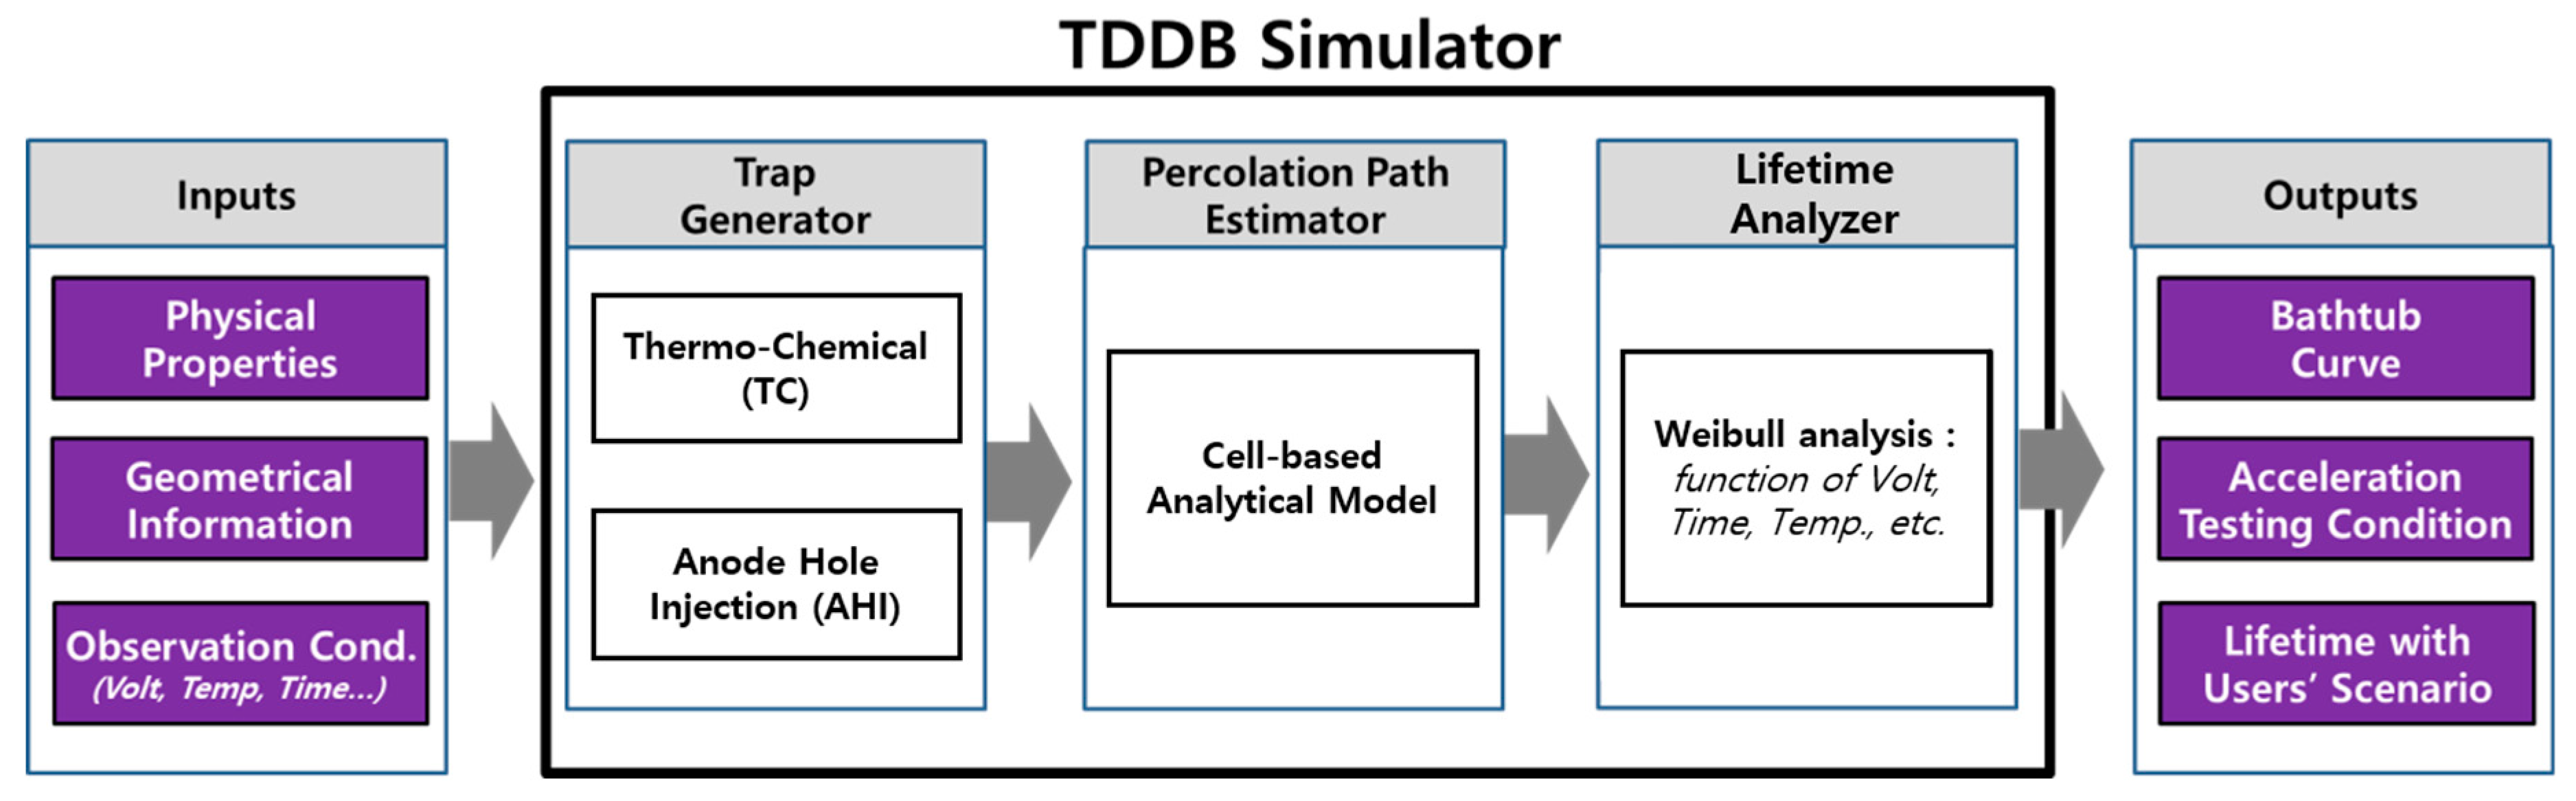
Figure 2 describes the process of calculating oxide survival probability from the trap density obtained in the above step, and extracting lifetime from it. First, the percolation path of the oxide is calculated from the trap density and the survival probability of the oxide is obtained from it. Then, the device lifetime can be obtained by interpreting the Weibull distribution, popularly used in plotting semiconductor failure mechanisms, such as TDDB from the obtained probability. The detailed process is as follows.
We used the cell-based analytical percolation model to analyze the lifetime of dielectric breakdown, which is caused by traps in the insulator, as described by the TDDB model. In the percolation model, traps inside the insulator, between two electrodes, are randomly generated by stress and form a conductive path between the electrodes, causing electrical breakdown [
8]. In this paper, the oxide survival probability was calculated using, not only a simple single percolation path, but also a percolation path considering the nine nearest cells. Theoretically, this approach is more accurate in computing the survival probability [
9].
First, the insulating layer was divided into unit cells. At this point, the volume of the unit cell is the cube of the lattice constant (
). That is, the total oxide is divided into
N columns (
), and each column is divided into
n unit cells(
). If the Poisson distribution parameter, that was obtained in the previous step, is
, the probability of generating
k-traps in the unit cell can be obtained by using the PMF,
of the Poisson distribution [
10]. Poisson distribution is a discrete probability distribution that expresses the probability of a given number of events occurring in a fixed interval of space. If there is at least one trap in the unit cell, the cell is determined as defective- and
. The failure rate of a cell is denoted as
. The probability that a column becomes the percolation path is
, and the probability that the percolation path is not generated in all
N columns is
. Then, the Weibit (
) can be calculated as
[
8,
9].
The Weibull distribution, used in this paper, is a very widely used reliability distribution, especially for plotting semiconductor failure mechanisms, such as TDDB [
11]. As TDDB occurs at small localized regions (usually called a percolation region/path) degrading rapidly in the entire oxide region, this phenomenon is well-fitted by the Weibull distribution. The Weibull probability density function (PDF) is defined by [
12] as,
where α is the characteristic time-to-failure (usually, expressed as
),
is the shape (dispersion or Weibull slope) parameter. In addition, the Weibull cumulative density function (CDF) is defined by:
Rearranging this CDF (
) and taking the appropriate logarithms, results in a quantity, commonly known as the Weibit (
):
When
F = 50% in the above equation,
can be obtained from the plot of
Weibit vs
(
Figure 3). In this process, the Weibit plot should be linear. For this, we used the ‘
polyfit’ function in Python’s NumPy library to linearly approximate the bent Weibit plot.
3. Results and Discussion
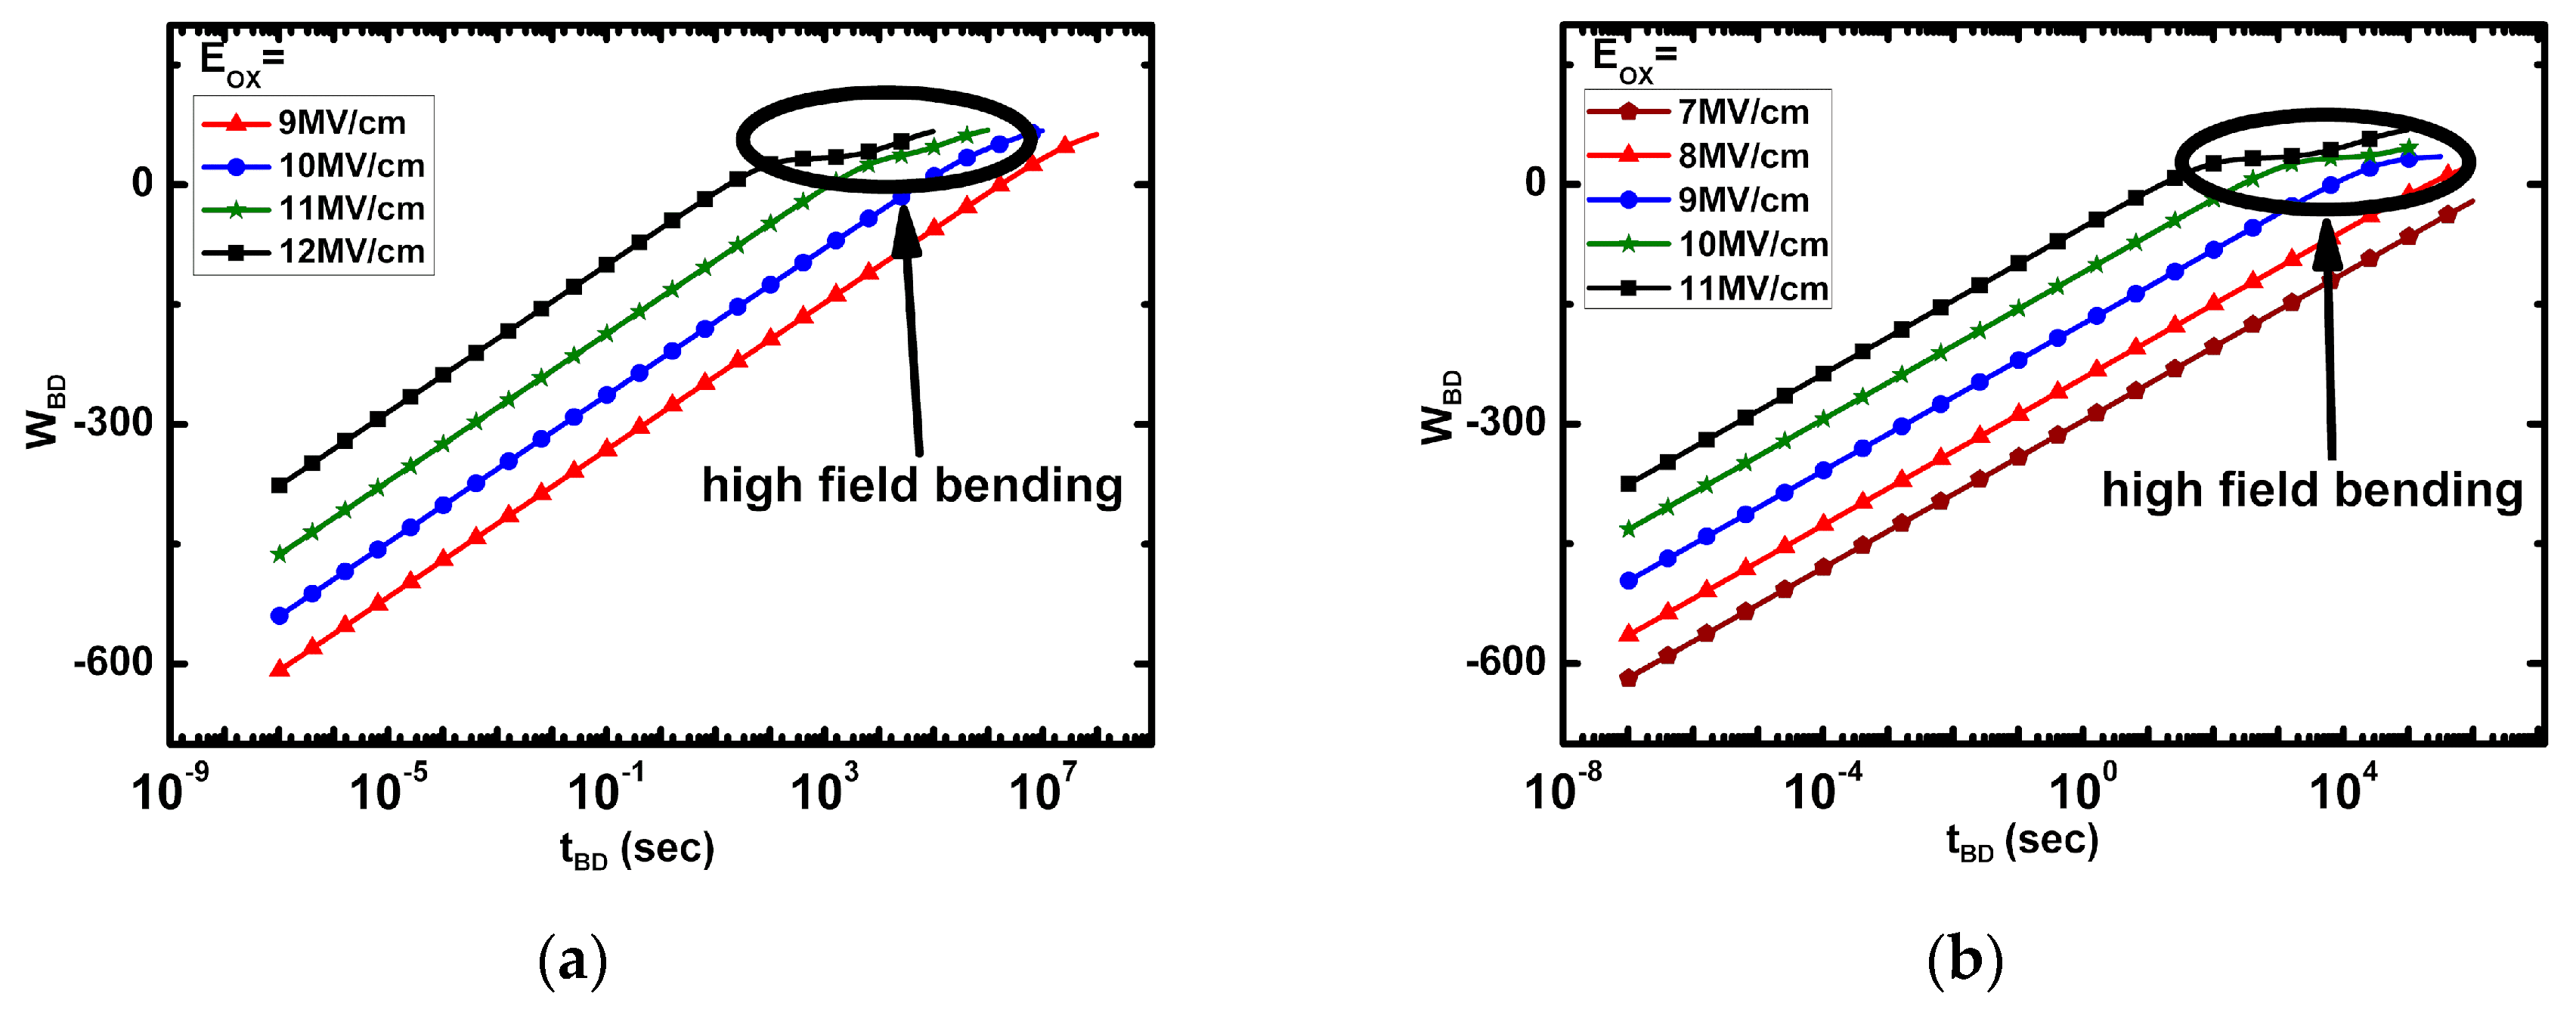
Figure 3 shows the Weibit slope obtained from the proposed TDDB hybrid model.
Figure 3a shows the Weibit slope, at a low temperature of 298.15 K, while
Figure 3b shows the Weibit slope at a high temperature of 398.15 K. In the encircled region, the influence of the AHI model, affected by the FN tunneling, increases as the electric field increases. This indicates that the Weibit tends to bend.
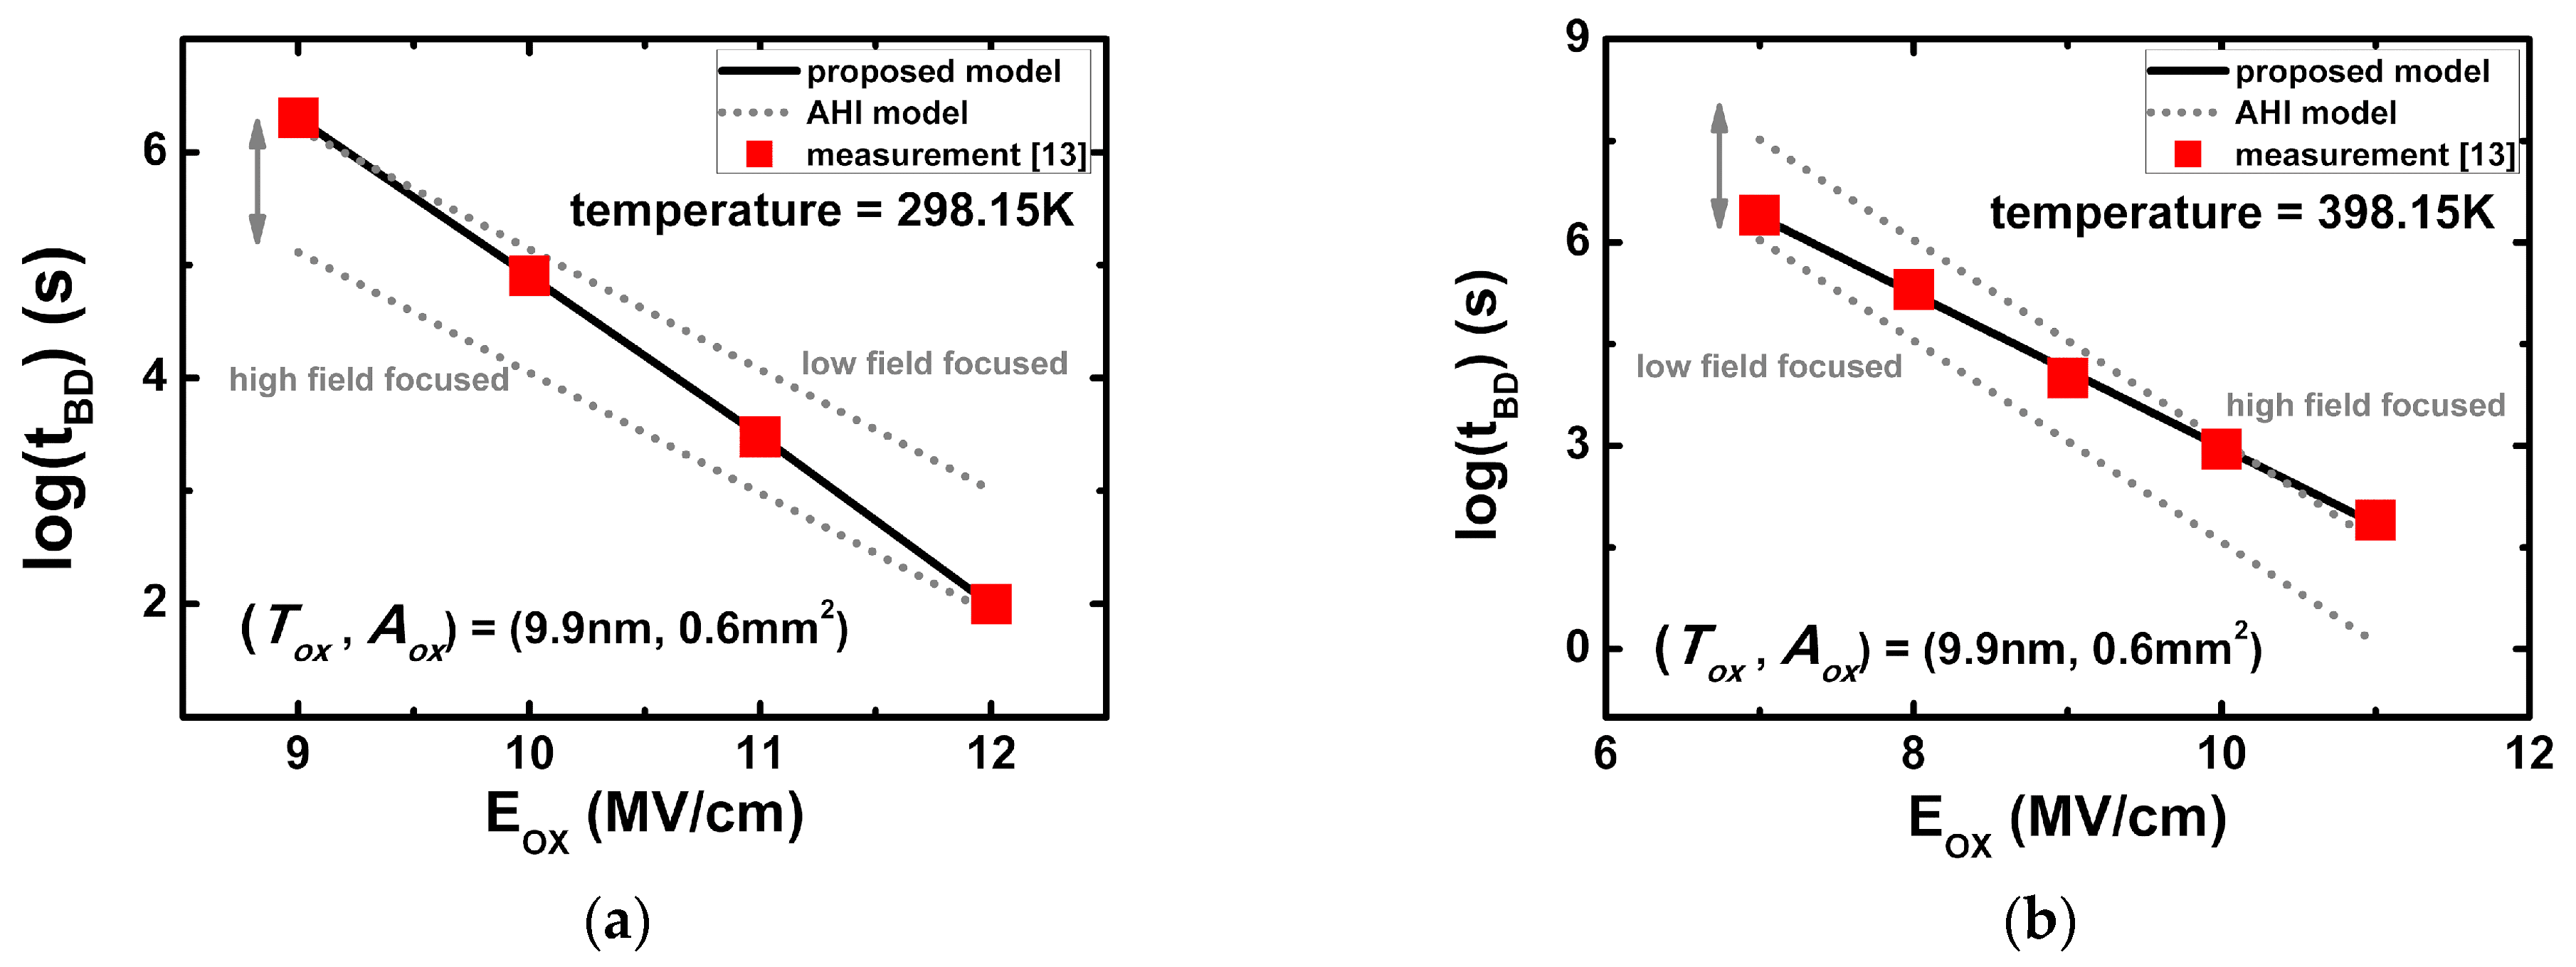
The lifetime vs
plots obtained from the proposed TDDB hybrid model are shown in
Figure 4. The target structure is a thick oxide with
of 9.9 nm and
of 0.6 mm
2. The range of
is 9–12 MV/cm at low temperature, and 7–11 MV/cm, at a high temperature. Under both low and high temperatures, there is a proper fit with the actual measured data [
13].
Figure 4 also shows that there is a discrepancy between the actual measured data and the estimated lifetime if the existing single AHI model is used. This discrepancy can be successfully overcome by using our proposed TDDB hybrid model.
In addition, we analyzed the factors affecting the lifetime, as time passes in both the TC and AHI mechanisms.
Figure 5 shows the trap density of each TDDB mechanism under a stress condition that guarantees a lifetime of 10 years, assuming 8 hours of operation per day. The
value guaranteeing a 10-year lifetime is 7.81 MV/cm at low temperature and 5.54 MV/cm at high temperature.
is the number of initial weak bonds in the TC model. Upon solving the differential equation in (3):
refers to the maximum value of the traps, which can be generated by the TC mechanism, i.e., breakage of the bonds by polarization. To guarantee the same lifetime of 10 years, it can be operated in a relatively higher
region, under low temperature conditions. As the AHI model is more dependent on the field than the TC model, the point at which the saturation value of the TC model is exceeded by
at ‘low temperature under high
’ condition is lower than the ‘high temperature under low
’ condition. In other words,
Figure 5 shows that the trap generation of the TC model has a higher temperature dependence than that of the AHI model. The trap generation of the AHI model also has a relatively greater field dependence than that of the TC model.
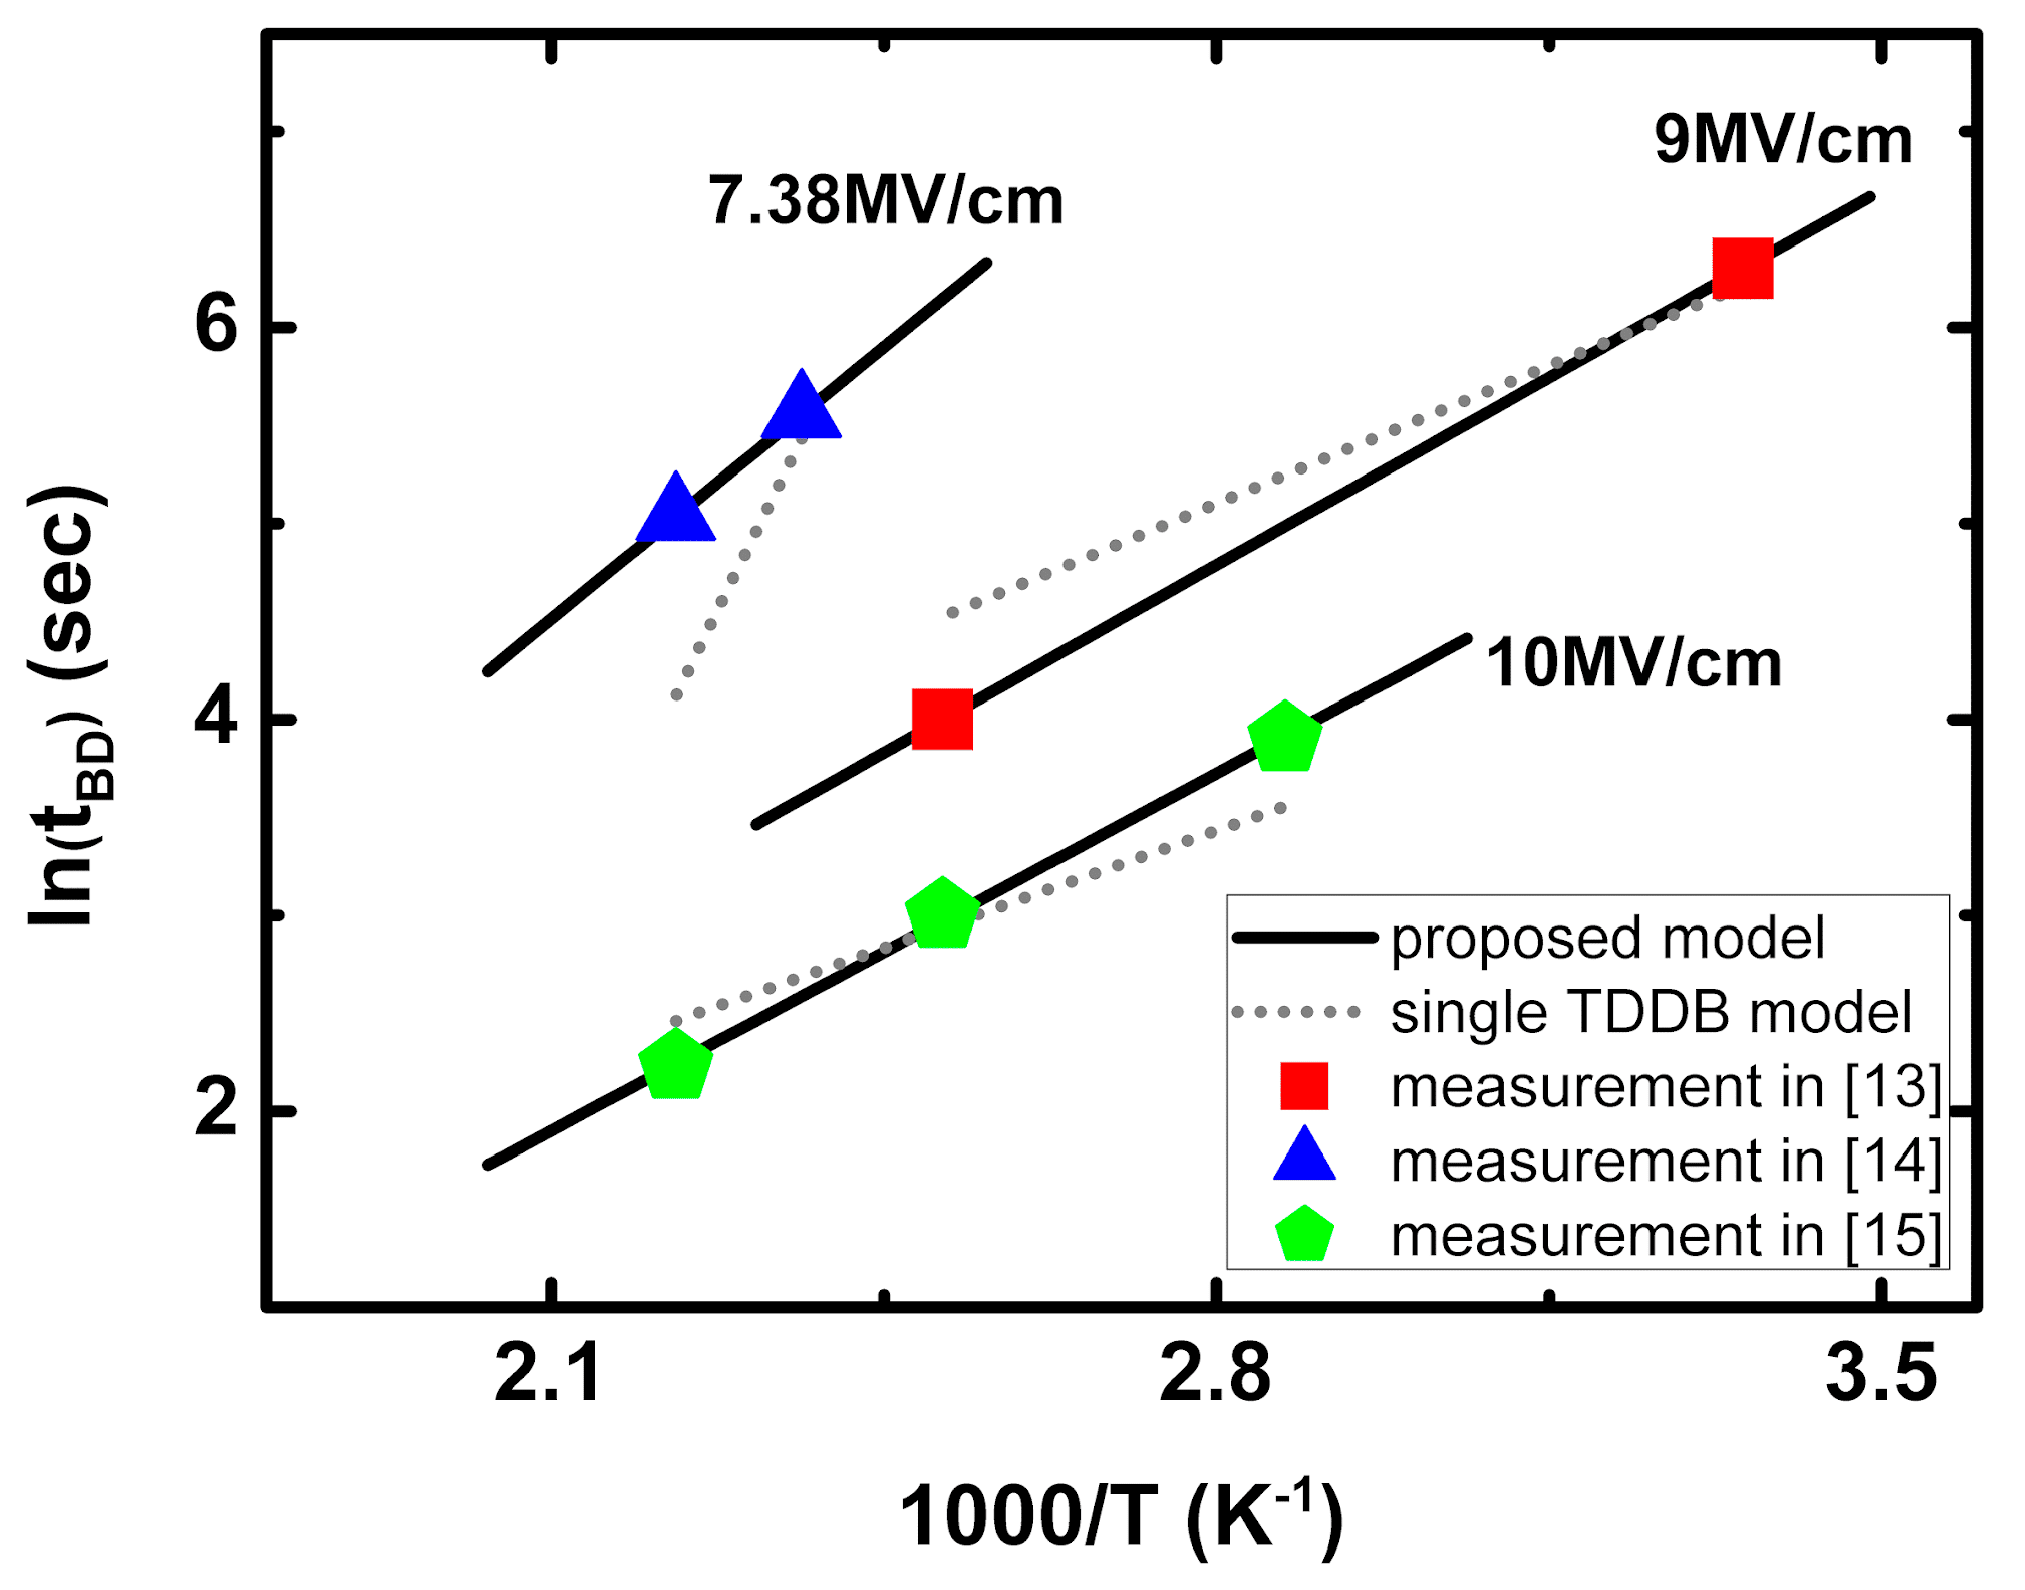
Figure 6 is the lifetime versus temperature plot, obtained by the proposed TDDB hybrid model. The temperature conditions for simulation were in the range of 25–175 °C. The oxide electric field was varied in the range of 7.38–10 MV/cm. The lifetime predicted from the proposed hybrid model matches well with the actual measured TDDB data [
13,
14,
15]. The dotted-line of
Figure 6 is the lifetime predicted by a single TDDB model. The single TDDB model does not adequately describe the temperature dependence of TDDB in the high temperature range.
