Detecting Fake Finger-Vein Data Using Remote Photoplethysmography


Abstract
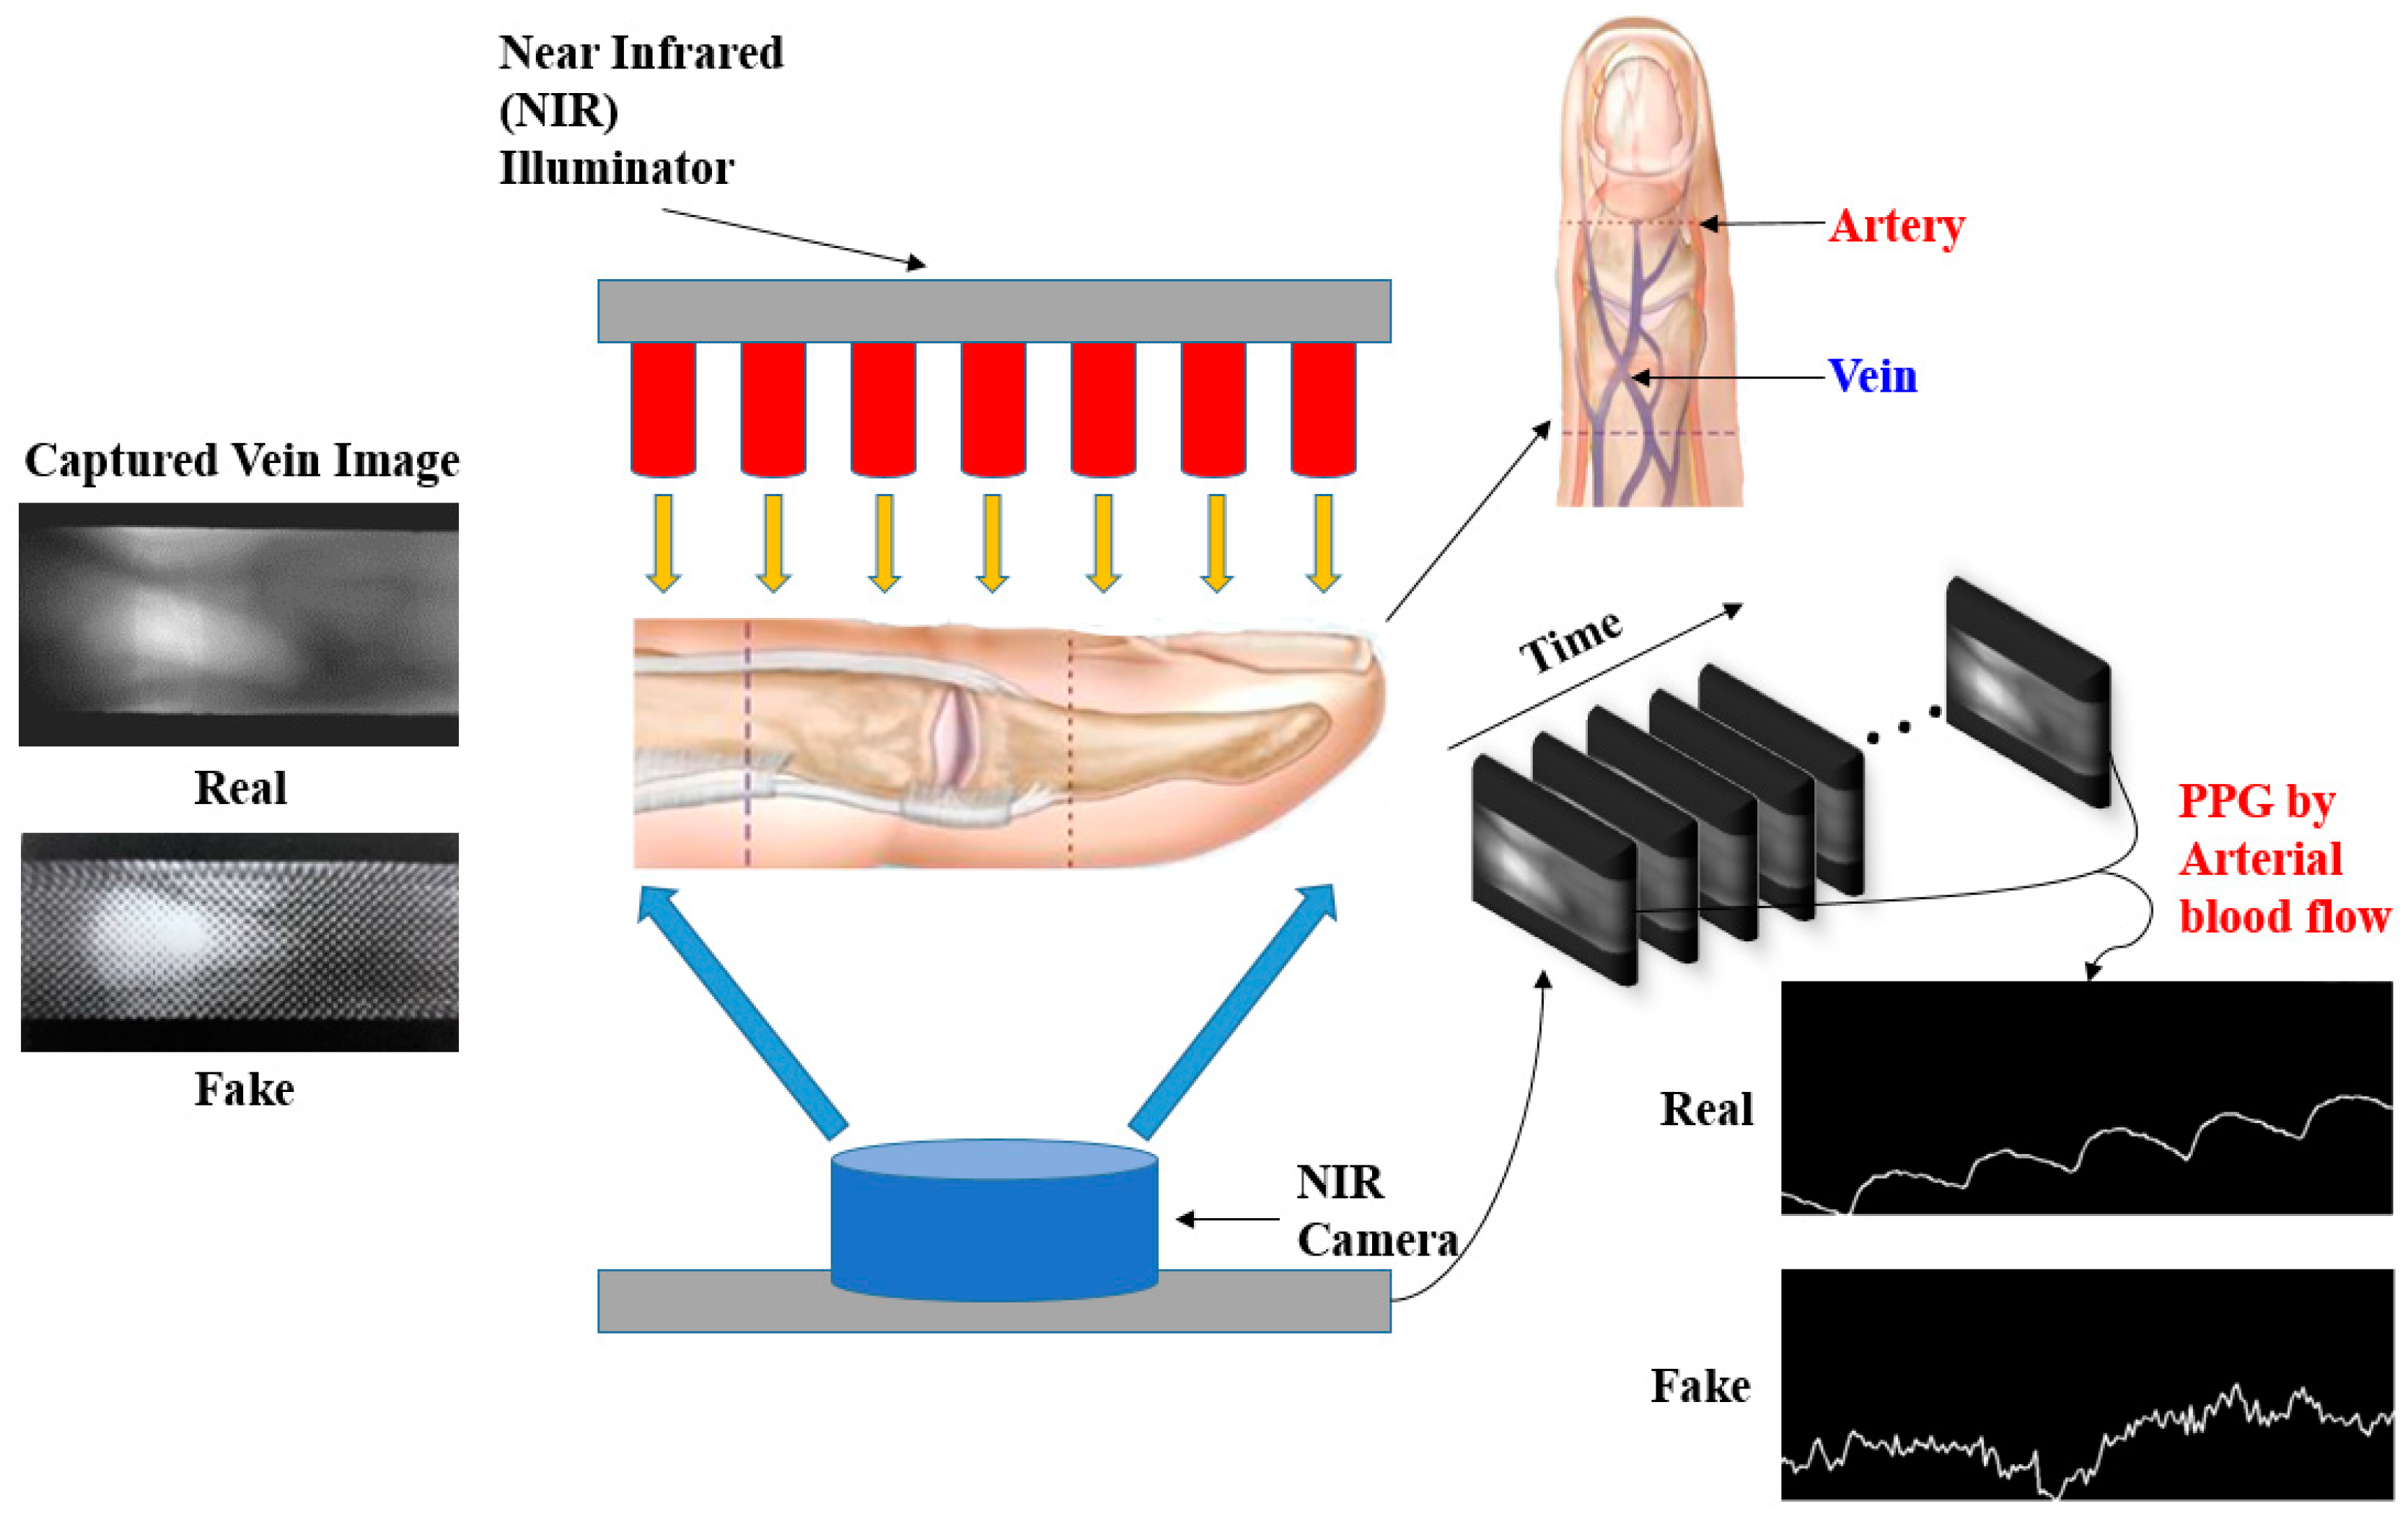
1. Introduction
2. Materials and Method
2.1. Finger-Vein Database
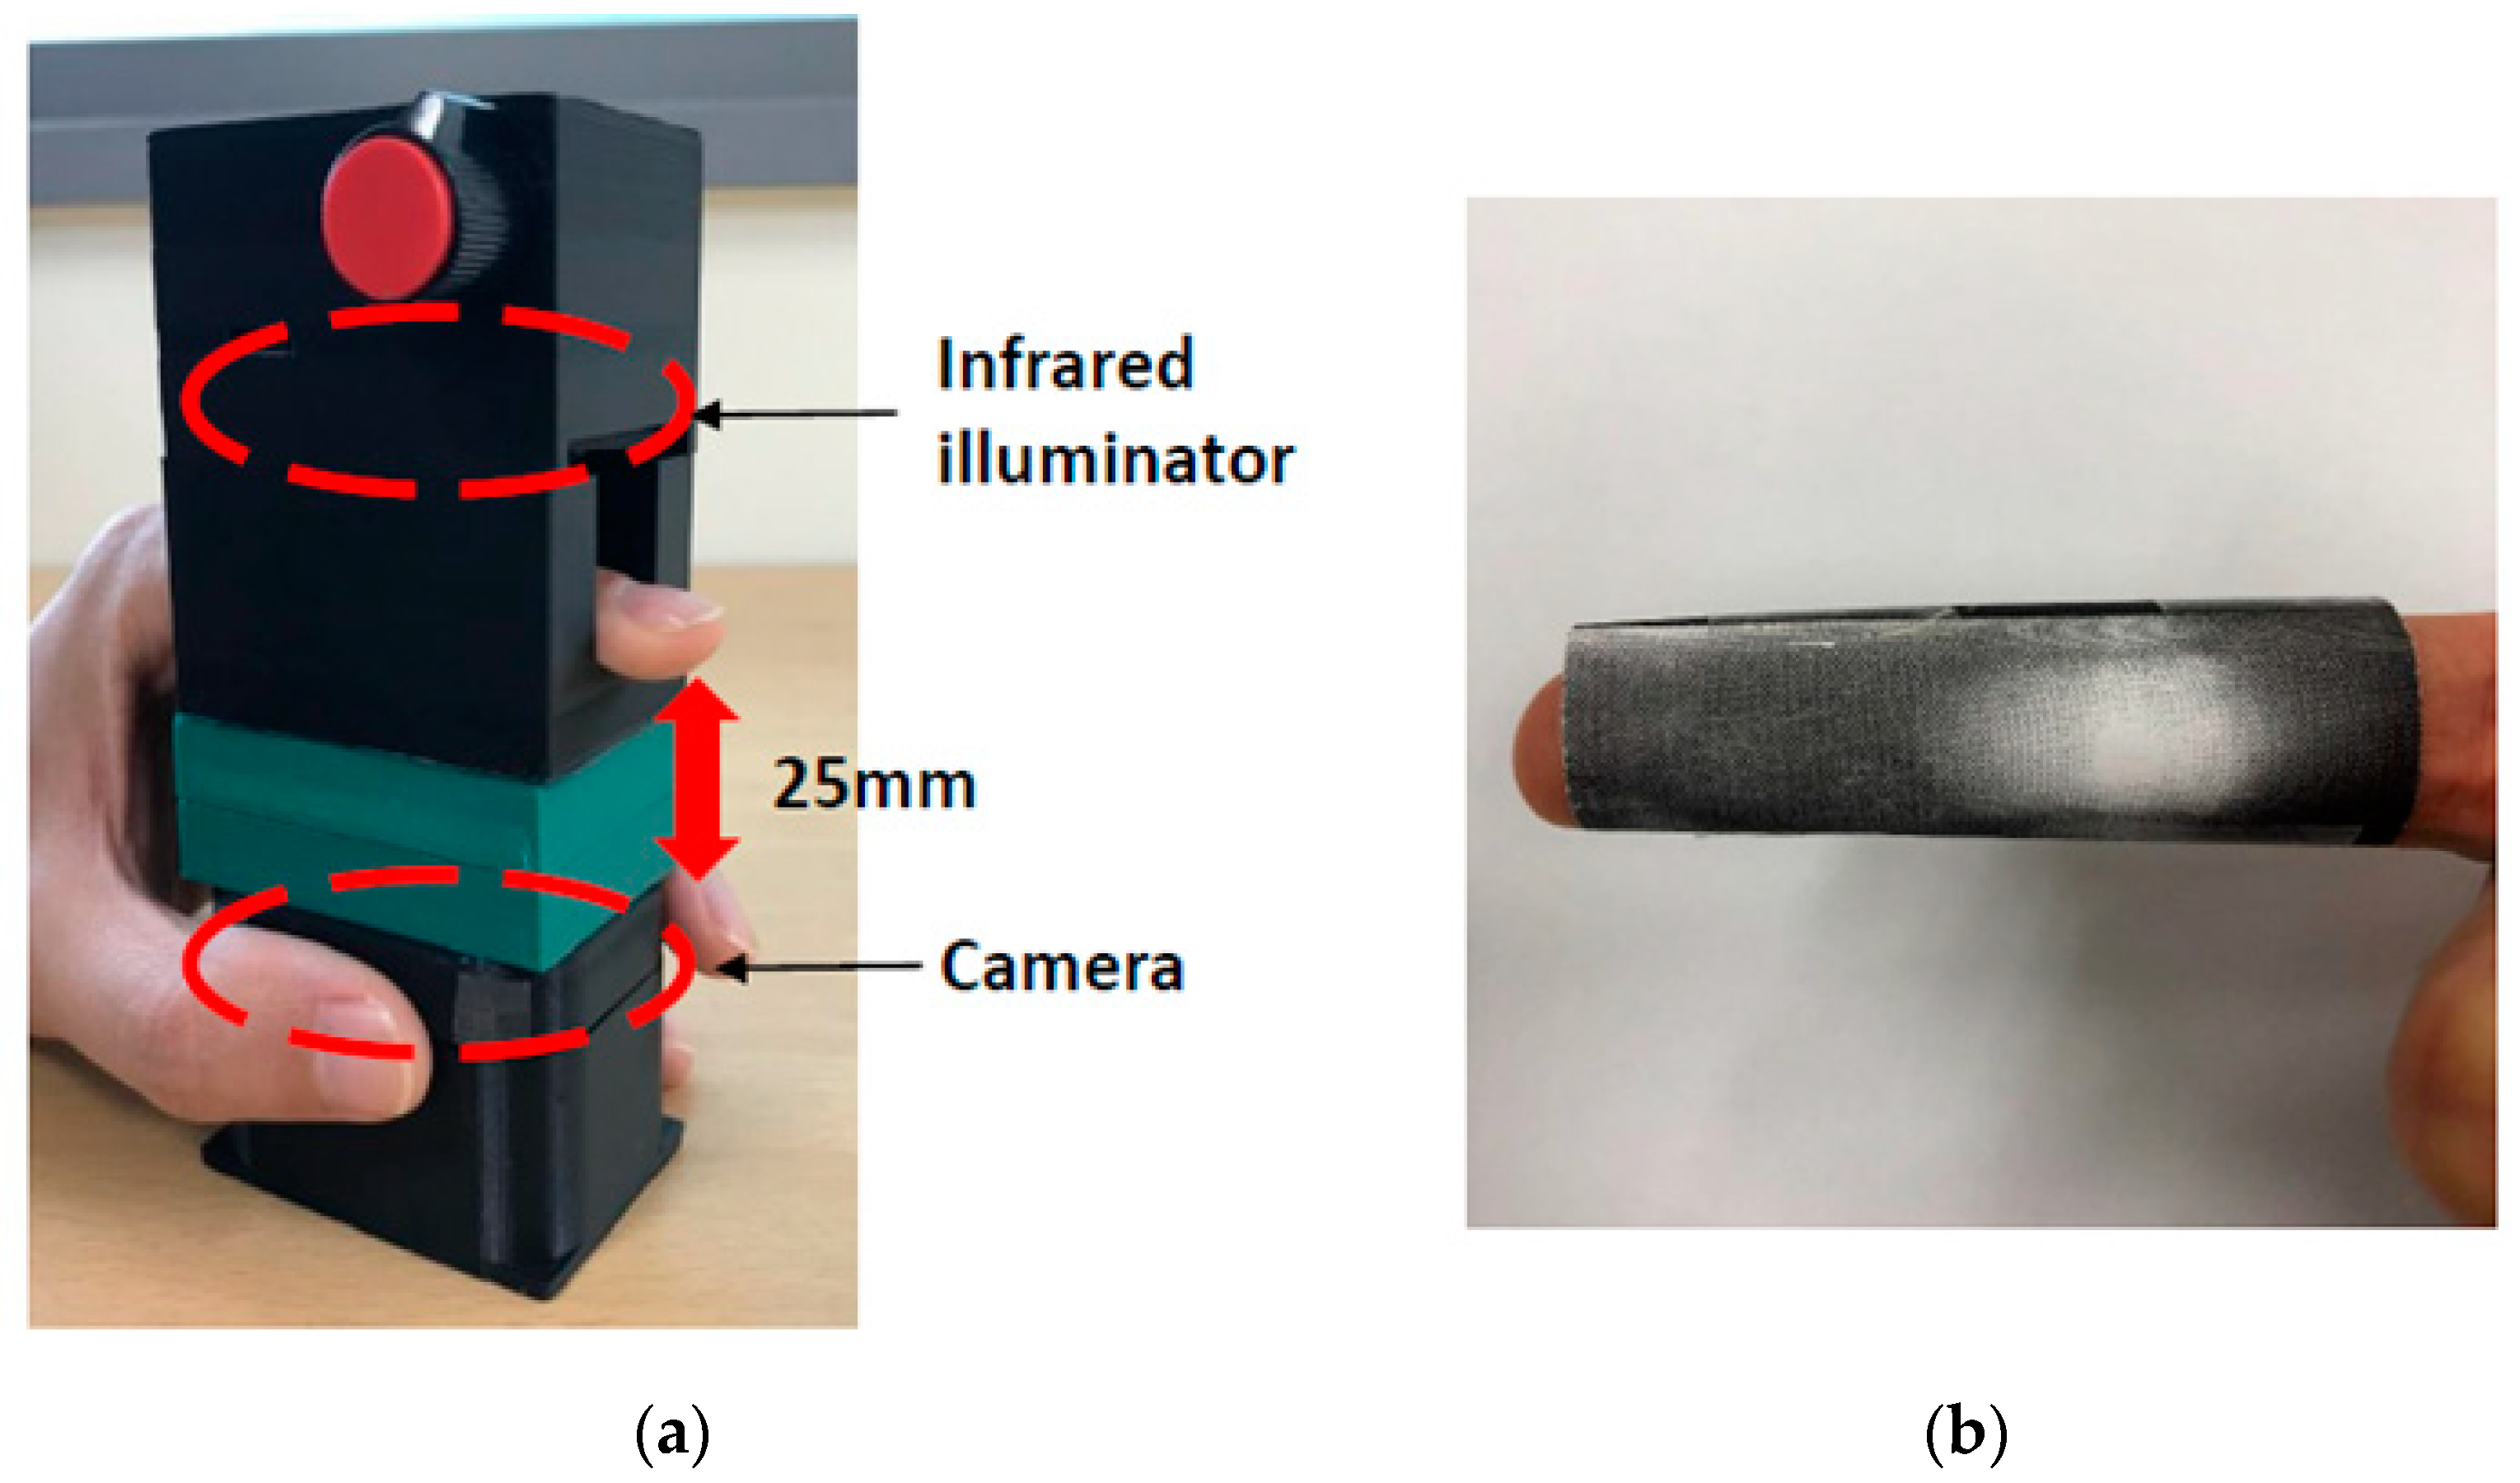
2.1.1. Camera Environment
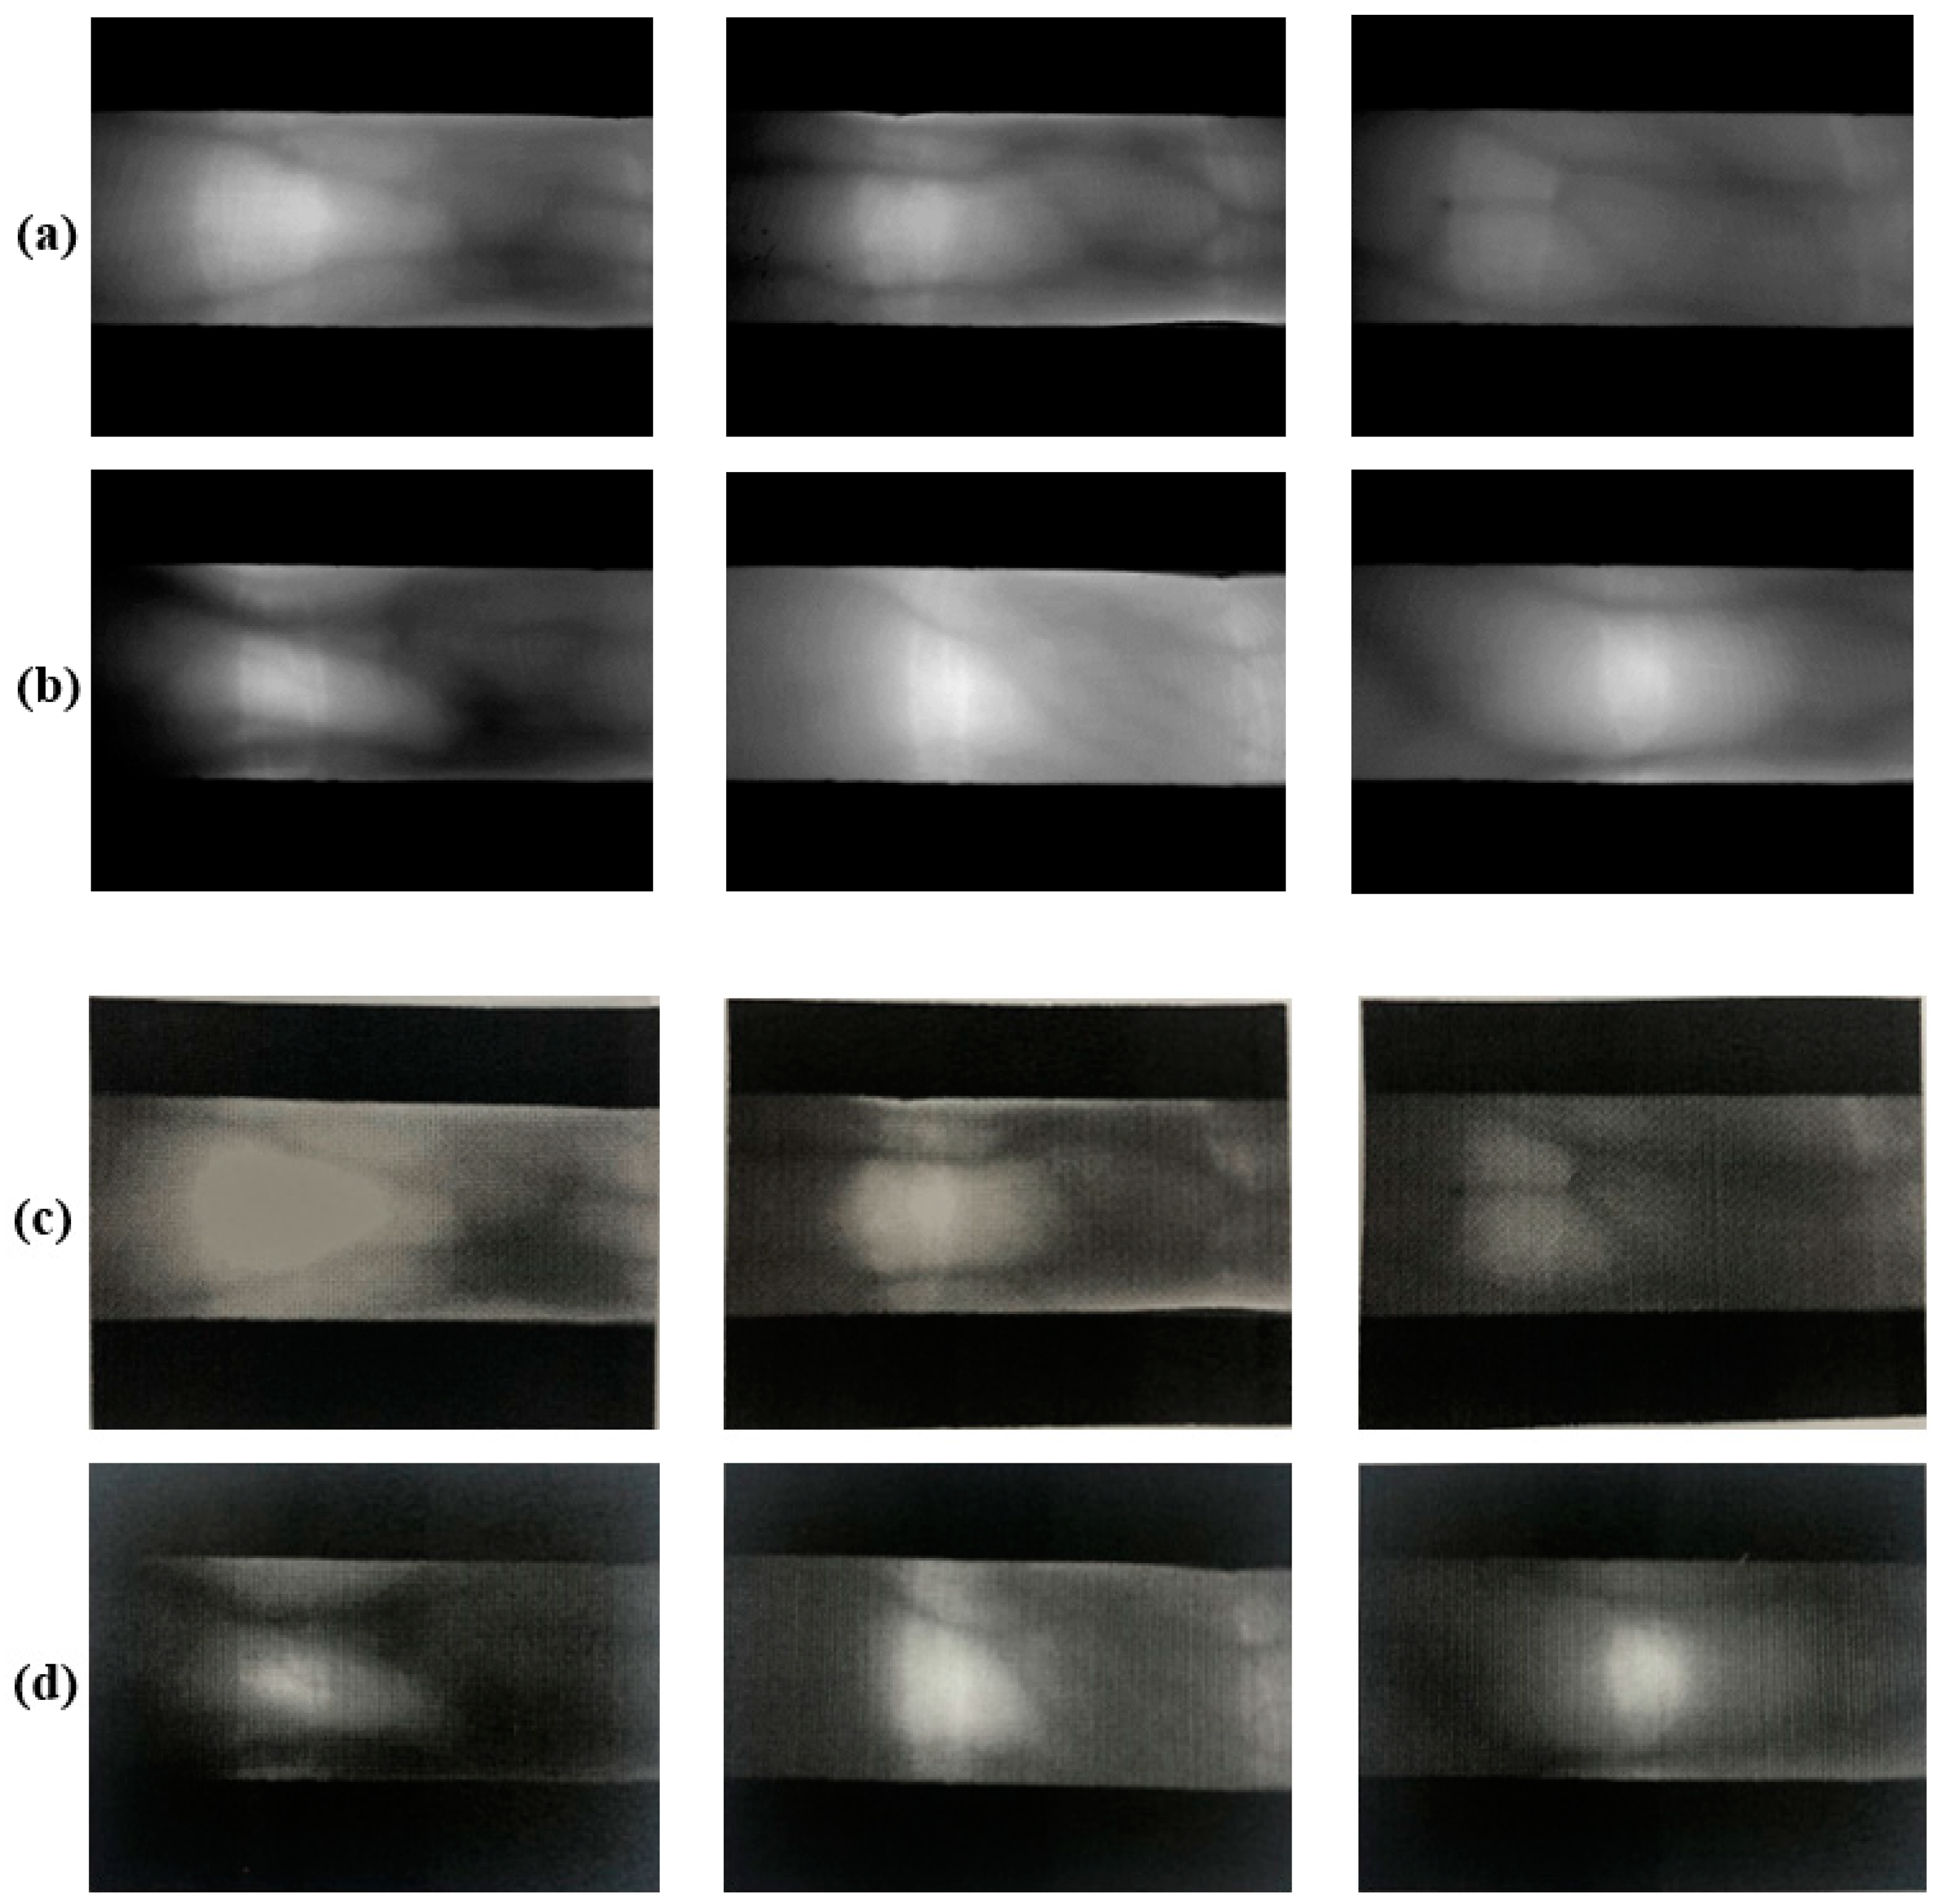
2.1.2. Design of Our Own Database
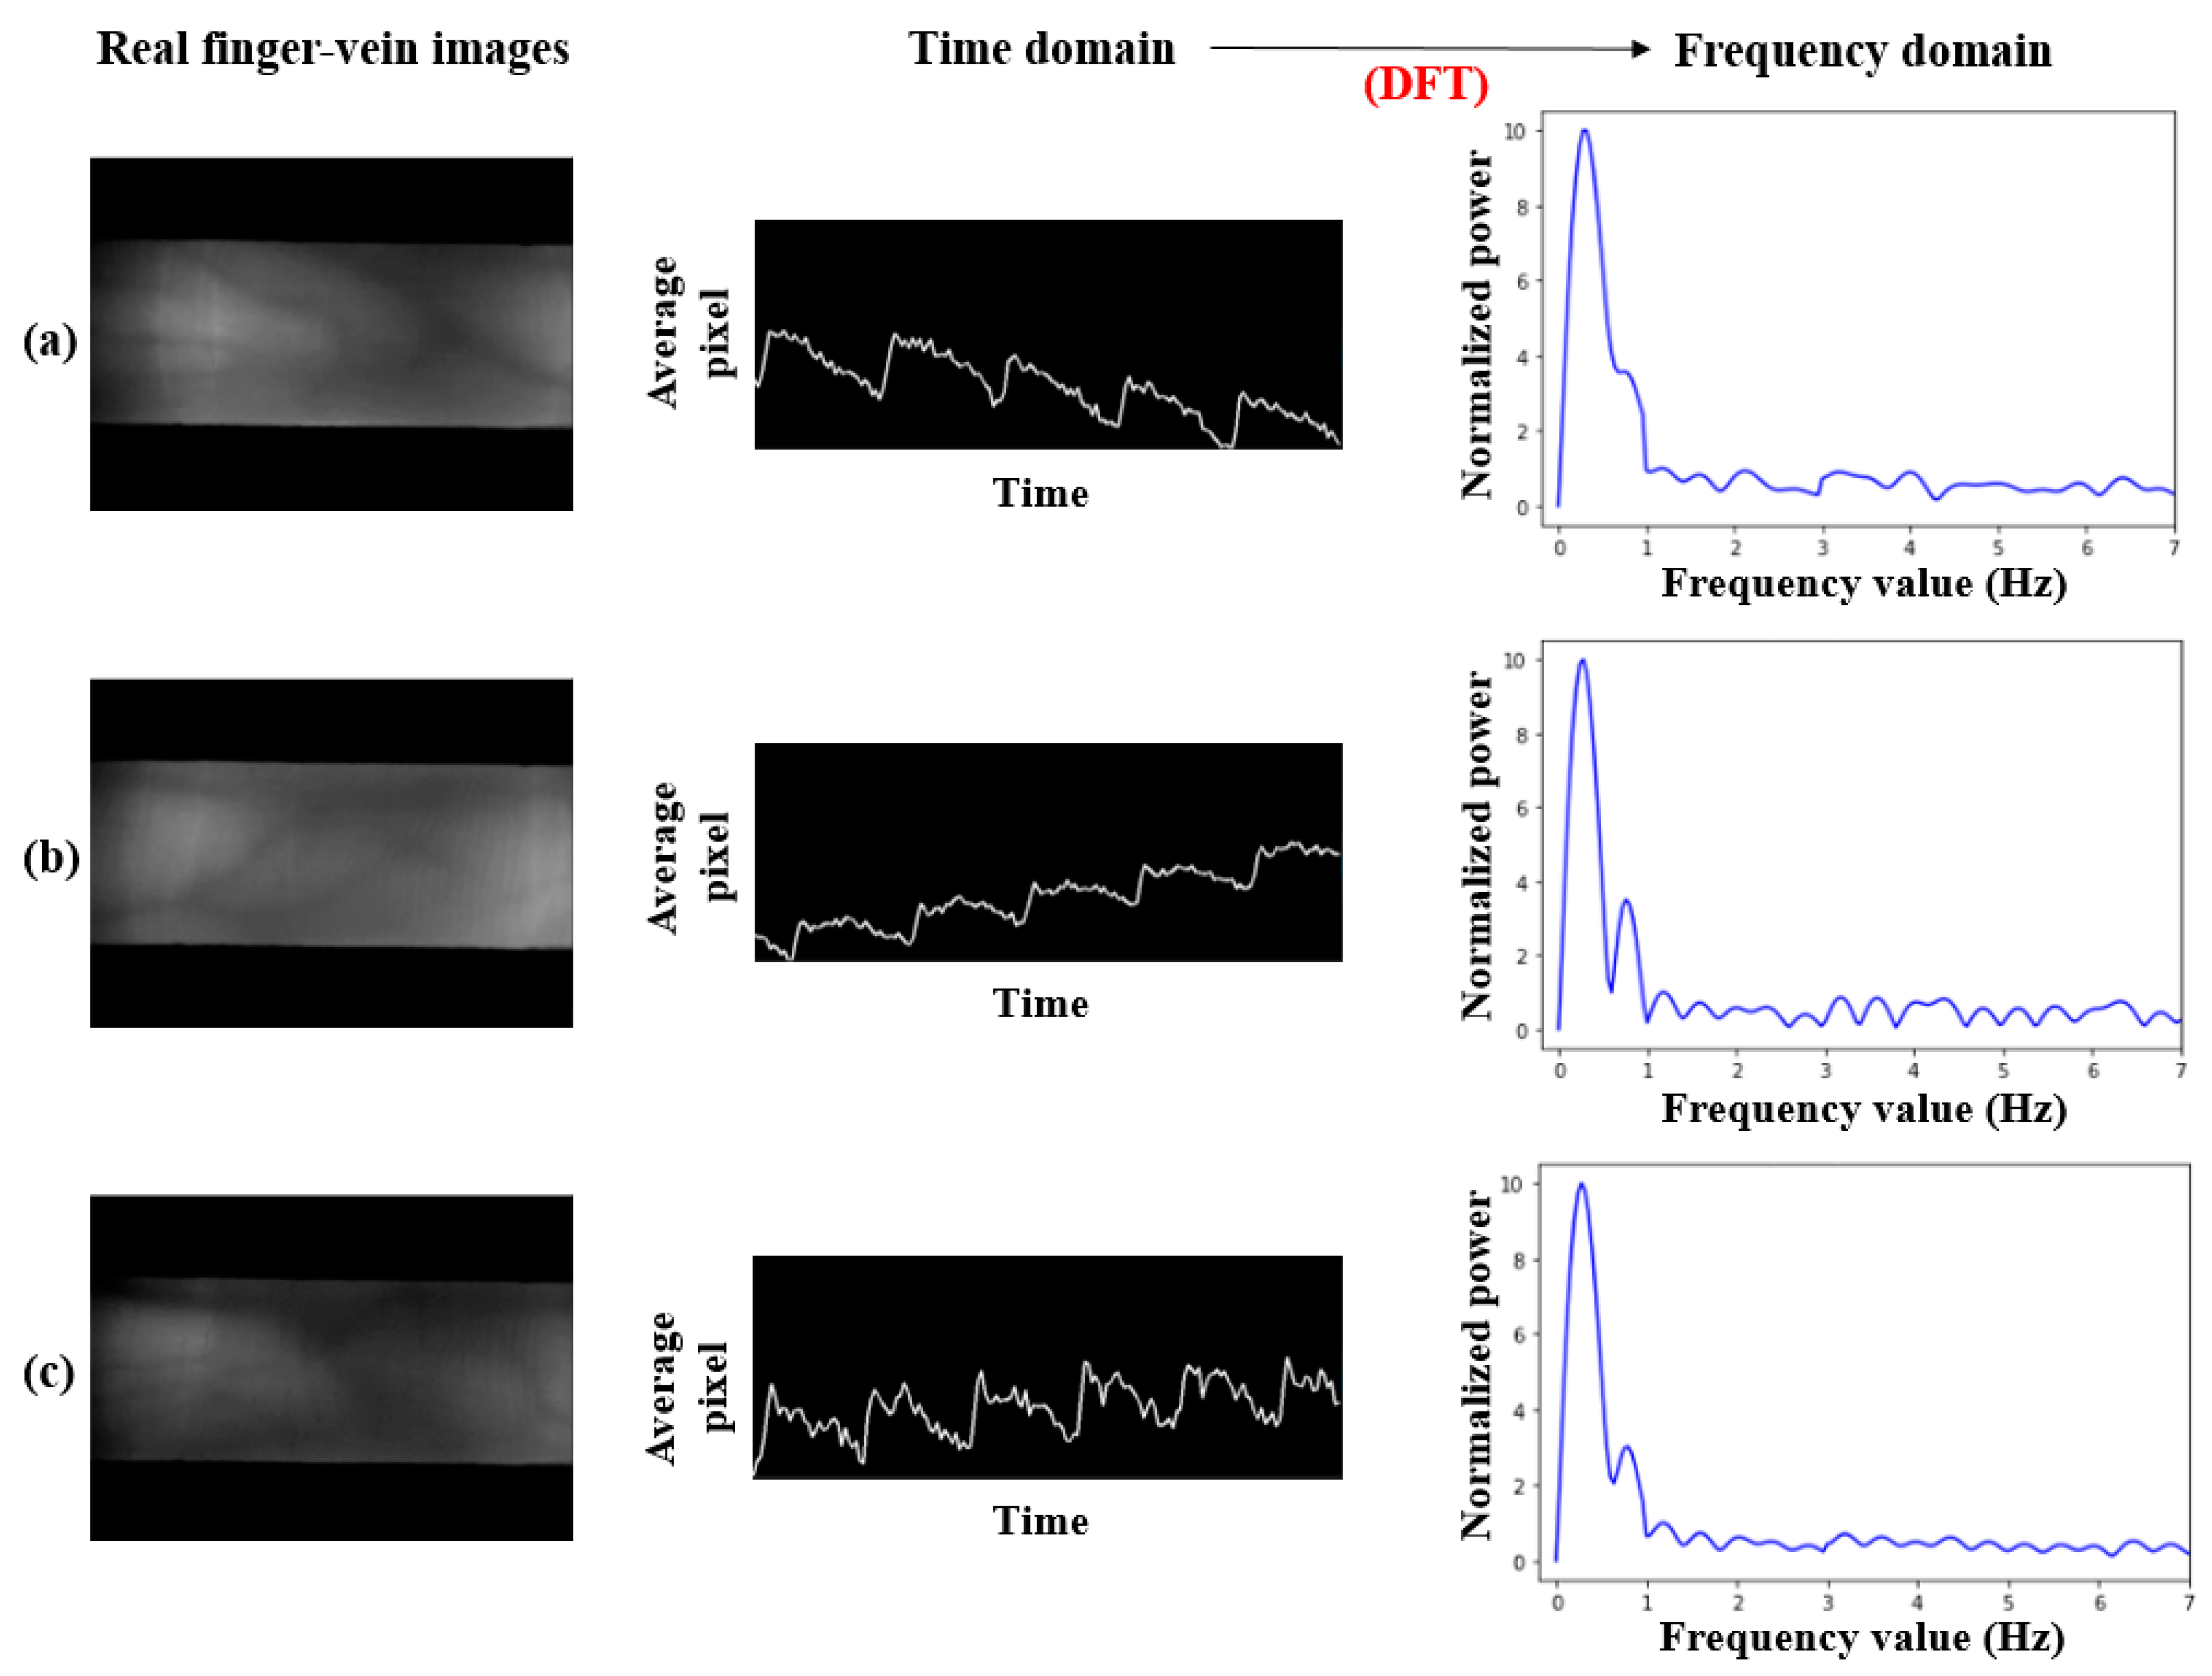
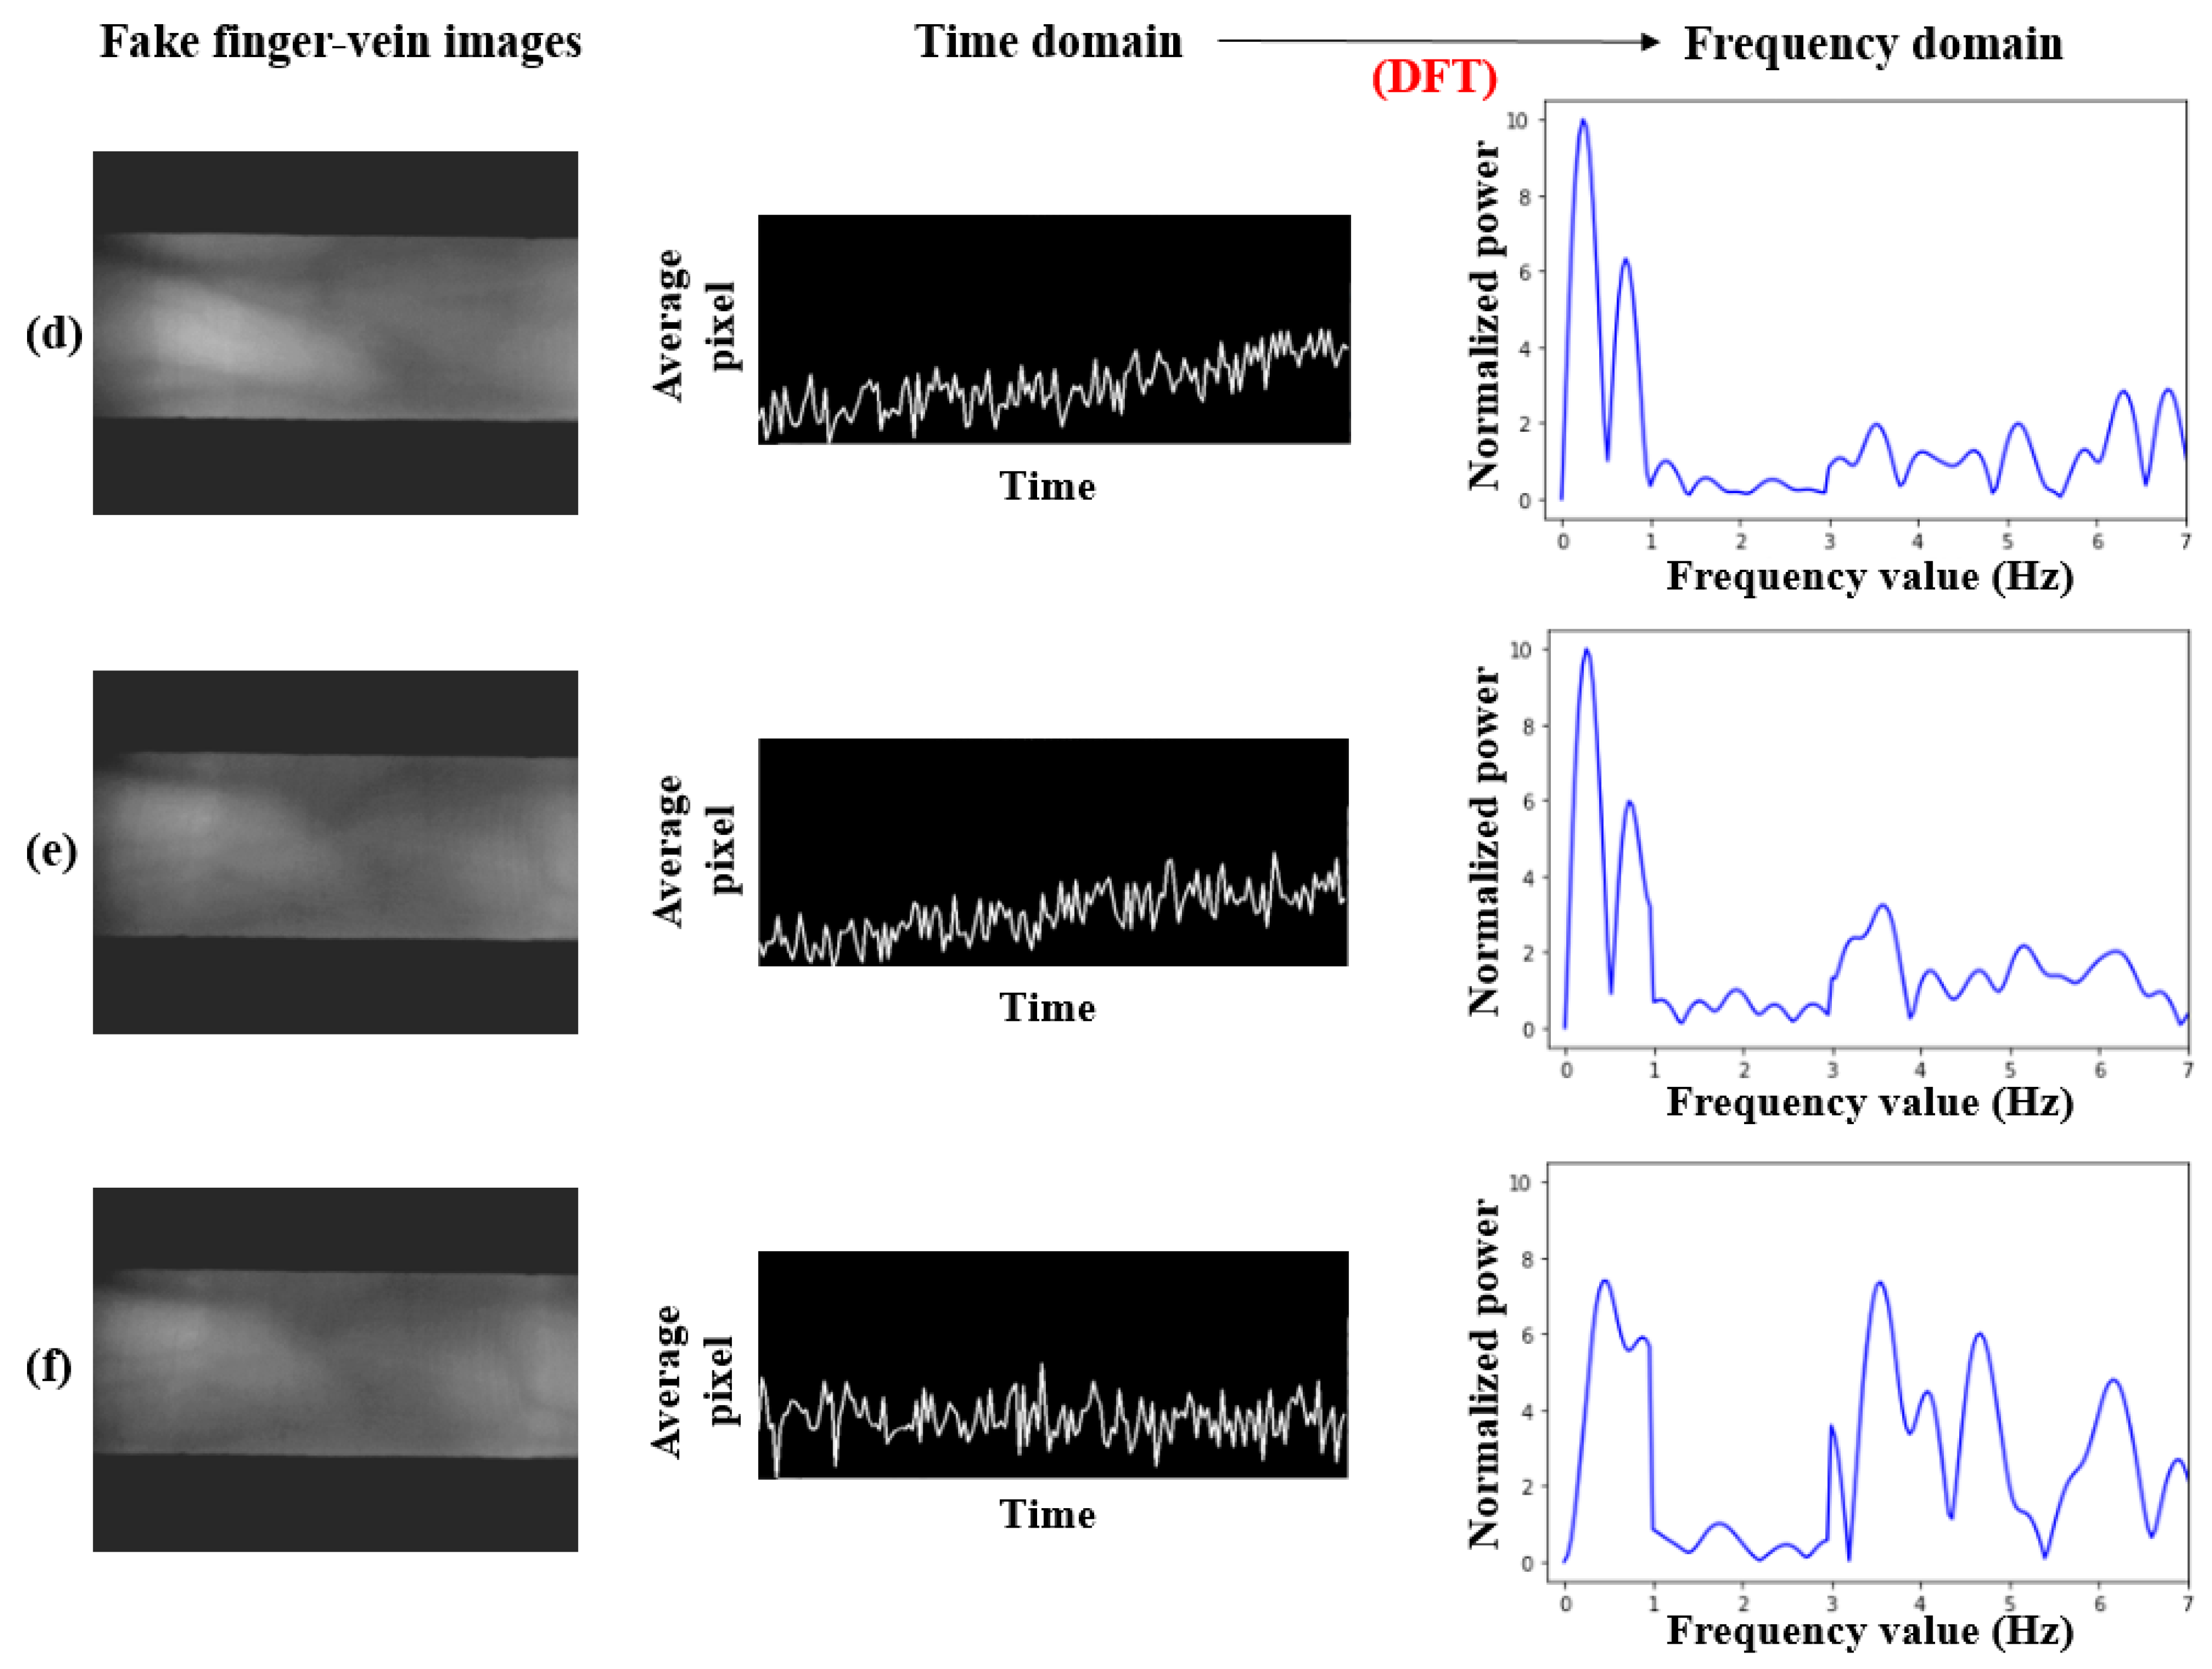
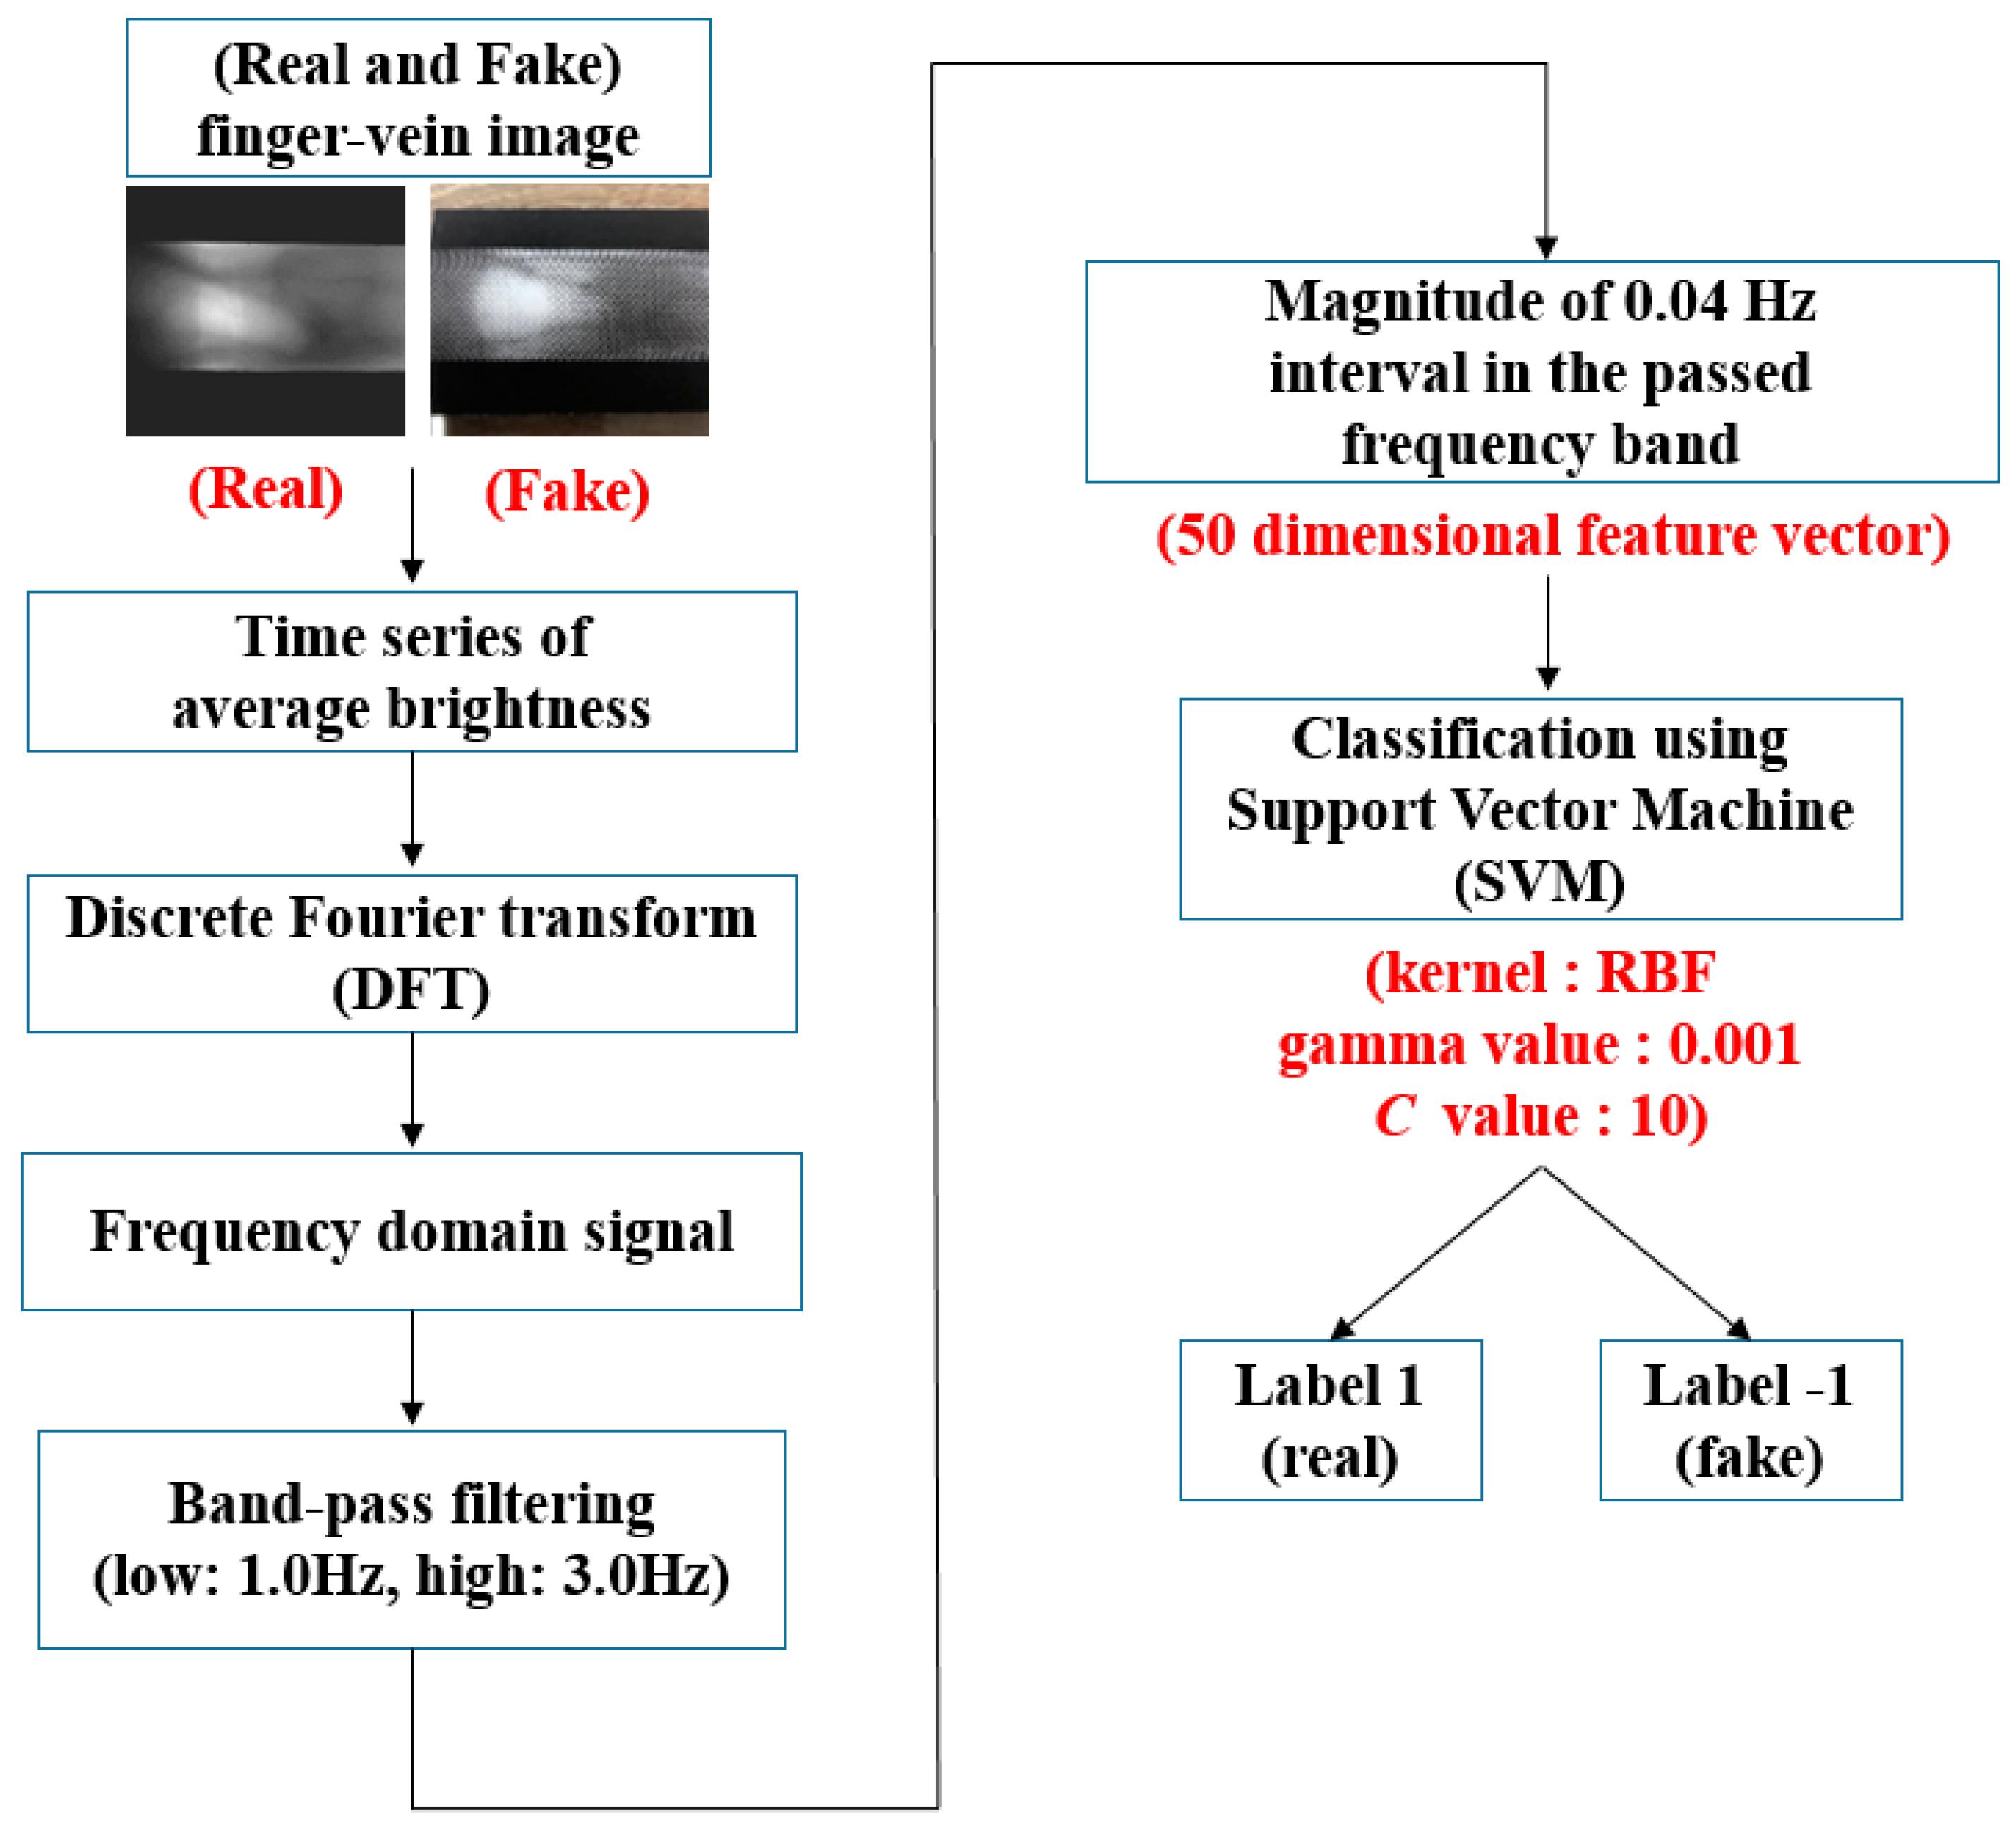
2.2. Proposed Method
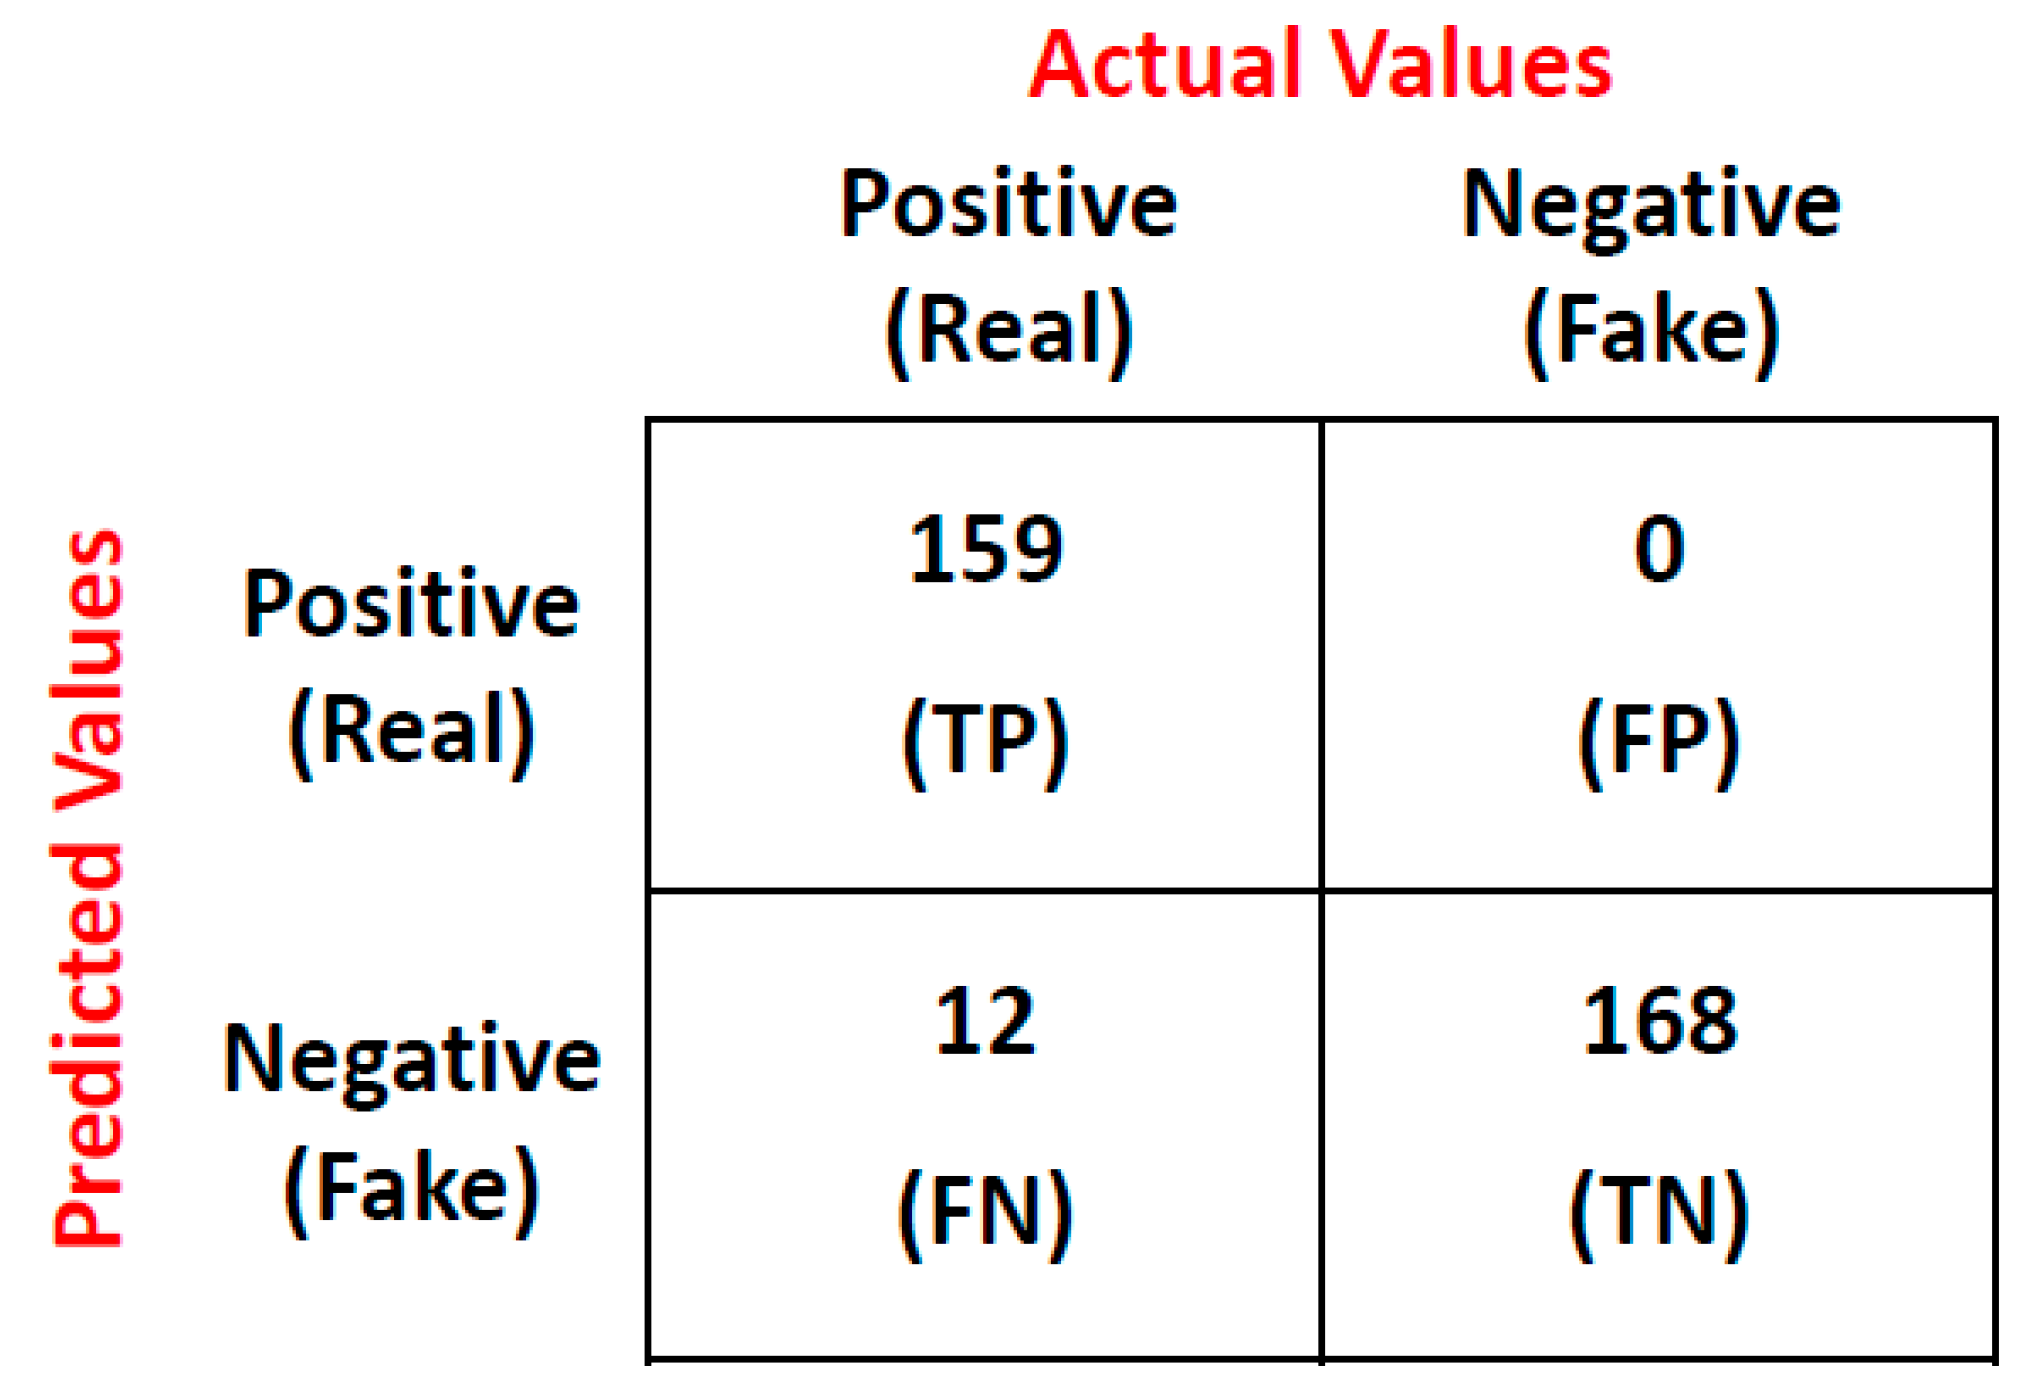
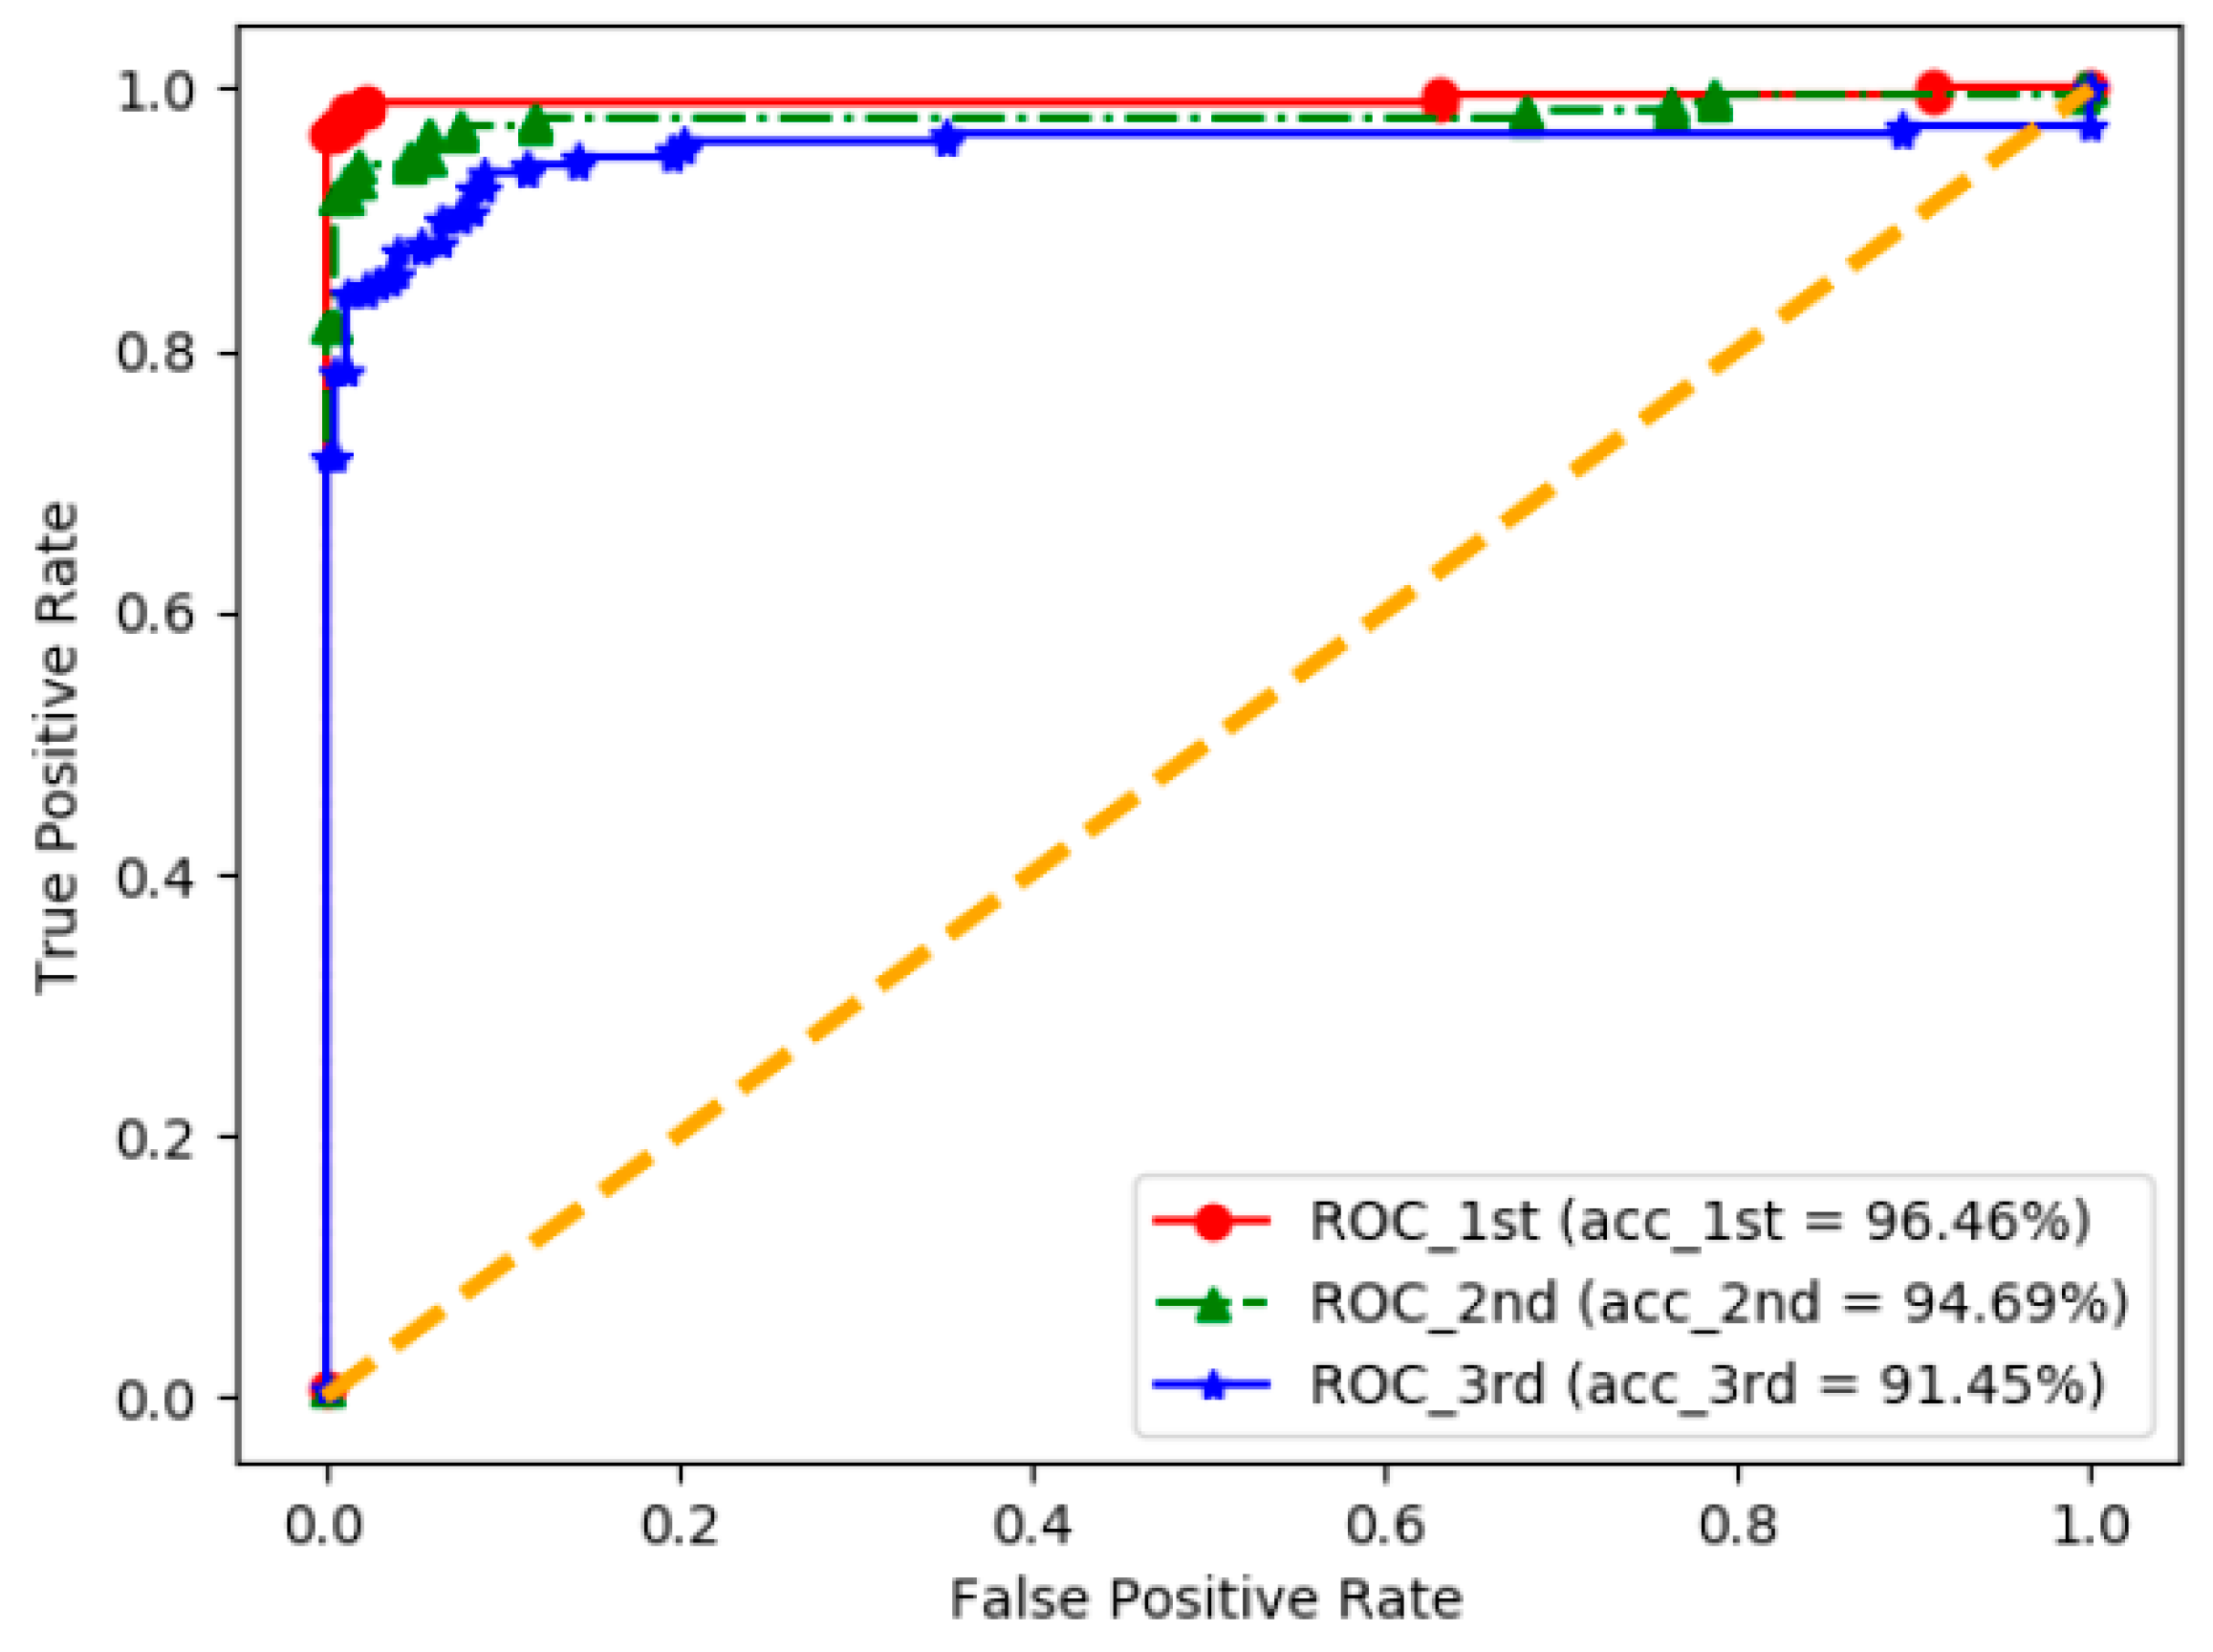
3. Results
4. Discussion
5. Conclusions
Author Contributions
Funding
Conflicts of Interest
References
- Waluś, M.; Kosmala, J.; Saeed, K. Finger vein pattern extraction algorithm. Int. Conf. Hybrid Artif. Intell. Syst. 2011, 404–411. [Google Scholar] [CrossRef]
- Liu, Y.; Ling, J.; Liu, Z.; Shen, J.; Gao, C. Finger vein secure biometric template generation based on deep learning. Soft Comput. 2018, 22, 2257–2265. [Google Scholar] [CrossRef]
- Nguyen, D.T.; Park, Y.H.; Shin, K.Y.; Kwon, S.Y.; Lee, H.C.; Park, K.R. Fake finger-vein image detection based on Fourier and wavelet transforms. Digit. Signal Process. 2013, 23, 1401–1413. [Google Scholar] [CrossRef]
- Yang, J.; Shi, Y.; Yang, J. Personal identification based on finger-vein features. Comput. Hum. Behav. 2011, 27, 1565–1570. [Google Scholar] [CrossRef]
- Wang, K.; Ma, H.; Popoola, O.P.; Liu, J. Biometrics; Yang, G., Ed.; Intech: Rijeka, Croatia, 2010; pp. 31–53. [Google Scholar]
- Yang, L.; Yang, G.; Yin, Y.; Zhou, L. A survey of finger vein recognition. Lect. Notes Comput. Sci. 2014, 8833, 234–243. [Google Scholar] [CrossRef]
- Mulyono, D.; Jinn, H.S. A study of finger vein biometric for personal identification. In Proceedings of the 2008 International Symposium on Biometrics and Security Technologies, Islamabad, Pakistan, 23–24 April 2008; pp. 1–8. [Google Scholar] [CrossRef]
- Rosdi, B.A.; Shing, C.W.; Suandi, S.A. Finger vein recognition using local line binary pattern. Sensors 2011, 11, 11357–11371. [Google Scholar] [CrossRef] [PubMed]
- Lee, E.C.; Park, K.R. Restoration method of skin scattering blurred vein image for finger vein recognition. Electron. Lett. 2009, 45, 1074–1076. [Google Scholar] [CrossRef]
- Lu, Y.; Yoon, S.; Park, D.S. Finger vein identification system using two cameras. Electron. Lett. 2014, 50, 1591–1593. [Google Scholar] [CrossRef]
- Hadid, A. Face biometrics under spoofing attacks: Vulnerabilities, countermeasures, open issues, and research directions. Comput. Vis. Pattern Recognit. Workshops 2014, 113–118. [Google Scholar] [CrossRef]
- Raghavendra, R.; Busch, C. Presentation attack detection algorithms for finger vein biometrics: A comprehensive study. In Proceedings of the Signal-Image Technology & Internet-Based Systems (SITIS), Bangkok, Thailand, 23–27 November 2015; pp. 628–632. [Google Scholar] [CrossRef]
- Huang, C.L.; Wang, C.J. A GA-based feature selection and parameters optimization for support vector machines. Expert Syst. Appl. 2006, 31, 231–240. [Google Scholar] [CrossRef]
- Lin, S.W.; Lee, Z.J.; Chen, S.C.; Tseng, T.Y. Parameter determination of support vector machine and feature selection using simulated annealing approach. Appl. Soft Comput. 2008, 8, 1505–1512. [Google Scholar] [CrossRef]
- Wang, J.; Wu, X.; Zhang, C. Support vector machines based on K-means clustering for real-time business intelligence systems. Int. J. Bus. Intell. Data Min. 2005, 1, 54–64. [Google Scholar] [CrossRef]
- Yang, C.; Odvody, G.; Fernandez, C.; Landivar, J.; Minzenmayer, R.; Nichols, R. Evaluating unsupervised and supervised image classification methods for mapping cotton root rot. Precis. Agriculture. 2015, 16, 201–215. [Google Scholar] [CrossRef]
- Keerthi, S.S.; Lin, C.J. Asymptotic behaviors of support vector machines with Gaussian kernel. Neural Comput. 2003, 15, 1667–1689. [Google Scholar] [CrossRef] [PubMed]
- Zhou, D.X.; Jetter, K. Approximation with polynomial kernels and SVM classifiers. Adv. Comput. Math. 2006, 25, 323–344. [Google Scholar] [CrossRef]
- Lin, H.T.; Lin, C.J. A study on sigmoid kernels for SVM and the training of non-PSD kernels by SMO-type methods. Submitt. Neural Comput. 2003, 3, 1–32. [Google Scholar]
- Powers, D.M. Evaluation: From precision, recall and F-measure to ROC, informedness, markedness and correlation. Mach. Learn. Technol. 2011, 2, 37–63. [Google Scholar]
- Fawcett, T. An introduction to ROC analysis. Pattern Recognit. Lett. 2006, 27, 861–874. [Google Scholar] [CrossRef]
- Nguyen, D.T.; Yoon, H.S.; Pham, T.D.; Park, K.R. Spoof Detection for Finger-Vein Recognition System Using NIR Camera. Sensors 2017, 17, 2261. [Google Scholar] [CrossRef] [PubMed]


| Database | Explanation |
|---|---|
| Real video | 20 people × 4 fingers = 579 real video clips From the index and middle fingers (divided into 150 frames overlapping 100 frames) |
| Fake video | Using a high-resolution printer Printed on an A4 paper 20 people × 4 fingers = 560 fake video clips From the index and middle fingers (divided into 150 frames overlapping 100 frames) |
| Total | Real video clips: 579 Fake video clips: 560 Total video clips: 1139 |
| Kernel | Expression |
|---|---|
| Linear | |
| RBF | , |
| Polynomial | , |
| Sigmoid |
| Kernel | Gamma Value | c-Value | F1-Score |
|---|---|---|---|
| Linear | - | 0.001 | 0.88 |
| RBF | 0.001 | 10 | 0.96 |
| Polynomial | 0.001 | 1000 | 0.87 |
| Sigmoid | 0.00001 | 1000 | 0.91 |
© 2019 by the authors. Licensee MDPI, Basel, Switzerland. This article is an open access article distributed under the terms and conditions of the Creative Commons Attribution (CC BY) license (http://creativecommons.org/licenses/by/4.0/).
Share and Cite
Bok, J.Y.; Suh, K.H.; Lee, E.C. Detecting Fake Finger-Vein Data Using Remote Photoplethysmography. Electronics 2019, 8, 1016. https://doi.org/10.3390/electronics8091016
Bok JY, Suh KH, Lee EC. Detecting Fake Finger-Vein Data Using Remote Photoplethysmography. Electronics. 2019; 8(9):1016. https://doi.org/10.3390/electronics8091016
Chicago/Turabian StyleBok, Jin Yeong, Kun Ha Suh, and Eui Chul Lee. 2019. "Detecting Fake Finger-Vein Data Using Remote Photoplethysmography" Electronics 8, no. 9: 1016. https://doi.org/10.3390/electronics8091016
APA StyleBok, J. Y., Suh, K. H., & Lee, E. C. (2019). Detecting Fake Finger-Vein Data Using Remote Photoplethysmography. Electronics, 8(9), 1016. https://doi.org/10.3390/electronics8091016