Article

A Deep Learning Approach to EMG-Based Classification of Gait Phases during Level Ground Walking

by
Christian Morbidoni
*,
Alessandro Cucchiarelli
,
Sandro Fioretti
and
Francesco Di Nardo
*
Department of Information Engineering, Università Politecnica delle Marche, 60100 Ancona, Italy
*
Authors to whom correspondence should be addressed.
Electronics 2019, 8(8), 894; https://doi.org/10.3390/electronics8080894
Submission received: 30 July 2019 / Revised: 8 August 2019 / Accepted: 9 August 2019 / Published: 14 August 2019
(This article belongs to the Special Issue Computational Intelligence in Healthcare)

Abstract

:
Correctly identifying gait phases is a prerequisite to achieve a spatial/temporal characterization of muscular recruitment during walking. Recent approaches have addressed this issue by applying machine learning techniques to treadmill-walking data. We propose a deep learning approach for surface electromyographic (sEMG)-based classification of stance/swing phases and prediction of the foot–floor-contact signal in more natural walking conditions (similar to everyday walking ones), overcoming constraints of a controlled environment, such as treadmill walking. To this aim, sEMG signals were acquired from eight lower-limb muscles in about 10.000 strides from 23 healthy adults during level ground walking, following an eight-shaped path including natural deceleration, reversing, curve, and acceleration. By means of an extensive evaluation, we show that using a multi layer perceptron to learn hidden features provides state of the art performances while avoiding features engineering. Results, indeed, showed an average classification accuracy of 94.9 for learned subjects and 93.4 for unlearned ones, while mean absolute difference ( ± S D ) between phase transitions timing predictions and footswitch data was 21.6 ms and 38.1 ms for heel-strike and toe off, respectively. The suitable performance achieved by the proposed method suggests that it could be successfully used to automatically classify gait phases and predict foot–floor-contact signal from sEMG signals during level ground walking.

1. Introduction

Electromyography is a widely-accepted tool able to provide an essential and original contribution to the characterization of the neuromuscular system [1]. In particular, surface electromyography (sEMG) is acknowledged as a non-invasive approach, specifically suitable to monitor muscle activity during dynamic tasks, such as walking [2,3,4]. In order to achieve a spatial/temporal characterization of muscular recruitment during walking, gait events, such as the instant of foot-floor contact and ground clearance, need to be assessed. This process starts from the identification of the two main gait phases, stance and swing. The stance phase designates the entire period during which the foot is on the ground, while the swing phase is characterized by the time the foot is in the air for limb advancement. The transitions between a swing and the subsequent stance phase is commonly referred to as heel-strike (HS), while the transition between a stance and the subsequent swing phases is referred to as toe-off (TO). Stance and swing identify the functional subdivisions of total limb activity within the gait cycle [2], thus precisely identifying HS and TO events is important to analyze the gait activity. For this reason, sEMG signals are typically coupled with signals able to provide the synchronization of the gait cycle, such as signals from foot-switch sensors [5], pressure mats [6], stereo-photogrammetric systems [7], and inertial measurements units (accelerometers and gyroscopes) [8].
Stereo–photogrammetric systems and pressure mats are affected by different relevant issues: high costs of the instrumentation, limited number of cycles observed, and/or invasiveness of experimental set-up. The use of wearable sensors seems to mitigate the impact of the costs and to allow the identification of gait events in a suitable number of cycles. Even so, the problems of encumbrance and time-consuming experimental set-up are still relevant, especially for applications in pathology. Moreover, wearable sensors can require particular care for the correct placement and the need of specific calibration procedures, not consistent with the timing of clinical practice. Thus, the idea of overcoming all these limitations developing novel techniques able to detect and classify gait events from sEMG signal alone is indeed starting to catch on. This kind of approach may involve machine learning and deep learning techniques.

1.1. Aim of the Study

Classifying gait events is a typical task which could be addressed by machine learning and deep learning techniques. Many examples were reported in literature [9,10,11,12]. However, only few reports addressed the issue of gait-phase classification from sEMG signal only [13,14,15]. These very recent approaches were based on hand-crafted features extracted from sEMG signals during treadmill walking and were evaluated on a relatively small number of subjects (up to eight). Walking on a treadmill is known to affect gait performance, resulting in increased number of steps and cadence, decreased preferred walking speed, stride and stance-phase length, slightly decreased joint range of motion, and changes in EMG activation with respect to level ground walking [16,17,18,19]. Thus, the reliability of the above mentioned EMG-based classifiers of stance and swing phases [13,14,15] is limited to treadmill data and is not tested on ground-walking data. In addition, treadmill walking occurs in very controlled conditions, characterized by a high repeatability of spatial/temporal parameters (including stance and swing duration). In contrast, everyday walking is characterized by a wider variability of spatial/temporal parameters and sEMG signals introduced by deceleration, reversing, curves and acceleration [16,17,18,19]. This variability is expected to affect the performance of a possible stance/swing classification and the consequent prediction of temporal parameters, such as heel-strike and toe-off timing.
Therefore, the aim of the present study is to propose an artificial neural network (ANN)-based approach to classify gait events (proper stance and swing phases) and to predict foot-floor-contact signal from sEMG signals, in conditions similar to everyday walking. With “conditions similar to everyday walking” we mean that, differently from previous study where gait phases were classified in the very controlled conditions of treadmill walking [13,14,15], in the present study each subject walked on level ground following an eight-shaped path (Figure 1) which includes natural deceleration, reversing, curve, and acceleration.

1.2. Contributions

The main contributions of the present study are three:
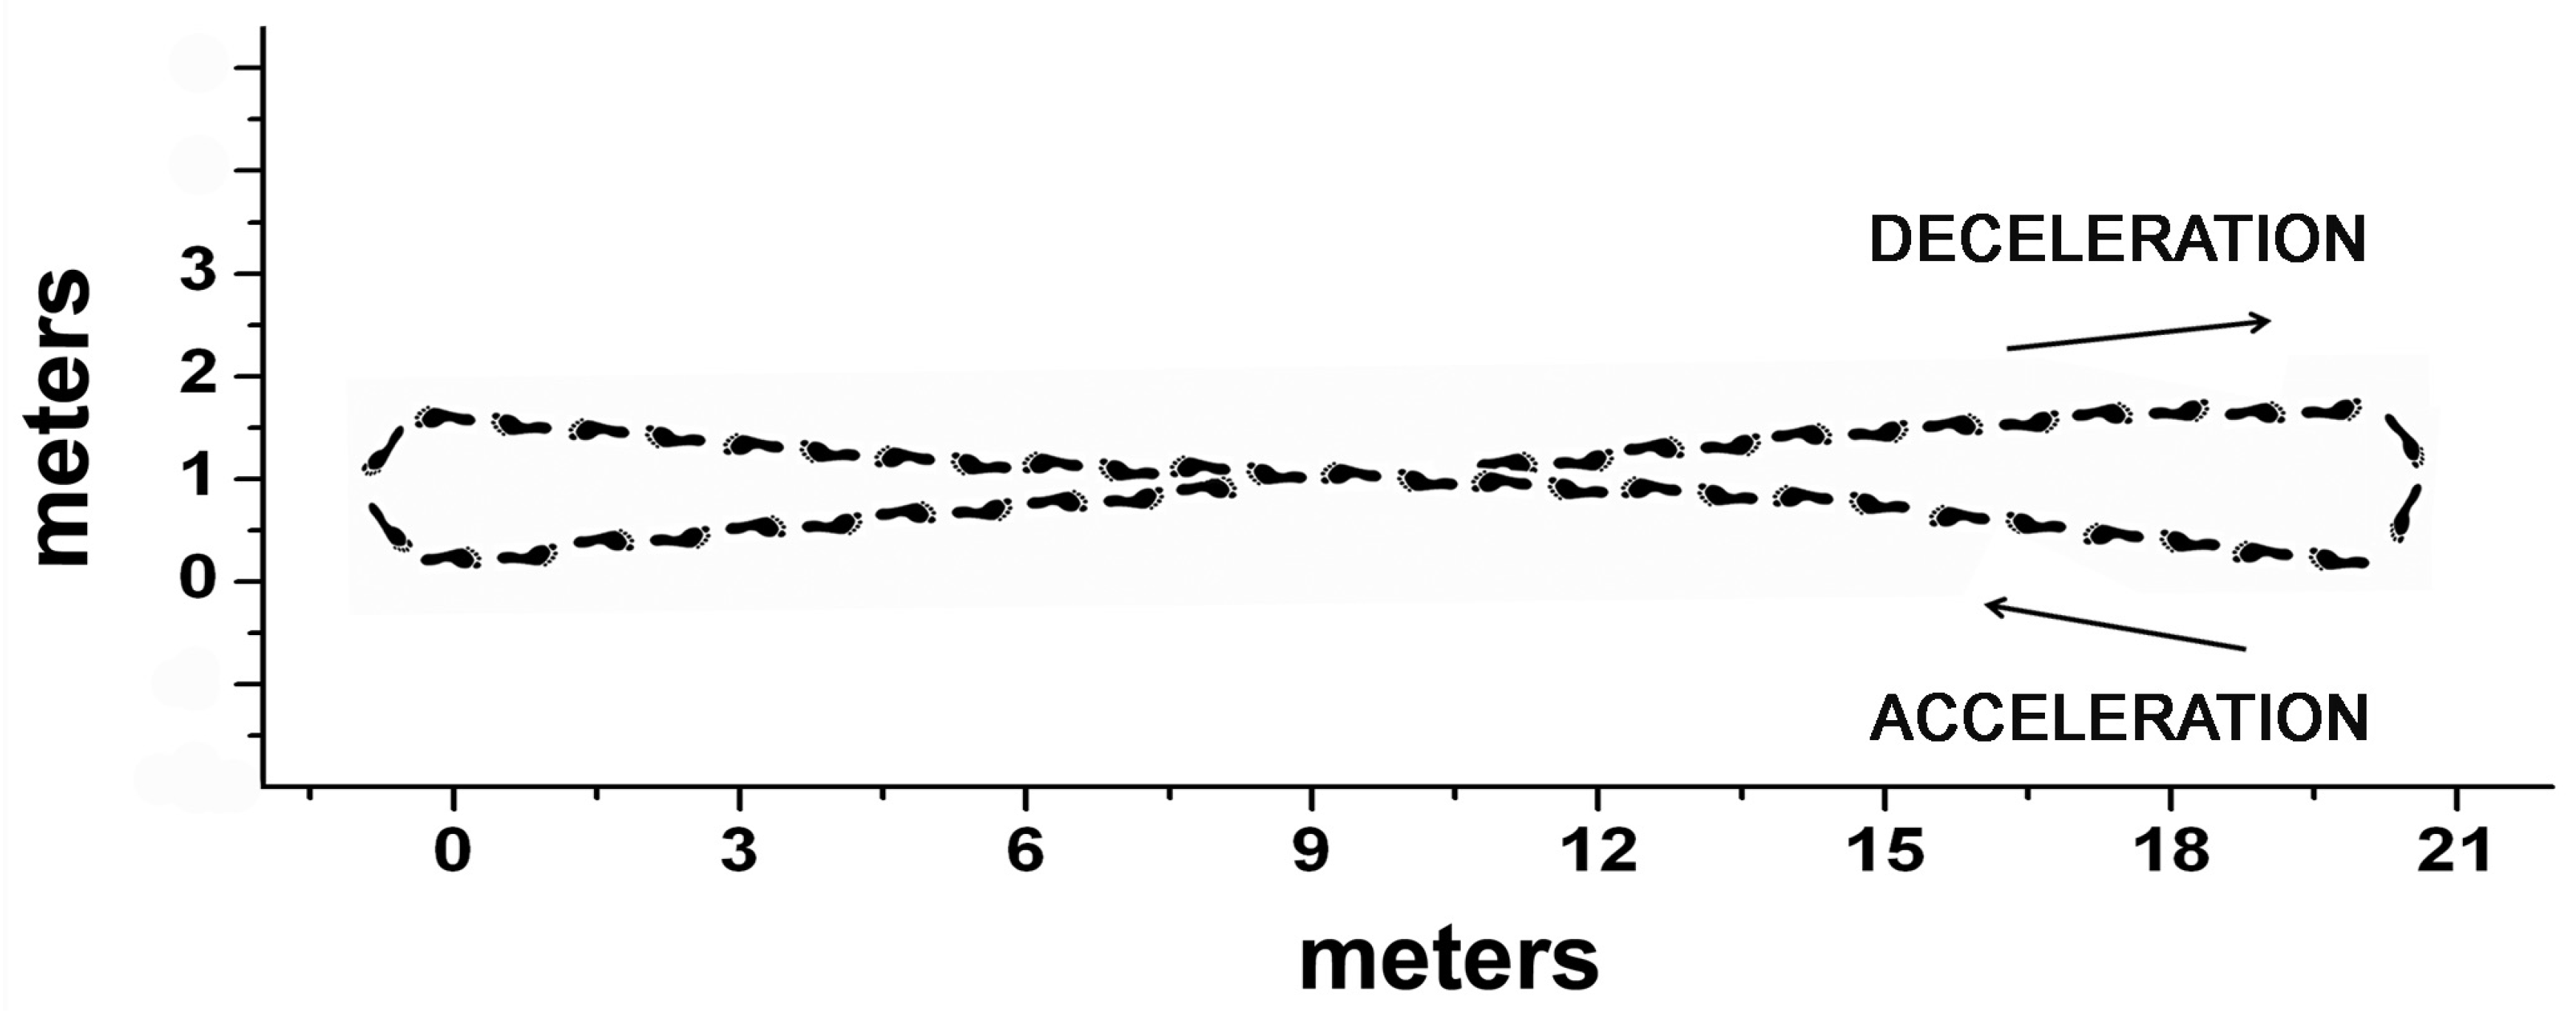
  • first, providing a classification of stance and swing phases and the prediction of foot-floor-contact signal in more natural walking conditions (similar to everyday walking), overcoming the limitations and the constraints of a controlled environment, such as treadmill walking;
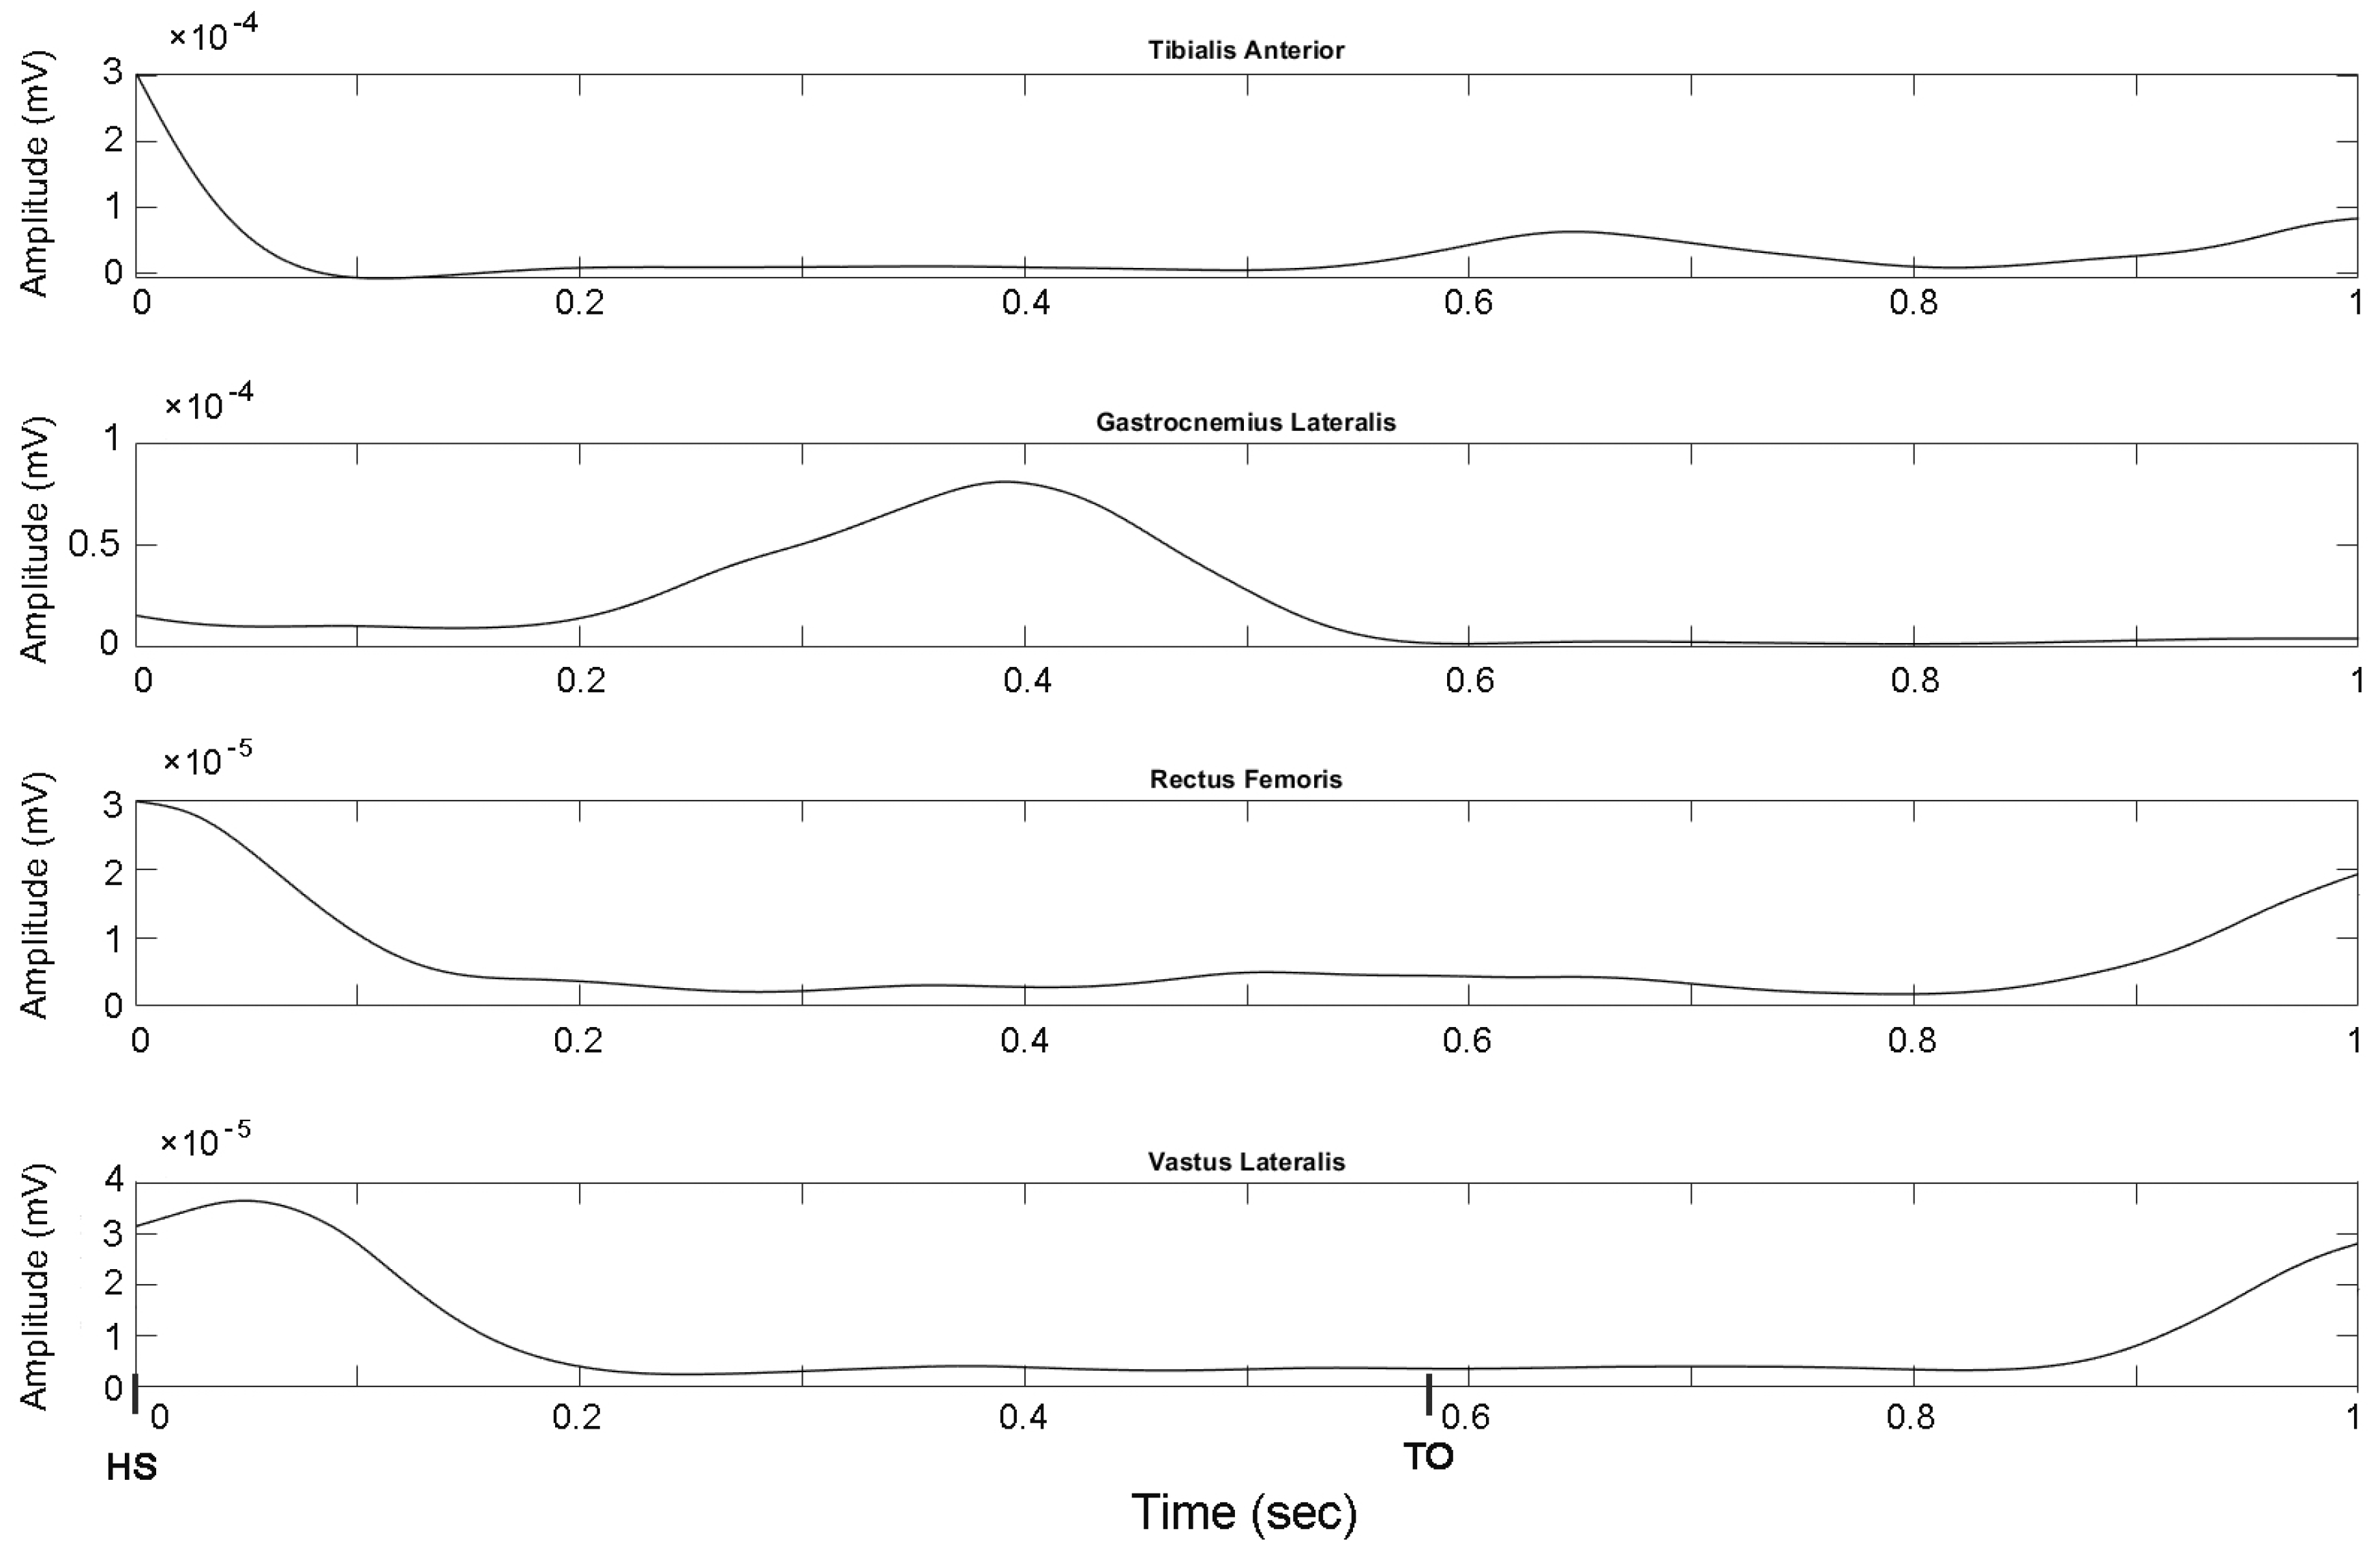
  • second, proposing a different approach to process the sEMG signal used to train deep neural networks: while previous studies [13,14,15] processed sEMG signals to extract time/frequency domain features which were used to feed the neural networks, the present study directly used the envelopes of the EMG signal to train the networks, attempting to automatically learn relevant higher level (hidden) features;
  • third, improving the reliability of the prediction of gait events (HS and TO) in unseen subjects reported in literature [13], despite the challenging condition of everyday walking. This has been achieved by both enlarging the testing data (four-minute ground walking of 23 different subjects) and decreasing the average error in the prediction of HS and TO timing.
The remainder of this paper is organized as follows. Section 2 reports a brief review of the related works. Section 3 describes the dataset, the acquisition and the pre-processing of the signals, and the gait- phase classification by deep learning. Section 4 reports and discusses the results. Section 5 concludes the present study.

2. Related Works

Machine learning techniques, such as ANNs, are typically used for analyzing and classifying large amount of data and complex signals. Many applications of machine learning approaches in health care were reported [20,21,22]. Similar approaches were proven to be reliable also in classifying EMG signals during different tasks. Wavelet neural network and multi-layer perceptrons were used to handle EMG signals in order to identify neuromuscular disorders [23,24]. Learning vector quantization, support vector machine, and Levenberg–Marquardt-based networks were applied to EMG signals for classifying hand-motion patterns [25,26,27]. EMG-based unsupervised competitive learning techniques were employed for the identification of the muscle activity during pregnancy [28]. Efforts have been made to adapt these techniques for walking-task characterization: different machine learning approaches were applied to gait analysis data by Joyseeree et al. for disease identification [9]. Kaczmarczyk et al. [11] applied ANNs for gait classification in post stroke patients. Wang and Zieliska [12] designed an EMG-based method for detecting the variability in gait features depending on footwear, by applying vector quantization classifying networks and clustering competitive networks. Zou et al. [10] performed gait recognition analyzing inertial sensor data by means of deep convolutional neural network (and deep recurrent neural network approaches.
In particular, literature reports only few attempts to provide a machine learning approach which used the sEMG signal only for the classification of stance and swing phases [13,14,15]. In [15] a set of time-domain features is extracted from EMG signal segments and hidden Markov models are used to individuate stance and swing phases. Evaluation is performed on a single subject walking on a treadmill, reporting a maximum classification accuracy of 91.08%. In [14] a novel bilateral feature is extracted from the EMG signal and is used to classify stance and swing phases by training a support vector classifier. The method is evaluated on two subjects walking on a treadmill at different speeds. The best reported accuracy (96%) corresponds to the case where a subset of the gait cycles from a subject are used to classify the entire walk of the same subject. In [13] a set of time-domain features are extracted from EMG signals and fed to a single hidden layer neural network to classify gait phases. This study is the most similar to ours, as it explicitly targets unlearned subjects, i.e., subjects not used as inputs during the training phase and attempts to predict timing of phase transitions. However, the data used is derived from 8 subjects walking on a treadmill and the evaluation of phase transition detection is performed on only 5 s of the walking of a single unlearned subject, reporting a mean average error of 35 ± 25 ms for HS and 49 ± 15 ms for TO. All these recent approaches were based on hand-crafted features extracted from sEMG signals during treadmill walking and were evaluated on relatively small populations of subjects (up to eight).

3. Materials and Methods

3.1. Dataset

The dataset included signals recorded from 23 healthy adults (12 females and 11 males), acquired in the Movement Analysis Laboratory of Università Politecnica delle Marche, Ancona, Italy. Mean (±SD) characteristics were: age = 23.8 ± 1.9 years; height = 173 ± 10 cm; mass = 63.3 ± 12.4 kg; body mass index (BMI) = 20.8 ± 2.1 kg/m2. None of the subjects presented any pathological condition or had undergone orthopedic surgery that might have affected lower limb mechanics. Therefore, subjects with joint pain, neurological pathologies, orthopedic surgery, abnormal gait or a body mass index (BMI) higher than 25 (overweight and obese) were not recruited. The research was undertaken in compliance with the ethical principles of the Helsinki Declaration and was approved by an institutional expert committee. Participants signed informed consent prior to the beginning of the test.

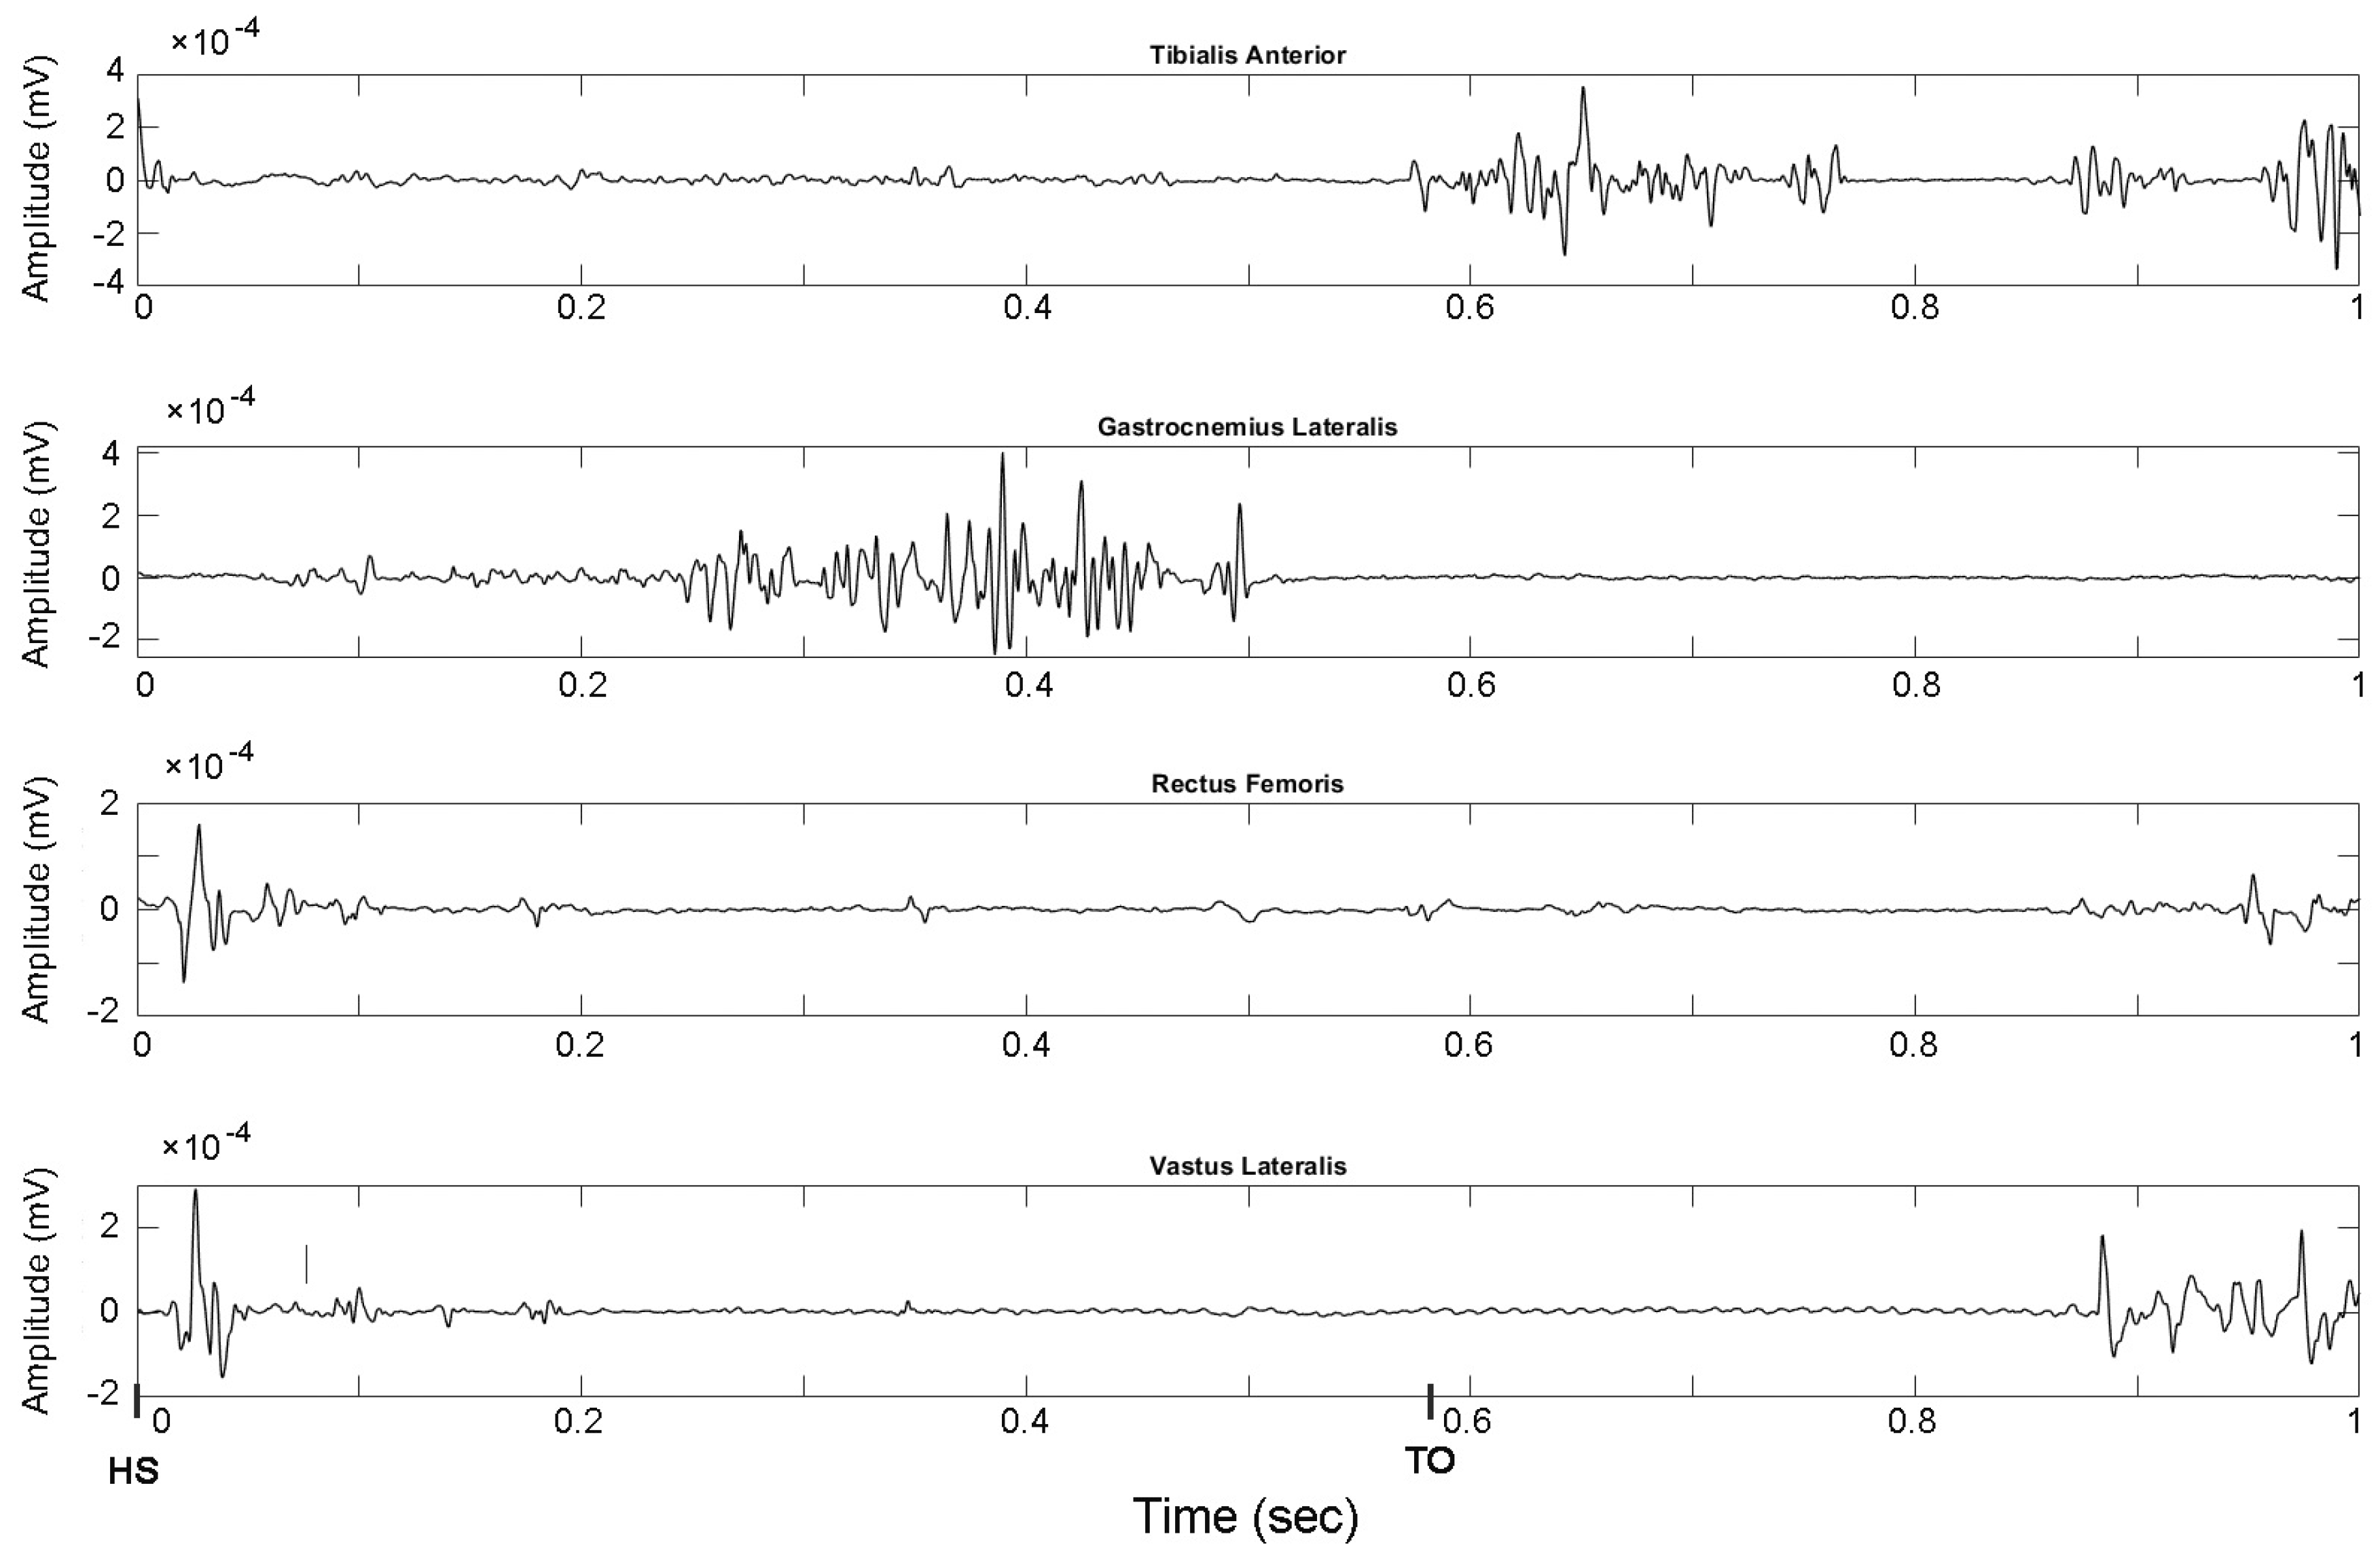
3.2. Signal Acquisition

The multichannel recording system, Step 32 (Medical Technology, Italy, Version PCI-32 ch2.0.1. DV, resolution: 12 bit; sampling rate: 2 kHz) was used to acquire surface electromyographic (sEMG) and basographic signals (i.e., the signals from footswitches). Each lower limb was instrumented with three foot-switches and four sEMG probes. Foot-switches (surface: 1.21 cm2, activation force: 3 N), were pasted beneath the heel, the first and the fifth metatarsal heads of the foot. Single differential sEMG probes with fixed geometry (Ag/Ag-Cl disk; electrode diameter: 0.4 cm; inter-electrode distance: 0.8 cm; gain: 1000; high-pass filter: 10 Hz; input impedance: 1.5 G; CMRR > 126 dB; input referred noise: 1 Vrms) and with variable geometry (Ag/Ag-Cl disks; minimum inter-electrode distance: 12 mm, gain: 1000, high-pass filter: 10 Hz, input impedance >1.5 G, CMRR >126 dB, input referred noise 200 nVrms) were placed on the belly muscle to detect the sEMG signals. Skin was shaved, cleansed with abrasive paste and wet with a damp cloth. Probes were placed over tibialis anterior, gastrocnemius lateralis, hamstrings, and vastus lateralis, following the recommendations provided by the European concerted action SENIAM (surface EMG for a non-invasive assessment of muscles) for electrodes location with respect to tendons, motor points and fiber orientation [29]. Each volunteer walked barefoot on the floor at her/his own chosen pace for about 5 min, following an eight-shaped path [30], which includes natural deceleration, reversing, curve and acceleration (Figure 1).

3.3. Pre-Processing

Footswitch signals were converted and processed so as to identify the different gait cycles and phases (stance and swing), according to the approach discussed in details in [31].
Electromyographic signals were processed by a high-pass, linear-phase FIR filter (cut-off frequency: 20 Hz), in order to avoid phase distortion effects and by a low-pass, linear-phase FIR filter (cut-off frequency: 450 Hz). Then, sEMG signals were full-wave rectified and the envelope was extracted (second-order Butterworth low-pass filter, cut-off frequency: 5 Hz). Figure 2 and Figure 3 showed, respectively, the raw EMG signals recorded for the right leg and the envelope obtained as a result of the pre-processing step.
The sEMG and basographic data analyzed in the present study are going to be published in a public dataset, and are currently available for research purposes by contacting the authors.

3.4. Gait Phase Classification

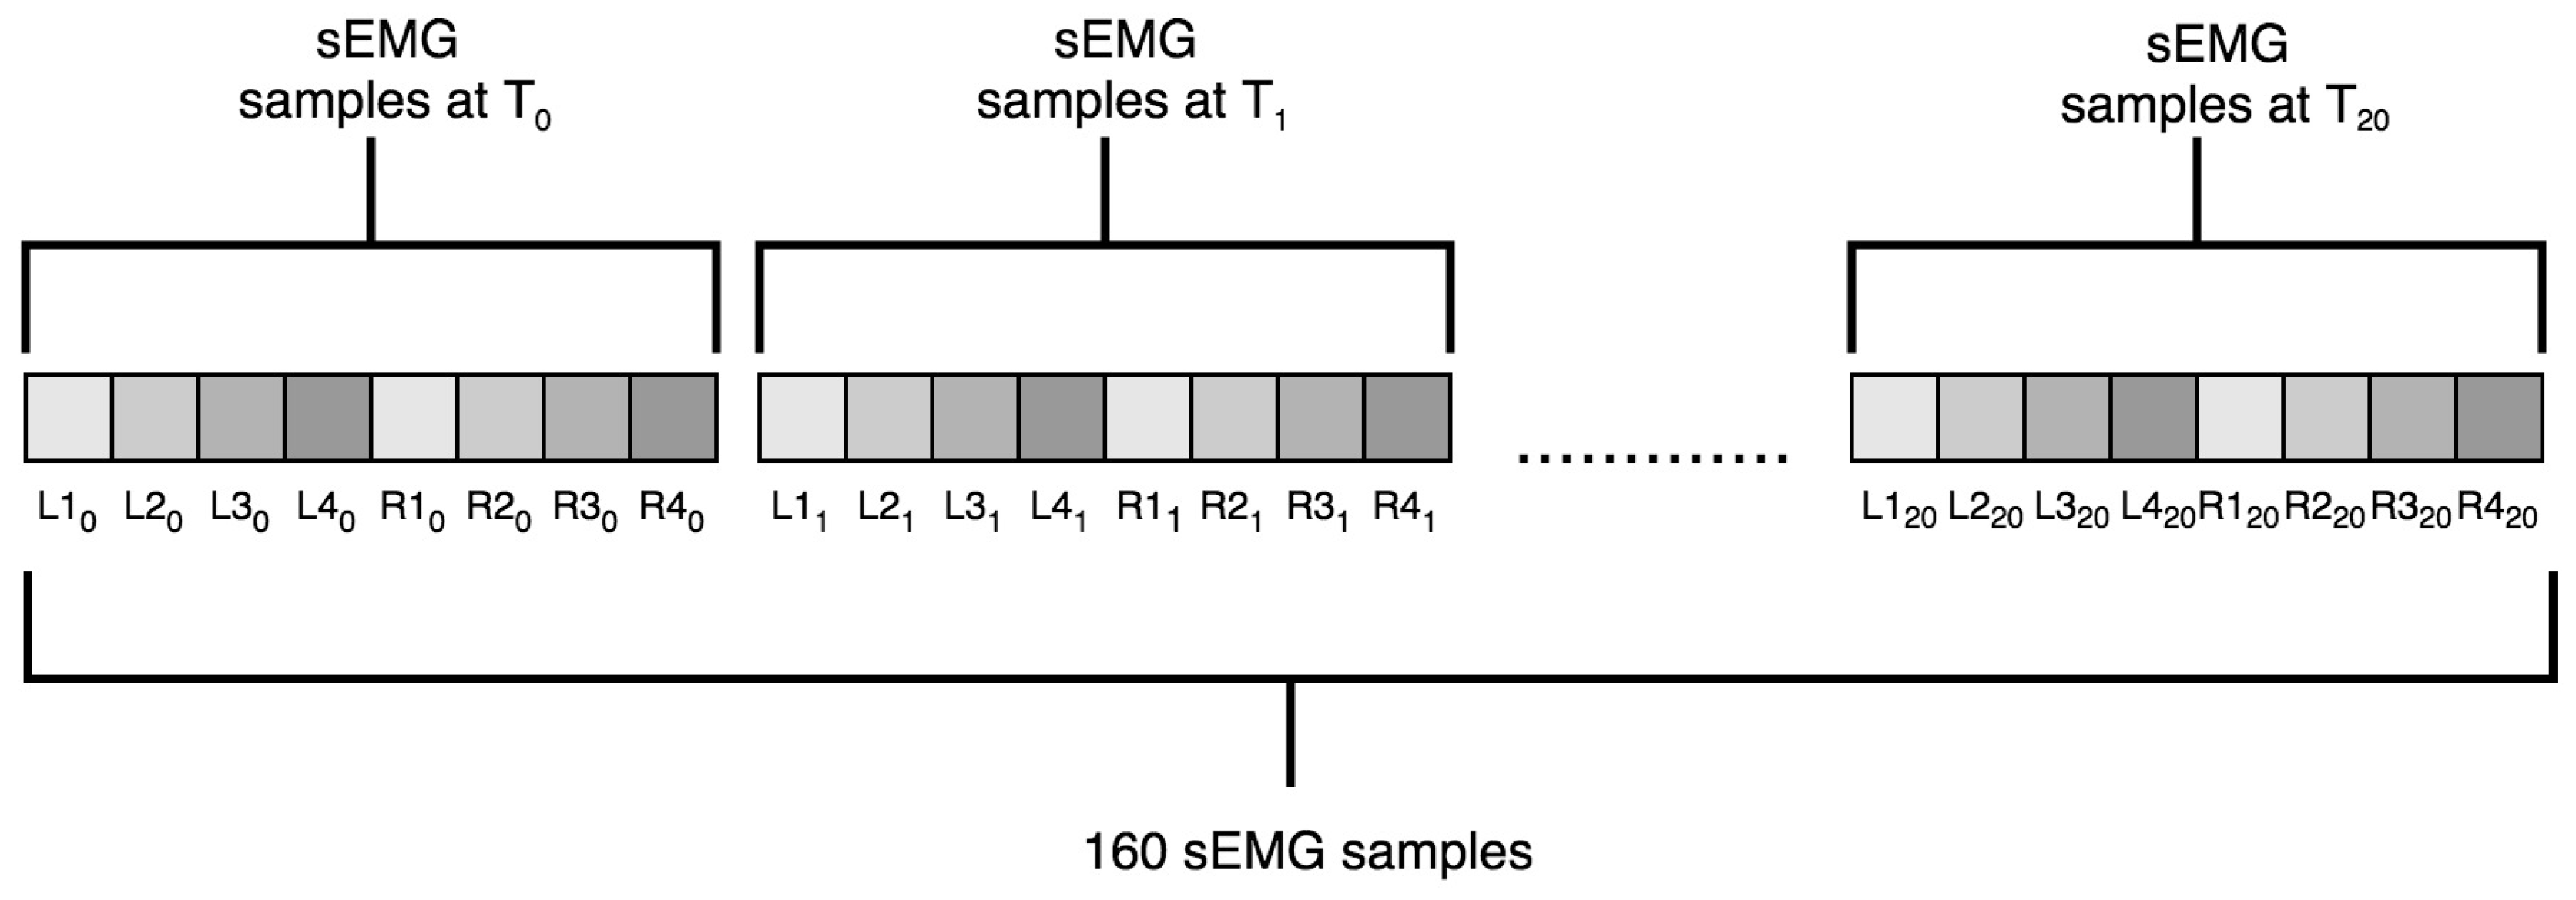
3.4.1. Data Preparation

Before feeding data into the classifier, a min-max normalization of each muscle signal was performed within each subject, thus mapping the values in the [0–1] interval. In order to train the classifier, we split the signals into 20 data samples windows (corresponding to 10 milliseconds) for both stance and swing phases.
We then aggregated the synchronized EMG-signal segments corresponding to the eight muscles (four for each leg) into a single vector of 160 elements. Each EMG vector was composed of 20 sequences of eight elements. Each element represents the EMG-signal values of the eight muscles in that single time-sample. Thus, the first eight elements of the vector were the EMG signal values of the eight muscles computed in the first sample of the segment. The following eight elements of the vector are the EMG signal values of the eight muscles computed in the second sample of the segment, and so on up to the twentieth sample. The structure of the input vector is illustrated in Figure 4. L 1 i , L 2 i , L 3 i , and L 4 i were the values of EMG signals in the sample i corresponding to the muscles of the left leg, respectively: tibialis anterior, gastrocnemius lateralis, hamstring, vastus lateralis. R 1 i , R 2 i , R 3 i , and R 4 i represented the correspondent for the right leg. Each input vector was assigned to the label 0 if the corresponding signals belong to a stance phase, and to 1 if the corresponding signals belong to a swing phase. After removing the segments before the first swing phase, to avoid considering muscle activation recorded in non-walking conditions, we obtained 522.936 labelled segments from the 23 subjects.
In our study we attempted to classify gait phases and to detect the timing of phase transitions (HS and TO events). In particular we are targeting previously unseen subjects, i.e., subjects whose gait recordings were not used in the training phase.
Accordingly, we performed a cross-validation using 23 folds, each of which uses data from 22 subjects (LS set) in training and 1 in test (US set). At each fold, a different subject is used as the test subject (unseen). In order to measure the phase classification performances also for learned subjects, we further split the LS set into training set (LS-train) and test set (LS-test). More precisely, LS-train includes the first 90% of the each subject strands (approximately 3 min and 30 s, 180 gait cycles) and LS-test the remaining 10% (approximately 30 s, 20 gait cycles).

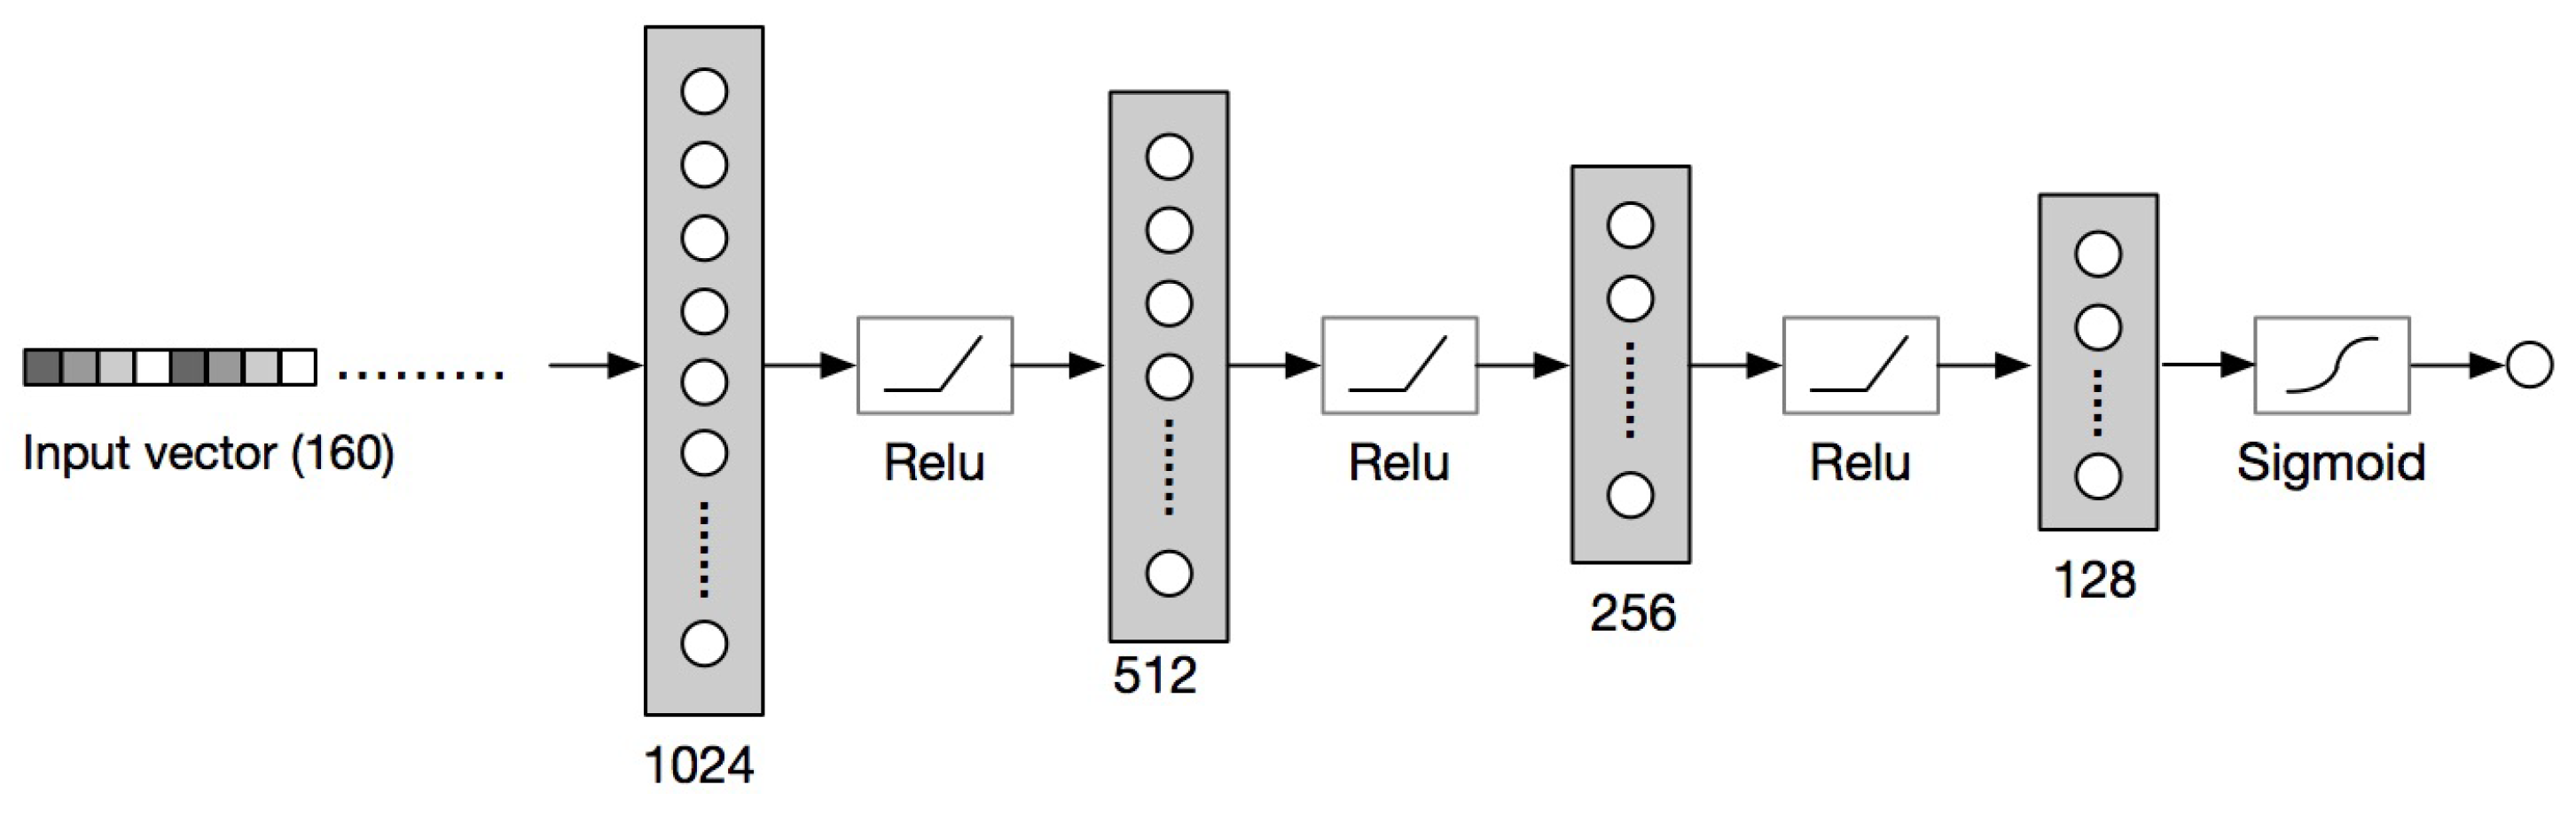
3.4.2. Neural Networks

We experimented with different multi layer perceptron (MLP) architectures. In Table 1 we summarize the different architectures for which we report the results in the following section. The first model ( M L P 1 ) was a shallow network with one single hidden layer composed of 128 units (neurons) and had a one-dimensional output. The output was fed to a sigmoid function and a 0.5 threshold is used to obtain a binary output: when the output of the sigmoid was >0.5 we assigned the label 1, otherwise we assigned the label 0. We then experimented with deeper networks, composed of 2–5 hidden layers (Table 1). In all the architectures we used rectified linear units (ReLU) to provide non-linearity between hidden layers. As an example, in Figure 5 we illustrate the structure of the M L P 4 architecture.
In our experiments, we used stochastic gradient descent (SGD) as the optimization algorithm and binary cross entropy as the loss function (BCE).
The value 0.1 was experimentally identified as the optimal learning rate for all the tested models and thus adopted in all the experiments. Finally, all ANN models were trained using an early stop technique, according to the following procedure. The networks were trained for a maximum of 100 epochs, stopping when the accuracy on the validation set did not increase for 10 consecutive epochs. The best-performing learned parameters were adopted to evaluate the model performances over LS-test and US sets and the basographic signal was used as ground truth.

3.5. Gait Events Timing Detection

The predicted foot–floor-contact signal was reconstructed by chronologically arranging the binary output of the network. Thus, a vector was obtained, composed of sequences of 0 (stance phase) alternating with sequences of 1 (swing phase). This vector was chronologically scanned in order to detect the transitions between gait phases: from swing to stance phase (HS) and from stance to swing phase (TO). HS was identified as the sample where the transition from 1 to 0 occurred. TO was identified as the sample where the transition from 0 to 1 occurred.
Then, the predicted signal was cleaned by removing those phases that were too short according to physiological constraints, probably due to classification errors. We adopted the following procedure. Starting from the first HS, the following 500 samples (250 ms) were scanned to find out and remove those having a value of 1. Then, the following HS was identified, the process was repeated and so on. In the same way, starting from the first TO, the following 500 samples were scanned to find out and remove the samples which assumed the value of 0. Then, the following TO was identified, the process was repeated and so on. Eventually, the cleaned vector was chronologically scanned again in order to detect the transitions between gait phases (from 0 to 1 and from 1 to 0) and thus the timing of the gait events.

3.6. Evaluation Measures

In this work, a EMG signal’s segment classifier is ultimately used to predict a biographic signal, that is predicting the precise timing of gait phase transition. We first evaluate the performance of the classifier in assigning the correct label (0 for stance and 1 for swing) to single EMG segments. This is done using standard classification metrics, by calculating accuracy, precision, recall and F 1 score, as the harmonic average of the precision and recall. However, this measure does not provide enough information to evaluate the performances of the basographic signal prediction. In fact, even a high accuracy, if errors are concentrated in proximity of transitions, may lead to unsatisfactory results in terms of time error of transition instants. Furthermore, we apply a post processing to the classifier output, to remove false prediction and improve performances, thus we need to explicitly evaluate the predicted basographic.
For that purpose, we adopt the following procedure, used in literature to evaluate gait events prediction, e.g., in [32,33]. We first chose a temporal tolerance T, which we set to 600 milliseconds. Then we consider as true positive each predicted TO or HS event at time tp if an event of the same type exists in the ground truth signal at time tg such that | t g t p | < T . Otherwise we consider the predicted event a False Positive. We then measure the precision, recall and F 1 score and, for all the true positives, we calculate the mean average error (MAE) as the average time distance between the predicted event and the one, of the same type, in the ground truth signal.
We adopted this evaluation strategy to measure the performances of our approach and comparing it with a feature-based one.

4. Results and Discussion

To the best of our knowledge, this study is the first attempt to provide a reliable binary classification of level ground walking into stance and swing phases, by means of the application of deep learning techniques to sEMG signal. Starting from gait-phase classification, the study achieves also a prediction of foot-floor-contact signal and a consequent identification of heel-strike and toe-off timing.

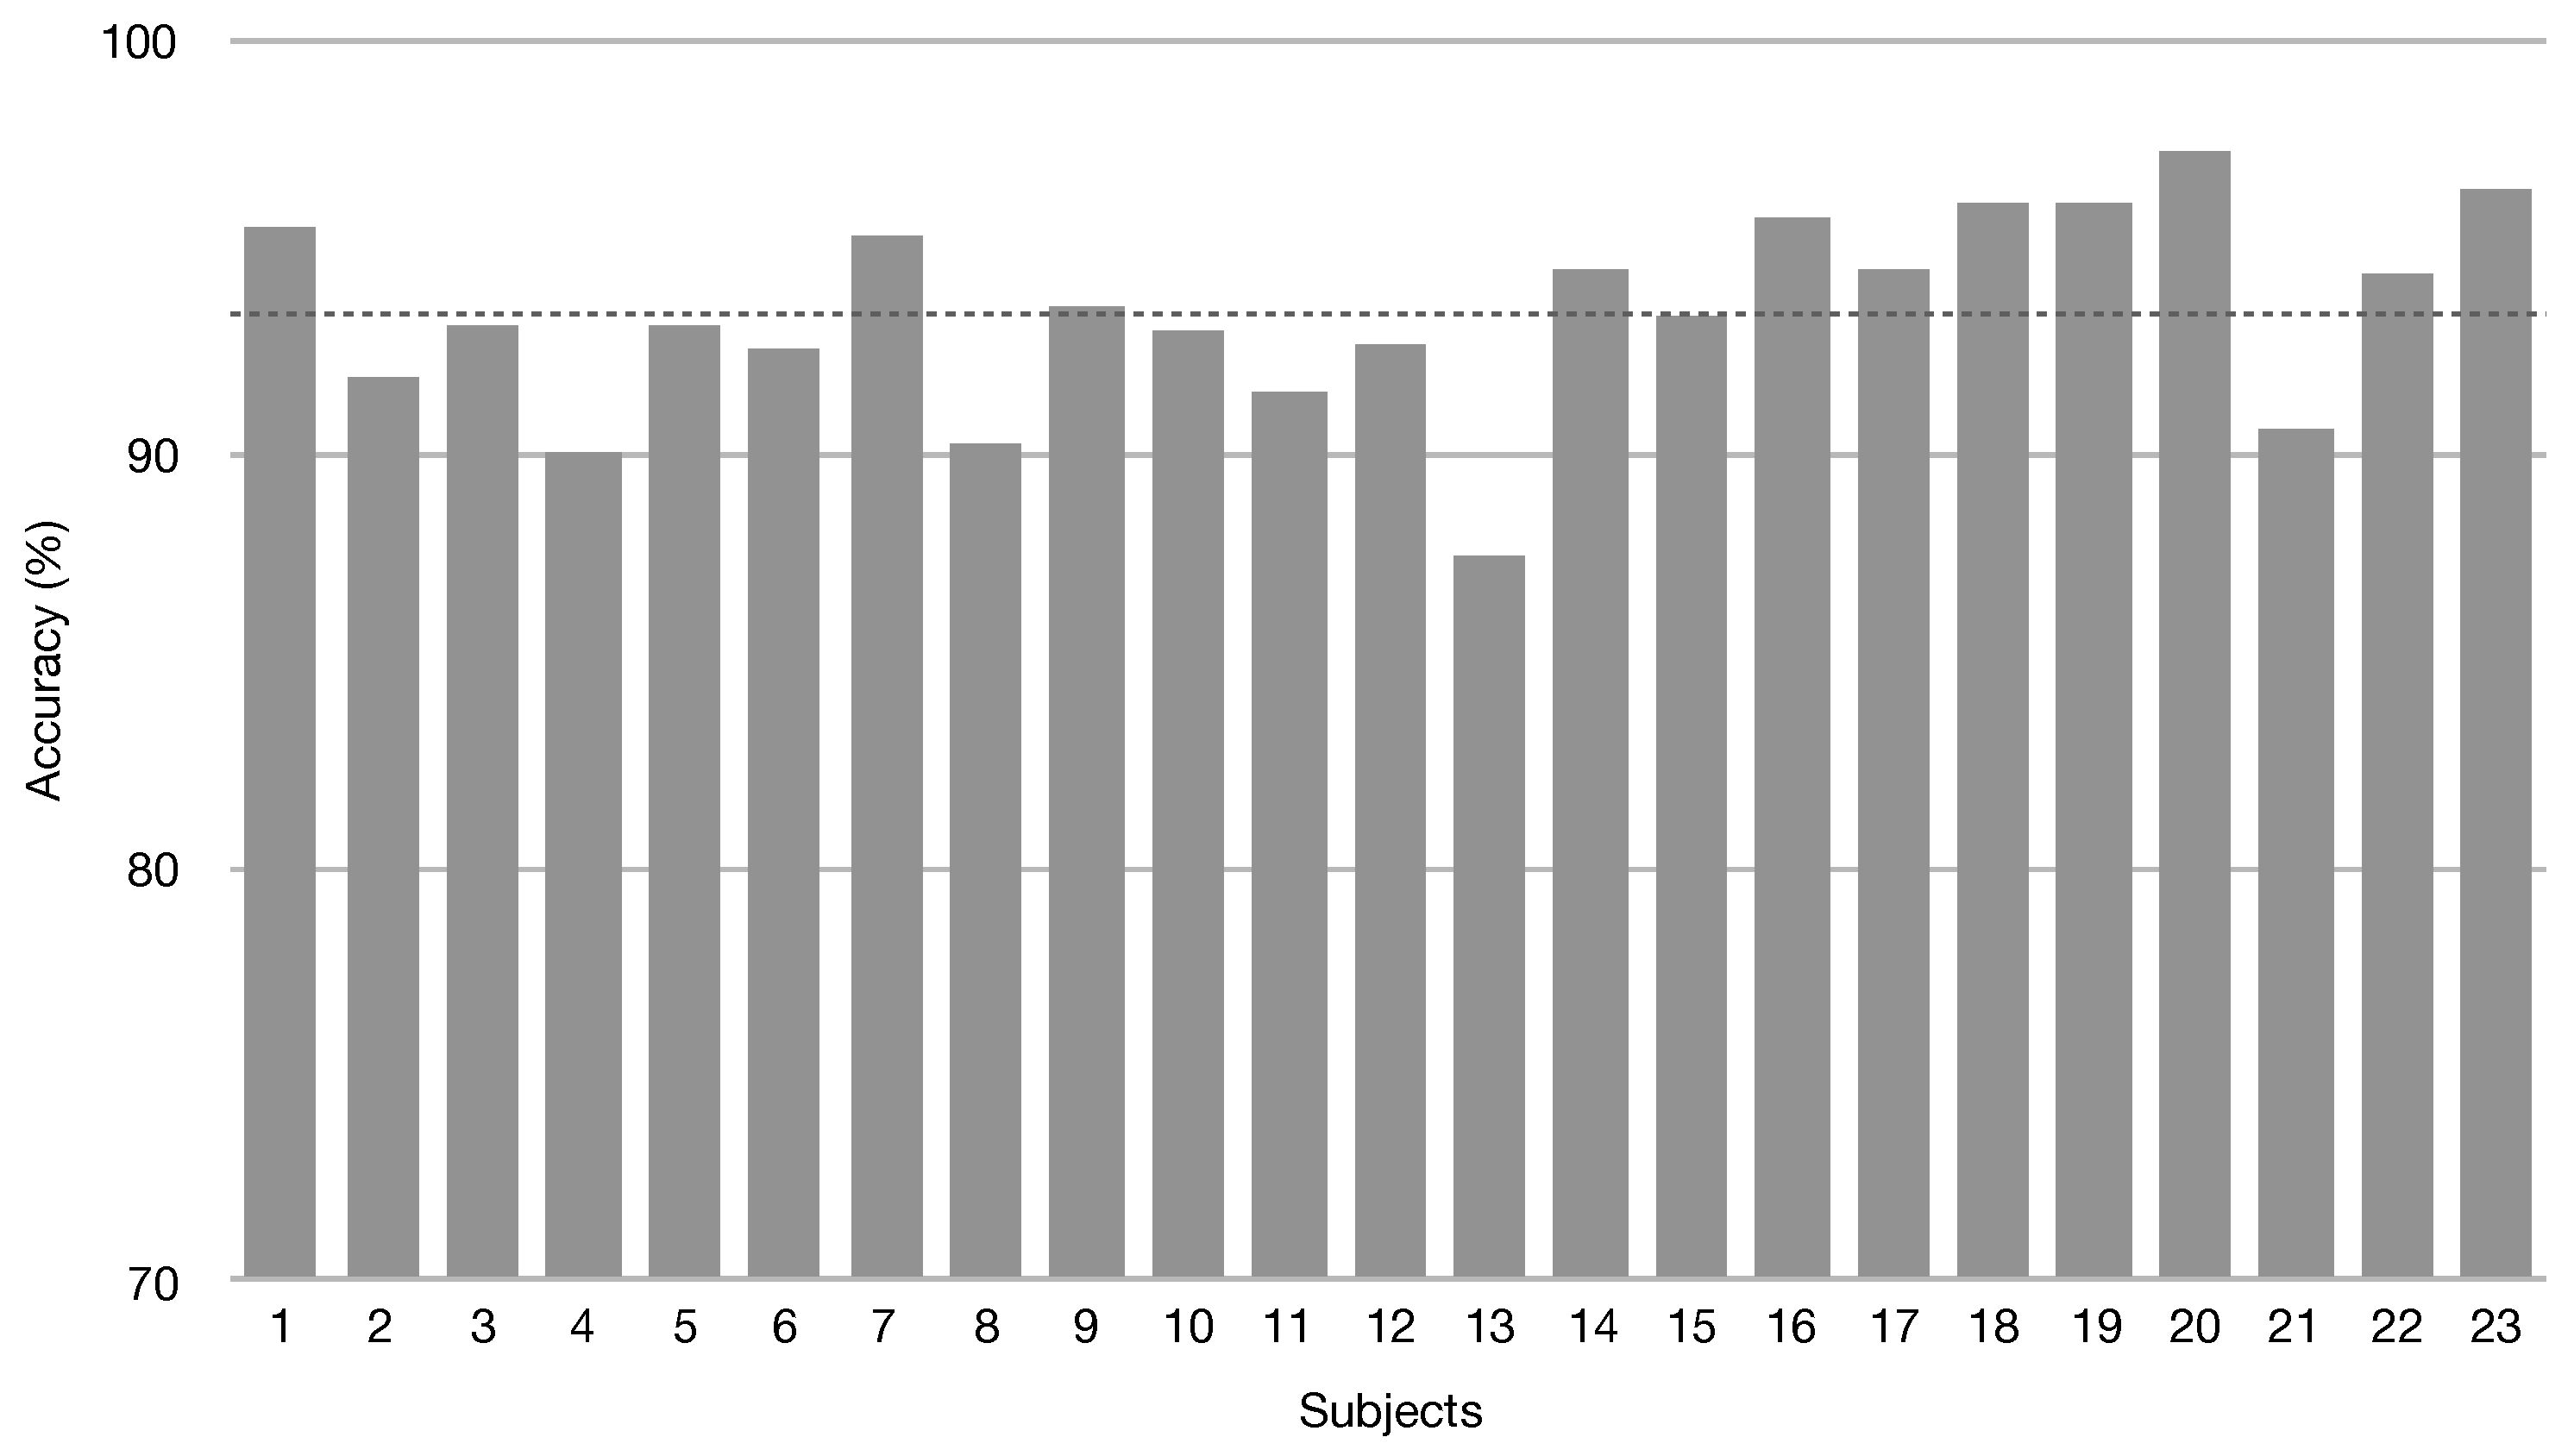
4.1. Gait-Phase Classification

Mean classification accuracy (±SD) obtained over the 23 folds with different MLP architectures for both learned subjects (LS-test set) and unlearned ones (US set) is shown in Table 2, where the best results are in bold. The same convention is used in all the tables.
As expected, classification accuracy for learned subjects was higher than for unseen ones. However, the limited gap (around 1–2 percent) suggests that all the networks succeed in learning signal patterns that generalize well to unseen subjects. The best accuracy on unlearned subjects was obtained with M L P 3 . By looking at the standard deviation reported in Table 2, one can notice that, while for learned subjects the accuracy was uniform across the different folders, there was a higher variability when considering unseen subjects. This is partially due to the fact that there were 22 unlearned subjects in the LS-test in each folder, while the US set was composed of a single subject. Such a variability also suggests that walking patterns might be very different from subject to subject, especially in everyday walking conditions, making the classification harder if a subject had never been seen before. However, looking at results on US sets over the 23 folds, as shown in Figure 6, the accuracy does not fall below 87.6% (subject 13) and reaches the highest value of 97.3% (subject 20). Such results are, in our opinion, promising and suggest that the variability could be reduced, and mean accuracy increased, by considering a larger number of subjects to learn from. Table 3 and Table 4 report precision, recall and F 1 score of the classification of Stance and Swing phases for, respectively, unlearned (US set) and learned (LS-test set) subjects. Results are averaged over the 23 folds. It is worth noticing that, in line with what was reported in literature [2], the segments belonging to a stance phase were more frequent (around 60%) than those belonging to a swing phase. This is because in normal walking the stance phase duration was 60% of the gait cycle (while the swing phase duration was the remaining 40%) on average. Despite this, results obtained for swing labelled segments are better than those obtained for stance labeled ones, both in unlearned and learned data.

4.2. Comparison with Feature-Based Approach

Classification of EMG signals from lower-limb muscles is usually based on time/frequency domain features extraction [34]. In order to provide a comparison with a feature-based method, we implemented a classifier following the approach described in [13]. We used a window size of 200 samples and for each sEMG signal we calculated the following features: standard deviation (SD), root mean square (RMS), mean absolute value (MAV), integrated EMG (IEMG) and waveform length (WL). They correspond to the group 2 features used in [13], which provide the best classification accuracy. We then concatenated the features obtaining a 40 length input vector (five features for each of the eight muscles). This was fed into a multi layer perceptron to train a gait phase classifier. A single hidden layer with 10 units is used in [13], where the input vector length was 10. We ran classification experiments over the 23 folds training a single layer network with 10 units, a single layer network with 40 units (corresponding to the size of our input vector) and all the networks in Table 1. The best average classification accuracy of 87.69 ± 5.9 for unlearned subjects was achieved with M L P 3 , while accuracy for LS was 88.03 ± 2.7 , thus we used M L P 3 for predicting HS an TO timing, adopting the same procedure applied to our approach and described in Section 3.5. In the following sections we refer to such a feature based method as F B .

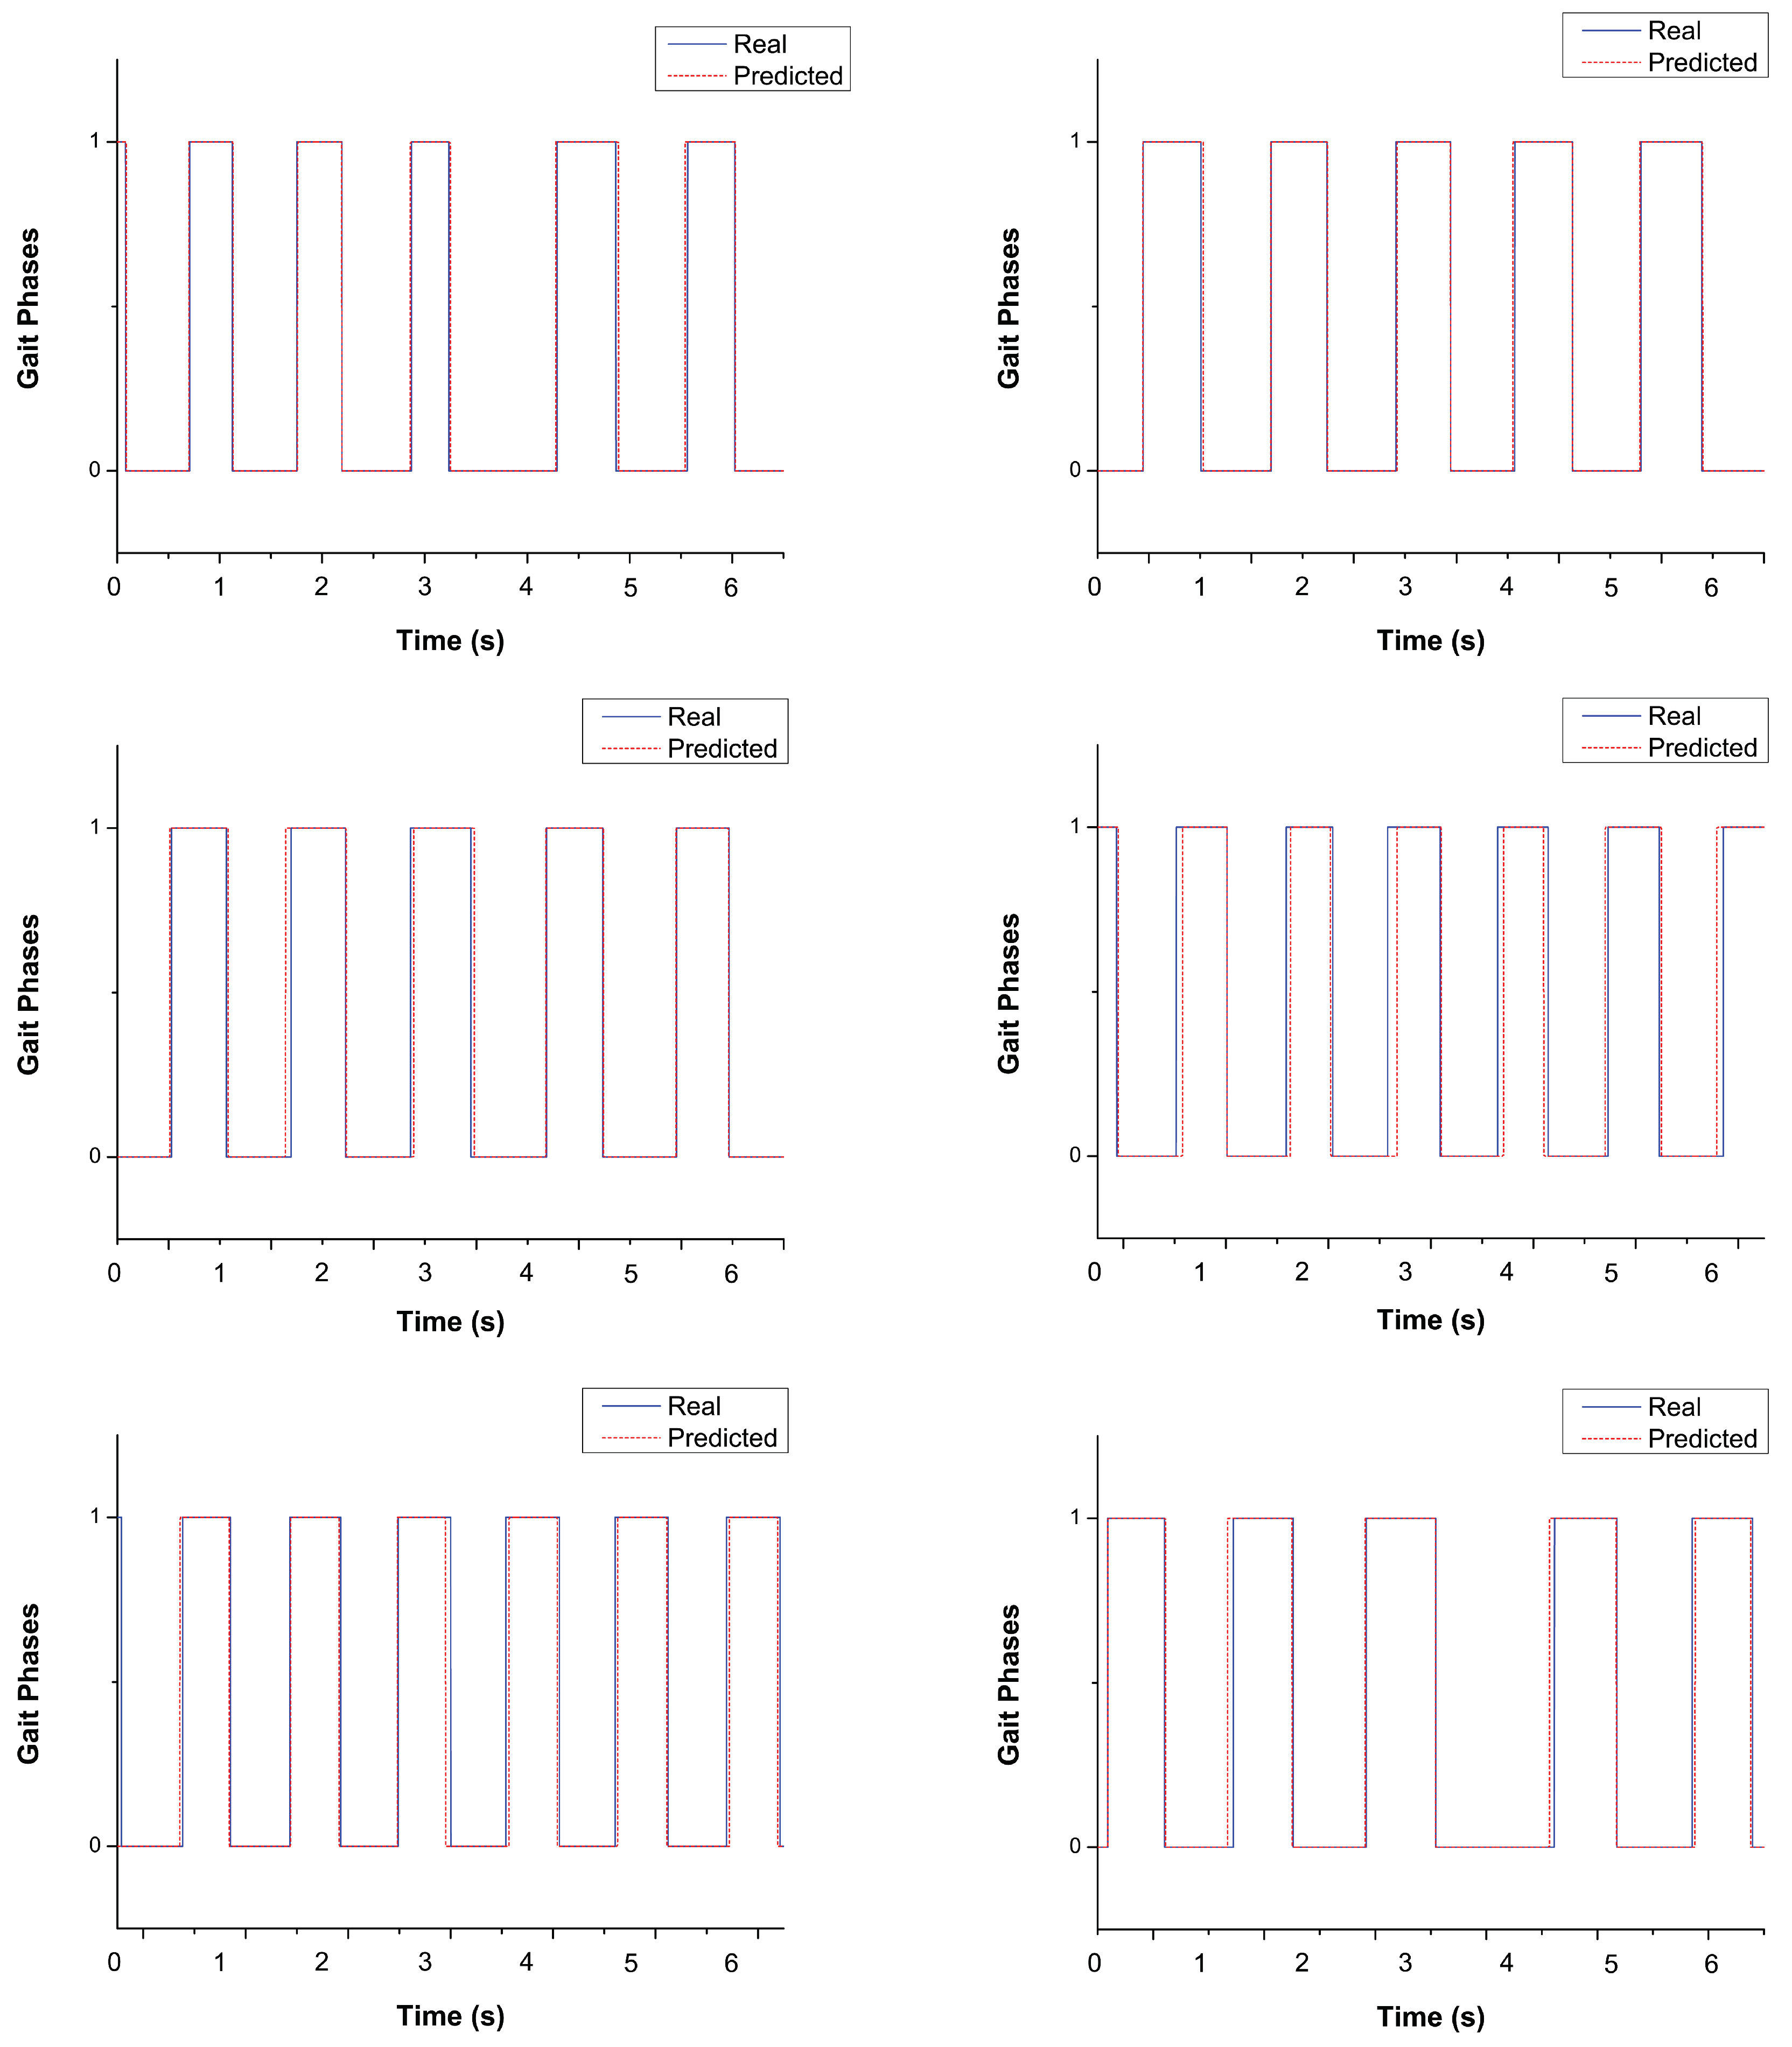
4.3. Gait Events Detection

The analysis of the results identified M L P 3 as the best model for the classification of unlearned data, obtaining an accuracy of 93.41% (Table 2), a F 1 score of 92.46% for stance phases and of 94.11% for swing phases (Table 3 and Table 4). Thus, M L P 3 has been adopted to predict foot-floor-contact signal and identify HS and TO timing in unlearned subjects, following the procedure described in Section 3.5. The prediction was tested by comparing HS and TO timing provided by the present approach vs. heel-strike and toe-off timing measured from the basographic signal. Examples of prediction of foot–floor-contact signal provided by the present approach in US subjects (blue line) vs. the ground truth (red line) are depicted in Figure 7. As one can see, our method provides good predictions also in the presence of an irregular walking activity, i.e., non uniform gait phases duration, due to the everyday walking conditions addressed in this study.
Purely data-driven approaches for gait-phase identification have been shown to achieve lower performance in less controlled scenarios, such as conditions similar to everyday walking [32]. Adapting to the larger variability of sEMG signals collected from dynamic environments and activities is more challenging for the classifiers. This could be due to the reported differences [16,17,18,19] between treadmill and straight ground walking (i.e., increased number of steps and cadence, decreased preferred walking speed, stride and stance-phase length and changes in sEMG activation) and to the further variability of spatial and temporal parameters and sEMG signals introduced by deceleration, reversing, curve and acceleration typical of everyday walking [16]. Despite this, the accuracy of M L P 3 classification is good for both LS-test subjects and US subjects (93.41%). The high classification accuracy and the effective post-processing of model output allowed to achieve an average absolute prediction error over unlearned subjects of 21.42 ± 7.0 ms for HS and 38.1 ± 15.2 ms for TO (Table 5). Both HS and TO predictions may be considered reasonably suitable, since they show an average absolute error <1% and <2% of a gait cycle duration, respectively. The present approach shows better performance in detecting heel-strikes rather than toe-offs. This result matches previous EMG-based and accelerometer-based reports [13,32].
To test the reliability of HS and TO prediction, results provided by our approach have been compared with the results achieved by feature-based (FB) approach. Comparison is reported in Table 5. Our approach outperformed the FB one, suggesting that the neural network succeeded in learning latent features that are better suited for the task at hand if compared to the ones used in previous studies [13]. Besides the above reported direct comparison with the FB approach in the same population, an idea of the quality of the present results could be given also through the analysis of the results reported in [13] in their own population, during treadmill walking. The classification accuracy reported in [13] was 87.5% on learned subjects and 77% for unlearned ones. The associated average prediction error computed in unlearned subjects was 35 ± 25 ms for HS and 49 ± 15 ms for TO. Compared with those performances, results provided by the present study are encouraging, despite the challenging conditions of everyday walking. Besides the different approach (different neural network and different processing of the input signal), the elevated classification-accuracy values and the satisfactory HS/TO-prediction achieved here are supposed to be due also to the characteristics of the experimental set-up: high number of strides acquired per subject (about 500) associated with quite a large number of subjects (23); four different muscles per leg for every subject involved in training process. Moreover, foot-switches [31,35] represent the gold standard in gait segmentation since each gait phase can be associated with a specific value of the sensor output [36]. Finally, in the present study, data from three foot-switches was considered, in line with what reported in literature [31]. Using three foot-switches, instead of the two used in [13], probably improved the reliability of basographic signals as ground truth as well as the reliability of performance evaluation.

5. Conclusions

The present study proposed a suitable approach for classifying stance vs. swing and predicting the occurrence of the transition between phases, such as heel strike and toe off. The main contribution of the study is to provide reliable performances in gait-phase classification and gait-event prediction in natural walking conditions (similar to everyday walking), overcoming the constraints associated to the controlled environment (such as treadmill walking) used by previous studies to address this kind of task. A further methodological contribution consists of proposing a different pre-processing of sEMG-signal in order to better train the neural networks; the direct use of linear envelopes proposed here allows the network to automatically learn relevant higher level (hidden) features, avoiding hand crafting ad-hoc features and contributing to improve the performances.
From the clinical point of view, a relevant contribution is the fact that the present approach is based on sEMG signals only. This could considerably help reduce the number of sensors necessary for a complete gait protocol, limiting the clinical encumbrance, time-consumption, and cost. Thus, one of the main application domains of the present methodology should be in the field of neuromuscular diseases, such as spastic cerebral palsy, where the acquisition and then the analysis of sEMG signals are essential and special care should be exercised in the treatment of the patients.
Moreover, the present classifier may also support the process of gait phase detection in EMG-driven assistive devices [37], such as hip–knee, ankle–foot, and knee–ankle–foot orthoses and exoskeletons, as the identification of gait events is a continuing concern in the use of these devices. Evaluating the performance of the classifier after reducing the complexity of experimental protocol (i.e., the number of monitored muscles) could also be valuable. At the time of writing, all these applications are beyond the goals of the present work. However, future efforts will point in that direction.

Author Contributions

Conceptualization, F.D.N., C.M., S.F. and A.C.; methodology, F.D.N. and C.M.; software, C.M.; investigation, C.M. and F.D.N.; validation, C.M.; resources, F.D.N. and S.F.; data curation, F.D.N. and C.M.; writing—original draft preparation, F.D.N. and C.M.; writing—review and editing, A.C. and S.F.; visualization, F.D.N. and C.M.; supervision, A.C. and S.F.

Funding

This research received no external funding.

Acknowledgments

Thanks to Guido Mascia and Lorenzo Principi for the support provided in preparing the experiments.

Conflicts of Interest

The authors declare no conflict of interest.

References

  1. Loeb, G.E.; Gans, C. Electromyography for Experimentalists; University of Chicago Press: Chicago, IL, USA, 1986. [Google Scholar]
  2. Perry, J. Gait Analysis: Normal and Pathological Function; Slack Inc.: Thorofare, NJ, USA, 1992. [Google Scholar]
  3. Špulák, D.; Čmejla, R.; Bačáková, R.; Kračmar, B.; Satrapová, L.; Novotný, P. Muscle activity detection in electromyograms recorded during periodic movements. Comput. Biol. Med. 2014, 47, 93–103. [Google Scholar] [CrossRef] [PubMed]
  4. Wang, W.; Stefano, A.; Allen, R. A simulation model of the surface EMG signal for analysis of muscle activity during the gait cycle. Comput. Biol. Med. 2006, 36, 601–618. [Google Scholar] [CrossRef] [PubMed]
  5. Mengarelli, A.; Maranesi, E.; Burattini, L.; Fioretti, S.; Di Nardo, F. Co-contraction activity of ankle muscles during walking: A gender comparison. Biomed. Signal Process. Control 2017, 33, 1–9. [Google Scholar] [CrossRef]
  6. Gurney, J.; Kersting, U.; Rosenbaum, D. Between-day reliability of repeated plantar pressure distribution measurements in a normal population. Gait Posture 2008, 27, 706–709. [Google Scholar] [CrossRef] [PubMed]
  7. Bovi, G.; Rabuffetti, M.; Mazzoleni, P.; Ferrarin, M. A multiple-task gait analysis approach: Kinematic, kinetic and EMG reference data for healthy young and adult subjects. Gait Posture 2011, 33, 6–13. [Google Scholar] [CrossRef] [PubMed]
  8. Caldas, R.; Mundt, M.; Potthast, W.; Buarque de Lima Neto, F.; Markert, B. A systematic review of gait analysis methods based on inertial sensors and adaptive algorithms. Gait Posture 2017, 57, 204–210. [Google Scholar] [CrossRef] [PubMed]
  9. Joyseeree, R.; Abou Sabha, R.; Mueller, H. Applying Machine Learning to Gait Analysis Data for Disease Identification. Stud. Health Technol. Inf. 2015, 210, 850–854. [Google Scholar] [CrossRef]
  10. Zou, Q.; Wang, Y.; Zhao, Y.; Wang, Q.; Shen, C.; Li, Q. Deep Learning Based Gait Recognition Using Smartphones in the Wild. arXiv 2018, arXiv:1811.00338. [Google Scholar]
  11. Kaczmarczyk, K.; Wit, A.; Krawczyk, M.; Zaborski, J.; Piłsudskii, J. Artificial Neural Networks (ANN) Applied for Gait Classification and Physiotherapy Monitoring in Post Stroke Patients. In Artificial Neural Networks; IntechOpen: Rijeka, Croatia, 2011; Chapter 16. [Google Scholar] [CrossRef] [Green Version]
  12. Wang, J.; Zielińska, T. Gait features analysis using artificial neural networks—Testing the footwear effect. Acta Bioeng. Biomech. 2017, 19, 17–32. [Google Scholar]
  13. Nazmi, N.; Abdul Rahman, M.; Yamamoto, S.I.; Ahmad, S. Walking gait event detection based on electromyography signals using artificial neural network. Biomed. Signal Process. Control 2019, 47, 334–343. [Google Scholar] [CrossRef]
  14. Ziegier, J.; Gattringer, H.; Mueller, A. Classification of Gait Phases Based on Bilateral EMG Data Using Support Vector Machines. In Proceedings of the IEEE RAS and EMBS International Conference on Biomedical Robotics and Biomechatronics, Enschede, The Netherlands, 26–29 August 2018; Volume 2018, pp. 978–983. [Google Scholar] [CrossRef]
  15. Meng, M.; She, Q.; Gao, Y.; Luo, Z. EMG signals based gait phases recognition using hidden Markov models. In Proceedings of the 2010 IEEE International Conference on Information and Automation, ICIA 2010, Harbin, China, 20–23 June 2010; pp. 852–856. [Google Scholar] [CrossRef]
  16. Stolze, H.; Kuhtz-Buschbeck, J.; Mondwurf, C.; Boczek-Funcke, A.; Jöhnk, K.; Deuschl, G.; Illert, M. Gait analysis during treadmill and overground locomotion in children and adults. Electroencephalogr. Clin. Neurophysiol. Electromyogr. Mot. Control 1997, 105, 490–497. [Google Scholar] [CrossRef]
  17. Batlkham, B.; Oyunaa, C.; Odongua, N. A Kinematic Comparison of Overground and Treadmill Walking. Value Health 2014, 17, A774. [Google Scholar] [CrossRef] [PubMed] [Green Version]
  18. Riley, P.O.; Paolini, G.; Della Croce, U.; Paylo, K.W.; Kerrigan, D.C. A kinematic and kinetic comparison of overground and treadmill walking in healthy subjects. Gait Posture 2007, 26, 17–24. [Google Scholar] [CrossRef] [PubMed]
  19. Song, J.; Hidler, J. Biomechanics of overground vs. treadmill walking in healthy individuals. J. Appl. Physiol. 2008, 104, 747–755. [Google Scholar] [CrossRef]
  20. Alanazi, H.; Abdullah, A.; Qureshi, K. A Critical Review for Developing Accurate and Dynamic Predictive Models Using Machine Learning Methods in Medicine and Health Care. J. Med. Syst. 2017, 41, 69. [Google Scholar] [CrossRef] [PubMed]
  21. Abbas, R.; Hussain, A.; Al-Jumeily, D.; Baker, T.; Khattak, A. Classification of Foetal Distress and Hypoxia Using Machine Learning Approaches. Lect. Notes Comput. Sci. 2018, 10956, 767–776. [Google Scholar] [CrossRef]
  22. Aljaaf, A.; Al-Jumeily, D.; Haglan, H.; Alloghani, M.; Baker, T.; Hussain, A.; Mustafina, J. Early Prediction of Chronic Kidney Disease Using Machine Learning Supported by Predictive Analytics. In Proceedings of the 2018 IEEE Congress on Evolutionary Computation (CEC), Rio de Janeiro, Brazil, 8–13 July 2018. [Google Scholar]
  23. Subasi, A.; Yilmaz, M.; Ozcalik, H.R. Classification of EMG signals using wavelet neural network. J. Neurosci. Methods 2006, 156, 360–367. [Google Scholar] [CrossRef]
  24. Elamvazuthi, I.; Duy, N.; Ali, Z.; Su, S.; Khan, M.; Parasuraman, S. Electromyography (EMG) based Classification of Neuromuscular Disorders using Multi-Layer Perceptron. In Proceedings of the 2015 IEEE International Symposium on Robotics and Intelligent Sensors (IEEE IRIS2015), Langkawi, Malaysia, 18–20 October 2015; Volume 76, pp. 223–228. [Google Scholar] [CrossRef]
  25. Ibrahimy, M.; Ahsan, M.; Khalifa, O. Design and optimization of levenberg-marquardt based neural network classifier for EMG signals to identify hand motions. Meas. Sci. Rev. 2013, 13, 142–151. [Google Scholar] [CrossRef]
  26. Liu, Z.; Luo, Z. Hand motion pattern classifier based on EMG using wavelet packet transform and LVQ neural networks. In Proceedings of the 2008 IEEE International Symposium on IT in Medicine and Education, ITME 2008, Xiamen, China, 12–14 December 2008; pp. 28–32. [Google Scholar] [CrossRef]
  27. Oskoei, M.; Hu, H. Support vector machine-based classification scheme for myoelectric control applied to upper limb. IEEE Trans. Biomed. Eng. 2008, 55, 1956–1965. [Google Scholar] [CrossRef]
  28. Moslem, B.; Diab, M.; Khalil, M.; Marque, C. Classification of multichannel uterine EMG signals by using unsupervised competitive learning. In Proceedings of the 2011 IEEE Workshop on Signal Processing Systems, SiPS 2011, Beirut, Lebanon, 4–7 October 2011; pp. 267–272. [Google Scholar] [CrossRef]
  29. Hermens, H.; Freriks, B.; Disselhorst-Klug, C.; Rau, G. Development of recommendations for SEMG sensors and sensor placement procedures. J. Electromyogr. Kinesiol. 2000, 10, 361–374. [Google Scholar] [CrossRef]
  30. Di Nardo, F.; Mengarelli, A.; Maranesi, E.; Burattini, L.; Fioretti, S. Gender differences in the myoelectric activity of lower limb muscles in young healthy subjects during walking. Biomed. Signal Process. Control 2015, 19, 14–22. [Google Scholar] [CrossRef]
  31. Agostini, V.; Balestra, G.; Knaflitz, M. Segmentation and classification of gait cycles. IEEE Trans. Neural Syst. Rehabil. Eng. 2014, 22, 946–952. [Google Scholar] [CrossRef]
  32. Khandelwal, S.; Wickstrasm, N. Evaluation of the performance of accelerometer-based gait event detection algorithms in different real-world scenarios using the MAREA gait database. Gait Posture 2017, 51, 84–90. [Google Scholar] [CrossRef]
  33. Trojaniello, D.; Cereatti, A.; Della Croce, U. Accuracy, sensitivity and robustness of five different methods for the estimation of gait temporal parameters using a single inertial sensor mounted on the lower trunk. Gait Posture 2014, 40, 487–492. [Google Scholar] [CrossRef]
  34. Toledo-Pérez, D.; Martínez-Prado, M.; Gómez-Loenzo, R.; Paredes-García, W.; Rodríguez-Reséndiz, J. A study of movement classification of the lower limb based on up to 4-EMG channels. Electronics 2019, 8, 259. [Google Scholar] [CrossRef]
  35. Taborri, J.; Palermo, E.; Rossi, S.; Cappa, P. Gait partitioning methods: A systematic review. Sensors 2016, 16, 66. [Google Scholar] [CrossRef]
  36. Winiarski, S.; Rutkowska-Kucharska, A. Estimated ground reaction force in normal and pathological gait. Acta Bioeng. Biomech. 2009, 11, 53–60. [Google Scholar]
  37. Ma, Y.; Xie, S.; Zhang, Y. A patient-specific EMG-driven neuromuscular model for the potential use of human-inspired gait rehabilitation robots. Comput. Biol. Med. 2016, 70, 88–98. [Google Scholar] [CrossRef]
Figure 1. Illustration of the eight-shaped path used in our experiments.
Electronics 08 00894 g001
Figure 2. Raw electromyographic (EMG) signals recorded from the four muscles of the right leg. Corresponding heel-strike (HS) and toe-off (TO) timing are highlighted.
Electronics 08 00894 g002
Figure 3. The envelope resulting from the pre-processing of the raw EMG signals recorded from the four muscles of the right leg. Corresponding HS and TO timing are highlighted.
Electronics 08 00894 g003
Figure 4. The structure of EMG vectors fed as input to the artificial neural networks (ANNs).
Electronics 08 00894 g004
Figure 5. The architecture of multi layer perceptron (MLP) 4 .
Electronics 08 00894 g005
Figure 6. Classification accuracy over the 23 folds for the unlearned subjects (US set).
Electronics 08 00894 g006
Figure 7. Examples of TO and HS predictions on six random subjects.
Electronics 08 00894 g007
Table 1. Overview of the multi layer perceptron (MLP) architectures.
Model NameModel Structure
M L P 1 mlp(128)
M L P 2 mlp(256, 128)
M L P 3 mlp(512, 256, 128)
M L P 4 mlp(1024, 512, 256, 128)
M L P 5 mlp(1024, 1024, 512, 256, 128)
Table 2. Gait phase classification accuracy (± standard deviation (SD)) averaged over the 23 folds for each considered network.
Accuracy on USAccuracy on LS-Test
M L P 1 92.62 ± 2.393.83 ± 0.28
M L P 2 93.01 ± 2.194.41 ± 0.23
M L P 3 93.41 ± 2.394.83 ± 0.2
M L P 4 93.25 ± 2.994.94 ± 0.3
M L P 5 93.03 ± 2.894.93 ± 0.2
Table 3. Gait phase classification performances for stance and swing phases in unlearned subjects (set US). Precision, recall and F 1 scores are averaged over the 23 folds.
Stance Phase
PrecisionRecall F 1 Score
M L P 1 92.99 ± 4.590.50 ± 5.991.49 ± 2.9
M L P 2 93.15 ± 4.491.22 ± 4.991.99 ± 2.4
M L P 3 93.68 ± 3.991.57 ± 5.092.46 ± 2.7
M L P 4 93.29 ± 2.991.78 ± 5.392.35 ± 3.2
M L P 5 92.89 ± 4.791.53 ± 5.292.04 ± 3.4
Swing Phase
PrecisionRecall F 1 Score
M L P 1 92.49 ± 4.894.74 ± 3.293.45 ± 2.0
M L P 2 92.97 ± 4.394.84 ± 3.193.77 ± 1.9
M L P 3 93.24 ± 4.395.21 ± 2.994.11 ± 2.1
M L P 4 93.32 ± 4.794.80 ± 3.693.93 ± 2.7
M L P 5 93.29 ± 4.094.47 ± 3.793.77 ± 2.5
Table 4. Gait phase classification performances for stance and swing phases in learned subjects (set LS-test). Precision, recall and F 1 scores are averaged over the 23 folds.
Stance Phase
PrecisionRecall F 1 Score
M L P 1 94.15 ± 0.391.72 ± 0.892.92 ± 0.3
M L P 2 94.48 ± 0.692.75 ± 0.893.60 ± 0.3
M L P 3 94.63 ± 0.593.59 ± 0.594.11 ± 0.2
M L P 4 94.80 ± 0.593.67 ± 0.994.22 ± 0.4
M L P 5 94.50 ± 0.593.99 ± 0.694.24 ± 0.3
Swing phase
PrecisionRecall F 1 Score
M L P 1 93.60 ± 0.595.50 ± 0.394.54 ± 0.2
M L P 2 94.37 ± 0.595.72 ± 0.695.04 ± 0.2
M L P 3 94.99 ± 0.395.81 ± 0.495.40 ± 0.2
M L P 4 95.06 ± 0.795.94 ± 0.495.50 ± 0.2
M L P 5 95.28 ± 0.595.68 ± 0.495.48 ± 0.2
Table 5. Performance of toe-off (TO) and heel-strike (HS) detection for unlearend subjects over 23 folds.
HS
MAEPrecisionRecall F 1
M L P 3 21.6 ± 7.099.67 ± 0.599.50 ± 2.999.04 ± 2.6
F B 56.7 ± 31.999.19 ± 1.596.40 ± 9.497.56 ± 2.6
TO
MAEPrecisionRecall F 1
M L P 3 38.1 ± 15.299.07 ± 1.597.90 ± 3.598.40 ± 2.4
F B 64.4 ± 42.798.45 ± 2.695.67 ± 9.996.84 ± 6.9

