Article

CRISPRLearner: A Deep Learning-Based System to Predict CRISPR/Cas9 sgRNA On-Target Cleavage Efficiency

by
Giovanni Dimauro
1,*,
Pierpasquale Colagrande
1,
Roberto Carlucci
2,
Mario Ventura
2,
Vitoantonio Bevilacqua
3 and
Danilo Caivano
1
1
Department of Computer Science, University of Bari, 70125 Bari, Italy
2
Department of Biology, University of Bari, 70125 Bari, Italy
3
Department of Electrical and Information Engineering, Polytechnic University of Bari, 70125 Bari, Italy
*
Author to whom correspondence should be addressed.
Electronics 2019, 8(12), 1478; https://doi.org/10.3390/electronics8121478
Submission received: 3 November 2019 / Revised: 26 November 2019 / Accepted: 30 November 2019 / Published: 4 December 2019
(This article belongs to the Special Issue Computational Intelligence in Healthcare)

Abstract

:
CRISPRLearner, the system presented in this paper, makes it possible to predict the on-target cleavage efficiency (also called on-target knockout efficiency) of a given sgRNA sequence, specifying the target genome that this sequence is designed for. After efficiency prediction, the researcher can evaluate its sequence and design a new one if the predicted efficiency is low. CRISPRLearner uses a deep convolutional neural network to automatically learn sequence determinants and predict the efficiency, using pre-trained models or using a model trained on a custom dataset. The convolutional neural network uses linear regression to predict efficiency based on efficiencies used to train the model. Ten different models were trained using ten different gene datasets. The efficiency prediction task attained an average Spearman correlation higher than 0.40. This result was obtained using a data augmentation technique that generates mutations of a sgRNA sequence, maintaining the efficiency value. CRISPRLearner supports researchers in sgRNA design task, predicting a sgRNA on-target knockout efficiency.

1. Introduction

1.1. Background

Genetic engineering in different living beings has always been used for various tasks, such as treating particular diseases or creating species with particular genetic features. Editing and modifying these features can be accomplished with various biotechnology techniques, which, most of the time, are quite complex.
However, things started to get easier with the discovery of CRISPR, an acronym that stands for Clustered Regularly Interspaced Short Palindromic Repeats. CRISPR was originally discovered in bacteria and archaea in late 1990s and early 2000s as a family of DNA segments containing short repeated sequences. These sequences separate fragments of DNA acquired from viruses that previously attacked the cell, forming an adaptive immunity system. In fact, after a virus attack, new viral DNA is incorporated into the CRISPR locus in form of spacers. Researchers also found that this repeated cluster was accompanied by a set of genes, called CRISPR associated system (Cas) genes, used to generate Cas proteins. Once a virus attacks again, a portion of the CRISPR region is transcribed into CRISPR RNA, or crRNA, that gets joined to a trans-activating crRNA (tracrRNA). These sequences, forming a unique one, are then bound to a Cas9 protein, guiding it to the target site of the virus DNA. The Cas9 protein then unwinds the DNA and performs a double stranded cut, knocking out the virus. The sequence targeted by Cas9 is followed by a 2-6 base pair (bp) sequence called protospacer adjacent motif (PAM), which is part of the invading virus DNA, but not part of the CRISPR region, to prevent Cas9 from cutting the CRISPR locus itself. In fact, Cas9 will not bind to a target sequence if it is not followed by PAM.
Jennifer Doudna and Emmanuelle Charpentier re-engineered the Cas9 endonuclease fusing crRNA and tracrCRNA into a single RNA sequence called sgRNA (single guide RNA). This sequence, when bound with Cas9, can find and cut a target DNA specified by the sequence itself. By manipulating the sgRNA sequence, the artificial Cas9 system can recognize and cut any DNA sequence. CRISPR then becomes a powerful genome editing tool, called CRISPR/Cas9 [1,2]. Recognition and knockout occur via a 23-bp sequence composed by a 20-bp sequence followed by a 3-bp sequence, PAM.
Designing and developing this sequence is an important task because not all the sgRNAs designed to cut a target DNA are equally effective. The efficiency of CRISPR/Cas9 sgRNA depends on the features like the target site, the properties of the endonuclease, and the design of the sequence [3]. Additionally, when DNA gets cut, the cell tends to repair this cut, leading to more or less serious mutations. Predicting efficiency in cutting DNAs (on-target cleavage efficiency or on-target knockout efficiency) and its side effects and mutations (off-target profile or off-target effects) has an important role in sgRNA design task. Also, researchers will be able to obtain these sequence parameters without performing a physical genetic modification, saving time and resources for the actual experimentation. To refine sgRNA design task, various efficiency prediction systems have been developed, using various approaches. For example, locating PAM sequence (CasFinder [4]), scoring efficiencies empirically based on sequence key features (CHOPCHOP [5]), or predicting them with training models (sgRNA designer [6], sgRNA scorer [7,8], SSC [9], CRISPRscan [10]). However, prediction systems based on deep learning principles have surpassed their competitors in both predicting on-target and off-target efficiencies.
The repetitions in a CRISPR locus have variable size: they usually range from 28 to 37 bp. Much shorter repetitions (23 bp) have been discovered and we focused on these ones. Other authors focused on these lengths too, in these preliminary experiments. This paper is presenting CRISPRLearner, a system that uses a deep convolutional neural network (CNN) to extract and automatically learn sequence features and determinants and predict on-target cleavage efficiency of an up to 23-bp sgRNA.

1.2. Related Works

Deep learning for sequencing data has been used [11,12,13]; it has also been used in some works to predict sgRNA on-target and off-target efficiency. For example, a deep learning approach to predict off-target effects is described by Lin in [14]. Another work that used deep learning to predict both off-target and on-target efficiencies is described in [15]. In this system, called DeepCRISPR, the sequence is encoded into a one-hot matrix, composed of 4 rows, one for each nucleobase, and 23 columns, one for each nucleobase in the 23-bp sgRNA sequence. The matrix gets augmented with additional rows corresponding to epigenetic features, to build a generalized model. This matrix then gets passed as input to a CNN, which is able to use both linear regression and classification to predict efficiencies. In the first case, the predicted value is a real value, while in second case a class is predicted (0 low efficiency, 1 high efficiency).
The system developed by Xue [16], called DeepCas9, uses a CNN too. A sequence up to 30-bp is encoded into a one-hot matrix using the same one-hot encoding scheme used in [15], but without adding additional rows for epigenetic features. The obtained matrix gets passed as input to the CNN that uses linear regression to predict efficiency represented by a real value.
All these three studies use similar encoding mechanism to transform each sgRNA sequence into a data format suitable for the CNN. In fact, CNNs take as input a matrix of values, corresponding to the pixel matrix of an image. Each cell of this matrix contains a value representing the color in the corresponding cell of the pixel matrix. For grey-level pictures, matrix cells only contain real values from 0 to 1, where 0 represents white, 1 represents black, and values in between them represent the shades of grey. In [14,15,16], the sgRNAs get encoded into matrixes where cells assume only 0 and 1 values. Each of them is then served as input to the CNN that makes predictions. Other techniques for comparing images can be found in [17] and an interesting application of NN-based sequencing system is in [18].
The system presented in this paper uses a CNN to predict a score for on-target knockout efficiency: 10 models regarding different type of organisms and cells have been trained using 10 different datasets. The efficiency of a sequence is calculated using one of these 10 models, depending on the organism the sequence has been designed for. In DeepCas9, the efficiency score is calculated with a weighted sum between the scores predicted by three trained models. Moreover, in DeepCas9, the sequence accepted are 30-bp sequence, which we found out was an uncommon type. In DeepCRISPR, different models are used to predict efficiency, some based on a binary classification (1 efficient, 0 not efficient) and some on regression. The system here presented system uses regression, and aims to output a more useful grade of efficiency instead of knowing just if a sequence is efficient or not.
In our work, the sgRNA sequence is encoded into a 4 × 23 one-hot matrix that is served as input to the CNN. We also implemented a particular technique to encode sequences with a length less than 23-bp. In addition, datasets are augmented with a particular technique. These details will be described further.

2. Materials and Methods

2.1. Datasets

To train and develop the system here presented, the datasets used by Xue in [16] were used, consisting in 10 sgRNA efficiency datasets covering several cell types of five species, which were collected by Haeussler in [19]. These ten datasets were:
  • Chari dataset [7], consisting in 1234 guides targeting Human 293T cells
  • Wang/Xu dataset [9,20], consisting in 2076 guides targeting 221 genes in Human HL-60 cells
  • From Doench dataset [21], 951 guides targeting various mouse-EL4 cells were kept (as said in [16], the sequences that were kept targeted Cd5, Cd28, H2-K, Cd45, Thy1, and Cd43 genes)
  • A new version of Doench et al. dataset [6], consisting in 2333 guides targeting CCDC101, MED12, TADA2B, TADA1, HPRT, CUL3, NF1, and NF2 genes from Human A375 cells
  • Hart dataset [22], consisting in 4239 guides targeting 829 genes in Human Hct116 cells
  • Moreno-Mateos dataset [10], consisting in 1020 guides targeting 128 genes in Zebrafish genome
  • Gandhi dataset, consisting in 72 guides targeting different genes in Ciona genome
  • Farboud dataset [23], consisting in 50 guides targeting different genes in Caenorhabditis elegans genome
  • Varshney dataset [24], consisting in 102 guides targeting different genes in Zebrafish genome
  • Gagnon dataset [25], consisting in 111 guides targeting different genes in Zebrafish genome
These datasets were aggregated with others in [19], creating a dataset of 31625 sgRNAs with their relative knockout efficiencies. Unfortunately, we were not able to merge datasets from the same organisms (e.g., Human, Zebrafish datasets). In fact, human datasets were referring to different cell types while for zebrafish dataset were left separated since it was not possible to extract information about cell types or tissues. Each dataset had its own measurement scale for knockout efficiencies, producing a dataset with non-standardized knockout efficiency measurements. Moreover, some datasets presented sequences with a length less than 23-bp, meaning that these sequences were not in form of a 20-bp sequence followed by a 3-bp PAM sequence, leading to non-standardized sequences too. To solve these problems, we adopted some strategies that will be described later.

2.2. Software

The system was developed using Python language, because of its simplicity and popularity compared to other programming languages. The integrated development environment used to develop CRISPLearner was Pycharm, in combination with VSCode for minor modifications. Also, Git version control system was used, in combination with GitHub.
To develop the core of the system, the convolutional neural network behind the prediction task, Tensorflow has been used, including Keras. Keras uses a data structure called model to represent the way which network layers are organized. In this project, the sequential model has been used. Other libraries used are Scipy, an open library dedicated to scientific computing, NumPy, a library for scientific calculation that provides many functions for operations between matrices, Scikit-learn, a library for machine learning supporting algorithms and Python default libraries, like os, re, and shutil for various purposes.

3. System Description

This section will describe the techniques used to extract datasets from Haeussler [19] dataset, the strategies adopted to standardize sequences and efficiencies, along with the sequence representation technique used. In addition, the dataset augmentation technique adopted, the CNN architecture and the CLI (Command-Line Interface) implemented will be described.

3.1. Dataset Creation

This section will describe the procedure adopted to extract and prepare data.

3.1.1. Data extraction

As said before, the datasets used to train the CNN are ten, which were collected with others in the Haeussler dataset [19]. Each row of this last dataset contained data regarding a single sgRNA sequence. The columns used to extract each dataset were four:
  • dataset column, containing the name of the dataset where the sequence was extracted from
  • seq column, containing the actual sgRNA sequence
  • modFreq column, containing the efficiency value
  • longSeq100Bp column, the extended 100-bp sequence
For each of the ten datasets, a file containing only a 23-bp sequence and its efficiency was created. To identify only the sequences from the datasets needed, the dataset column was used, which contained the dataset name. Using these names, ten files corresponding to the ten datasets were created. Each extracted dataset contained only two columns, a column containing the 23-bp sgRNA sequence and a column containing cleavage efficiency.

3.1.2. Standardizing sgRNA Sequences

Some datasets include sequences with a length less than 23-bp. For example, Gandhi dataset had sequences of 22-bp, composed of a 19-bp sequence followed by a 3-bp PAM sequence. Instead, Doench A375 and Hart datasets had sequences of 20-bp not followed by a 3-bp PAM, as it should be.
Therefore, before extracting the datasets, 23-bp sgRNA sequences in form of 20-bp sequences followed by a 3-bp PAM sequence had to be extracted. In fact, in Doench A375 and Hart datasets, the missing PAM sequence was instead in the 3 nucleobases immediately following the seq sequence in longSeq100Bp extended sequence. So, the seq sequence was first found in longSeq100Bp sequence and then extracted along with the 3 immediately following nucleobases (the PAM sequence), obtaining a 23-bp sequence composed of a 20-bp sequence followed the 3-bp PAM sequence.
Instead, for Ghandi dataset, the seq sequence was first found in longSeq100Bp sequence and then extracted along with the first immediately preceding nucleobase.
After this operation, the ten files corresponding to the extracted datasets were created.

3.1.3. Standardizing Efficiency Measurement

Each dataset used a different scale to measure cleavage efficiency, based on the technique used to measure these values. In order to train a regression model, it was necessary to rescale each of these values to a standard measurement scale.
To do this, the same solution described by Xue in [16] was adopted. Each extracted dataset was rescaled using a min–max scaler mapping a value in the range [0, 1]. This function was defined as f n k = f k f m i n f m a x f m i n , where f m a x and f m i n are, respectively, the maximum and minimum efficiency value of the dataset, f k is the original efficiency value to rescale and f n k is the rescaled value. This rescaling function was applied on each sequence of the ten extracted datasets. For each extracted dataset, a rescaled dataset file was created, containing a column with the 23-bp sequence and a column with its rescaled efficiency, rescaled using the minmax function described above. Efficiency was standardized in order to have a general measuring of the it, even if the datasets are not merged, so even if the original efficiency is in a different scale than [0, 1], the system will always output an efficiency included in this interval, no matter what the trained model is.

3.1.4. Data augmentation Technique

During the experimentation, data from different cell types has been used to train the CNN model. Initially, only the rescaled datasets were used, but the results obtained were unsatisfactory, leading to an overfitted and less performing model. Modifying the CNN architecture or changing some of its hyperparameters did not improve model performances.
For this reason, a data augmentation technique was adopted. In particular, the data augmentation technique used by Chuai in [15] was adopted. In fact, it seems that mismatches in the PAM distal region, which is the 5′ end of a 23-bp sgRNA, have no influence on the sequence efficiency [6,15,20], giving us the possibility to generate new sequences, starting from a single sgRNA, with the same efficiency value of the original one. The rescaled sets were then augmented, generating two mismatches in the first two nucleobases of the extracted sequences, obtaining sixteen new sequences for each original sgRNA sequence (one of them was the original sgRNA sequence), each of them having the same identical efficiency value.
Augmenting data has proved to be a key step in improving the CNN performances, as the problem of low performances and high losses seemed to reside in the data itself rather than in the CNN architecture. Table 1 resumes the number of sequences for each dataset before and after augmentation procedure (training on 80% of the sequences, see Section 4).

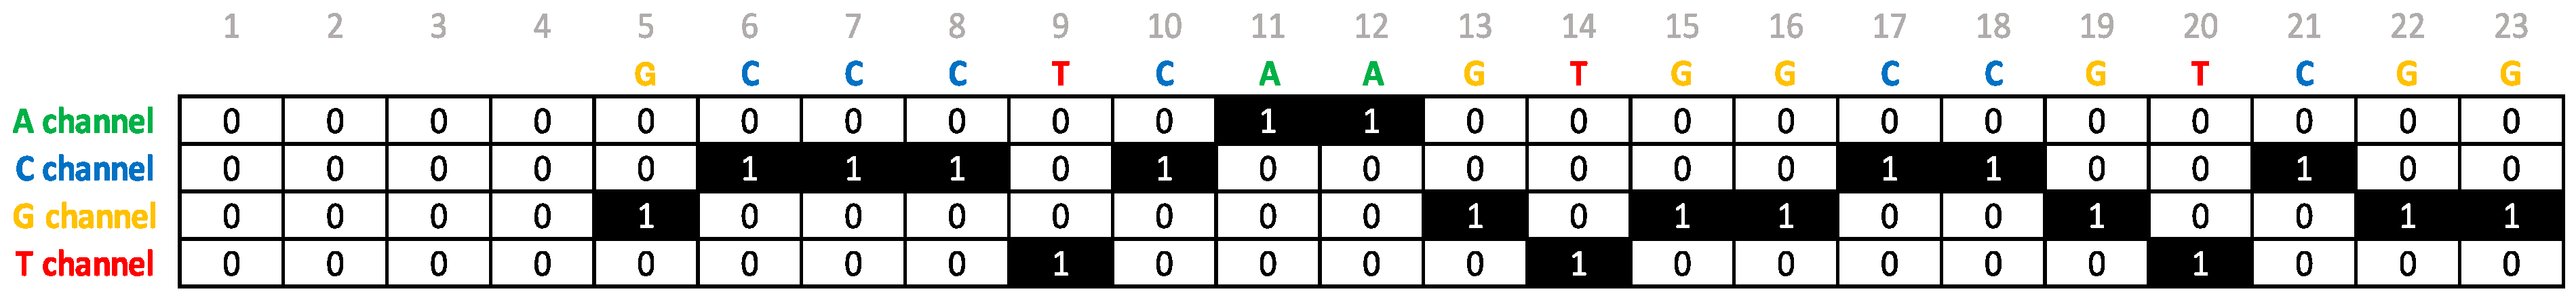
3.2. Data Representation for Training

To make the sequences usable for the CNN, each sequence was encoded in a one-hot matrix with 23 columns, corresponding to the nucleobases of the sequence, and 4 rows, corresponding to A, C, G, and T bases channels. CRISPRLearner supports sequence up to a maximum of 23 nucleobases. For sequences with less than 23 nucleobases, a different approach has been adopted. Since an sgRNA gets encoded into a one-hot manner, if a sequence as a length less than 23, some columns of zeros have been added at the beginning of the real one-hot matrix. So, for example, a sequence of 19-bp will be encoded into a 4 × 19 one-hot matrix and 4 (23 minus length of sequence) columns of zeros have been added at the start of the matrix, creating a matrix of 4 × 23 and making the matrix usable for the CNN. All the dataset that we used for these experiments contains only sequences of 23-bp, so this problem should never appear, since the system is designed to work efficiently with 23-bp sequences. However, we have left the possibility to experiment on shorter sequences if the PAM sequence cannot be extracted, retrieved or is omitted or if a researcher wants to experiment using simply shorter sequences. Figure 1 shows an example of one-hot encoding of a sequence that has a length less than 23-bp.

3.3. Description of the Convolutional Neural Network Architecture

The core of the system is a convolutional neural network that performs regression to predict sgRNA cleavage efficiency. Differently from Chuai et al. [15], this model is focused on a regression task instead of a classification task. This system uses only real value labels since it’s based on regression instead of using class label. In regression, the labels are real values, indicating precisely the efficiency of the sgRNA on a range of real values between 0 and 1. In classification, labels are class labels, indicating only a binary efficiency, i.e., 0 if a sgRNA is not effective and 1 if it is effective.
The first layer is an input layer that takes as input a 4 × 23 × 1 one-hot matrix. Then, a convolution layer performs 50 convolutions with 4x4 kernel on the input matrix, producing 50 feature maps of size 1 × 20. After convolution, a ReLU activation layer removes outputs below 0, transforming them into zeros. After ReLU activation layer, a max pooling layer performs 1 × 2 max pooling of the feature maps produced by the convolution layer, producing 50 feature maps of size 1 × 10. After pooling, a flatten layer combines the pooling results in a vector with size of 500. Then, two fully connected layers are added, each with 128 nodes. Each fully connected layer is followed by a ReLU activation layer. Between the fully connected layers, a dropout layer is added, with a dropout rate of 0.3, to reduce overfitting. Then, a fully connected (or dense) layer serves as output layer followed by a linear regression activation layer. Table 2 resumes the CNN architecture.
Specifically, after being converted into a one-hot matrix with 4 rows and 23 columns, the sequence is passed to the CNN. The input layer reads the matrix as if it is a 4 × 23 black and white image. The first convolutional layer performs 50 convolutions with a 4 × 4 filter and a stride of 1, generating 50 feature maps of dimension 1 × 20. After convolution, the ReLU layer outputs results above threshold. The next pooling layer performs a 1 × 2 max pooling of each feature map using a stride of 1, producing 50 feature maps of size 1 × 10. All the pooling results are combined into a single vector by a flatten layer, resulting in a vector of 500 elements. The vector is then passed to two fully connected layers, each composed of 128 nodes, which have a ReLU layer and a dropout layer in between them, with a dropout rate of 0.3, to avoid overfitting. After the fully connected layers, the output layer outputs the prediction for on-target efficiency using linear regression.
For each dataset, a model was trained on 250 epochs with a batch size of 32 and a learning rate of 0.001. An early stopping was also added to detect automatically the minimum validation loss, with a patience of 100 epochs. The models were also optimized with Adam algorithm, trained using 80% of each dataset and validated on the remaining 20% [26,27]. Each dataset was also randomly shuffled before training.
To evaluate each model, the loss function used was Mean Squared Error, while the metric used was Spearman correlation coefficient from Scipy library. The Spearman score of each model was calculated between the predicted efficiencies (on the 20% validation set) and the respective real efficiencies from the datasets. After each model training procedure, the model weights were saved.

4. Results

The efficiency prediction of the system CRISPRLearner was evaluated using Spearman correlation coefficient and using Mean Squared Error loss. The system was trained on 80% of each dataset and tested on the 20% left, generating ten different models. Few evaluations made before adding the data augmentation technique previously described, pointed out low performances, with an average Spearman correlation coefficient of about 0.2 and a high loss. The models trained also showed overfitting and high validation losses. Adding data augmentation improved both losses and Spearman scores, avoiding overfitting and making the system more effective. In Table 3 it is reported a Spearman score comparison between this system and DeepCas9. The results are interesting, but it is clear that we cannot speak of a decisive improvement in performance in comparison with DeepCas9, which however in some datasets achieves better results. It is also interesting to compare the results with other competitors by analyzing Figure 2 in [16].

5. Conclusion and Future Work

As indicated in the Table 3, CNN-based systems perform better that other system on some of the datasets. This means that deep-learning based systems are generally performing better than machine-learning based systems and systems based on other techniques. There are some exceptions, like Doench mEl4, Doench A375, and Ghandi datasets, indicating that some other approaches still may perform better on some kind of data.
The system presented in this paper shows good performances, paying a lower generalization. However, allowing the user to train his own models based on the datasets he provides, leads to a generalization of the system, even if the model itself is not generalized. In fact, a single model was not trained for all the datasets, but for each dataset a model was trained and training more models on new datasets will allow the system to predict more and more sgRNA efficiencies of different genomes, cell types, and genes.
To support multiple cell identification, the user is free to train its own model using a different dataset, expanding the system and allowing it to predict sgRNA efficiencies regarding new cell types, gene, or genome types. This approach will allow researchers to contribute in the overall expansion and improvement of the system, adding new trained models to perform predictions on new types of cells.
A question could be why performance results were not better than the DeepCas9 in some datasets, but the answer could not be definitive. Performances can depend on type of data augmentation, on the number of original sequences, on the similarity between some sequences and obviously on the design details of each system. It is not easy to describe the behavior of the internal layers of the CNN, but we will deepen this argument in a further study.
The system here presented will be expanded, as just said, with more cell and genome types. Also, the ability to predict off-target efficiencies will be added to the system, transforming CRISPRLearner in a complete system for CRISPR/Cas9 sgRNA design. Also, deploying the system online will permit it to be expanded with new trained models more easily.

Author Contributions

Conceptualization, G.D. and P.C.; methodology, R.C., M.V. and G.D.; software, P.C. and D.C.; validation, V.B.; formal analysis, V.B.; investigation, P.C. and R.C.; resources, D.C.; data curation, P.C.; writing—original draft preparation, G.D. and P.C.; writing—review and editing, P.C., R.C., and M.V.; project administration, G.D.

Funding

This research received no external funding.

Conflicts of Interest

The authors declare no conflict of interest.

References

  1. Jinek, M.; Chylinski, K.; Fonfara, I.; Hauer, M.; Doudna, J.A.; Charpentier, E. A programmable dual-RNA-guided DNA endonuclease in adaptive bacterial immunity. Science 2012, 337, 816–821. [Google Scholar] [CrossRef] [PubMed]
  2. Doudna, J.A.; Charpentier, E. The new frontier of genome engineering with CRISPR-Cas9. Science 2014, 346, 1258096. [Google Scholar] [CrossRef] [PubMed]
  3. Zahra, H.; Ali, M.; Hui, W.; Dawei, L.; Yasin, O.; Honghua, R.; Qiang, Z. Strategies to Increase On-Target and Reduce Off-Target Effects of the CRISPR/Cas9 System in Plants. Int. J. Mol. Sci. 2019, 20, 3718. [Google Scholar] [CrossRef] [Green Version]
  4. Aach, J.; Mali, P.; Church, G.M. CasFinder: Flexible algorithm for identifying specific Cas9 targets in genomes. bioRxiv 2014, 005074. [Google Scholar] [CrossRef] [Green Version]
  5. Labun, K.; Montague, T.G.; Gagnon, J.A.; Thyme, S.B.; Valen, E. CHOPCHOP v2: A web tool for the next generation of CRISPR genome engineering. Nucleic Acids Res. 2016, 44, W272–W276. [Google Scholar] [CrossRef]
  6. Doench, J.G.; Fusi, N.; Sullender, M.; Hegde, M.; Vaimberg, E.W.; Donovan, K.F.; Smith, I.; Tothova, Z.; Wilen, C.; Orchard, R.; et al. Optimized sgRNA design to maximize activity and minimize off-target effects of CRISPR-Cas9. Nat. Biotechnol. 2016, 34, 184–191. [Google Scholar] [CrossRef] [Green Version]
  7. Chari, R.; Mali, P.; Moosburner, M.; Church, G.M. Unraveling CRISPR-Cas9 genome engineering parameters via a library-on-library approach. Nat. Methods 2015, 12, 823–826. [Google Scholar] [CrossRef] [Green Version]
  8. Chari, R.; Yeo, N.C.; Chavez, A.; Church, G.M. sgRNA Scorer 2.0: A Species-Independent Model To Predict CRISPR/Cas9 Activity. ACS Synth. Biol. 2017, 6, 902–904. [Google Scholar] [CrossRef] [Green Version]
  9. Xu, H.; Xiao, T.; Chen, C.-H.; Li, W.; Meyer, C.A.; Wu, Q.; Wu, D.; Cong, L.; Zhang, F.; Liu, J.S.; et al. Sequence determinants of improved CRISPR sgRNA design. Genome Res. 2015, 25, 1147–1157. [Google Scholar] [CrossRef] [Green Version]
  10. Moreno-Mateos, M.A.; Vejnar, C.E.; Beaudoin, J.-D.; Fernandez, J.P.; Mis, E.K.; Khokha, M.K.; Giraldez, A.J. CRISPRscan: Designing highly efficient sgRNAs for CRISPR-Cas9 targeting in vivo. Nat. Methods 2015, 12, 982–988. [Google Scholar] [CrossRef] [Green Version]
  11. Zhang, S.W.; Wang, Y.; Zhang, X.X.; Wang, J.Q. Prediction of the RBP binding sites on lncRNAs using the high-order nucleotide encoding convolutional neural network. Anal. Biochem. 2019, 583, 113364. [Google Scholar] [CrossRef] [PubMed]
  12. Ding, W.; Mao, W.; Shao, D.; Zhang, W.; Gong, H. DeepConPred2: An Improved Method for the Prediction of Protein Residue Contacts. Comput. Struct. Biotechnol. J. 2018, 16, 503–510. [Google Scholar] [CrossRef] [PubMed]
  13. Le, N.Q.K.; Ho, Q.T.; Ou, Y.Y. Incorporating deep learning with convolutional neural networks and position specific scoring matrices for identifying electron transport proteins. Comput. Chem. 2017, 38. [Google Scholar] [CrossRef] [PubMed]
  14. Lin, J.; Wong, K.-C. Off-target predictions in CRISPR-Cas9 gene editing using deep learning. Oxf. Acad. Bioinform. 2018, 34, i656–i663. [Google Scholar] [CrossRef] [PubMed] [Green Version]
  15. Chuai, G.; Ma, H.; Yan, J.; Chen, M.; Hong, N.; Xue, D.; Zhou, C.; Zhu, C.; Chen, K.; Duan, B.; et al. DeepCRISPR: Optimized CRISPR guide RNA design by deep learning. Genome Biol. 2018, 19, 80. [Google Scholar] [CrossRef]
  16. Xue, L.; Tang, B.; Chen, W.; Luo, J. Prediction of CRISPR sgRNA activity using a deep convolutional neural network. J. Chem. Inf. Modeling 2019, 59, 615–624. [Google Scholar] [CrossRef]
  17. Dimauro, G. A new image quality metric based on human visual system. In Proceedings of the 2012 IEEE International Conf. on Virtual Environments Human-Computer Interfaces and Measurement Systems, Tianjin, China, 2–4 July 2012; pp. 69–73. [Google Scholar] [CrossRef]
  18. Casalino, G.; Castellano, G.; Consiglio, A.; Liguori, M.; Nuzziello, N.; Primiceri, e.D. Analysis of microRNA expressions for pediatric multiple sclerosis detection. In Modeling Decisions for Artificial Intelligence. MDAI2019; Lecture Notes in Computer Science. LNAI 11676; Springer: Cham, Switzerland, 2019; pp. 177–188. [Google Scholar] [CrossRef]
  19. Haeussler, M.; Schonig, K.; Eckert, H.; Eschstruth, A.; Mianne, J.; Renaud, J.-B.; Schneider-Maunoury, S.; Shkumatava, A.; Teboul, L.; Kent, J.; et al. Evaluation of off- target and on-target scoring algorithms and integration into the guide RNA selection tool CRISPOR. Genome Biol. 2016, 17, 148. [Google Scholar] [CrossRef]
  20. Wang, T.; Wei, J.J.; Sabatini, D.M.; Lander, E.S. Genetic Screens in Human Cells Using the CRISPR-Cas9 System. Science 2014, 343, 80–84. [Google Scholar] [CrossRef] [Green Version]
  21. Doench, J.G.; Hartenian, E.; Graham, D.B.; Tothova, Z.; Hegde, M.; Smith, I.; Sullender, M.; Ebert, B.L.; Xavier, R.J.; Root, D.E. Rational design of highly active sgRNAs for CRISPR-Cas9-mediated gene inactivation. Nat. Biotechnol. 2014, 32, 1262–1267. [Google Scholar] [CrossRef] [Green Version]
  22. Hart, T.; Chandrashekhar, M.; Aregger, M.; Steinhart, Z.; Brown, K.R.; MacLeod, G.; Mis, M.; Zimmermann, M.; Fradet-Turcotte, A.; Sun, S.; et al. High-Resolution CRISPR Screens Reveal Fitness Genes and Genotype-Specific Cancer Liabilities. Cell 2015, 163, 1515–1526. [Google Scholar] [CrossRef] [Green Version]
  23. Farboud, B.; Meyer, B.J. Dramatic Enhancement of Genome Editing by CRISPR/Cas9 Through Improved Guide RNA Design. Genetics 2015, 199, 959–971. [Google Scholar] [CrossRef] [PubMed] [Green Version]
  24. Varshney, G.K.; Pei, W.; LaFave, M.C.; Idol, J.; Xu, L.; Gallardo, V.; Carrington, B.; Bishop, K.; Jones, M.; Li, M.; et al. High-throughput gene targeting and phenotyping in zebrafish using CRISPR/Cas9. Genome Res. 2015, 25, 1030–1042. [Google Scholar] [CrossRef] [PubMed] [Green Version]
  25. Gagnon, J.A.; Valen, E.; Thyme, S.B.; Huang, P.; Ahkmetova, L.; Pauli, A.; Montague, T.G.; Zimmerman, S.; Richter, C.; Schier, A.F. Efficient Mutagenesis by Cas9 Protein-Mediated Oligonucleotide Insertion and Large-Scale Assessment of Single-Guide RNAs. PLoS ONE 2014, 9, e98186. [Google Scholar] [CrossRef] [PubMed]
  26. Hussain, W.; Khan, Y.D.; Rasool, N.; Khan, S.A.; Chou, K.C. SPalmitoylC-PseAAC: A sequence-based model developed via Chou’s 5-steps rule and general PseAAC for identifying S-palmitoylation sites in proteins. Anal. Biochem. 2019, 568, 14–23. [Google Scholar] [CrossRef]
  27. Le, N.Q.K.; Fertility, G.R.U. Identifying Fertility-Related Proteins by Incorporating Deep-Gated Recurrent Units and Original Position-Specific Scoring Matrix Profiles. J. Proteome Res. 2019, 18, 3503–3511. [Google Scholar] [CrossRef]
Figure 1. One-hot encoding of a 19-base pair (bp) sequence.
Electronics 08 01478 g001
Table 1. Number of sequences in the original and augmented datasets.
DatasetOriginal SequencesAugmented Sequences
Chari123419,744
Wang/Xu207633,216
Doench mouse-EL495115,216
Doench A375233337,328
Hart423967,824
Moreno-Mateos102016,320
Gandhi721152
Farboud50800
Varshney1021632
Gagnon1111776
Table 2. Layers of the convolutional neural network.
NLayer
1Input: 4 × 23 × 1
2Convolution: 4 × 4 size, 50 filters, 1 stride
3ReLU
4Max pooling: 1 × 2 size, 1 stride
5Flatten
6Fully connected: 128 units
7ReLU
8Dropout: 0.3 dropout rate
9Fully connected: 128 units
10ReLU
11Fully connected (output): 1 unit
12Linear regression
Table 3. Performance comparison of CRISPRLearner with DeepCas9.
DatasetCRISPRLearnerDeepCas9
Chari0.490.49
Wang/Xu0.690.61
Doench mouse-EL40.510.59
Doench A3750.230.38
Hart0.550.41
Moreno-Mateos0.190.23
Gandhi0.360.32
Farboud0.600.57
Varshney0.350.3
Gagnon0.350.25

