Localization of Moving Objects Based on RFID Tag Array and Laser Ranging Information


Abstract
:
1. Introduction
2. Related work
- RFID-based Systems: In RFID-based systems, time of arrival (TOA), time difference of arrival (TDOA), RSS, and angle of arrival (AOA) are the most commonly used models. Shen et al. introduced “ANTspin” which uses the AOA technique for the localization of a static tagged object by spinning antennas [18] while Abkari et al. combined TOA and AOA techniques for localization in a hospital environment [19]. Ma et al. proposed a tag-to-tag communication system to achieve multi-tag cooperative localization using the TDOA method [20]. Duan et al. used a SAR (synthetic aperture radar)-based model to estimate the spinning angle of RFID tags and achieved high accuracy [21] but spinning the tags is not possible in every scenario. Some researchers used RSS-based algorithms for localization, e.g. Kaltiokallio et al. used RSS in a recursive particle filter to achieve a high localization accuracy, but it also required a high number of reference tags [22]. Hsiao et al. used the “Real Time Location System” with multiple reference tags to enhance the localization accuracy of a person equipped with RFID tags [23]. Zhang et al. [24] used RSS in k-nearest neighbor (k-NN) algorithm and tried to reduce localization error. Zhao et al. proposed a range-based method using RSS and analyzed the similarity of backscattering; this method needs reference tags in the environment to get better localization results [25]. Wu et al. proposed an unwrapped phase position model to localize a static RFID tag [26]. Xiao et al. attached two tags to the same item and exploited the RFID phase for the localization of relatively small items in a controlled environment [27]. Buffi et al. tested and validated a localization method for tagged objects moving along a conveyor belt, where, in their experiments, the speed and path of the objects was already known [28]; however, tracking a human being is more complex as the movement path and speed of humans and animals are random. In another method [29], Buffi et al. achieved a high localization accuracy for static tags by using the SAR (synthetic aperture radar) approach in the context of the RFID phase-based technique.
- Sensor Fusion based Systems: Researchers fused information from different sensors (e.g., laser, vision sensors, sound etc.) for the localization of the objects. Liu et al. combined RFID and a 2d laser range finder to follow a dynamic RFID tag with obstacle avoidance capabilities using a mobile robot [30]. Wu et al. used a fuzzy reasoning algorithm, a fused laser and RFID to localize a robot using a single RFID tag [31]. Duan et al. proposed to fuse vision and RFID sensors to get a high accuracy [32] but because of the limitations of vision sensors, it could only work in specific environments. Llorca et al. implemented a people localization system for outdoor environments by fusing RFID and BLE (Bluetooth Low Energy) with a vision system and was able to recognize individuals in a group [33]. Alfian et al. proposed an RFID-based tracking system for food items by utilizing data mining techniques to predict missing sensor data [34]. Yang et al. improved particle filters by using some characteristics of moving direction in a densely tagged environment, but this method needs a much longer time to build the system model [35]. Wu et al. proposed another method to localize by the fusion of RFID and inertial measurement units (IMU) [36]. They created a virtual map with the help of four persons carrying RFID tags and compared the map results with RSS to increase localization accuracy. Proximity-based approaches were also tested by different researchers for localization in RFID systems. For example, Sequeira et al. constructed a model to localize moving humans wearing RFID tags and tried to build proximity between the robot and human [37]; however, proximity-based approaches are not cost-effective as an array of antenna is required for implementation.
- Hybrid Systems:RFID technology is also combined with other positioning systems such as GPS, Wifi, ZigBee and Bluetooth for localization. Suparyanto et al. combined inertial sensors and iGPS with RFID and developed a position monitoring system to localize container trucks [38]. Digiampaolo et al. presented a global localization system for an indoor autonomous vehicle equipped with odometer and RFID reader [39]. Zheng et al. also increased localization accuracy by combining GPS and RFID technologies [40]. Some researchers merged different technologies to improve the accuracy of indoor localization; for example, Wu et al. combined MM (magnetic matching), PDR (Pedestrian Dead Reckoning) and RFID in their research [41]. Recently, Luo et al. used Wifi and a RFID tag array to localize an educational robot [42], but arranging Wifi devices in a specific layout is needed in this hybrid system.
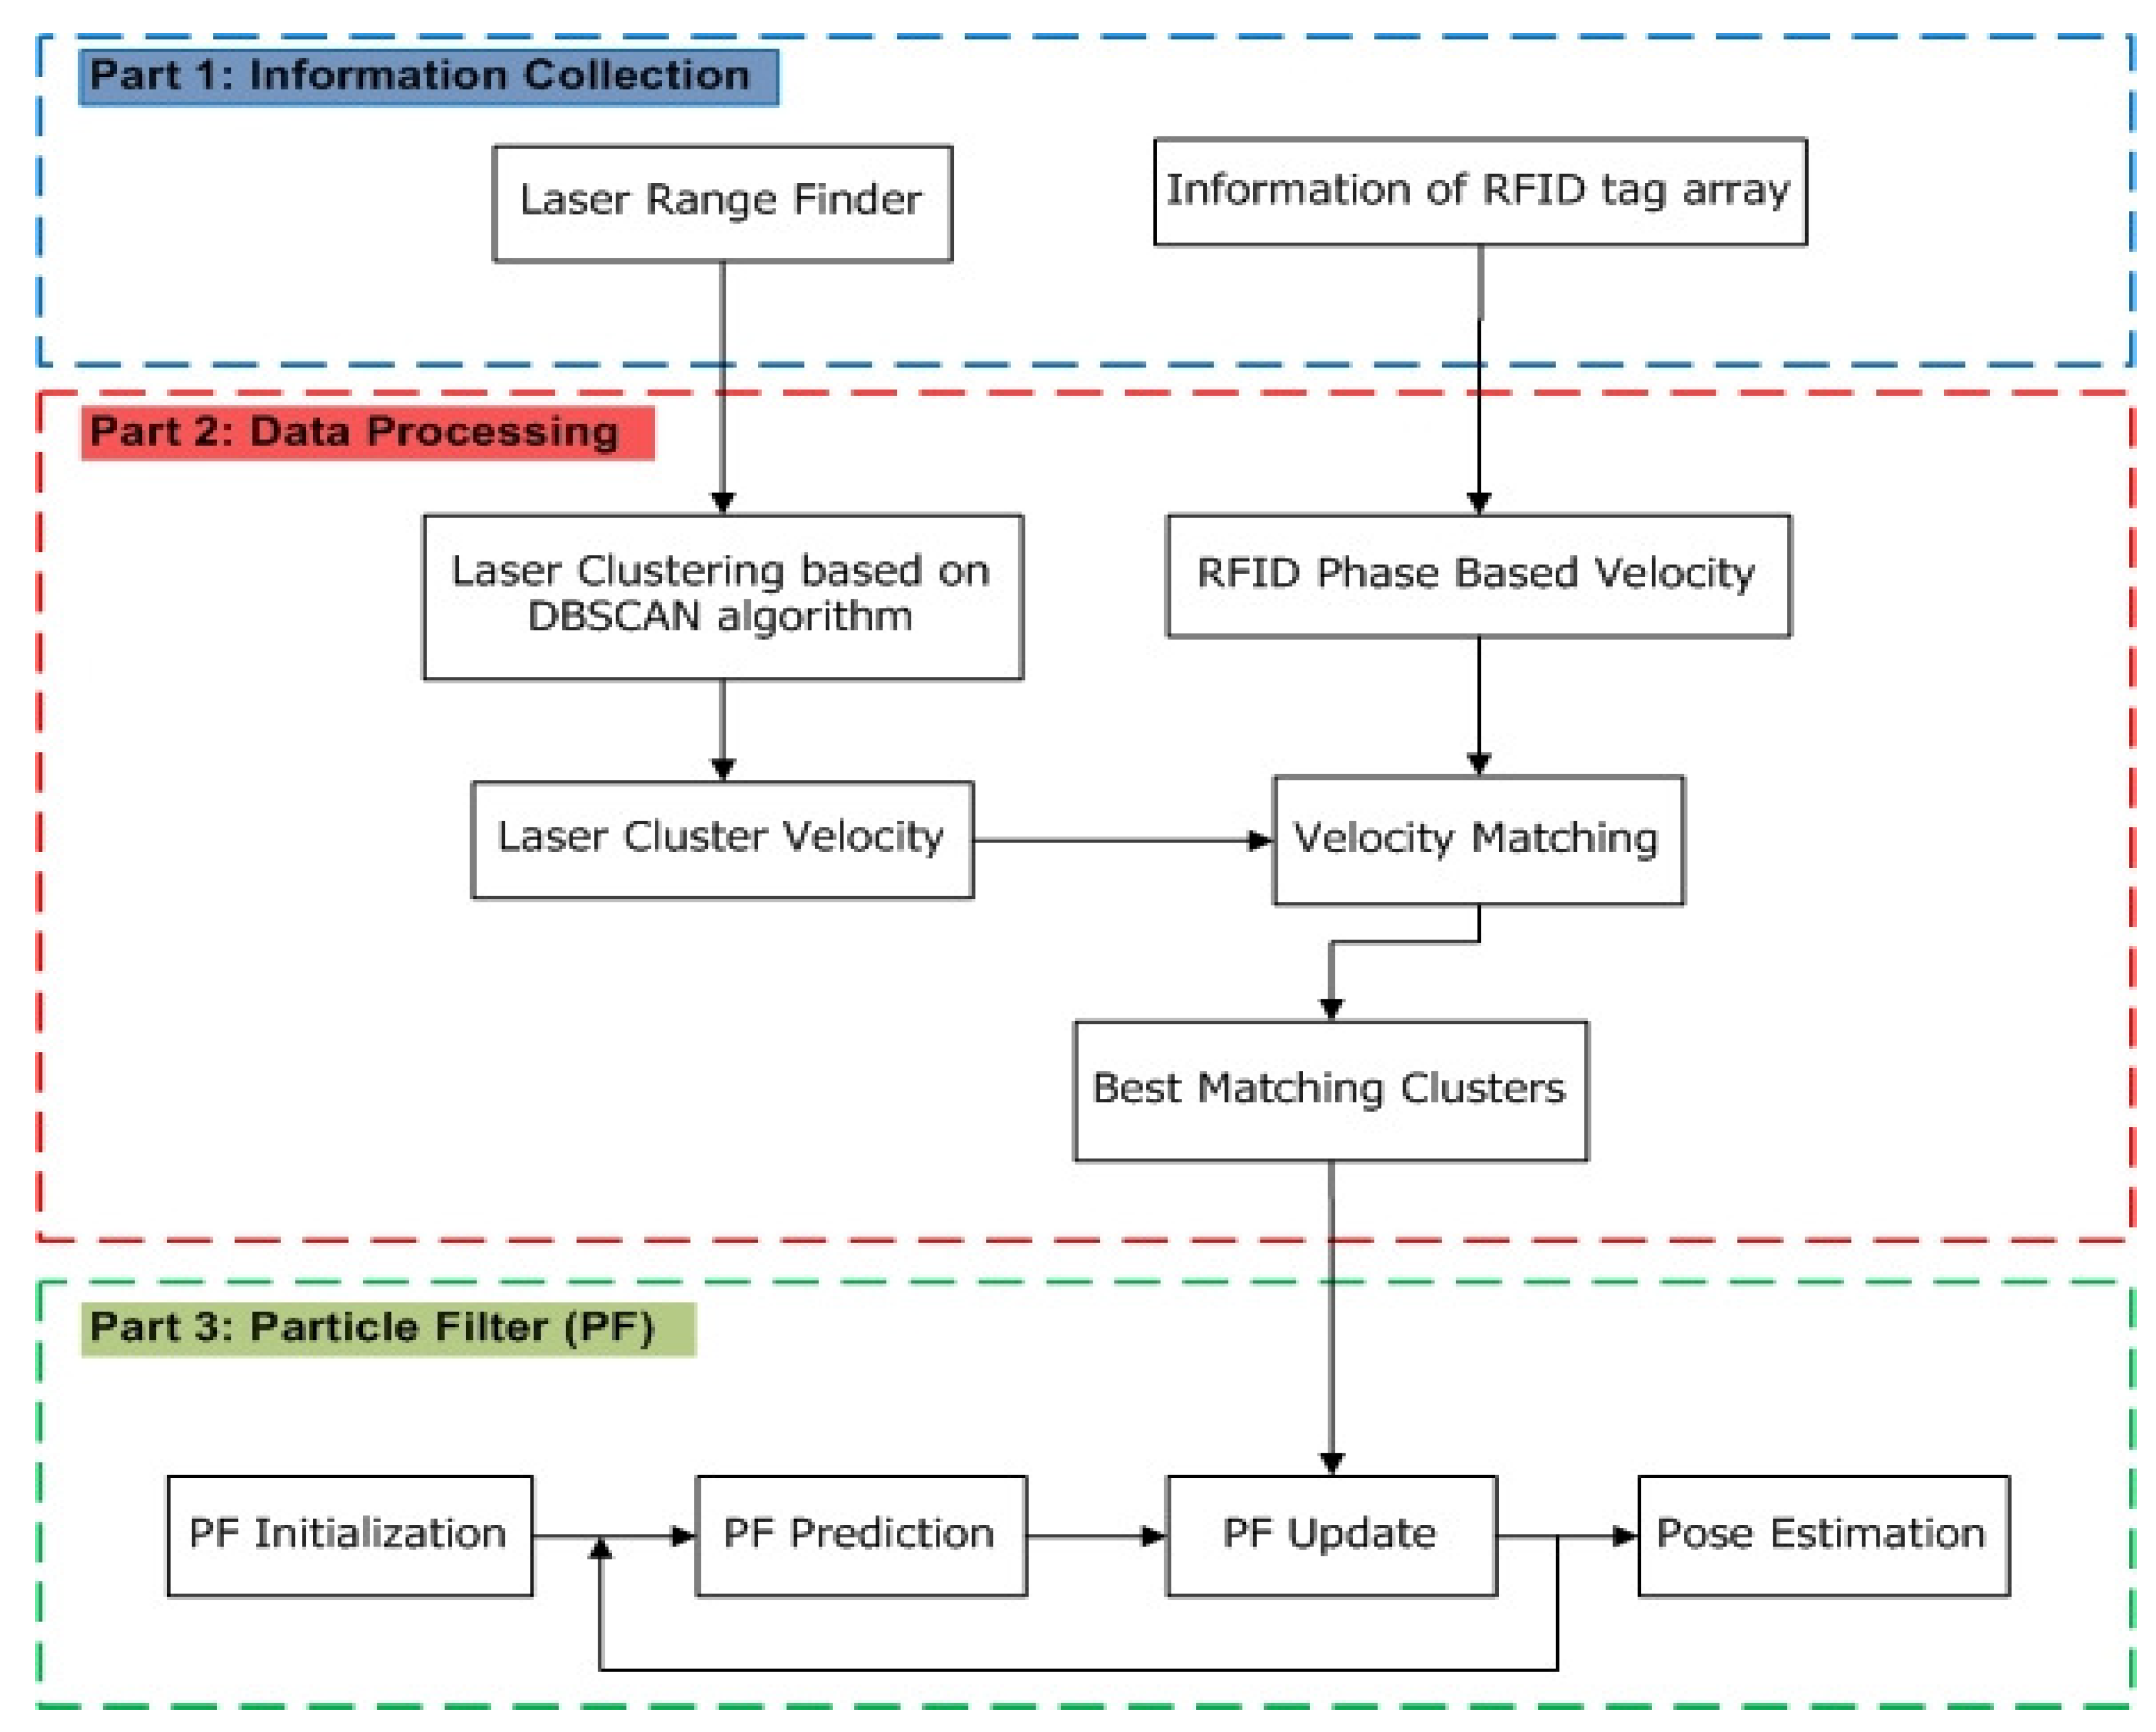
3. System Details
3.1. Tag Array Importance in Our Approach
3.2. Particle Filtering
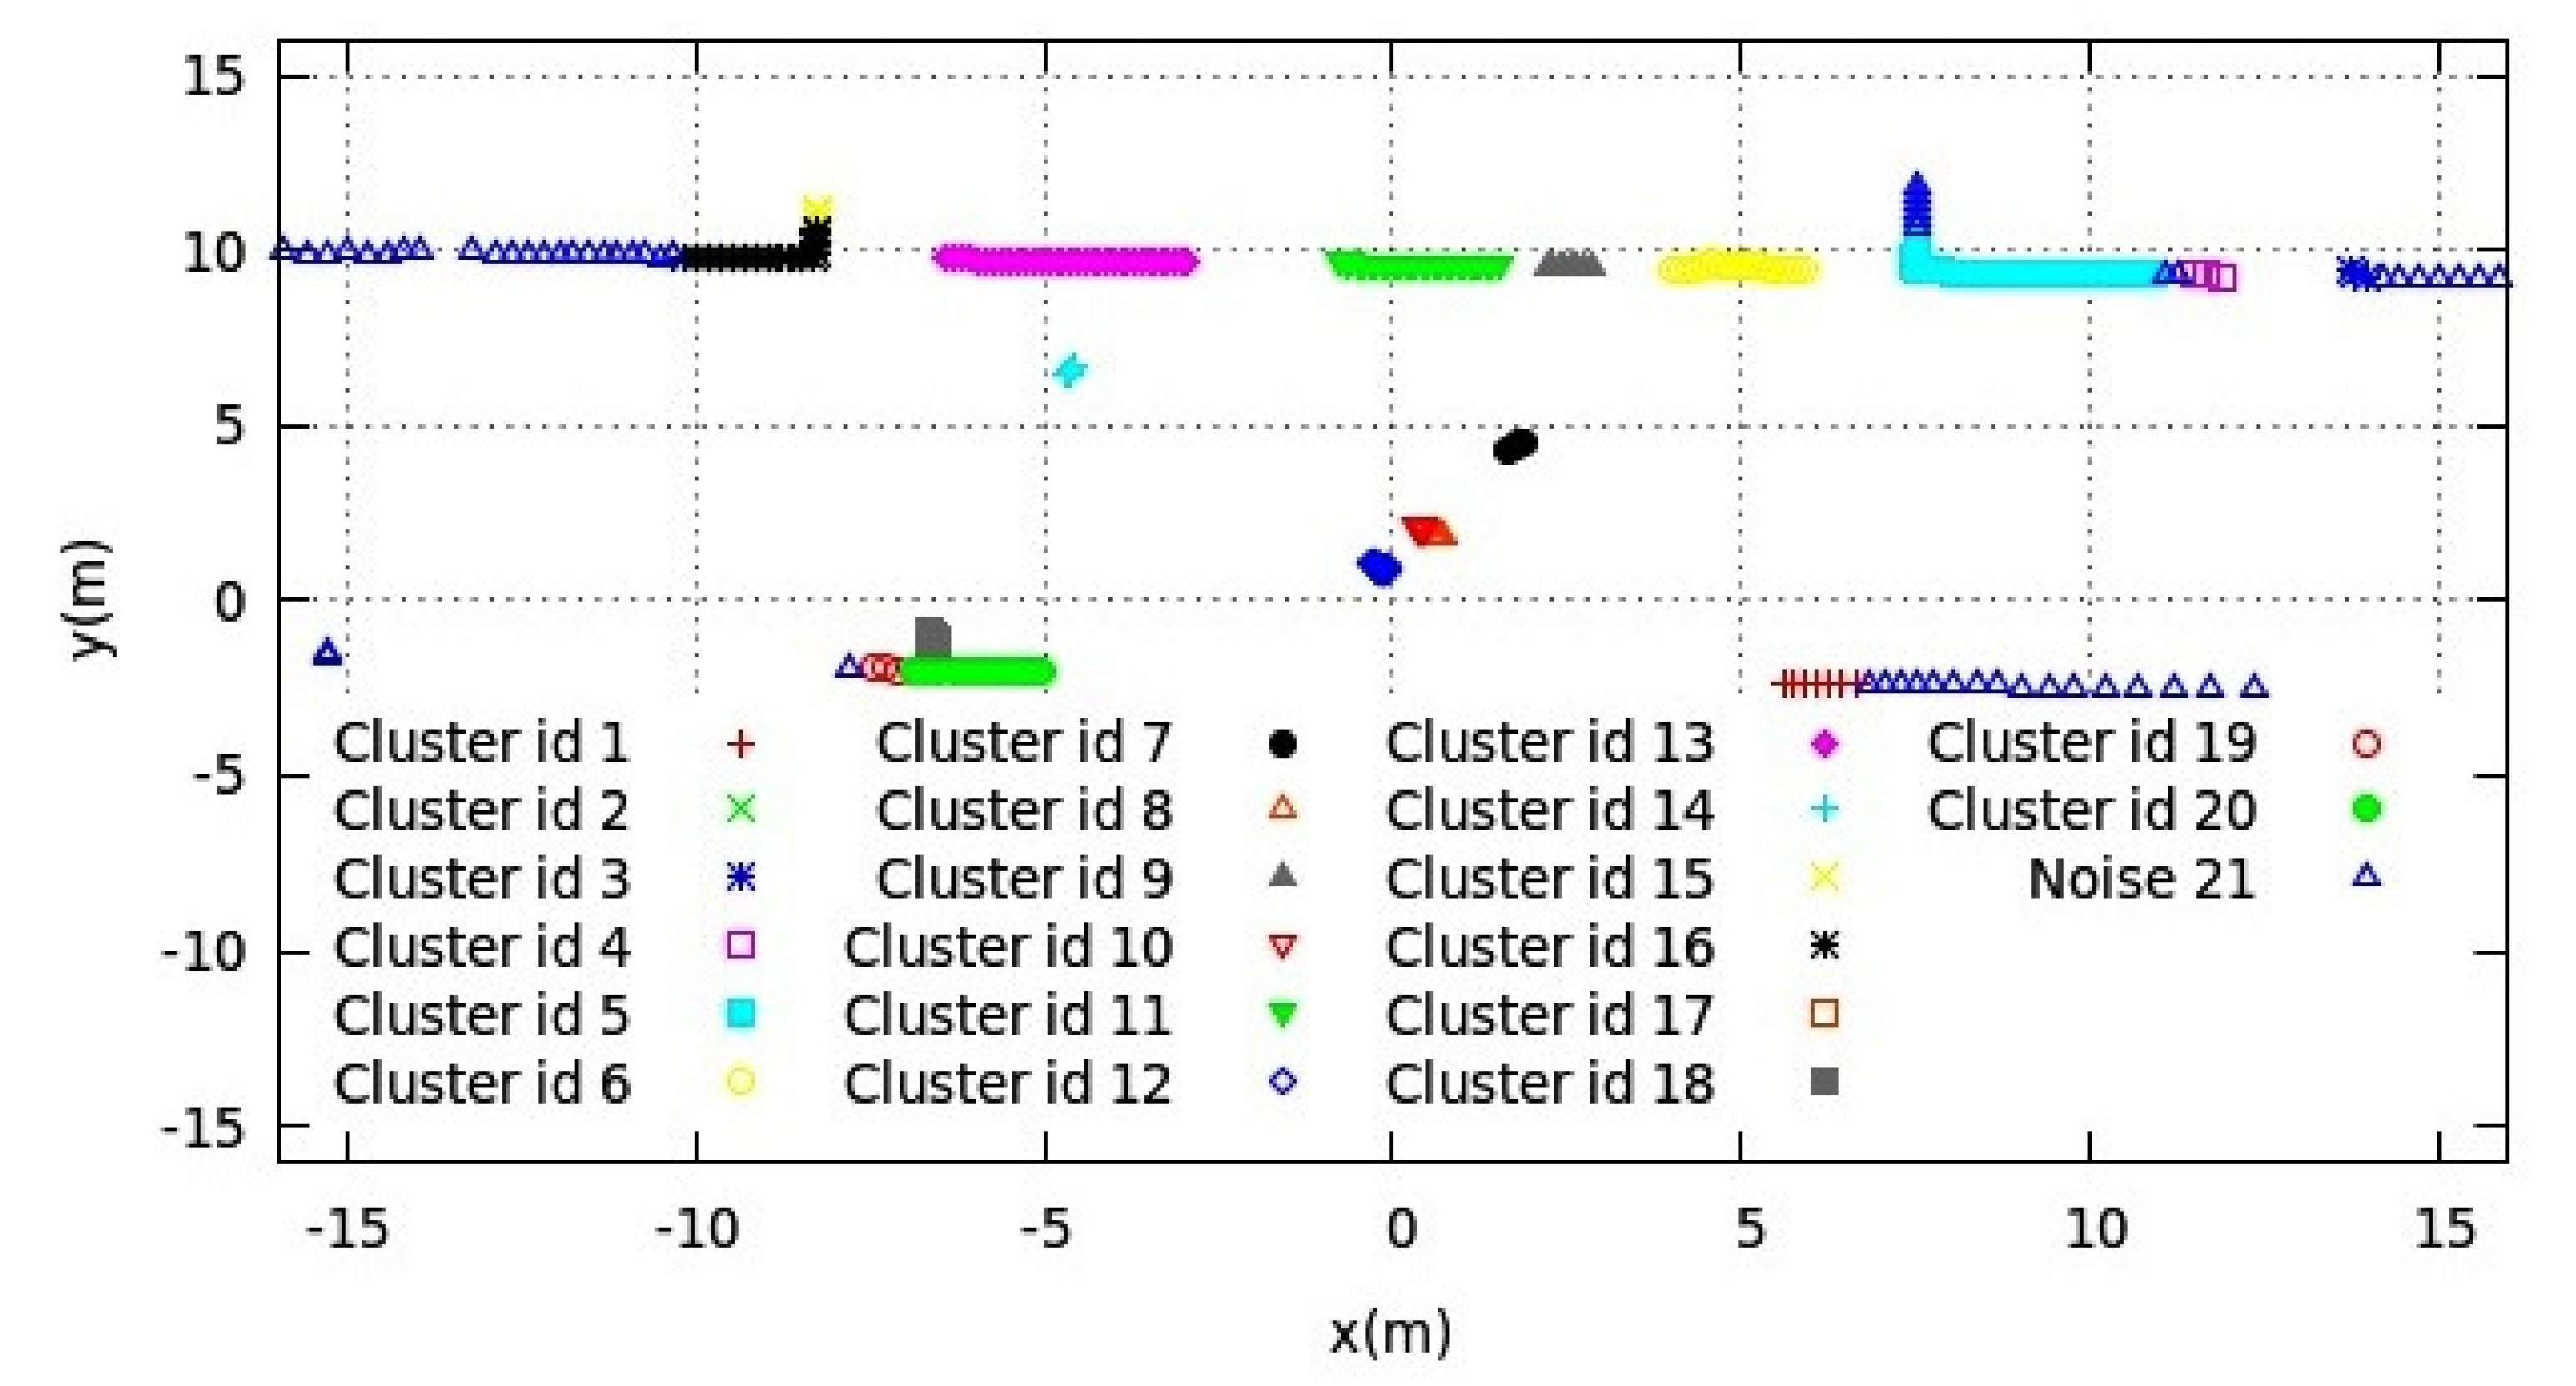
3.3. Laser Clustering
- Epsilon ε is the radius of neighborhood around a point. It means that if the distance between two points is lower or equal to ε, these points are considered as neighbors. If the ε value chosen is too small, a large part of the data will not be clustered. Those values will be considered as outliers because they do not satisfy the number of points to create a dense region. On the other hand, if the value is chosen to be too high, clusters will be merged and the majority of objects will be in the same cluster. The ε should be chosen based on the distance of the dataset but, in general, small ε values are preferable.
- MinPoints ζ is the minimum number of points to form a dense region. For example, if we set the ζ as 5, then we need at least 5 points to form a dense region. As a general rule, a minimum ζ can be derived from a number of dimensions (D) in the data set, as ζ ≥ D + 1. Larger values are usually better for data sets with noise and will form more significant clusters. The minimum value for the ζ must be 2, but for a larger data set, a larger ζ value should be chosen.
3.4. Comparison of Phase-based Radial Velocity and Cluster-based Radial Velocity
4. Experiment Details
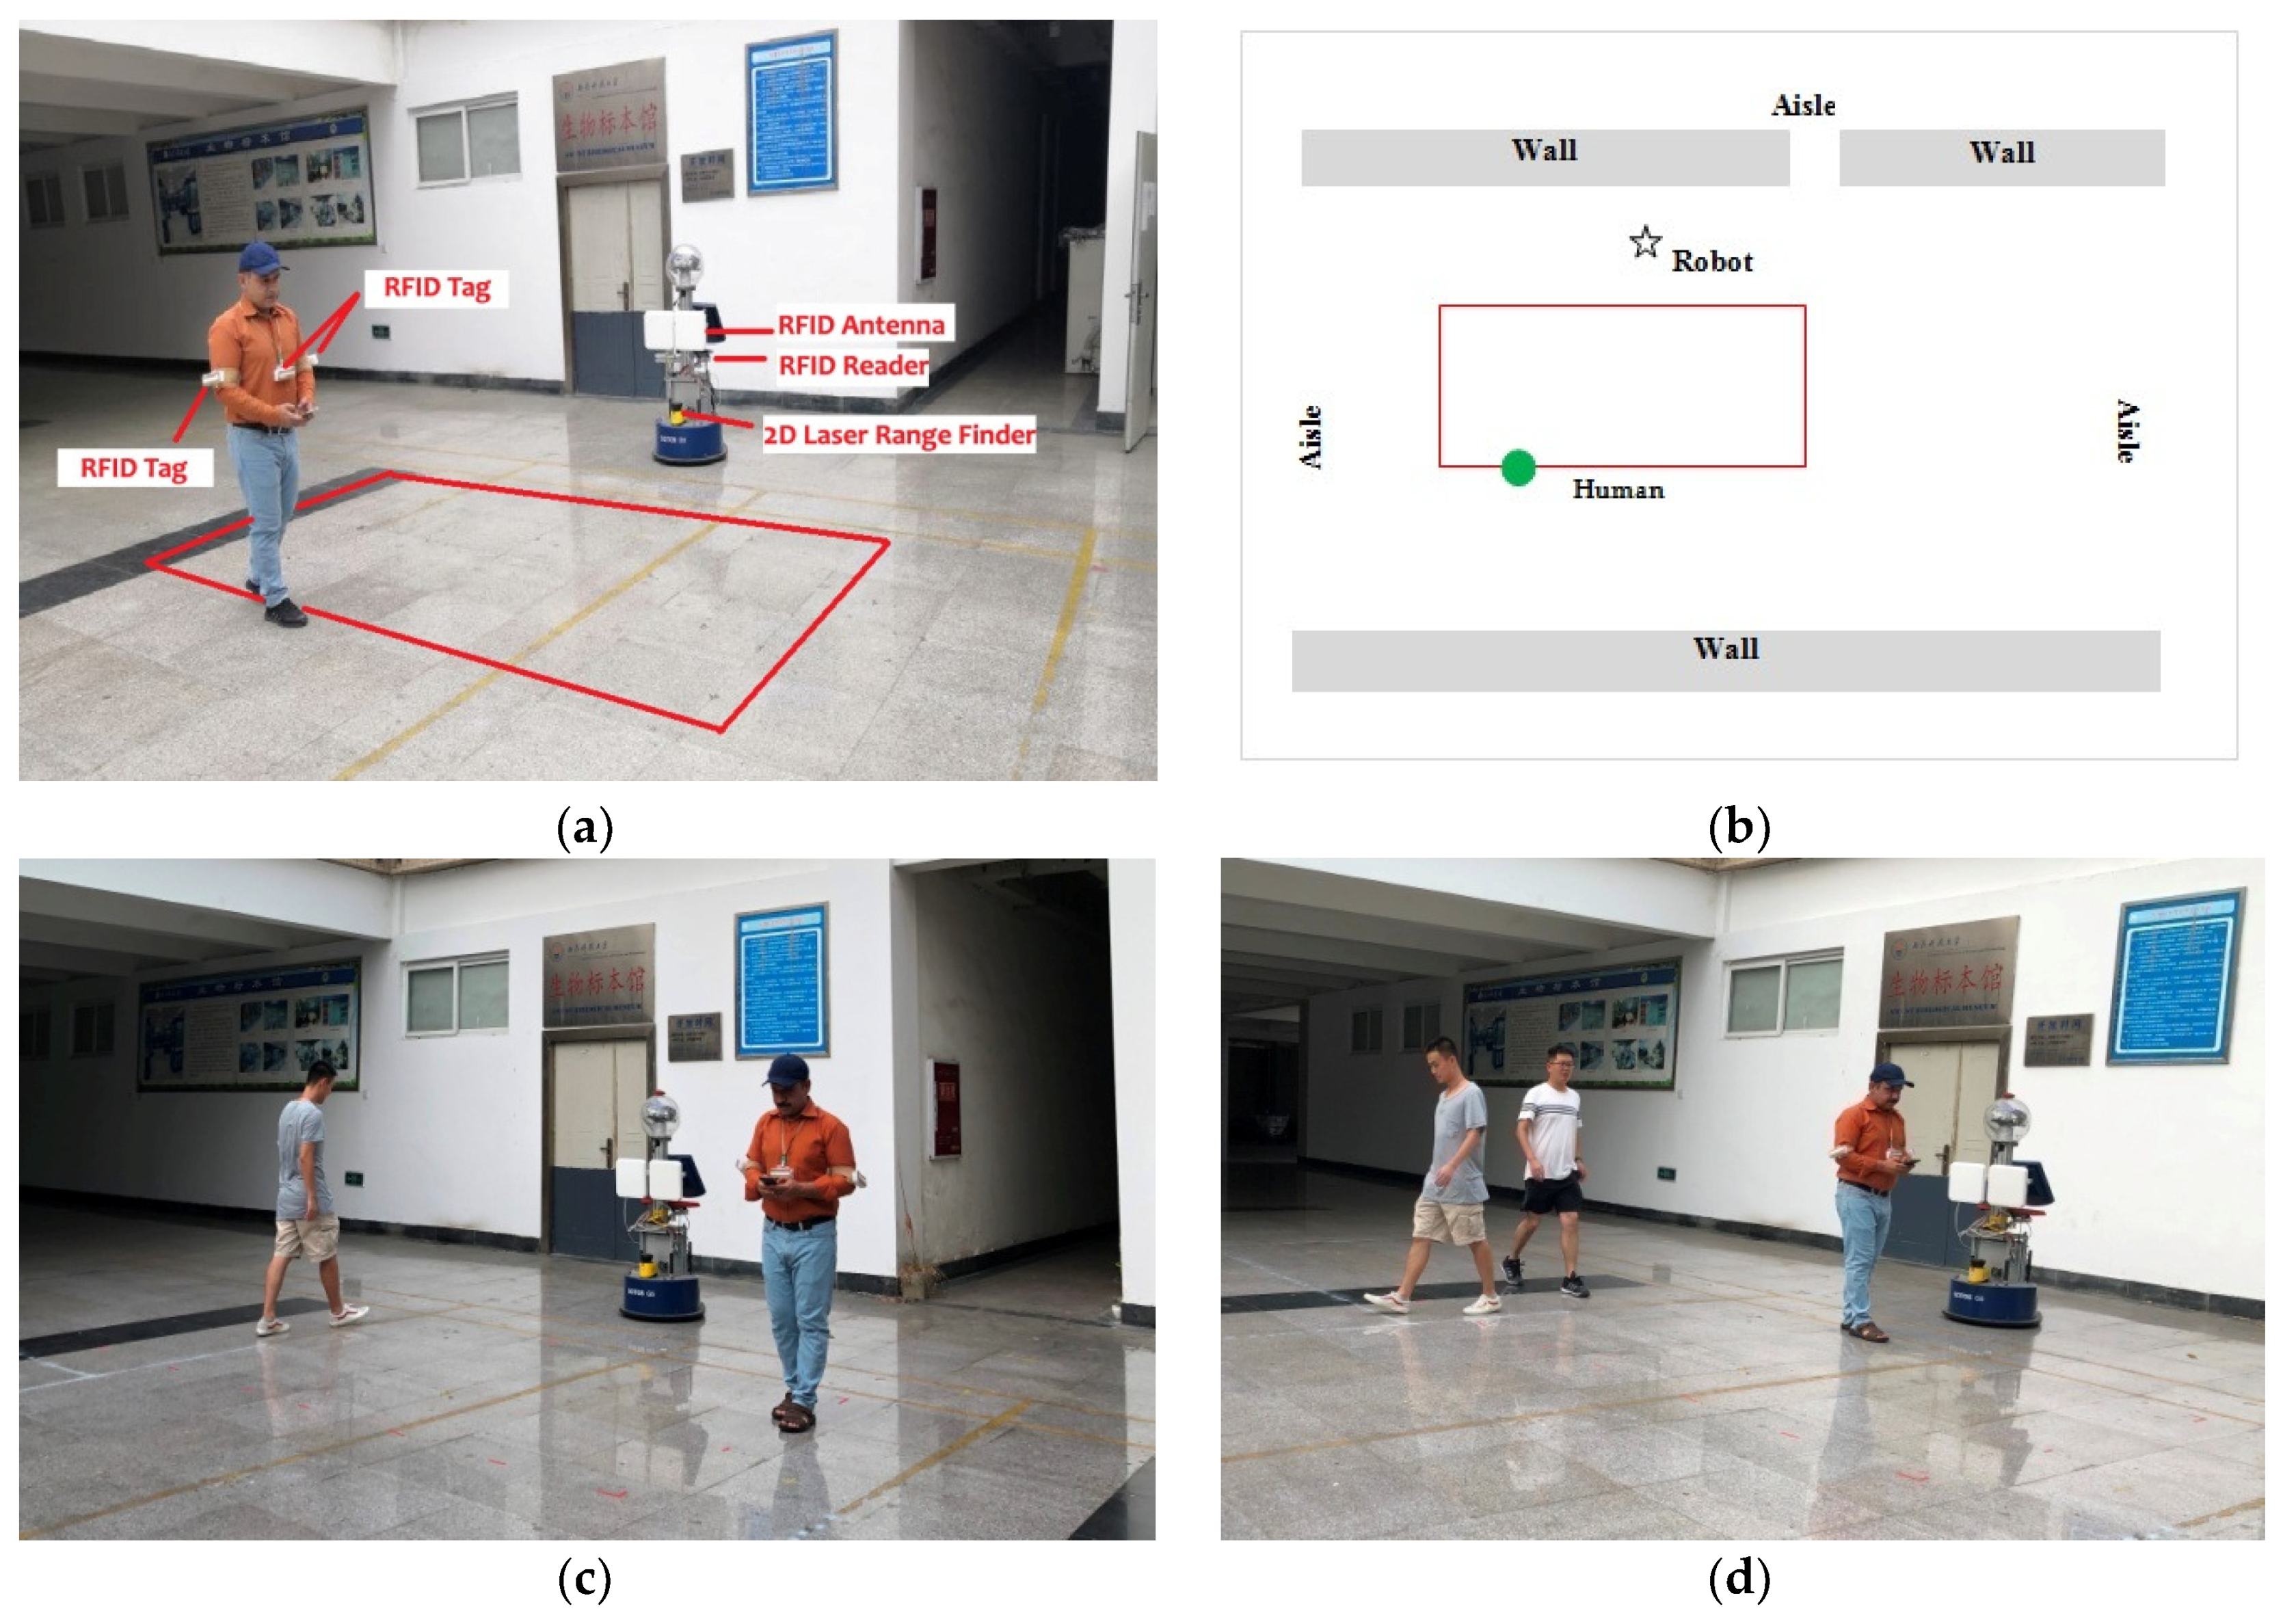
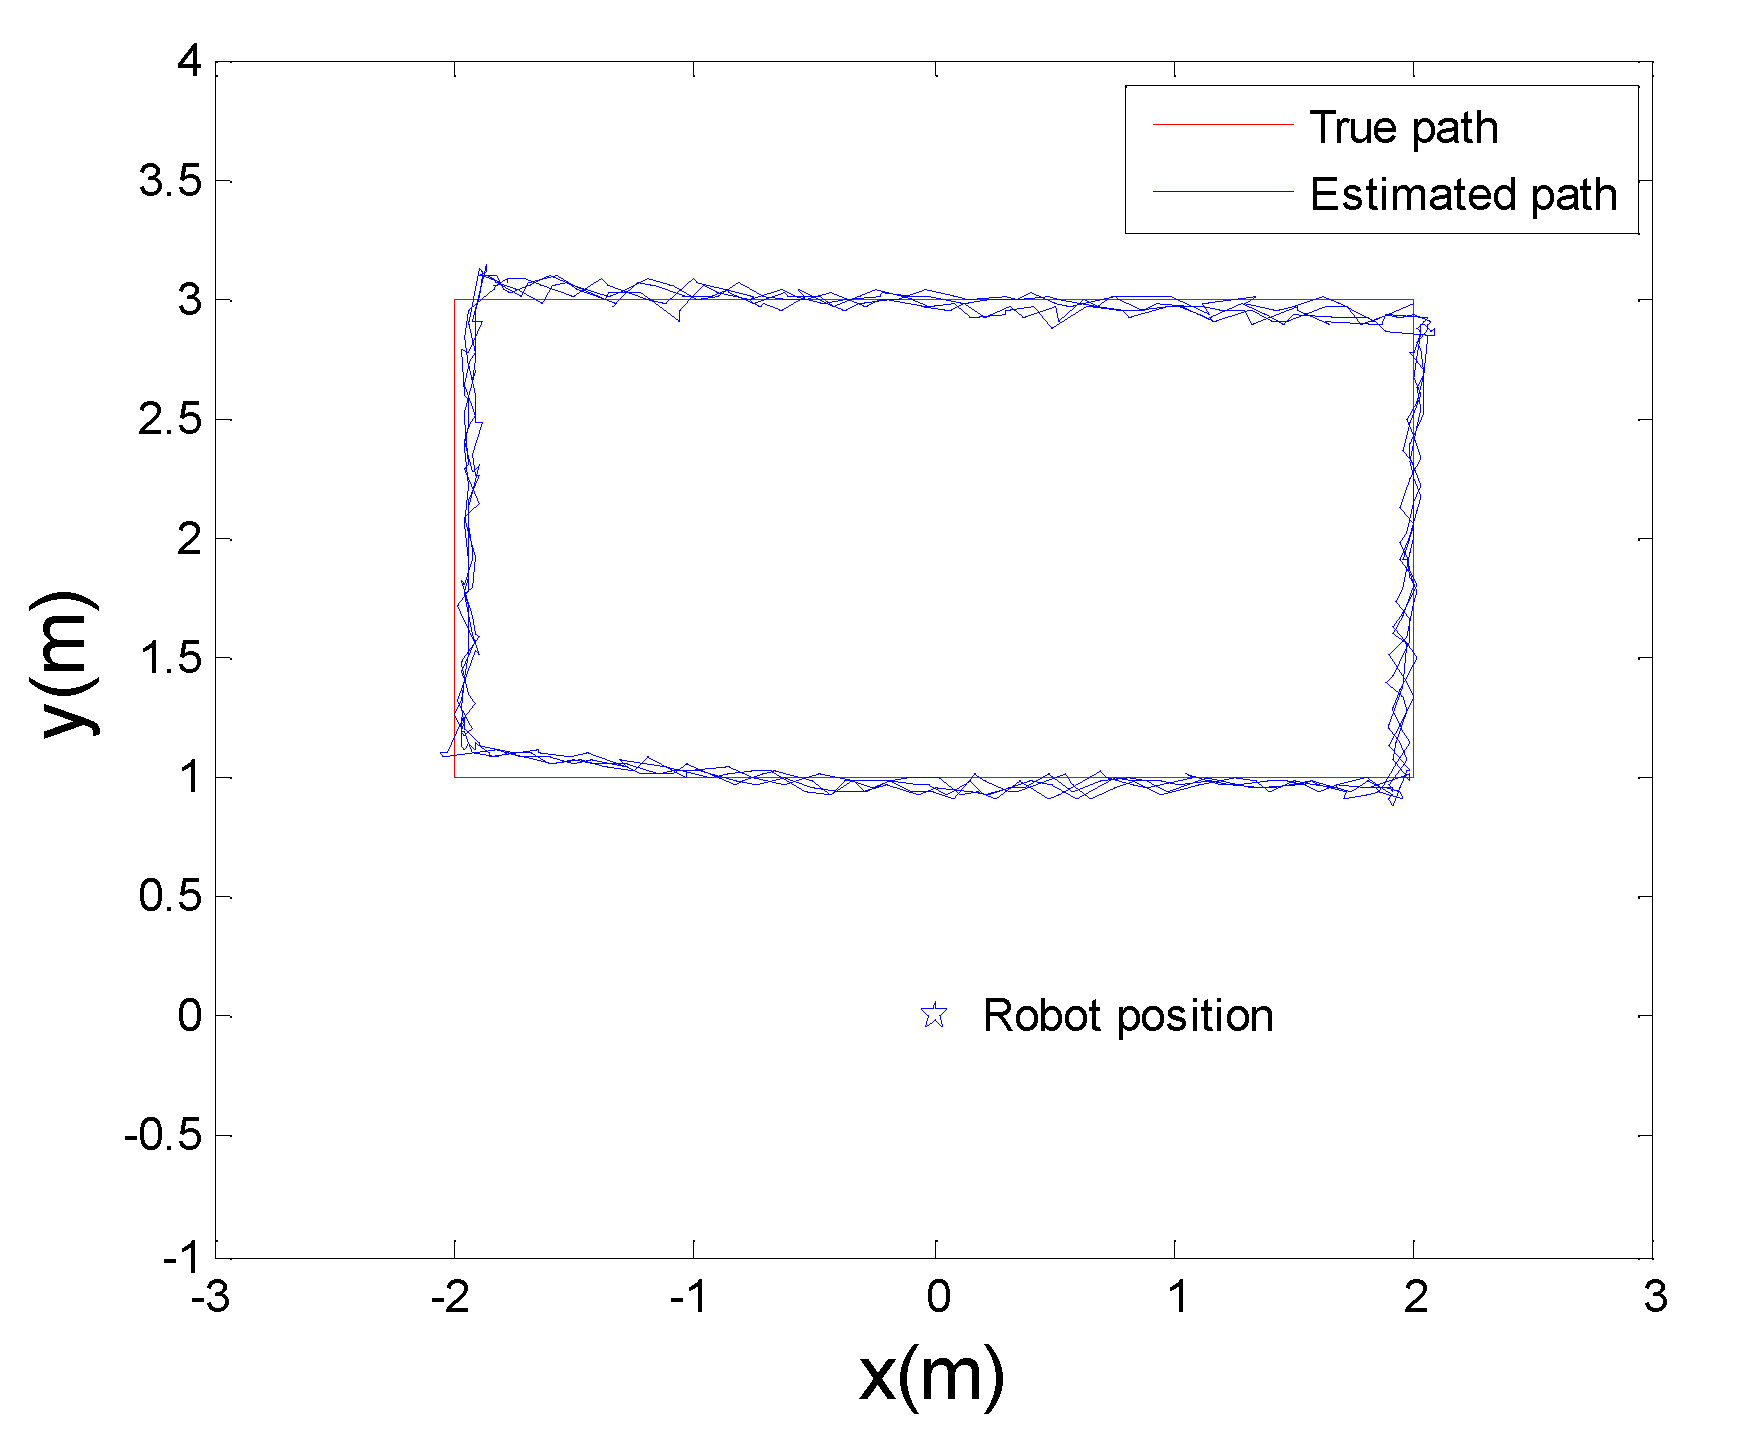
- TEST 1: Simple rectangular trajectory.
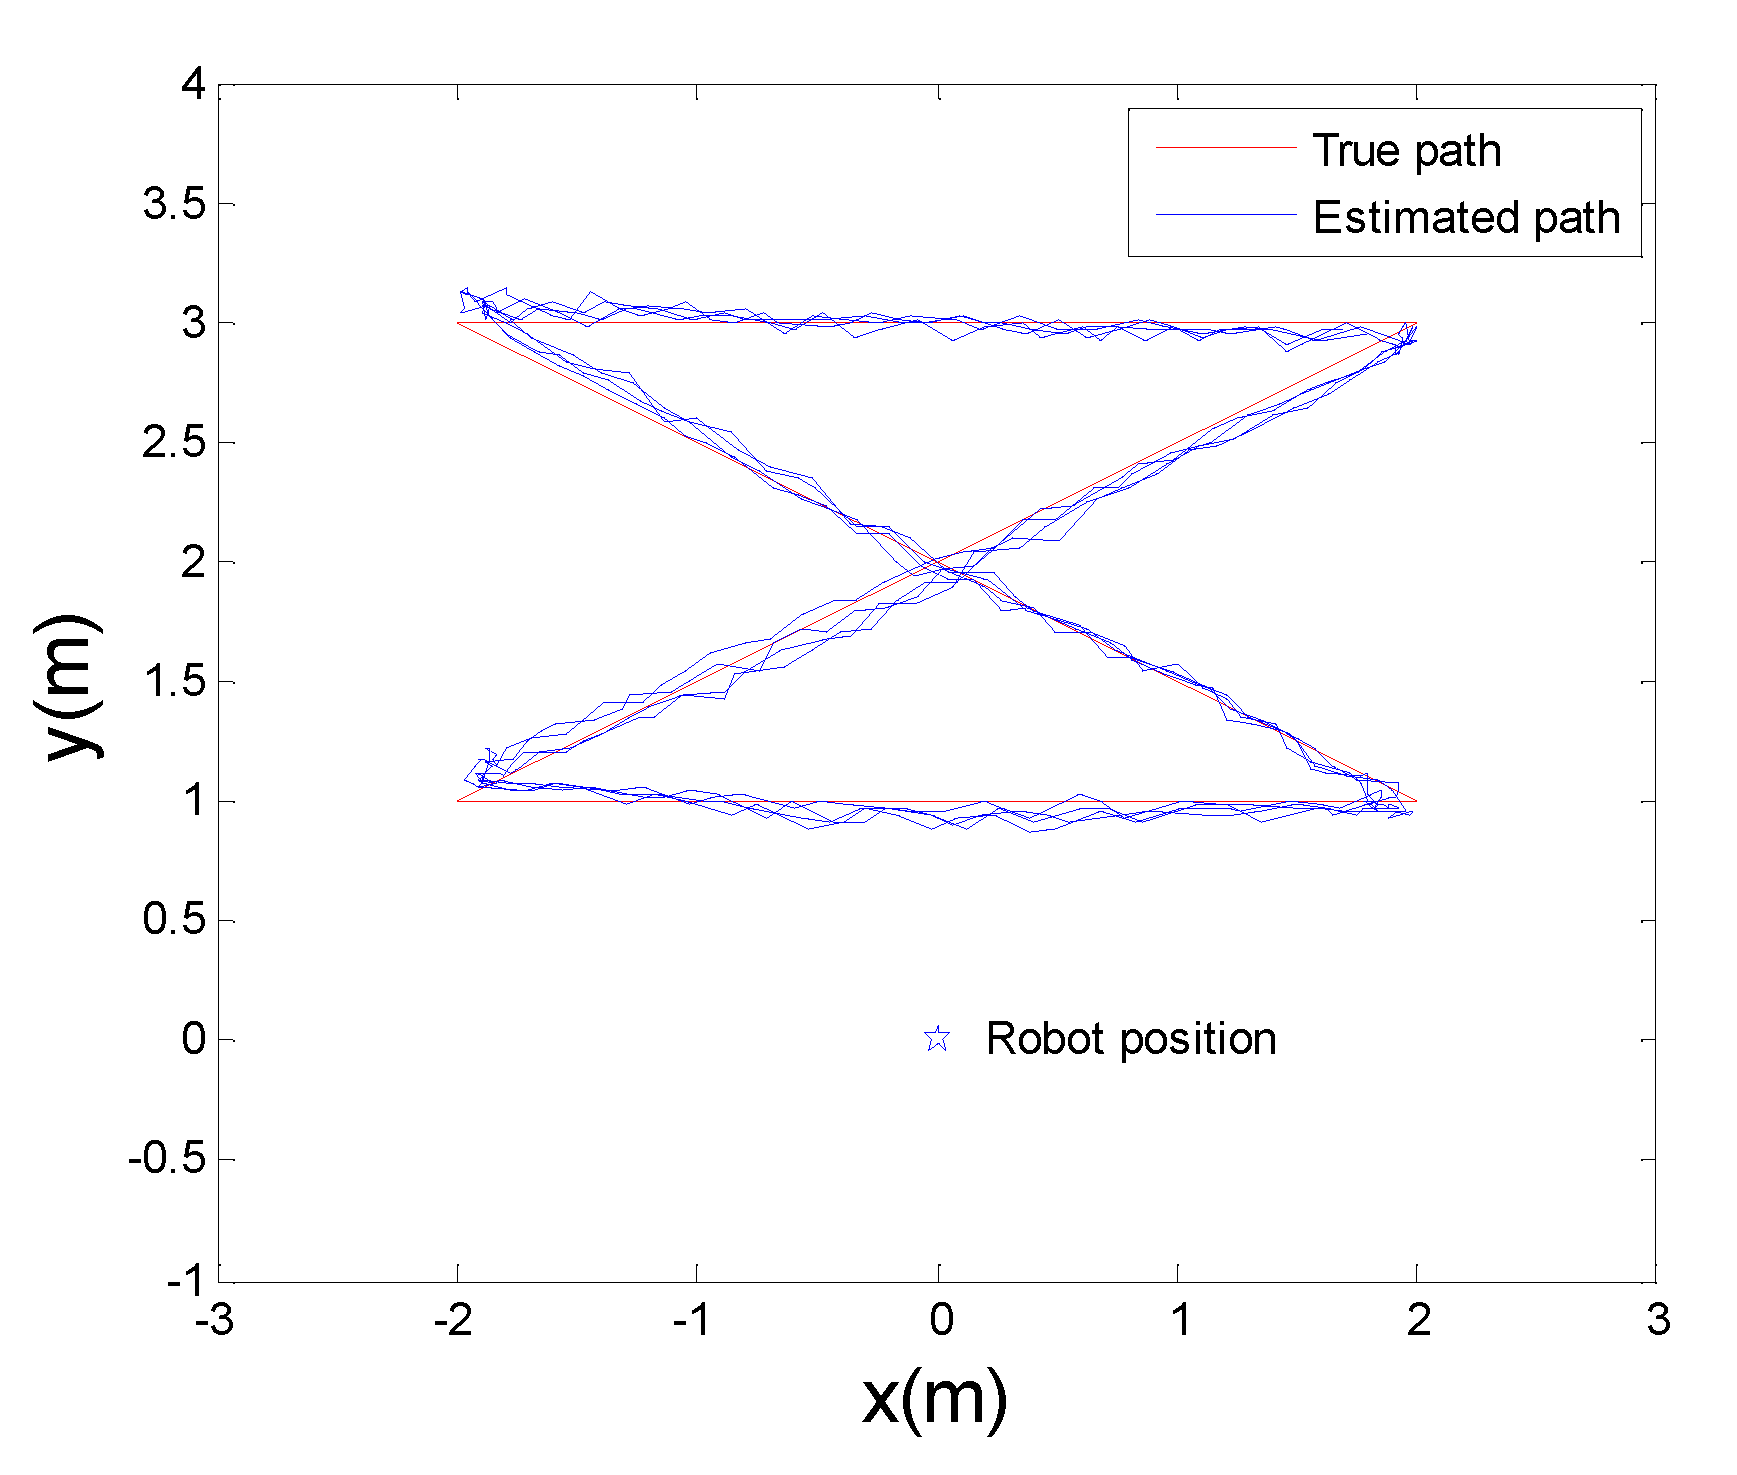
- TEST 2: Crossed rectangular trajectory.
4.1. Evaluation of Tracking Accuracy
4.2. Impact of Number of Moving Humans
4.3. Impact of Different Parameters
4.3.1. Impact of Number of Particles (N)
4.3.2. Impact of the Best Matching Clusters (K)
4.3.3. Impact of Epsilon ε and MinPoints ζ
5. Conclusions
Author Contributions
Funding
Acknowledgments
Conflicts of Interest
Abbreviations
| RFID | Radio Frequency Identification |
| DBSCAN | Density Based Spatial Clustering of Applications with Noise |
| UWB | Ultra wideband |
| GPS | Global Positioning System |
| RSS | Received Signal Strength |
| UHF | Ultra High Frequency |
| TOA | Time of Arrival |
| TDOA | Time Difference of Arrival |
| AOA | Angle of Arrival |
| SAR | Synthetic Aperture Radar |
| BLE | Bluetooth Low Energy |
| IMU | Inertial Measurement Unit |
| MM | Magnetic Matching |
| PDR | Pedestrian Dead Reckoning |
| iGPS | indoor Global Positioning System |
| PF | Particle Filter |
| DRM | Dense Reader Mode |
References
- Liu, R.; Yuen, C.; Do, T.N.; Jiao, D.; Liu, X.; Tan, U.X. Cooperative relative positioning of mobile users by fusing IMU inertial and UWB ranging information. In Proceedings of the IEEE International Conference on Robotics and Automation, Singapore, 29 May–3 June 2017; pp. 5623–5629. [Google Scholar]
- Liu, R.; Yuen, C.; Do, T.N.; Jiang, Y.; Liu, X.; Tan, U.X. Indoor positioning using similarity-based sequence and dead reckoning without training. In Proceedings of the IEEE Workshop on Signal Processing Advances in Wireless Communications (SPAWC), Sapporo, Japan, 3–6 July 2017; pp. 1–5. [Google Scholar]
- Mikšaj, U.T.; Bonefačić, D. Propagation characteristics of UHF radiofrequency identification system signal for application in indoor positioning. In Proceedings of the 22nd International Conference on Applied Electromagnetics and Communications (ICECom 2016), Dubrovnik, Croatia, 19–21 September 2016. [Google Scholar]
- Sarkar, S.K. Enabling ubiquitous sensing with RFID. In Proceedings of the2015 International Conference on Microwave and Photonics (ICMAP 2015), Dhanbad, India, 11–13 December 2015. [Google Scholar]
- Pai, G.; D’souza, J.M.; D’souza, J.T.; Acharya, S.R.; Chaitra, M. Health Monitoring using RFID. Am. J. Intell. Syst. 2017, 7, 100–103. [Google Scholar]
- Yang, A.; Hancke, G.P. RFID and contactless technology. In Smart Cards, Tokens, Security and Applications, 2nd ed.; Springer: Cham, Switzerland.
- Liang, S.Y.; Chen, B.S.; Chen, C.C.; Sim, C.Y.D. Very small size UHF RFID tag for racing pigeon ring applications. In Proceedings of the Wireless Power Transfer Conference (WPTC 2017), Taipei, Taiwan, 10–12 May 2017. [Google Scholar]
- Pentakota, S.L.B.; Chalasani, P.; Mekala, S.K.; Okate, S.I. Evaluating the Modern Airlines Maintenance Parts Supply Chain Reliability and Effectiveness. Int. Supply Chain Technol. J. 2018, 3. [Google Scholar] [CrossRef]
- Xiao, C.; Chen, N.; Li, D.; Lv, Y.; Gong, J. SCRMS: An RFID and sensor web-enabled smart cultural relics management system. Sensors 2017, 17, 60. [Google Scholar] [CrossRef] [PubMed]
- Ma, H.; Wang, K. Fusion of RSS and Phase Shift Using the Kalman Filter for RFID Tracking. IEEE Sens. J. 2017, 17, 3551–3558. [Google Scholar] [CrossRef]
- Ma, L.; Liu, M.; Wang, H.; Yang, Y.; Wang, N.; Zhang, Y. WallSense: Device-Free Indoor Localization Using Wall-Mounted UHF RFID Tags. Sensors 2019, 19, 68. [Google Scholar] [CrossRef] [PubMed]
- Ruan, W.; Sheng, Q.Z.; Yao, L.; Li, X.; Falkner, N.J.G.; Yang, L. Device-free human localization and tracking with UHF passive RFID tags: A data-driven approach. J. Netw. Comput. Appl. 2018, 104, 78–96. [Google Scholar] [CrossRef] [Green Version]
- Ruan, W.; Sheng, Q.Z.; Yao, L.; Gu, T.; Ruta, M.; Shangguan, L. Device-free indoor localization and tracking through Human-Object Interactions. In Proceedings of the17th International Symposium on a World of Wireless, Mobile and Multimedia Networks (WoWMoM 2016), Coimbra, Portugal, 21–24 June 2016. [Google Scholar]
- Liu, Z.; Chen, X.; Wei, Z.; Liu, T.; Li, L.; Peng, B. Ambiguity Analysis and Resolution for Phase-Based 3D Source Localization under Given UCA. Int. J. Antennas Propag. 2019, 2019, 4743829. [Google Scholar] [CrossRef]
- He, H.; Akbari, M.; Sydänheimo, L.; Ukkonen, L.; Virkki, J. 3D-Printed Graphene Antennas and Interconnections for Textile RFID Tags: Fabrication and Reliability towards Humidity. Int. J. Antennas Propag. 2017, 2017, 1386017. [Google Scholar] [CrossRef]
- Çiftler, B.S.; Kadri, A.; Güvenç, I. IoT Localization for Bistatic Passive UHF RFID Systems with 3-D Radiation Pattern. IEEE Internet Things J. 2017, 4, 905–916. [Google Scholar] [CrossRef]
- Colella, R.; Catarinucci, L. Wearable UHF RFID Sensor Tag in 3D-Printing Technology for Body Temperature Monitoring. In Proceedings of the 2nd URSI Atlantic Radio Science Meeting (AT-RASC 2018), Meloneras, Spain, 28 May–1 June 2018. [Google Scholar]
- Shen, L.; Zhang, Q.; Pang, J.; Xu, H.; Li, P.; Xue, D. ANTspin: Efficient Absolute Localization Method of RFID Tags via Spinning Antenna. Sensors 2019, 19, 2194. [Google Scholar] [CrossRef]
- El Abkari, S.; Jilbab, A.; el Mhamdi, J. Real time positioning over WSN and RFID network integration. In Proceedings of the2018 4th International Conference on Advanced Technologies for Signal and Image Processing (ATSIP 2018), Sousse, Tunisia, 21–24 March 2018; pp. 1–5. [Google Scholar]
- Ma, Y.; Tian, C.; Jiang, Y. A Multi-Tag Cooperative Localization Algorithm Based on Weighted Multidimensional Scaling for Passive UHF RFID. IEEE Internet Things J. 2019, 6. [Google Scholar] [CrossRef]
- Duan, C.; Yang, L.; Liu, Y. Accurate Spatial Calibration of RFID Antennas via Spinning Tags. In Proceedings of the International Conference on Distributed Computing Systems, Nara, Japan, 27–30 June 2016; pp. 519–528. [Google Scholar]
- Kaltiokallio, O.; Hostettler, R.; Patwari, N.; Jäntti, R. Recursive Bayesian Filters for RSS-Based Device-Free Localization and Tracking. In Proceedings of the9th International Conference on Indoor Positioning and Indoor Navigation (IPIN 2018), Nantes, France, 24–27 September 2018. [Google Scholar]
- Hsiao, R.S.; Kao, C.H.; Chen, T.X.; Chen, J.L. A passive RFID-based location system for personnel and asset monitoring. Technol. Health Care 2018, 26, 11–16. [Google Scholar] [CrossRef] [PubMed]
- Zhang, Z.; Lu, Z.; Saakian, V.; Qin, X.; Chen, Q.; Zheng, L.R. Item-level indoor localization with passive UHF RFID based on tag interaction analysis. IEEE Trans. Ind. Electron. 2013, 61, 2122–2135. [Google Scholar]
- Zhao, Y.; Liu, K.; Ma, Y.; Gao, Z.; Zang, Y.; Teng, J. Similarity Analysis-Based Indoor Localization Algorithm with Backscatter Information of Passive UHF RFID Tags. IEEE Sens. J. 2017, 17, 185–193. [Google Scholar] [CrossRef]
- Wu, H.; Tao, B.; Gong, Z.; Yin, Z.; Ding, H. A Fast UHF RFID Localization Method Using Unwrapped Phase-Position Model. IEEE Trans. Autom. Sci. Eng. 2019, 1–10. [Google Scholar] [CrossRef]
- Xiao, F.; Wang, Z.; Ye, N.; Wang, R.; Li, X.Y. One more tag enables fine-grained RFID localization and tracking. IEEE/ACM Trans. Netw. 2018, 26, 161–174. [Google Scholar] [CrossRef]
- Buffi, A.; Nepa, P.; Lombardini, F. A phase-based technique for localization of uhf-rfid tags moving on a conveyor belt: Performance analysis and test-case measurements. IEEE Sens. J. 2015, 15, 387–396. [Google Scholar] [CrossRef]
- Buffi, A.; Pino, M.R.; Nepa, P. Experimental validation of a SAR-Based RFID localization technique exploiting an automated handling system. IEEE Antennas Wirel. Propag. Lett. 2017, 16, 2795–2798. [Google Scholar] [CrossRef]
- Liu, R.; Huskić, G.; Zell, A. On tracking dynamic objects with long range passive UHF RFID using a mobile robot. Int. J. Distrib. Sens. Netw. 2015, 11, 781380. [Google Scholar] [CrossRef]
- Wu, H.; Wu, X.; Tian, G. Indoor robot localization based on single RFID tag. Artif. Life Robot. 2018, 23, 373–379. [Google Scholar] [CrossRef]
- Duan, C.; Rao, X.; Yang, L.; Liu, Y. Fusing RFID and computer vision for fine-grained object tracking. In Proceedings of the IEEE Conference on Computer Communications INFOCOM, Atlanta, GA, USA, 1–4 May 2017. [Google Scholar]
- Llorca, D.F.; Quintero, R.; Parra, I.; Sotelo, M.A. Recognizing individuals in groups in outdoor environments combining stereo vision, RFID and BLE. Cluster Comput. 2017, 20, 769–779. [Google Scholar] [CrossRef]
- Alfian, G.; Rhee, J.; Ahn, H.; Lee, J.; Farooq, U.; Ijaz, M.F.; Syaekhoni, M.A. Integration of RFID, wireless sensor networks, and data mining in an e-pedigree food traceability system. J. Food Eng. 2017, 212, 65–75. [Google Scholar] [CrossRef]
- Yang, P.; Wu, W. Efficient particle filter localization algorithm in dense passive RFID tag environment. IEEE Trans. Ind. Electron. 2014, 61, 5641–5651. [Google Scholar] [CrossRef]
- Wu, J.; Zhu, M.; Xiao, B.; Qiu, Y. Graph-based indoor localization with the fusion of PDR and RFID technologies. In Lecture Notes in Computer Science (Including Subseries Lecture Notes in Artificial Intelligence and Lecture Notes in Bioinformatics); Springer: Cham, Switzerland, 2018; Volume 11336 LNCS, pp. 630–639. [Google Scholar]
- Sequeira, J.S.; Gameiro, D. A Probabilistic Approach to RFID-Based Localization for Human-Robot Interaction in Social Robotics. Electronics 2017, 6, 32. [Google Scholar] [CrossRef]
- Suparyanto, A.; Fatimah, R.N.; Widyotriatmo, A.; Nazaruddin, Y.Y. Port Container Truck Localization Using Sensor Fusion Technique. In Proceedings of the 5th International Conference on Electric Vehicular Technology (ICEVT 2018), Surakarta, Indonesia, 30–31 October 2018; pp. 72–77. [Google Scholar]
- Digiampaolo, E.; Martinelli, F. Mobile robot localization using the phase of passive UHF RFID signals. IEEE Trans. Ind. Electron. 2014, 61, 365–376. [Google Scholar] [CrossRef]
- Zheng, K.; Yang, Q. Vehicle Positioning Method Based on RFID in VANETs. In Proceedings of the 2nd International Conference on Computer Science and Application Engineering, Hohhot, China, 22–24 October 2018; pp. 1–5. [Google Scholar]
- Wu, J.; Zhu, M.; Xiao, B.; Qiu, Y. The Improved Fingerprint-Based Indoor Localization with RFID/PDR/MM Technologies. In Proceedings of the International Conference on Parallel and Distributed Systems (ICPADS), Singapore, 11–13 December 2019; pp. 878–885. [Google Scholar]
- Luo, W.; Deng, X.; Zhang, F.; Wen, Y.; Kadhim, D.J. Positioning and guiding educational robots by using fingerprints of WiFi and RFID array. EURASIP J. Wirel. Commun. Netw. 2018, 2018, 170. [Google Scholar] [CrossRef]
- Fu, Y.; Wang, C.; Liu, R.; Liang, G.; Zhang, H.; Rehman, S.U. Moving object localization based on UHF RFID phase and laser clustering. Sensors 2018, 18, 825. [Google Scholar] [CrossRef]
- Bu, Y.; Xie, L.; Gong, Y.; Wang, C.; Yang, L.; Liu, J.; Lu, S. RF-Dial: An RFID-based 2D Human-Computer Interaction via Tag Array. In Proceedings of the IEEE Conference on Computer Communications (INFOCOM), Honolulu, HI, USA, 16–19 April 2018; pp. 837–845. [Google Scholar]
- Wang, C.; Liu, J.; Chen, Y.; Liu, H.; Xie, L.; Wang, W.; He, B.; Lu, S. Multi-Touch in the Air: Device-Free Finger Tracking and Gesture Recognition via COTS RFID. In Proceedings of the IEEE Conference on Computer Communications (INFOCOM), Honolulu, HI, USA, 16–19 April 2018; pp. 1–9. [Google Scholar]
- Nakamori, Y.; Hiroi, Y.; Ito, A. Multiple player detection and tracking method using a laser range finder for a robot that plays with human. ROBOMECH J. 2018, 5, 25. [Google Scholar] [CrossRef] [Green Version]
- Zhang, Y.; Xie, L.; Bu, Y.; Wang, Y.; Wu, J.; Lu, S. 3-Dimensional Localization via RFID Tag Array. In Proceedings of the 14th IEEE International Conference on Mobile Ad Hoc and Sensor Systems (MASS 2017), Orlando, FL, USA, 22–25 October 2017; pp. 353–361. [Google Scholar]


| Author/s | Approach | Accuracy (meters) | Remarks | Human Tracking |
|---|---|---|---|---|
| Shen [18] | AOA technique | 0.13m | For static objects only | No |
| Ma [20] | TDOA | 0.46m | Multiple reference tags are needed | No |
| Kaltiokallio [22] | RSS and combination of Kalman and Particle Filter | 0.12–0.53m | Recursive and large amount of reference tags are required | Yes |
| Hsiao [23] | Real-time location system | 0.3m | Multiple reference tags and multiple antennas are used | Yes |
| Wu [26] | Phase position model sensors | 0.096m | Can work for static RFID tag only | No |
| Xiao [27] | Multipath propagation model | 0.06m | For static items only and many antennas are needed | No |
| Liu [30] | Fusion of laser and RFID | 0.2–0.65m | Specific environment and tracking of single tag | Yes |
| Wu [31] | Fuzzy reasoning algorithm and fusion of laser and RFID | 0.09m | Works for robot localization | No |
| Wu [36] | Graph-based mapping with RFID and PDR | 1.2m | Localization accuracy is limited. | Yes |
| Our Approach | Fusion of RFID tag array and laser | 0.38m | No reference tags needed, model free and tracking of dynamic moving object | Yes |
| Mathematical Symbols | Definitions |
|---|---|
| Position of the object at time t | |
| Measurement of laser at time t | |
| Motion information of the object at time t | |
| Normalization factor at time t | |
| Measurement of RFID tag at time t | |
| Weight of particle n at time t | |
| State of the particle at time t | |
| Location of particle n at time t | |
| N | Number of particles |
| K | The best matching K clusters |
| Gaussian noise at time t | |
| Nearest cluster | |
| Laser-based radial velocity of cluster i at time t | |
| Phase-based radial velocity of the tag at time t | |
| Laser cluster i at time t | |
| Translation coefficient to the distance function | |
| ε | Epsilon represents minimum distance between two laser points |
| ζ | MinPoints is minimum number of laser points to form a dense region |
| (,) | Center of cluster i at time t |
| Signal phase at time t | |
| Velocity of light | |
| Signal frequency |
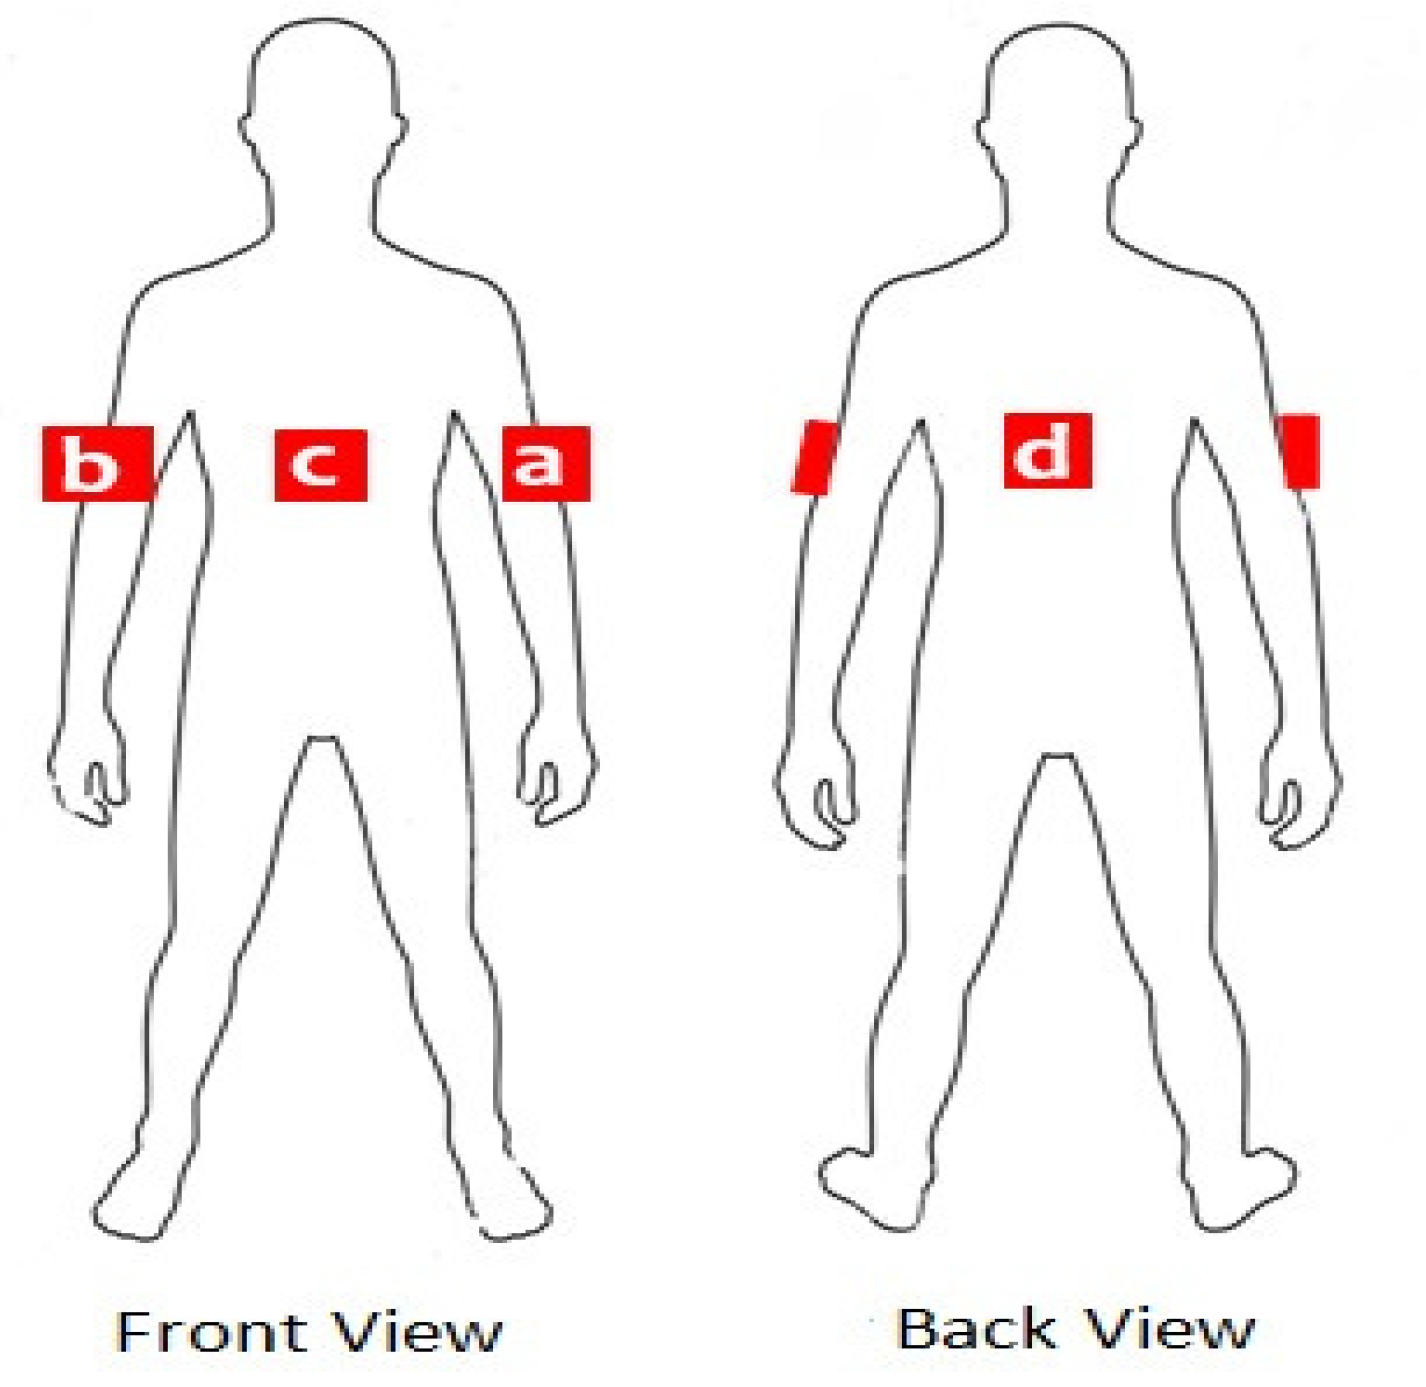
| Total Tags | RFID Tag Combinations | Average Localization Error of TEST 1 (m) | Average Localization Error of TEST 2 (m) | ||
|---|---|---|---|---|---|
| Clockwise | Anticlockwise | Clockwise | Anticlockwise | ||
| 1 | a | 0.48 | 0.76 | 0.61 | 0.59 |
| b | 0.86 | 0.50 | 0.57 | 0.63 | |
| c | 1.50 | 1.60 | 1.33 | 1.28 | |
| d | 1.75 | 2.11 | 1.84 | 1.17 | |
| 2 | a + b | 0.41 | 0.45 | 0.53 | 0.56 |
| a + c | 0.44 | 0.60 | 0.57 | 0.58 | |
| a + d | 0.45 | 0.62 | 0.59 | 0.60 | |
| b + d | 0.63 | 0.46 | 0.55 | 0.62 | |
| b + c | 0.60 | 0.45 | 0.54 | 0.61 | |
| c + d | 0.77 | 0.74 | 0.92 | 0.84 | |
| 3 | a + b + d | 0.40 | 0.44 | 0.51 | 0.55 |
| a + b + c | 0.39 | 0.43 | 0.50 | 0.54 | |
| a + c + d | 0.43 | 0.50 | 0.55 | 0.58 | |
| b + c + d | 0.47 | 0.45 | 0.53 | 0.61 | |
| 4 | a + b + c + d | 0.38 | 0.41 | 0.49 | 0.52 |
| Total Tags | Total Number of Moving Human | Average Localization Error of TEST 1 (m) | Average Localization Error of TEST 2 (m) | ||
|---|---|---|---|---|---|
| Clockwise | Anticlockwise | Clockwise | Anticlockwise | ||
| 4 | 2 | 0.37 | 0.40 | 0.47 | 0.50 |
| 4 | 3 | 0.39 | 0.44 | 0.51 | 0.54 |
| N | 5 | 50 | 100 | 200 | 300 | 500 | 800 | 1000 |
|---|---|---|---|---|---|---|---|---|
| Error(m) | 4.39 | 0.41 | 0.39 | 0.38 | 0.39 | 0.38 | 0.40 | 0.39 |
| Time(ms) | 9.52 | 10.14 | 11.01 | 12.82 | 14.68 | 17.93 | 23.16 | 26.73 |
| 0.01 | 0.05 | 0.1 | 0.5 | |||
|---|---|---|---|---|---|---|
| Error (m) | ||||||
| K | ||||||
| 1 | 1.26 | 0.48 | 0.86 | 7.01 | ||
| 2 | 0.41 | 0.41 | 0.41 | 0.47 | ||
| 3 | 0.39 | 0.39 | 0.39 | 0.44 | ||
| 4 | 0.40 | 0.38 | 0.40 | 0.45 | ||
| 7 | 0.41 | 0.39 | 0.40 | 0.45 | ||
| 10 | 0.41 | 0.39 | 0.43 | 0.47 | ||
| 13 | 0.41 | 0.40 | 0.39 | 0.45 | ||
| ζ | 1 | 2 | 3 | 4 | 7 | 10 | ||
|---|---|---|---|---|---|---|---|---|
| Error (m) | ||||||||
| ε | ||||||||
| 0.05 | 0.61 | 0.85 | 3.98 | 4.05 | 4.07 | 4.21 | ||
| 0.1 | 0.45 | 0.39 | 0.66 | 0.69 | 4.02 | 4.08 | ||
| 0.2 | 0.41 | 0.38 | 0.39 | 0.43 | 2.72 | 3.90 | ||
| 0.3 | 0.39 | 0.39 | 0.39 | 2.38 | 1.82 | 3.92 | ||
| 0.5 | 0.39 | 0.39 | 0.39 | 0.42 | 8.57 | 6.68 | ||
© 2019 by the authors. Licensee MDPI, Basel, Switzerland. This article is an open access article distributed under the terms and conditions of the Creative Commons Attribution (CC BY) license (http://creativecommons.org/licenses/by/4.0/).
Share and Cite
Ur Rehman, S.; Liu, R.; Zhang, H.; Liang, G.; Fu, Y.; Qayoom, A. Localization of Moving Objects Based on RFID Tag Array and Laser Ranging Information. Electronics 2019, 8, 887. https://doi.org/10.3390/electronics8080887
Ur Rehman S, Liu R, Zhang H, Liang G, Fu Y, Qayoom A. Localization of Moving Objects Based on RFID Tag Array and Laser Ranging Information. Electronics. 2019; 8(8):887. https://doi.org/10.3390/electronics8080887
Chicago/Turabian StyleUr Rehman, Shafiq, Ran Liu, Hua Zhang, Gaoli Liang, Yulu Fu, and Abdul Qayoom. 2019. "Localization of Moving Objects Based on RFID Tag Array and Laser Ranging Information" Electronics 8, no. 8: 887. https://doi.org/10.3390/electronics8080887
APA StyleUr Rehman, S., Liu, R., Zhang, H., Liang, G., Fu, Y., & Qayoom, A. (2019). Localization of Moving Objects Based on RFID Tag Array and Laser Ranging Information. Electronics, 8(8), 887. https://doi.org/10.3390/electronics8080887