Practical Evaluation of VMAF Perceptual Video Quality for WebRTC Applications


Abstract
:1. Introduction
1.1. State-of-the-Art
1.2. Motivation and Contributions
2. Materials and Methods
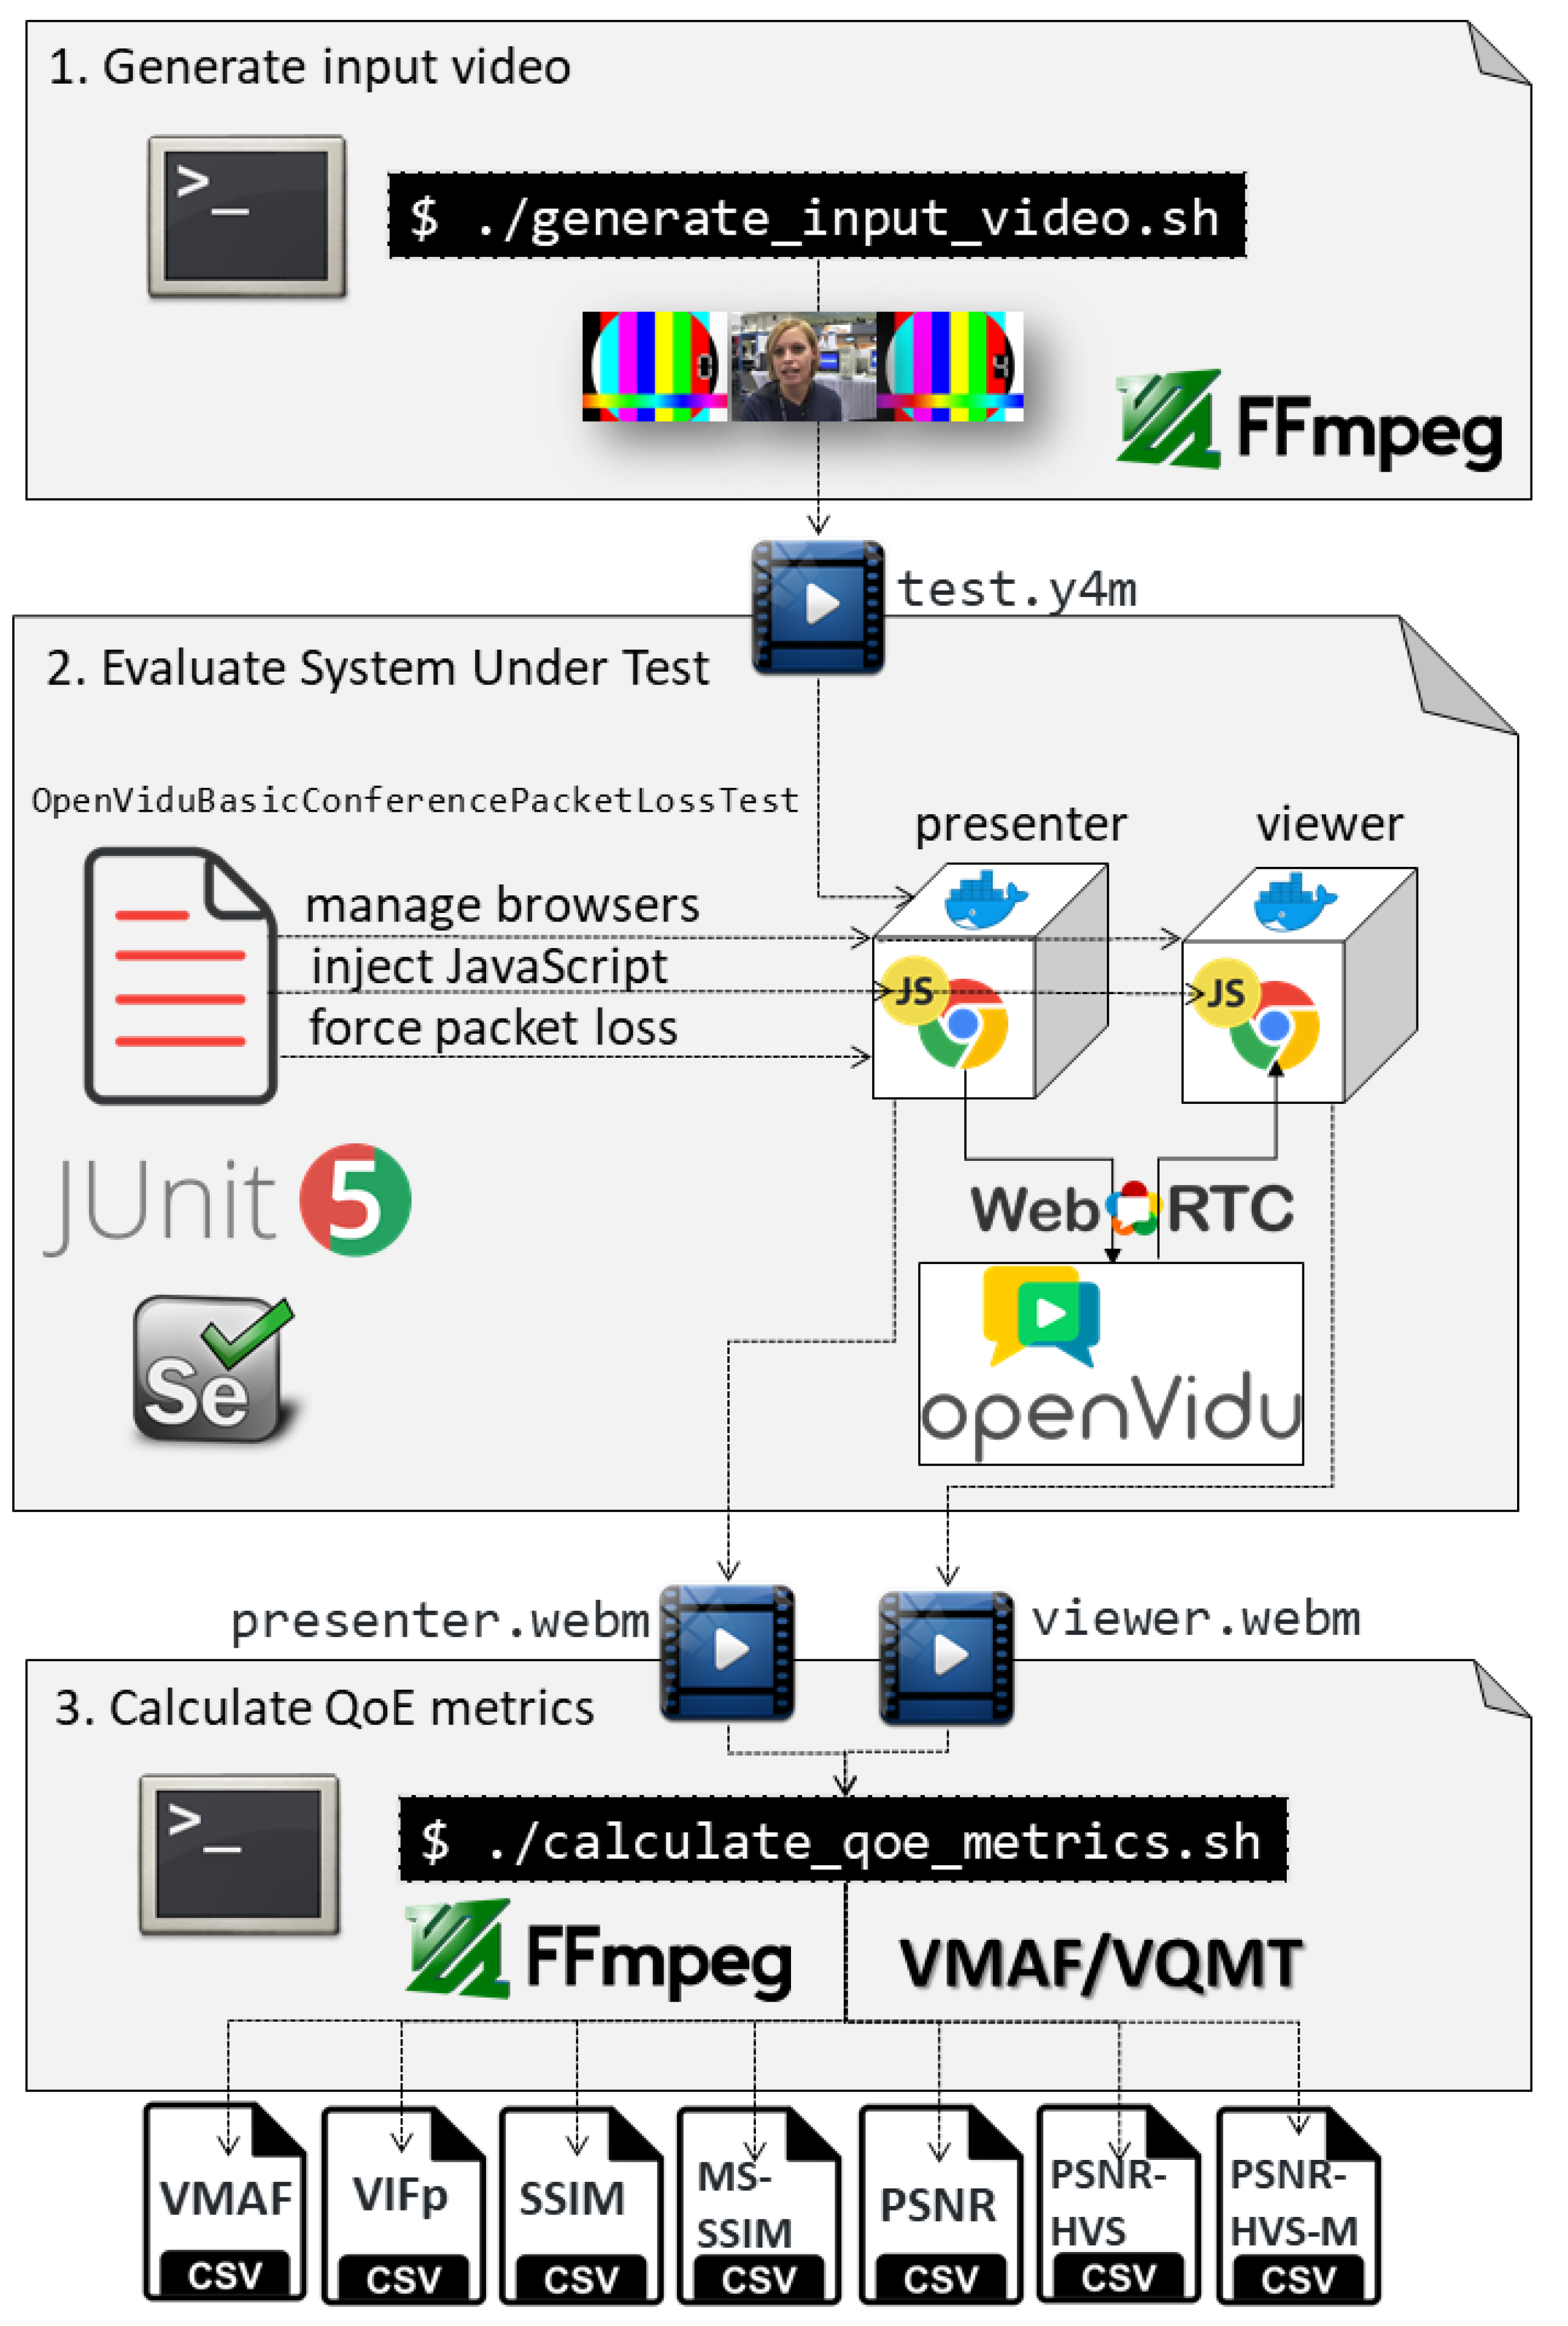
2.1. Tooling Infrastructure
- Dependency injection. This capability enables different object types to be injected in JUnit 5 as methods or constructor parameters in test classes. Specifically, Selenium-Jupiter allows for creating subtypes of the WebDriver interface (e.g., ChromeDriver, FirefoxDriver, and so on) when defined as test parameters.
- Test lifecycle. The Jupiter extension model allows for executing custom code before and after actual tests. Selenium-Jupiter use this feature to properly create WebDriver objects before the test, resolving WebDriver binaries (e.g., chromedriver, geckodriver) in the case of local browsers, or pulling and executing containers in the case of Docker. After the test is executed, Selenium-Jupiter uses the before test callbacks to properly dispose browsers, containers, and so on.
- Test templates. These templates can be seen as a special kind of parameterized tests, in which the test is executed several times according to the data provided by some extension. Selenium-Jupiter uses this feature to define a group of browsers which will be used to execute a given test logic.
2.2. Design of the Experiment
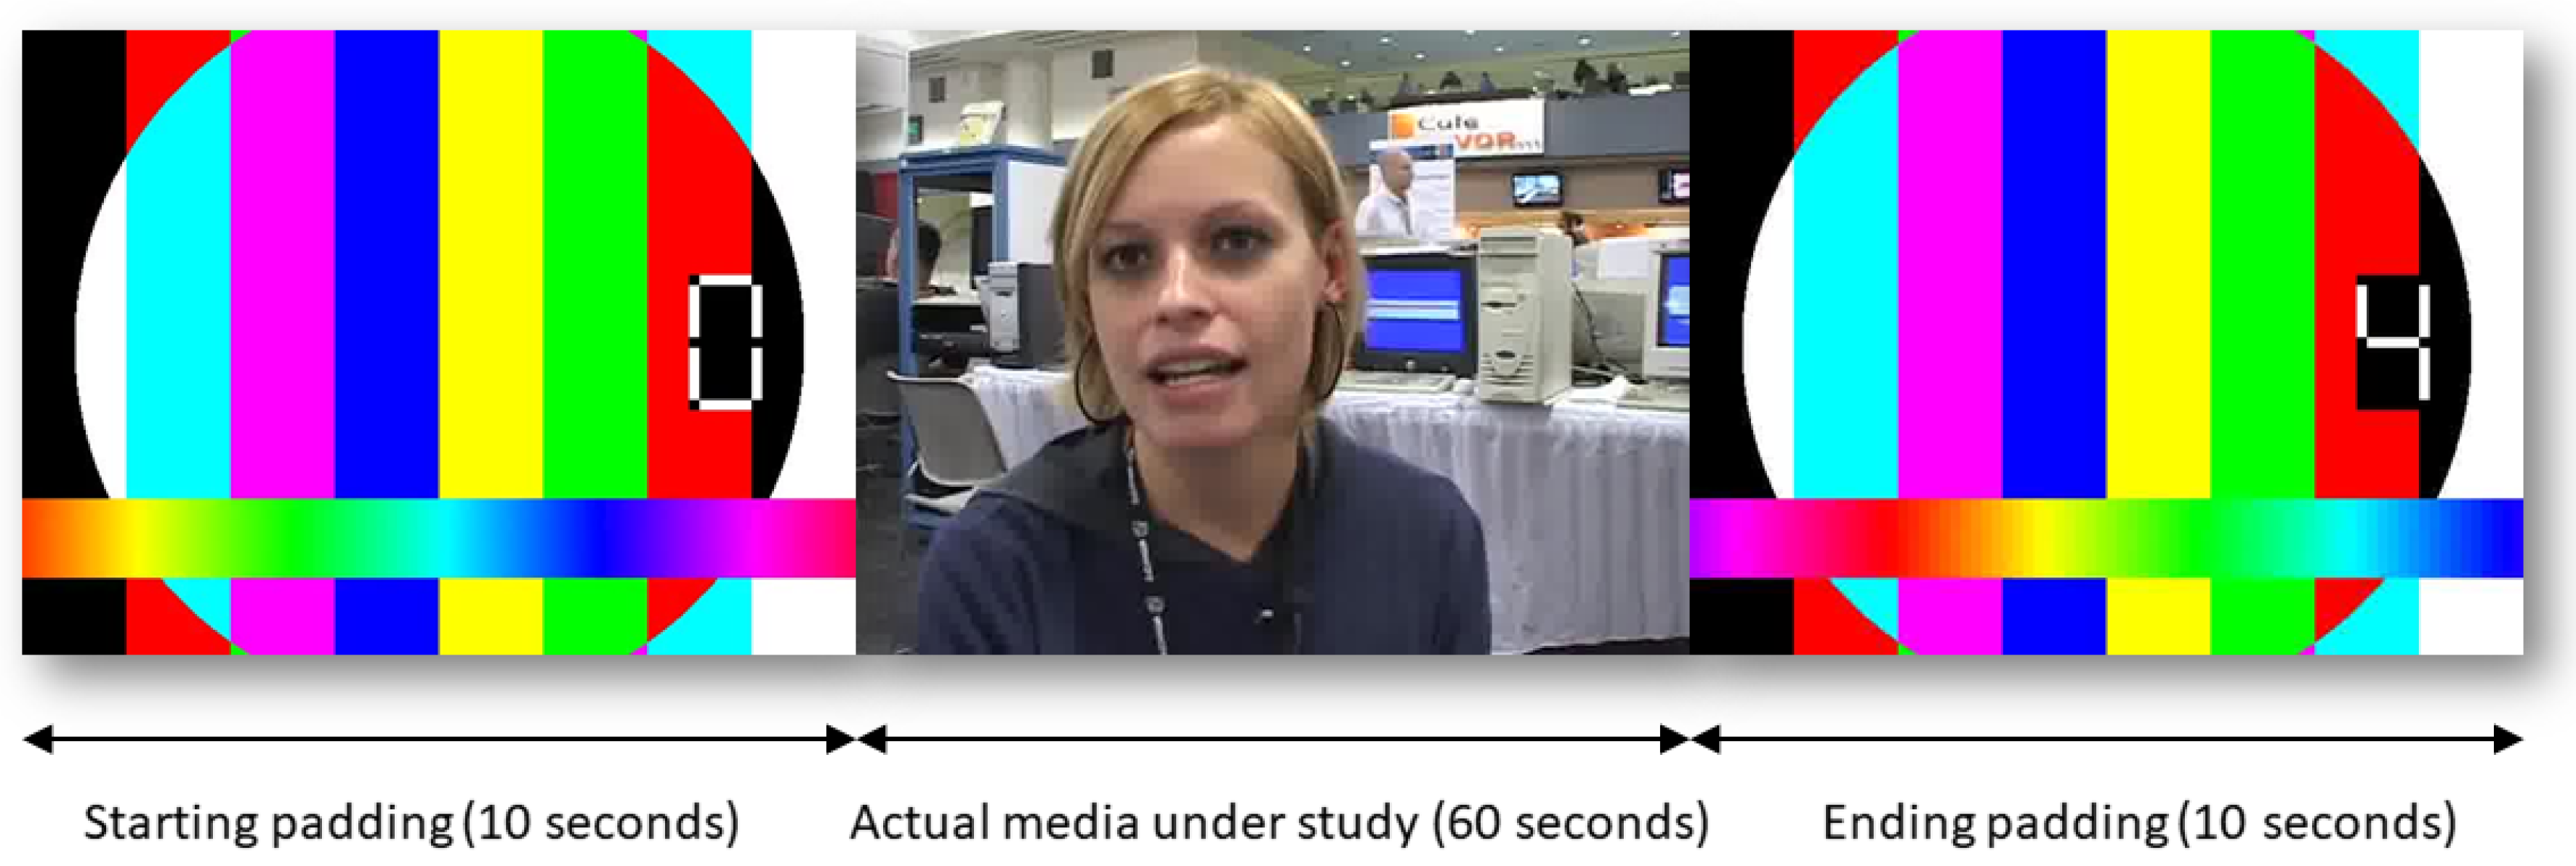
2.2.1. Objective Evaluation
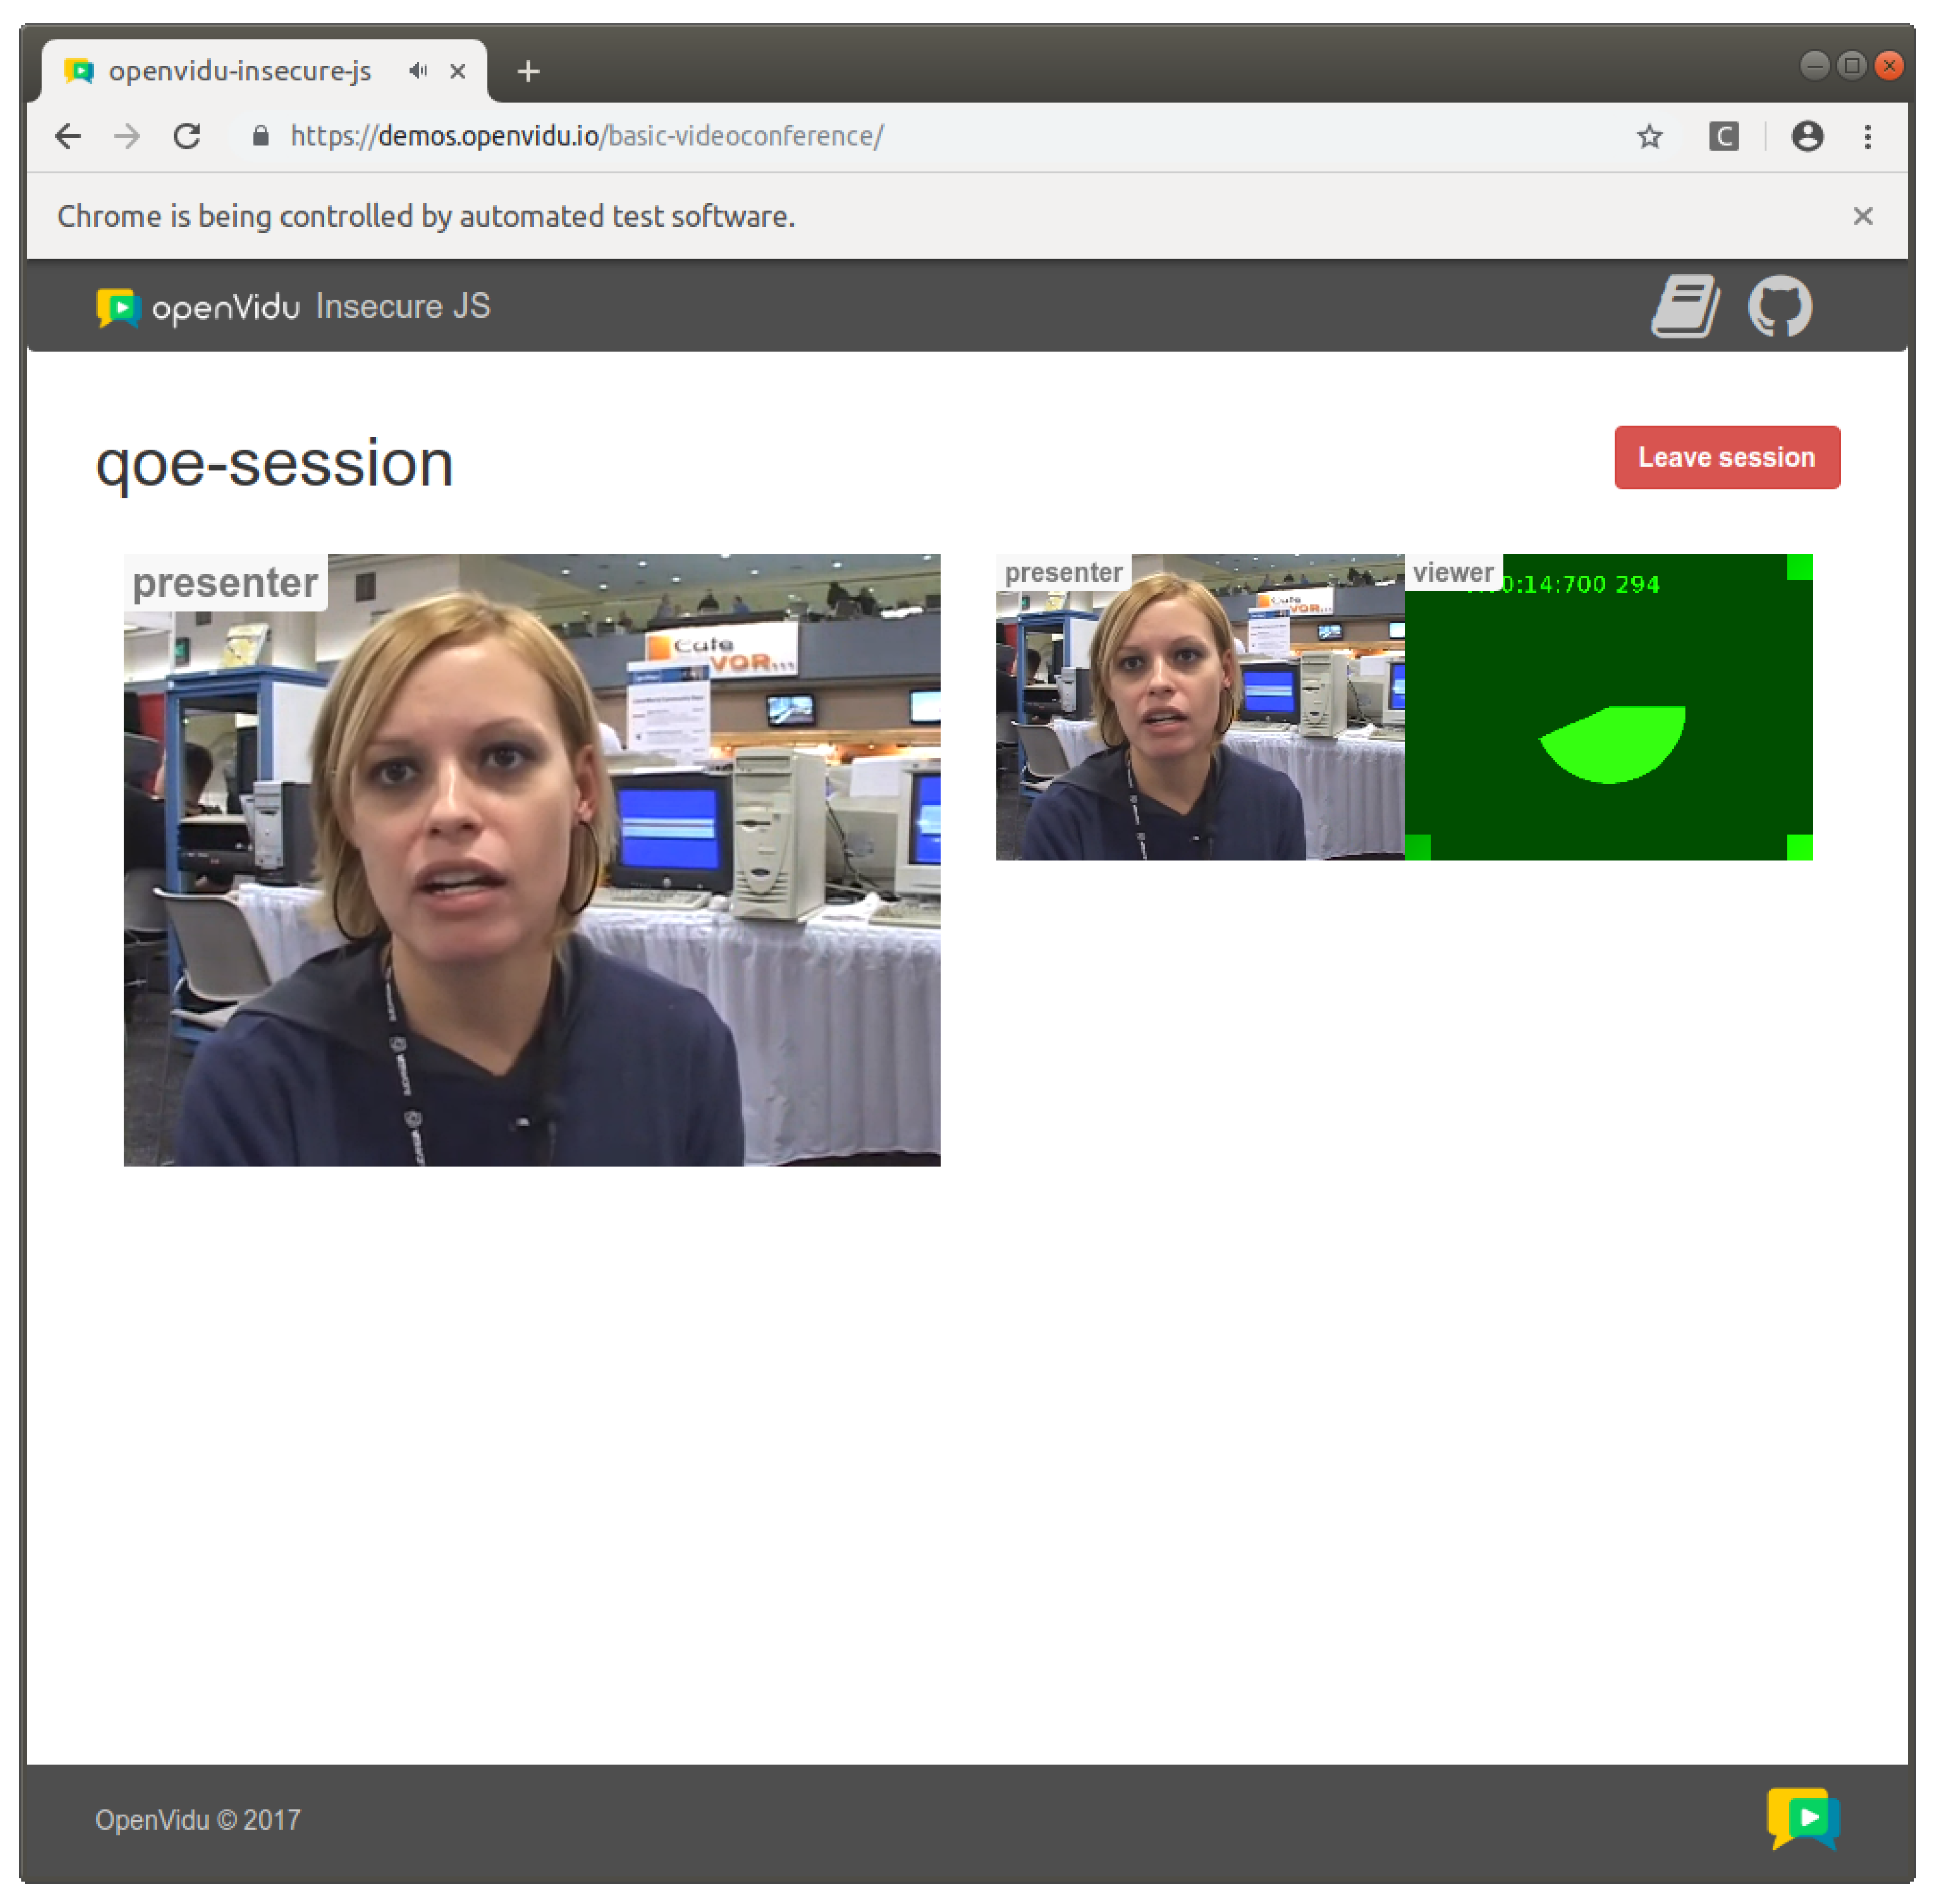
- --use-file-for-fake-video-capture=/path/to/video.y4m: This option allows for feeding a video test sequence in Y4M format for WebRTC streaming instead of using live camera input. We use this option in the browser which acts as presenter, using the video generated with FFmpeg (called test.y4m).
- --use-fake-ui-for-media-stream: This option avoids the need to grant camera and microphone permissions before accessing to the WebRTC feed.
- --use-fake-device-for-media-stream: This option allows for feeding a synthetic video pattern (a green video with a spinner which completes a spin and beeps each second) for WebRTC streaming instead of using live camera input. We use this option in the Chrome browser acting as a viewer.
- VIFp: Visual Information Fidelity in the pixel domain is derived from the mutual information between the input and the output of the Human Visual System (HVS) channel when no distortion channel is present [25].
- SSIM: Structural Similarity measures the difference of structure between the original and the distorted image in terms of luminance, contrast and structure [26].
- MS-SSIM: Multi-Scale SSIM, which is an advanced form of SSIM in which the evaluation is conducted through a process of sub-sampling, reminiscent of multiscale processing [27].
- PSNR: Peak Signal-to-Noise Ratio is the proportion between the maximum signal and the corruption noise [28].
- PSNR-HVS: It is an extension of PSNR incorporating properties of the HVS such as Contrast Sensitivity Function (CSF) [29].
- PSNR-HVS-M: It is an improvement of PSNR-HVS by taking into account visual masking [30].
2.2.2. Subjective Evaluation
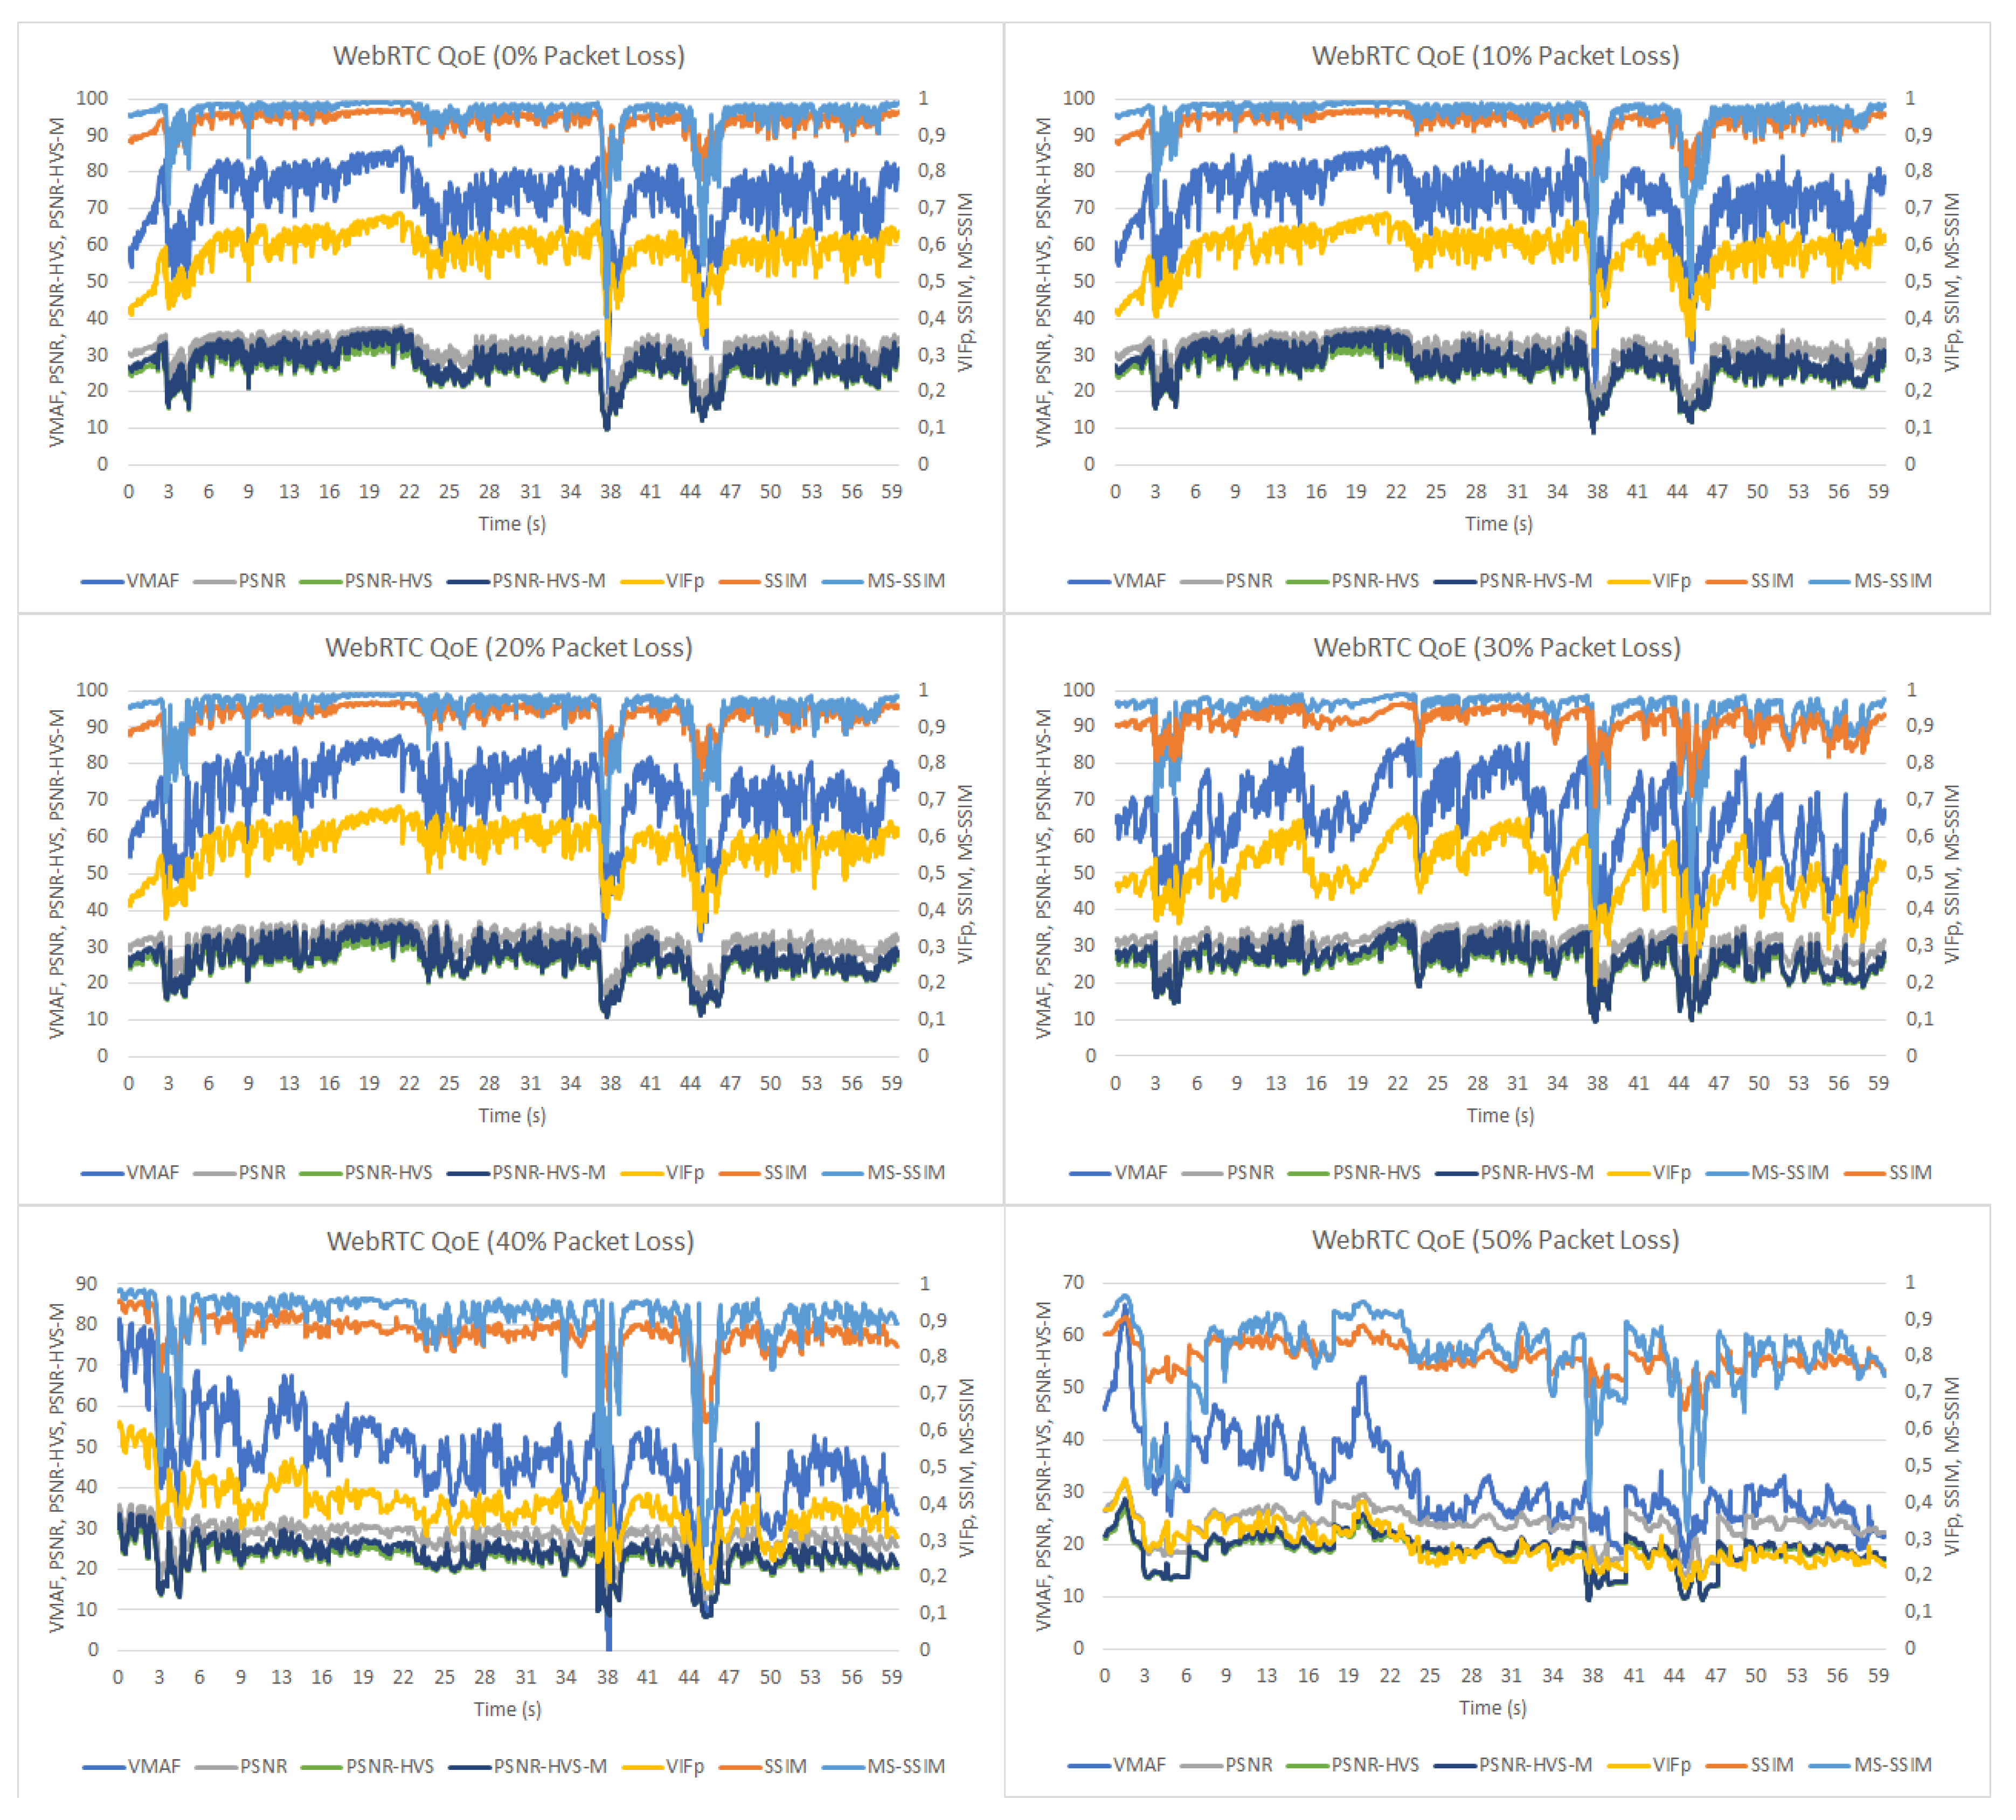
3. Results
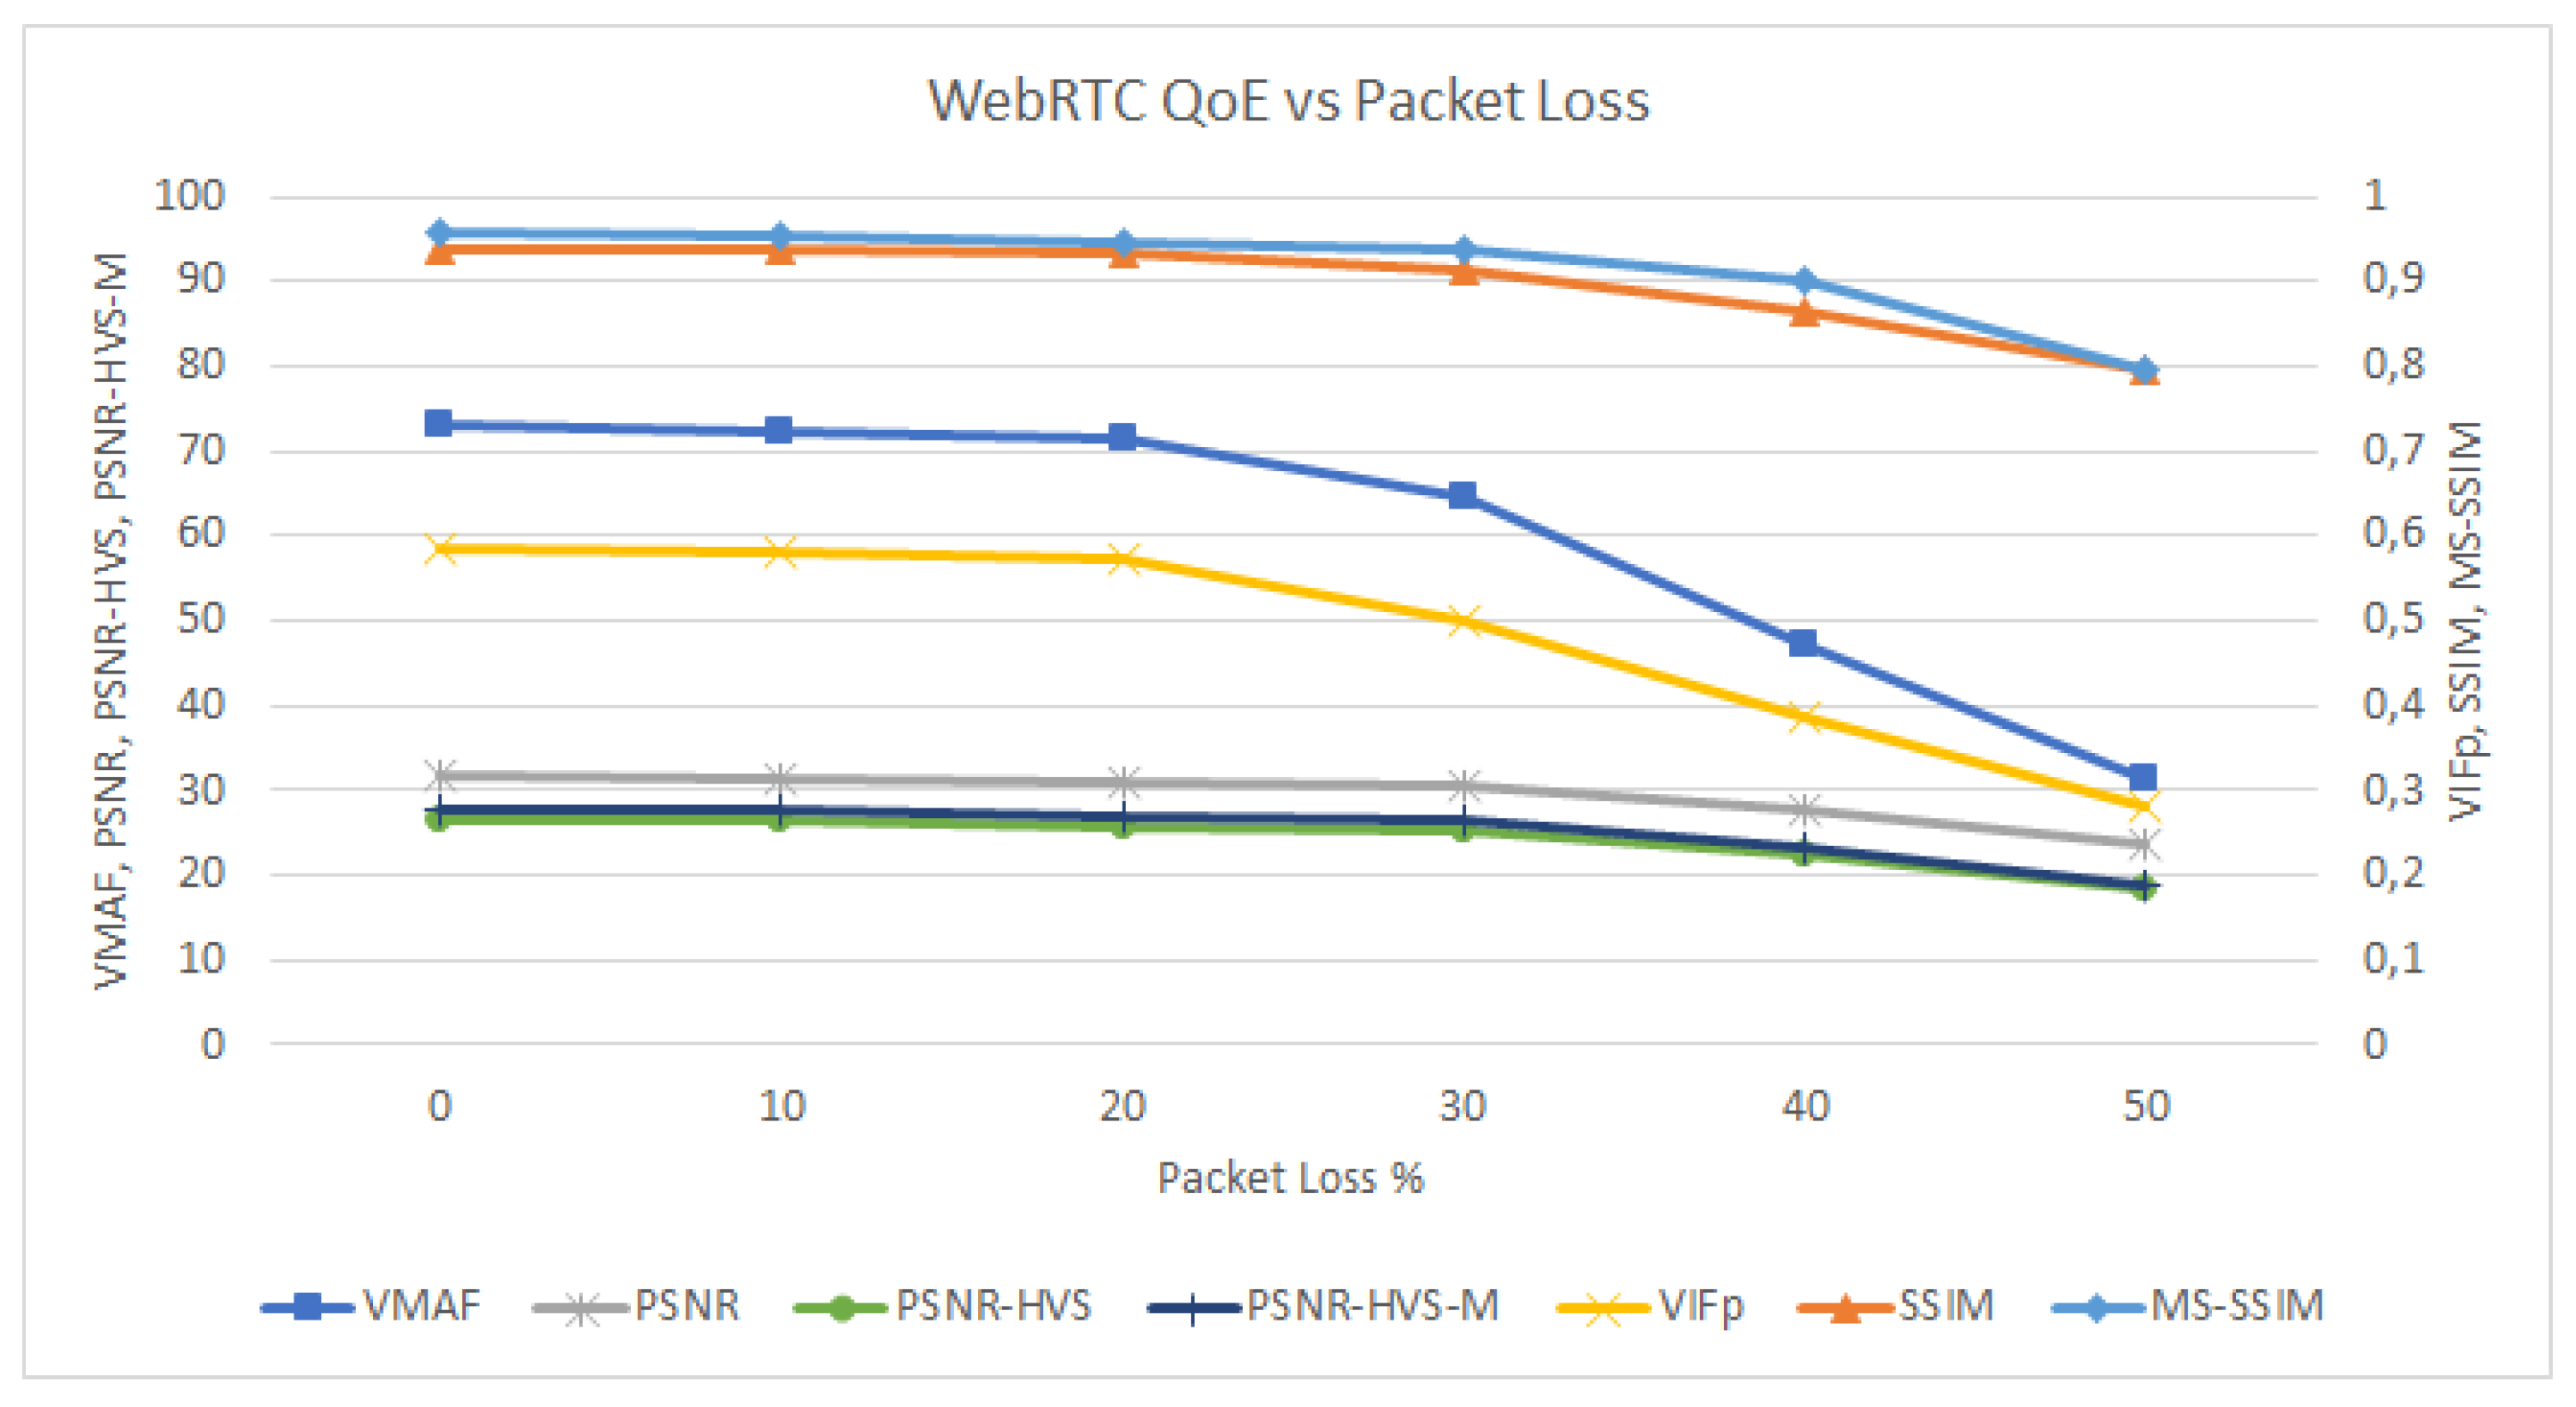
- VMAF scores range from 0 (lowest quality) to 100 (distorted and reference video are equal).
- VIFp score is bounded below by 0 (indicates that all information about the reference has been lost in the distortion channel) and 1 (the distorted and the reference video are the same)
- SSIM (and MS-SSIM) index is a decimal value between 0 (no structural similarity) and 1 (two identical sets of data).
- PSNR (and PSNR-HVS and PSNR-HVS-M) normal range lies between 20 dB (lower quality) and 60 dB (good quality) [31].
4. Conclusions
Author Contributions
Funding
Conflicts of Interest
References
- Loreto, S.; Romano, S.P. Real-Time Communication with WebRTC: Peer-to-Peer in the Browser; O’Reilly Media, Inc.: Sebastopol, CA, USA, 2014. [Google Scholar]
- Sale, S.; Rebbeck, T. Operators Need to Engage with WebRTC and the Opportunities it Presents. Anal. Mason. 2014. Available online: http://www.analysysmason.com/ (accessed on 1 July 2019).
- Gouaillard, A.; Roux, L. Real-time communication testing evolution with WebRTC 1.0. In Proceedings of the Principles, Systems and Applications of IP Telecommunications (IPTComm), Chicago, IL, USA, 25–28 September 2017; pp. 1–8. [Google Scholar]
- Hoßfeld, T.; Schatz, R.; Varela, M.; Timmerer, C. Challenges of QoE management for cloud applications. IEEE Commun. Mag. 2012, 50, 28–36. [Google Scholar] [CrossRef]
- ITU-T. Recommendation P.10/G.100. Vocabulary for Performance and Quality of Service, 2006. Available online: https://standards.globalspec.com/std/10264138/G.100 (accessed on 1 July 2019).
- Timmerer, C.; Ebrahimi, T.; Pereira, F. Toward a new assessment of quality. Computer 2015, 48, 108–110. [Google Scholar] [CrossRef]
- Brunnström, K.; Beker, S.A.; De Moor, K.; Dooms, A.; Egger, S.; Garcia, M.N.; Hossfeld, T.; Jumisko-Pyykkö, S.; Keimel, C.; Larabi, M.C.; et al. Qualinet White Paper on Definitions of Quality of Experience. In Proceedings of the Output from the Fifth Qualinet Meeting, Novi Sad, Serbia, 12 March 2013. [Google Scholar]
- Frnda, J.; Nedoma, J.; Vanus, J.; Martinek, R. A Hybrid QoS-QoE Estimation System for IPTV Service. Electronics 2019, 8, 585. [Google Scholar] [CrossRef]
- Rehman, I.U.; Nasralla, M.M.; Philip, N.Y. Multilayer perceptron neural network-based QoS-aware, content-aware and device-aware QoE prediction model: A proposed prediction model for medical ultrasound streaming over small cell networks. Electronics 2019, 8, 194. [Google Scholar] [CrossRef]
- Chen, Y.; Wu, K.; Zhang, Q. From QoS to QoE: A tutorial on video quality assessment. IEEE Commun. Surv. Tutor. 2014, 17, 1126–1165. [Google Scholar] [CrossRef]
- Chikkerur, S.; Sundaram, V.; Reisslein, M.; Karam, L.J. Objective video quality assessment methods: A classification, review, and performance comparison. IEEE Trans. Broadcast. 2011, 57, 165–182. [Google Scholar] [CrossRef]
- Liu, T.J.; Lin, Y.C.; Lin, W.; Kuo, C.C.J. Visual quality assessment: recent developments, coding applications and future trends. APSIPA Trans. Signal Inf. Process. 2013, 2, 1–20. [Google Scholar] [CrossRef]
- Li, Z.; Aaron, A.; Katsavounidis, I.; Moorthy, A.; Manohara, M. Toward a practical perceptual video quality metric. The Netflix Tech Blog. Available online: https://medium.com/netflix-techblog/toward-a-practical-perceptual-video-quality-metric-653f208b9652 (accessed on 1 July 2019).
- Sheikh, H.R.; Bovik, A.C. Image information and visual quality. In Proceedings of the 2004 IEEE International Conference on Acoustics, Speech, and Signal Processing, Montreal Que, CA, USA, 17–21 May 2004; pp. 1520–6149. [Google Scholar]
- Li, S.; Zhang, F.; Ma, L.; Ngan, K.N. Image quality assessment by separately evaluating detail losses and additive impairments. IEEE Trans. Multimedia 2011, 13, 935–949. [Google Scholar] [CrossRef]
- Lin, J.Y.; Liu, T.J.; Wu, E.C.H.; Kuo, C.C.J. A fusion-based video quality assessment (FVQA) index. In Proceedings of the Signal and Information Processing Association Annual Summit and Conference (APSIPA), Siem Reap, Cambodia, 9–12 December 2014; pp. 1–5. [Google Scholar]
- Orduna, M.; Díaz, C.; Muñoz, L.; Pérez, P.; Benito, I.; García, N. Video Multimethod Assessment Fusion (VMAF) on 360VR Contents. arXiv 2019, arXiv:1901.06279. [Google Scholar]
- Zadtootaghaj, S.; Schmidt, S.; Barman, N.; Möller, S.; Martini, M.G. A Classification of Video Games based on Game Characteristics linked to Video Coding Complexity. In Proceedings of the 16th Annual Workshop on Network and Systems Support for Games (NetGames), Amsterdam, The Netherlands, 12–15 June 2018; pp. 1–6. [Google Scholar]
- Sakaushi, A.; Kanai, K.; Katto, J.; Tsuda, T. Image quality evaluations of image enhancement under various encoding rates for video surveillance system. In Proceedings of the IEEE 6th Global Conference on Consumer Electronics (GCCE), Nagoya, Japan, 24–27 October 2017; pp. 1–2. [Google Scholar]
- Bertolino, A.; Calabró, A.; De Angelis, G.; Gallego, M.; García, B.; Gortázar, F. When the testing gets tough, the tough get ElasTest. In Proceedings of the 40th International Conference on Software Engineering: Companion Proceeedings, Gothenburg, Sweden, 27 May–3 June 2018; pp. 17–20. [Google Scholar]
- García, B. Mastering Software Testing with JUnit 5: Comprehensive Guide to Develop High Quality Java Applications; Packt Publishing Ltd.: Birmingham, UK, 2017. [Google Scholar]
- André, E.; Le Breton, N.; Lemesle, A.; Roux, L.; Gouaillard, A. Comparative Study of WebRTC Open Source SFUs for Video Conferencing. In Proceedings of the Principles, Systems and Applications of IP Telecommunications (IPTComm), Chicago, IL, USA, 16–18 October 2018; pp. 1–8. [Google Scholar]
- García, B.; Gallego, M.; Gortázar, F.; Bertolino, A. Understanding and estimating quality of experience in WebRTC applications. Computing 2018, 1–23. [Google Scholar] [CrossRef]
- Garcia, B.; Lopez-Fernandez, L.; Gallego, M.; Gortazar, F. Kurento: the Swiss army knife of WebRTC media servers. IEEE Commun. Stand. Mag. 2017, 1, 44–51. [Google Scholar] [CrossRef]
- Thakur, N.; Devi, S. A new method for color image quality assessment. Int. J. Comput. Appl. 2011, 15, 10–17. [Google Scholar] [CrossRef]
- Wang, Z.; Bovik, A.C.; Sheikh, H.R.; Simoncelli, E.P. Image quality assessment: from error visibility to structural similarity. IEEE Trans. Image Process. 2004, 13, 600–612. [Google Scholar] [CrossRef] [PubMed]
- Wang, Z.; Simoncelli, E.P.; Bovik, A.C. Multiscale structural similarity for image quality assessment. In Proceedings of the Thrity-Seventh Asilomar Conference on Signals, Systems & Computers, Pacific Grove, CA, USA, 9–12 November 2003. [Google Scholar]
- Huynh-Thu, Q.; Ghanbari, M. Scope of validity of PSNR in image/video quality assessment. Electron. Lett. 2008, 44, 800–801. [Google Scholar] [CrossRef]
- Egiazarian, K.; Astola, J.; Ponomarenko, N.; Lukin, V.; Battisti, F.; Carli, M. New full-reference quality metrics based on HVS. In Proceedings of the Second International Workshop on Video Processing and Quality Metrics, Scottsdale, AZ, USA, 22–24 January 2006. [Google Scholar]
- Ponomarenko, N.; Silvestri, F.; Egiazarian, K.; Carli, M.; Astola, J.; Lukin, V. On between-coefficient contrast masking of DCT basis functions. In Proceedings of the Third International Workshop on Video Processing and Quality Metrics, Scottsdale, AZ, USA, 25–26 January 2007. [Google Scholar]
- Alvarez, A.; Cabrero, S.; Pañeda, X.G.; Garcia, R.; Melendi, D.; Orea, R. A flexible QoE framework for video streaming services. In Proceedings of the 2011 IEEE GLOBECOM Workshops (GC Wkshps), Houston, TX, USA, 5–9 December 2011; pp. 1226–1230. [Google Scholar]
- Yeager, K. SPSS Tutorials: Pearson Correlation; University Libraries: Geneva, Switzerland, 2019. [Google Scholar]
- Amrhein, V.; Greenland, S.; McShane, B. Scientists Rise up Against Statistical Significance. 2019. Available online: https://www.nature.com/articles/d41586-019-00857-9 (accessed on 1 July 2019).
- Wasserstein, R.L.; Lazar, N.A. The ASA’s statement on p-values: context, process, and purpose. Am. Stat. 2016, 70, 129–133. [Google Scholar] [CrossRef]
- Simoncelli, E.P.; Freeman, W.T. The steerable pyramid: A flexible architecture for multi-scale derivative computation. In Proceedings of the International Conference on Image Processing, Washington, DC, USA, 23–26 October 1995; pp. 444–447. [Google Scholar]


| Name | Description | URL |
|---|---|---|
| Medooze | A multiparty videoconferencing service based on MCU | http://www.medooze.com/ |
| Licode | General purpose videoconferencing system | http://lynckia.com/licode/ |
| Jitsi | SFU videoconferencing system | https://jitsi.org/ |
| Janus | General purpose WebRTC server developed by Meetecho | https://janus.conf.meetecho.com/ |
| OpenVidu | SFU videoconferencing system based on Kurento | https://openvidu.io/ |
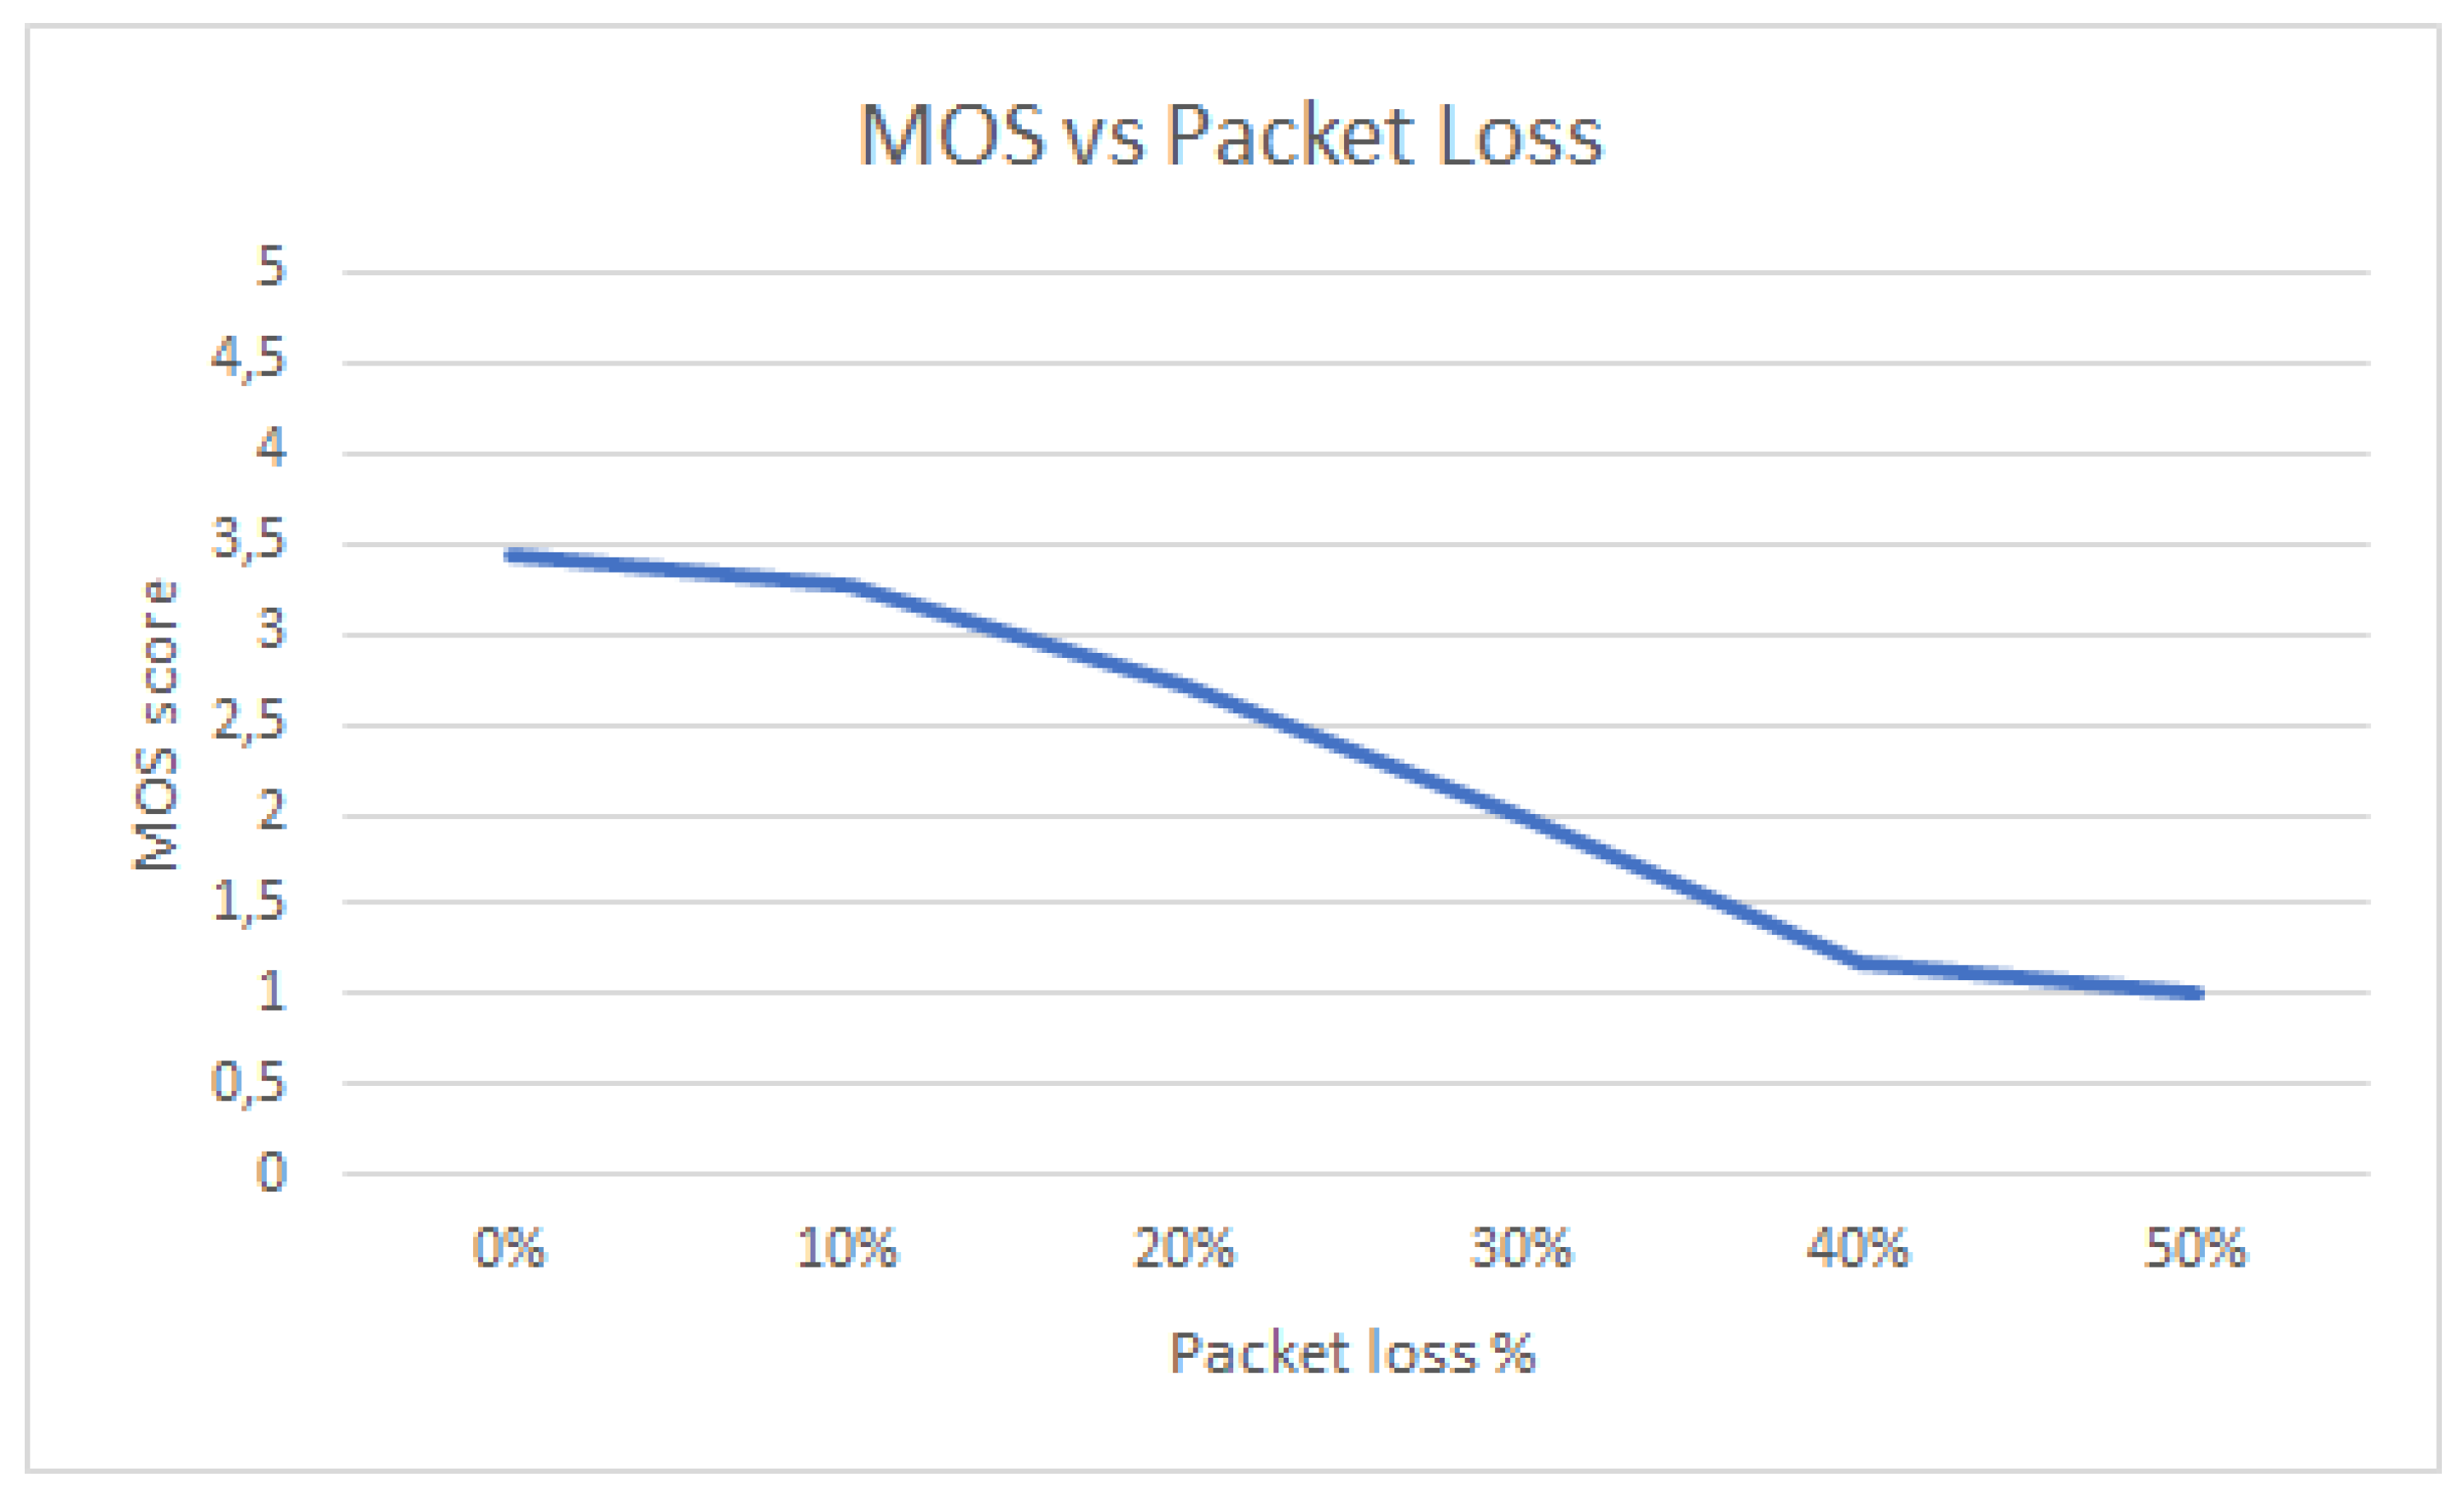
| Packet Loss | VMAF | VIFp | SSIM | MS-SSIM | PSNR | PSNR-HVS | PSNR-HVS-M | MOS |
|---|---|---|---|---|---|---|---|---|
| 0% | 72.93 | 0.58 | 0.94 | 0.96 | 31.61 | 26.57 | 27.8 | 3.43 |
| 10% | 72.44 | 0.58 | 0.94 | 0.95 | 31.48 | 26.45 | 27.67 | 3.28 |
| 20% | 71.38 | 0.57 | 0.93 | 0.95 | 30.88 | 25.83 | 26.94 | 2.7 |
| 30% | 64.74 | 0.5 | 0.91 | 0.94 | 30.38 | 25.35 | 26.6 | 1.98 |
| 40% | 47.1 | 0.39 | 0.87 | 0.9 | 27.6 | 22.42 | 23.37 | 1.18 |
| 50% | 31.52 | 0.28 | 0.79 | 0.79 | 23.64 | 18.43 | 18.94 | 1 |
| VMAF | VIFp | SSIM | MS-SSIM | PSNR | PSNR-HVS | PSNR-HVS-M | |
|---|---|---|---|---|---|---|---|
| MOS | r = 0.915 | r = 0.938 | r = 0.885 | r = 0.809 | r = 0.878 | r = 0.879 | r = 0.871 |
| p = 0.010 | p = 0.006 | p = 0.019 | p = 0.051 | p = 0.022 | p = 0.021 | p = 0.024 |
© 2019 by the authors. Licensee MDPI, Basel, Switzerland. This article is an open access article distributed under the terms and conditions of the Creative Commons Attribution (CC BY) license (http://creativecommons.org/licenses/by/4.0/).
Share and Cite
García, B.; López-Fernández, L.; Gortázar, F.; Gallego, M. Practical Evaluation of VMAF Perceptual Video Quality for WebRTC Applications. Electronics 2019, 8, 854. https://doi.org/10.3390/electronics8080854
García B, López-Fernández L, Gortázar F, Gallego M. Practical Evaluation of VMAF Perceptual Video Quality for WebRTC Applications. Electronics. 2019; 8(8):854. https://doi.org/10.3390/electronics8080854
Chicago/Turabian StyleGarcía, Boni, Luis López-Fernández, Francisco Gortázar, and Micael Gallego. 2019. "Practical Evaluation of VMAF Perceptual Video Quality for WebRTC Applications" Electronics 8, no. 8: 854. https://doi.org/10.3390/electronics8080854
APA StyleGarcía, B., López-Fernández, L., Gortázar, F., & Gallego, M. (2019). Practical Evaluation of VMAF Perceptual Video Quality for WebRTC Applications. Electronics, 8(8), 854. https://doi.org/10.3390/electronics8080854