Context-Aware Mode Selection for 5G Multi-Hop Cellular Networks


UWICORE Laboratory, Universidad Miguel Hernández de Elche (UMH), Avda. de la Universidad s/n, 03202 Elche, Spain
*
Author to whom correspondence should be addressed.
Electronics 2019, 8(8), 840; https://doi.org/10.3390/electronics8080840
Submission received: 5 June 2019
/
Revised: 21 July 2019
/
Accepted: 24 July 2019
/
Published: 26 July 2019
(This article belongs to the Section Networks)
Abstract
:In the present day, 5G and beyond networks are being designed to support the future increase of data traffic and service demands. To support such increase, 5G networks will incorporate device-centric technologies with adequate mechanisms to scale and handle the growing and very large number of connected devices and traffic demands. Device-centric technologies include Device-to-Device (D2D) communications and Multi-hop Cellular Networks (MCNs). In device-centric wireless networks, devices will be able to connect to the network using two different connection modes: through a traditional cellular connection, or through a multi-hop cellular connection based on D2D communications with intermediate mobile devices. Device-centric technologies will therefore provide new connectivity options and significant opportunities to enhance the capacity and efficiency of 5G networks. However, new challenges will need to be addressed. One of them is the selection of the most adequate connection mode for each mobile device, because it will be key to improve the network performance and efficiency. This work proposes a context-aware mode selection scheme capable of identifying and selecting the most adequate connection mode for each device under a wide range of deployment and operating conditions. The proposed scheme estimates the benefits and risks of each connection mode based on context information available at the base station guaranteeing low signaling overhead. The obtained results show that the proposed mode selection scheme helps achieving throughput gains higher than 200% compared to traditional single-hop cellular communications for devices at the cell edge, and significant gains are also achieved compared to other mode selection schemes implemented and evaluated.
1. Introduction
Currently, 5G and beyond networks are being designed to support the future increase of data traffic and service demands due, in part, to the emergence of machine-type communication devices such as sensors, robots or vehicles [1,2,3,4]. However, the general approach considered to date mainly relies on infrastructure-centric solutions [5]. The infrastructure-centric approach reduces the infrastructure cost per bit and facilitates ultra-dense deployments of network nodes. However, to address the future data traffic demands, beyond 5G networks should consider complementing infrastructure-centric solutions with edge-centric ones [6]. In fact, the role of edge-centric networks as a core component of 5G (and beyond) networks is recognized by European Technology Platform NetWorld 2020, for both computing and networking tasks [7].
This idea of decentralization has been evolved by NetWorld2020 and the 5G Industry Association in their Smart Networks vision for 5G and beyond networks [7]. Terminals or devices become a key part of future 5G and beyond networks as outlined in the Smart Networks vision: “not only should the terminal be able to fully exploit the new smartness of the network, but it should become, where suitable, an integral part of the realization of the latter, just like any other infrastructure resource” [7]. This vision is fostered by the growing capabilities (e.g., computing, networking and context-awareness) of certain devices that can be used to support network functions. These devices include smartphones, and other 5G-enabled devices, such as smart sensors, robots, machines or vehicles. This vision moves the edge of the network to smart devices, to exploit their computing, storage and connectivity capabilities [8]. Smart devices will then actively participate in the network management in coordination with the network infrastructure. A 3GPP study item under Release 17 proposes to explore device-centric solutions to improve the energy-efficiency and coverage of 5G scenarios and verticals such as inHome, Smart Farming, Smart Factories, Public Safety, among others [9].
Device-centric technologies will provide 5G networks with adequate mechanisms to scale and handle the growing and very large number of connected devices and traffic demands [10]. Device-centric technologies present new connectivity opportunities, where devices or User Equipments (UEs) will no longer be mere end-points, but will be integral parts of the network: devices will be consumers but also producers of both data and wireless connectivity [7]. Device-centric wireless networks will change the traditional infrastructure-centric architecture. In device-centric wireless networks, devices will be able to communicate directly with other devices in proximity using device-to-device (D2D) communications [11], or act as relays for other devices to connect to the cellular infrastructure in multi-hop cellular networks (MCNs) [12]. MCNs are also referred to as UE-to-network relay in 3GPP standards. MCN is part of the 3GPP roadmap, e.g., to connect and manage machine-type communication devices [13,14]. The substitution of direct and generally Non-Line of Sight (NLOS) single-hop cellular links between a base station (BS) and an UE with various multi-hop D2D transmissions with improved link budgets provides high potential benefits in terms of Quality of Service (QoS), energy-efficiency and system capacity [12]. It will be especially beneficial for machine-type communication devices, as it also affects the lifetime of battery powered devices [15].
3GPP standardization efforts initially focused on proximity-based services [16]. Release 14 has addressed further enhancements to the MCN concept for machine-type communications. However, further research in advanced management techniques is still necessary to efficiently integrate device-centric technologies into 5G cellular systems. In device-centric MCNs, devices have the possibility of establishing the communication with the BS through the traditional Single Hop cellular link (SH mode), in addition to the Multi-Hop connection (MH mode). The design of mode selection schemes that are able to dynamically select the best connection mode (SH or MH) will be key for the deployment of 5G MCNs to support the future Internet of Things. This paper contributes to fill this gap through the design and evaluation of a new mode selection scheme that enables the network infrastructure to select between SH and MH connection modes, taking into account the context of each device. To do so, the proposed scheme makes use of context information available at the BS, such as the density of nodes or the distance to the device, minimizing the signaling needed. Leveraging the concepts of benefits and risks, the proposed scheme selects the most adequate connection mode considering the deployment and operating conditions. The proposed scheme has been evaluated in this study under different node densities, different mobility models, different traffic demand types and different RRM schemes. Its performance has been compared to that achieved with four different reference techniques, demonstrating its capability to outperform existing solutions.
The structure of this paper is as follows. Section 2 reviews the state of the art about mode selection for 5G cellular systems, including those considering MCN scenarios, and motivates the need of the proposed solution in comparison with existing studies. Section 3 presents the mode selection scheme proposed in this work for 5G networks to integrate D2D and MCN. It also includes the methods designed to estimate the benefits and risks of the different connection modes and the interaction of the mode selection and RRM (Radio Resource Management) schemes considered in this work. Section 4 describes the simulation environment used to validate the proposed solution. Section 5 presents the four mode selection schemes that have been used as a reference to analyze the benefits of the proposed solution. Section 6 presents the performance analysis conducted, which compares the performance and efficiency of the proposed solution with the reference schemes in different scenarios, considering different data traffic demands, exploiting different context information and considering different RRM schemes. Section 7 summarizes the main conclusions obtained and the key benefits of the proposed solution.
2. Related Work
In the future beyond 5G network that integrates device-centric technologies, adequate mode selection schemes will be of paramount importance to maximize the overall system performance and satisfy the QoS demanded by the UEs. As an example of mode selection scheme, the work in [17] considers a cellular system where UEs can connect to the BS through an SH or an MH link. The work in [17] proposes that UEs always select the MH mode at the beginning of their transmissions considering its higher potential performance compared to the SH mode. During their transmissions, UEs monitor their experienced performance, and adaptively change to the SH mode if the experienced throughput is below the throughput that could be expected through the SH. This policy can be highly inefficient due to the additional signaling and communication delays required by the establishment of the initial MH connection and the change of the connection mode. The relevance of an adequate mode selection scheme is also highlighted in [18]. This work proposes a scheme that selects the best connection mode for content delivery. Content delivery can be performed through a cellular multicast connection with the BS or through a 2-hop connection at which an UE caches and multicasts content to other UEs through D2D communications. The mode selection scheme proposed in [18] selects the most energy efficient connection mode based on the estimated energy consumption per successful delivery. This work shows that by applying the proposed mode selection criteria, it is possible to reduce the energy consumption per successful content delivery up to 50% when compared with a random mode selection. Previous studies have shown that better (system or UE) performance and a more efficient use of the radio resources can be achieved when the connection mode is selected based on some information about the potential performance achievable with each available mode compared to select a predefined or random mode [17,18]. Some other studies such as [19] propose mode selection schemes for HetNets, where small cells such as picocells, femtocells, etc. are deployed to offload marcocells, improve area coverage and provide high data rate transmission in hotspots.
Several studies have analyzed the problem of mode selection in cellular systems where UEs in proximity can establish a direct D2D communication or communicate through an SH connection. For example, an optimization problem is proposed in [20] to jointly decide the connection mode for each UE (SH mode or D2D mode). The optimization problem aims to maximize the sum of the throughput experienced by the UEs. It also incorporates constraints to guarantee a certain degree of load balancing among the different BSs of the system. Another example is found in [21]. In this work, two UEs in proximity can communicate using a traditional SH connection, or through a direct D2D connection with dedicated resources or sharing resources with other active cellular transmissions. In [21], the authors aim to maximize the overall throughput experienced by cellular UEs and D2D UEs. To this end, the BS acquires information about the channel quality between each UE and the BS and between each pair of transmitter and receiver UEs. By using this information, the BS decides in each scheduling period the communication mode for each transmission, together with the allocated resources. The results achieved in [21] showed that this proposal can significantly improve the system throughput and reduce the interferences between UEs. The results show that the use of dedicated resources for the D2D links is preferred to provide higher UE performance. However, when the number of UEs increases, the D2D links should share resources with the cellular links to increase the system capacity. The downside of this proposal is that the acquisition of the channel quality information of all possible communication links in the system has a non-negligible cost that can compromise the feasibility of the mode selection scheme. The work in [22] proposes that an UE selects the direct D2D link if the pathloss of the D2D link is lower than the pathloss experienced between the UE and the BS. Authors of [22] studied the impact of the errors of the pathloss measurements on the maximum effective communication capacity (i.e., the maximum sustainable constant arrival rate at the transmitter under QoS constraints). They demonstrated that the effective capacity exponentially decreases as the pathloss measurements become noisier.
The mode selection problem is different in MCN scenarios than in scenarios where only SH and D2D modes are possible. Trying to establish an MCN connection has the risk of not being able to find adequate relay nodes so that MCN communications improve the QoS compared to conventional SH communications. This risk can significantly impact the end-user QoS and generate unnecessary network signaling overhead. The integration of MCN in 5G and beyond networks requires the design of mode selection schemes capable to account for the expected performance gains that this connection mode can provide, but also for the risks of establishing MCN connections [23]. Such potential performance gains and risks are strongly conditioned by the scenario and the context (e.g., by the density of nodes in the cell). Few studies tackle the mode selection problem in MCN networks. In cellular systems, UEs at the cell edge usually experience lower QoS levels compared to UEs close to the BS. Based on this assumption, a distance-based mode selection criterion for MCN is considered in [24] and [25]. The study in [25] considers that the MH mode is always selected for UEs at distances to the BS higher than a given threshold, and it analyses mechanisms to select the UEs that will act as relay nodes for the MH connection. The same distance-based mode selection criteria are also considered in [24], but using fixed relays. It is compared in [24] against a mode selection scheme that selects the connection mode (SH or MH) that requires the lower number of subcarriers needed to obtain certain performance level in an OFDMA-based system. The results obtained demonstrate that mode selection decisions should not only take into account distance information, but also incorporate additional context information (such as link quality information). However, estimating and using the SH and MH link quality information can be significantly complex [24]. This complexity can be significantly higher in MCN with mobile relays given the mobility of nodes, and the high number of possible mobile relays.
Interesting insights can be obtained from analytical studies that model and analyze mode selection schemes for MCNs. For example, an analytical framework for MCNs is developed in [26] to study the transmission power consumption, relay probability and outage probability in the system. This framework was used to analyze the performance of a mode selection scheme that selects the MH connection for a given UE if the total power consumption of the links between the UE and the relay UE and between the relay UE and the BS is lower than the power of the cellular SH connection. Authors demonstrated in [26] the accuracy of the theoretical analysis by comparing the analytical results with those achieved by simulation, and also demonstrated that the proposed mode selection scheme can reduce power consumption and outage probability. In [27], the analytical framework presented in [26] was evolved to model a caching enabled MCN. In this study, UEs select the MH connection to download content if there is an UE at a shorter distance than a given distance threshold from the BS. Otherwise, the UE will select the traditional SH connection. This study demonstrates that the distance threshold and the UE density have a great impact on the performance. Authors of [28] propose a dynamic graph optimization framework that enables the modeling of large-scale MCN systems with multiple D2D pairs and node mobility patterns. In the modeled system, communication between BS and end UEs can be established through a direct SH cellular link or an MH connection. The proposed framework allows studying the optimal design of several technical problems in MCN, such as mode selection and resource allocation. The mode selection scheme proposed in [28] aims at maximizing the total amount of data received by the end UEs. This proposal requires to know the evolution of the system (the evolution of the graph) to decide the optimum connection mode for each UE. The proposal of [28] was not designed to be applicable in real systems but provides theoretical performance bounds.
Given the impact of the context conditions on the performance of the system, different studies, such as [26,27], propose a mode selection scheme based on perfect knowledge of the system: UEs select the MH connection if there is a relay node that reduces the power consumption [26] or it is at a shorter distance from the BS [27]. While they provide interesting insights, collecting and sending channel performance information for all possible D2D/MCN links in a cell can introduce high signaling and overhead levels when the number of UEs in the system is high.
To complement and evolve existing solutions, this paper proposes a mode selection scheme for MCNs that exploits information available at the BS to estimate the potential benefits and risks of the SH and MH connection modes for each UE. In particular, the proposed mode selection scheme exploits the distance between the BS and the end UE, and the density of nodes in the cell. This information is used by the proposed mode selection scheme to decide the most convenient connection mode for each transmission with a low signaling overhead.
3. Mode Selection Scheme
This study proposes a mode selection scheme for 5G networks to integrate D2D and MCN that dynamically selects the most efficient connection mode (traditional cellular SH connection or MH cellular connection) for each DN (destination node or UE). To this aim, the proposed scheme exploits context information such as the distance between BS and DN and the density of UEs, which can be obtained by the BS without any additional signaling. This work focuses on downlink transmissions so that the BS can decide whether to establish a direct cellular SH connection or an MH connection with the DN using a relay node or RN, as illustrated in Figure 1. When considering an MH cellular connection, a 2-hop scenario is considered in this study given the results in [29] that show that using more hops does not provide additional benefits.
3.1. Mode Selection
The metric used by the proposed mode selection scheme to select the most adequate connection mode (SH or MH) for each transmission is the expected QoS performance. The expected QoS performance is estimated for each transmission by evaluating the potential benefits and risks of selecting each connection mode. Consequently, the proposed mode selection scheme will be referred to as BRISK (mode selection scheme based on Benefits and RISKs).
The benefit that the connection mode m (SH or MH) can provide to DNi is here denoted by . It is represented by the QoS performance (e.g., user satisfaction) that mode m could achieve if the connection with DNi is established under the adequate conditions (e.g., if an adequate RN improving the DN performance is found in MH connections).
The risk associated with the use of connection mode m with DNi is denoted by . This risk is linked to the probability that the transmission cannot be established under the conditions required to achieve the benefit offered by this mode. For example, if an adequate RN improving the DN performance cannot be found in the case of MH connections.
The QoS performance that a DNi could expect when using connection mode m can then be expressed as:
The main goal of BRISK is then to select the connection mode for each destination node DNi that provides the best compromise between benefits and risks, and therefore a higher expected QoS performance. It can formally be expressed as:
3.2. Benefits and Risks
To estimate the benefit of a given connection, this study models the performance of the cellular system with concentric rings centered at the BS, as illustrated in Figure 1. Each ring R is defined as the coverage area of a BS where a given Modulation and Coding Scheme (MCS) maximizes the throughput. Ri represents the ring where DNi is located. Rings closer to the BS can provide higher QoS. indicates that an UE located at ring can obtain a higher data rate than an UE located at R.
We denote as q(c,R) the average cellular QoS performance that an UE can experience when it is located in the ring R and is assigned c radio resources. We consider that all UEs located in the same ring R experience on average the same QoS. q(c,R) should reflect the user satisfaction level. This is challenging since user satisfaction is a subjective concept that depends on user perceptions. In this study, q(c,R) tries to quantify it as a function of the cellular throughput experienced by the DN in an SH transmission or the RN in an MH transmission. In this context, the function proposed in [30] and presented in Equation (3) has been considered. A throughput level lower than certain minimum threshold, thmin, provides a q(c,R) equal to zero. Above this minimum threshold, q(c,R) grows and asymptotically tends to one [30]. Other q(c,R) could be used. However, the impact of this function on the conclusions obtained in this paper is low, because the main goal is to compare BRISK with other schemes, and not at establishing absolute performance values. This paper presents a comparative analysis between different communication modes, and the selected q(s,R) function affects equally all modes.
3.2.1. SH Connection Mode
The benefit of selecting the SH mode for DNi is directly related to the performance it could achieve through the cellular link to the BS. This performance depends on its distance to the BS, di, and on the number of radio resources assigned to it, ci. The distance to the BS determines the QoS ring where it is located, Ri. Consequently, the benefit that DNi can achieve if mode SH is selected can be expressed as:
The risk of selecting the SH mode for DNi is associated with the availability of radio resources. If there are no radio resources available, the SH link cannot be established, and the expected benefits cannot be achieved. The availability of radio resources also influences the MH connection mode, because an MH connection also requires that sufficient radio resources are available for the link between the BS and RN. Given that the final decision to select SH or MH is made with Equations (1) and (2) that compare their benefits and risks, and that the risk that there are no radio resources available will be the same in both connection modes, we can omit it. Consequently, the risk of selecting the SH mode for the transmission between BS and DNi is defined as zero:
where dcell represents the cell radius. Combining Equations (4) and (5) in (1), the expected performance for a destination node DNi at a distance di from the BS can then be expressed as follows for the SH mode:
3.2.2. MH Connection Mode
An MH connection can provide higher QoS performance to the DNi than the direct SH link if it is established under adequate conditions. In particular, the performance of an MH connection could outperform the performance of an SH connection if there is an RN in a ring R with higher cellular performance than the one experienced by DNi, i.e., RRi. In order to fully transfer the RN performance to DNi, the distance between RN and DNi must be lower than a certain threshold r1. This can be observed in Figure 2 that plots the throughput experienced by a DN in an MH connection as a function of the distance between the DN and the RN using the model given in [31]:
In Equation (7), d is the RN-DN separation distance, and p1 and p2 define the sigmoid function that models the MH throughput experienced in a 2-hop MH connection as a function of the distance RN-DN; particularly, this work has considered p1 = 0.12 and p2 = 187 established in [31] for LOS conditions. ThRN represents the throughput experienced by the RN through the cellular link with the BS. Figure 2 shows that for distances lower than r1, the throughput experienced by the DN through the MH connection is equal to the throughput experienced by the RN (ThRN). The figure also shows that an MH connection using an RN located at a distance to the DNi higher than r1 but lower than r2 can still provide higher throughput than the SH direct link (ThSH in the figure). Distance r2 depends on ThRN and ThSH, and is calculated for each DNi based on the 2-hop MH throughput model given in [31]:
ThSH and ThRN depend on the rings where DN and RN are located respectively. Using this information, r2 is dynamically calculated for each DN.
Taking into account the rings previously defined and the throughput model for the RN-DN connection in Figure 2, we will consider that the RN can fully transfer its cellular performance to DNi if the RN is located within the area Ai(r1). This area is the union of areas Ai,R(r1) for all rings R that satisfy RRi. Each area Ai,R(r1) is the intersection between ring R and a circle C(i,r1) centered in DNi with radius r1. Area Ai(r1) can be therefore expressed as presented in Equation (9) with Ai,R(r1) presented in Equation (10):
This area is highlighted in Figure 3. If the RN is in the area Ai(r2) − Ai(r1), the cellular performance of the RN cannot be fully transferred to DNi, but the MH connection could still provide higher performance than the SH connection (as shown in Figure 2 for distances between r1 and r2).
When an MH connection is to be established, BS searches first for an RN within Ai(r1). If no RNs are present within Ai(r1), BS searches then for an RN within Ai(r2). Taking into account the areas defined and highlighted in Figure 3, the expected MH benefit for DNi can be expressed as:
In this equation, PRN(·) represents the probability of finding at least one RN within the area given between brackets. and represent the benefit expected for DNi when using an RN located in area Ai(r1) and area Ai(r2)-Ai(r1) respectively, and are expressed as:
In Equation (12), q(ci,R) represents the performance of the cellular link between BS and an RN located in R when ci cellular radio resources are assigned to such link, which is equal to the performance experienced by DNi through the MH connection because it is fully transferred from RN to DNi. In Equation (13), such performance is not fully transferred, and we need to calculate qext(ci,R). It represents the performance that would experience DNi if an RN is located in the area Ai,R (r2)-Ai,R(r1). Based on the 2-hop MH throughput model given in [31], qext(ci,R) is calculated using the following expression:
with p1 = 0.12 and p2 = 187 [31]. To calculate qext(ci,R), we consider that the RN is located at an average distance ravg from DNi between r1 and r2 given by:
MCN connections entail signaling cost in the process to find relay nodes and to establish an end-to-end connection. This signaling cost, together with the possibility that the MH connection degrades the end-to-end performance if the MH connection is not established under adequate conditions, highlight the importance of considering the risk of selecting the MH mode in the mode selection decision process. The risks of establishing an MH connection are associated with the presence and location of potential RNs. Two risks can be identified when trying to establish an MH connection: (1) the risk that there is no RN that can provide higher cellular performance than the SH connection; and (2) the risk that the cellular performance obtained by the RN cannot be transferred to the DN through the RN-DN D2D link. These situations could result in that the performance of the MH connection mode is lower than the performance of the SH mode, and need to be avoided. To this aim, the risk associated to the establishment of an MH connection with DNi are calculated by BRISK as the probability of not finding any RN within Ai(r2), and is expressed as:
The expected QoS performance of an MH connection can then be computed combining in (1) the expected benefit calculated in (11) and the risk in (16):
3.3. Context Information
To calculate the expected performance of SH and MH modes for a given DNi, BRISK makes use of context information available at the BS. Following the system model previously described, the expected performance of both SH and MH depends on the distance between DNi and the BS. This distance can be estimated by the BS without additional signaling through the received signal strength of signaling and control messages exchanged with DNi.
The expected performance also depends on the probability of finding an adequate RN in a certain area close to DN i, which was previously expressed as PRN(·). This possibility highly depends on the UE distribution over the cell. This distribution is usually modelled through a uniform spatial distribution using a homogeneous Poisson process [32]. Following this model, the number of UEs in a given area A follows a Poisson distribution with parameter ρ·A, being ρ the average UE density in the scenario. In this case, the probability of finding at least one UE in a given area A can be calculated with the following expression:
The only parameter needed to calculate PRN(A) is the UE density in the context of DN i. If we consider that the UE density is constant over the cell, we can simply consider in Equation (17) the average UE density in the cell, ρcell. The BS knows the number of UEs under its coverage, therefore it can easily calculate the average UE density as the number of UEs divided by the cell area:
Using Equations (17) and (18), BRISK can calculate the benefit and risk of an MH connection for a given DN in a scenario where the UEs are uniformly distributed. However, the movement of the UEs could result in non-uniform UE distributions, creating areas with higher number of UEs, which are known as attraction areas or hot spots. These areas could correspond to e.g., shopping centers or working areas. In this type of scenario, the distribution of the UEs in area A that is significantly smaller than the cell coverage area (i.e., A ) could also be considered homogeneous [33]. Therefore, the probability of finding at least one UE in a given area A could be still calculated with Equation (17) following the Poisson distribution. However, the average UE density in the cell does not accurately reflect the UE density in cells when the UEs are not uniformly distributed. To improve the accuracy of the estimation of PRN(·) in these scenarios, we propose to further exploit context information available at the BS. Based on the estimated distance from the BS to the UEs in the cell, the BS can estimate the UE density in the ring that intersects with the area where the adequate RN would be located. This ring is determined by the distances din and dout illustrated in Figure 3, that correspond to the distances from the BS to the closest and farthest points of the area Ai(r2), respectively. The UE density in this ring can be then calculated with the following equation:
where represents the number of UEs located at a distance to the BS higher than din and lower than dout.
BRISK can also go one step further to exploit additional context information to improve the accuracy of the benefit and risk estimation. Most of the current cellular deployments consider cells with multiple sectors and this information can be exploited by BRISK to better estimate the UE density in the proximity of the DN. More specifically, the BS can estimate the UE density in each ring for each sector using the following equation:
In this equation, s represents the sector where the DN is located, and S represents the total number of sectors in the cell. represents the number of UEs in sector s at a distance d to the BS so that din d < dout. The BS has direct access to context information that can be used to calculate ρcell, ρring and ρsector so that BRISK can estimate the UE density accurately in different conditions.
3.4. Interaction Between Mode Selection and RRM Schemes
The performance that can be achieved with either the SH or the MH mode highly depends on the number ci of radio resources assigned for the transmission. ci is used for the direct link between BS and DN i in the case of SH, and for the cellular link between BS and RN in the case of MH. As a consequence, the SH and MH performance depend on the RRM policy implemented to distribute the radio resources. In fact, advanced RRM solutions usually takes into account the performance that an UE could obtain to decide the number of radio resources to be assigned, which in turn depends on the connection mode used (SH or MH). Given their mutual influence, we need to define how they interact.
The mode selection scheme needs to first identify the optimum connection mode for all possible radio resource assignments, i.e., for all possible values of c ∈ [1, C], with C representing the maximum number of available cellular radio resources in the cell. As a result, the expected performance for each possible radio resource assignment c can be expressed as:
The values calculated with Equation (22) by the mode selection scheme are used by the RRM scheme to decide the number of resources for each DNi. This can be formulated with the following equation that represents the performance Qi of DNi as a function of a set of binary variables :
The RRM scheme needs to compute each . will be equal to one if DNi is assigned c radio resources, and equal to zero if not.
4. Evaluation Environment
The performance of BRISK has been evaluated in this study with a discrete-event C++ system-level software simulator. The scenario simulated considers an omnidirectional BS of 500m radius that is deployed in the center of the scenario [34]. The SH mode and the cellular link between the BS and RN in MH mode make use of the LTE technology. The LTE MCSs associated to the 15 CQI values defined by 3GPP in [35] have been implemented. The MCS selected depends on the distance between BS and DN (for an SH connection) or between the BS and RN (for an MH connection), and they therefore depend on the rings where they are located.
The link between the RN and the DN in MH mode makes use of out-of-band D2D communications using IEEE 802.11 g. The simulator considers the throughput model proposed in [31] to model the MH throughput as a function of the distance between the RN and the DN (presented in Section 3.2. This model considers r1 = 150 m as established in [31] based on real measurements. r2 is calculated with Equation (8) using the empirical model presented in [31]. To establish an MH connection, the BS first searches for an RN within Ai(r1). If it cannot find any RN in this area, it continues the search within Ai(r2). In both cases, if there are several candidate RNs within the corresponding area, the BS selects the RN that is closer to it. Finally, if no RNs are found in Ai(r2), the selected RN is the closest UE to DNi among all the UEs that are located at a shorter distance to the BS than DNi. An MH connection with an RN located out of Ai(r2) provides lower throughput levels than an SH connection. In a practical implementation of the proposed mode selection scheme (and any other mode selection scheme), these situations could be detected to automatically switch to mode SH. In this study, we have not implemented this solution to avoid hiding the performance achieved by the mode selection scheme in all scenarios as a result of a good or bad mode selection.
As detailed below, the proposed scheme, BRISK, has been compared with four different reference techniques considering four different UE densities, three different mobility models, two different traffic demand types and two different RRM schemes.
4.1. UE Density and Mobility
The different UE densities presented in Table 1 have been evaluated in order to analyze the capability of the proposed mode selection scheme under different operating conditions. In these scenarios, a fixed number of 10 DNs demanding transmissions is considered for all the simulations.
To evaluate and compare the performance of the proposed solution under different uniform and non-uniform UE distributions, three different scenarios have been considered (that result from the application of different mobility models):
Homogeneous scenario: RN and DN UEs move following the Random Direction model [36]. This model considers that the UEs move at a constant speed and direction through the cell. The speed is randomly chosen between 0 and 3m/s and the direction is randomly selected between 0 and 360°. When an UE reaches the edge of the cell, it selects a new speed and direction to continue moving within the cell. This mobility model results in a uniform distribution of UEs within the cell.
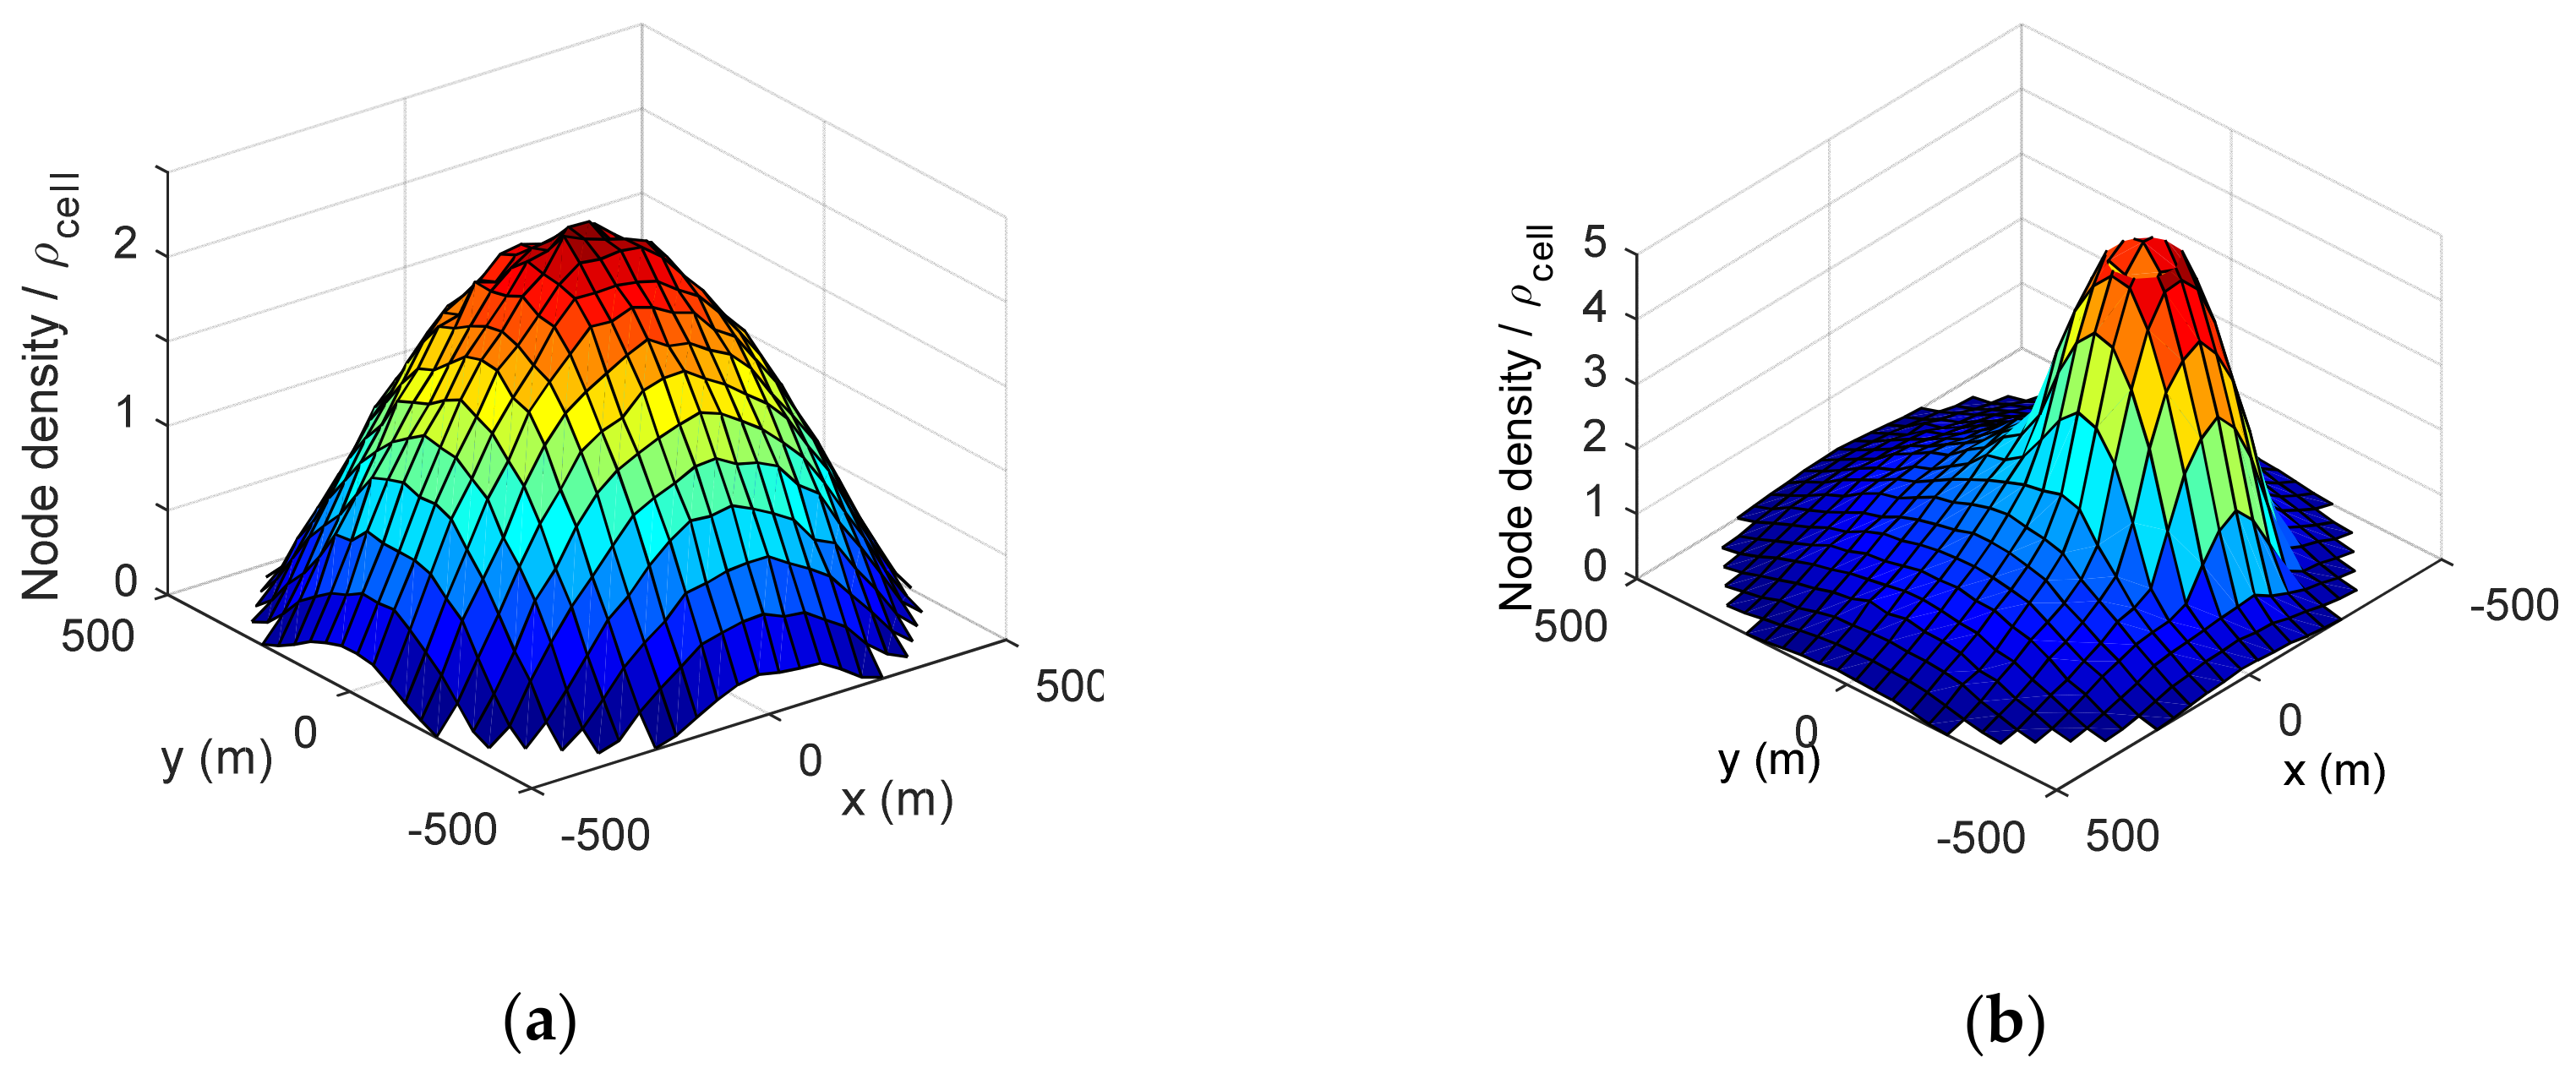
Circularly symmetric scenario: RN and DN UEs move following the Random Waypoint mobility model [33]. This model considers that each UE selects a random destination within the cell and it then moves towards the selected destination at a constant speed randomly chosen between 0 and 3 m/s. When an UE reaches its random destination, it randomly chooses a new destination and a new speed. The Random Waypoint mobility model produces a non-homogeneous distribution of UEs within the cell, since UEs tend to concentrate at short distances to the center of the scenario, i.e., at short distances to the BS. Therefore, the resulting UE distribution is circularly symmetric centered at the BS. Figure 4a shows the UE density as a function of the distance to the BS for this scenario. In this figure, the UE density is normalized by the average UE density in the cell, ρcell.
Non-symmetric scenario: in this scenario, RN and DN UEs move following the Random Waypoint mobility model previously described but evolved considering the existence of an attraction area. The probability that an UE randomly chooses a destination inside the attraction area is p = 10 times higher than outside it. The attraction area is a circle with 200 m radius centered in location (200 m, 60°) using polar coordinates, considering that the BS is in the origin. This mobility model produces a non-homogeneous scenario that has a higher UE density in the attraction area, as shown in Figure 4b. In this case, there is no circular symmetry with respect to the BS.
4.2. Traffic Demand
The traffic demand can also have an impact on the performance and operation of a mode selection scheme. To demonstrate the validity and compare the performance of BRISK with the performance of the reference techniques under different conditions, the following traffic demand types have been considered:
Web traffic: All DNs request web browsing sessions following the model reported in [37]. The average time between sessions has been set equal to 10 s.
4.3. RRM Schemes
The absolute system performance depends on the RRM scheme considered. To avoid limiting the performance evaluation to a single RRM scheme, this study considers the following 2 RRM schemes proposed in the literature:
MAXIHU [30]: this scheme was initially proposed for heterogeneous networks and has been adapted in this study to decide the number of radio resources to be used by each active transmission (SH or MH). MAXIHU was designed to provide the highest possible homogeneous performance to all UEs. This is achieved by MAXIHU by defining an optimization problem with an objective function that maximizes the multiplication of the performance perceived by all active UEs in the system (n represents the number of active UEs in the cell):
To be able to apply integer linear programming techniques, Equation (24) can be expressed linearly as [30]:
The problem defined and solved by MAXIHU is used to decide which variable is set to 1 for each DNi, and therefore the number of resources, ci, that will need to be assigned to each UE. The values of the Qi(c,di) are calculated by BRISK before applying MAXIHU. The restrictions of the optimization problem take into account that only one variable can be equal to one for each UE. They can also incorporate different priorities to differentiate UES requesting different services (this is only applied in scenarios where it is not possible to guarantee the same QoS performance level Qi(c,di) to all UEs). If the optimization problem does not have a solution, the active UE located at a highest distance to the BS is removed from the RRM process, until a solution to the optimization problem is found.
MinP [39]: This RRM scheme is designed to guarantee a minimum QoS performance to all UES. To this aim, MinP assigns to each DNi the number of resources that are necessary to achieve a throughput of Thmin (3Mbps) which can be expressed as:
where Qi(c,di) is calculated by BRISK before applying MinP. If all active UEs cannot obtain this minimum throughput, again the active UE located at a highest distance to the BS is removed from the RRM process, until a feasible solution is found.
5. Reference Mode Selection Schemes
The performance of BRISK is compared against the mode selection schemes described below. For all schemes, changes between connection modes are not allowed in order to focus on the impact of the mode selection process.
Traditional SH communications (SH). This scheme is used as a reference to compare the proposed scheme against that obtained when operating traditional SH cellular communications.
MH communications (MH). This scheme was proposed in [17] and it always selects the MH connection mode, given the higher potential performance compared with the SH mode.
Optimum mode selection. This is an ideal scheme that has perfect knowledge of the DN context and is used to perform optimum selection decisions. To do so, it only selects the MH mode when it provides an improved link budget compared with the direct SH link.
Distance-based mode selection (DMS) [24,25]. This scheme has been implemented as in [25] for MCN. It is designed to select the SH mode for those DNs located at a distance to the BS shorter than certain dref. If the distance between the DN and the BS is larger than dref, the MH mode is selected. In this case, the RNs selected must be closer to the BS than DN, and the distance RN-DN must be shorter than the communication range of the D2D link. The performance of DMS highly depends on the dref parameter. Different values between 300 m and 400 m have been evaluated in order to select the best one for the comparison with the rest of mode selection schemes. Figure 5 shows the average throughput per assigned cellular radio resource achieved by the DMS scheme as a function of the distance of DN to the BS. The results are shown for different dref values, considering the 50 RN and 400 RN scenarios with a homogeneous UE distribution and web traffic. Based on the results obtained, dref has been set to 350 m in the rest of this study, because it achieves a better compromise under low and high UE density scenarios.
6. Performance Analysis
The performance of BRISK has been evaluated and compared with the performance achieved with 4 reference schemes under a wide range of operating conditions that include different UE densities, mobility models, traffic demand types and RRM schemes. The performance analysis presented below starts with the homogeneous scenario with web traffic, and it then sequentially analyses the use of mixed multimedia traffic, the impact of the accuracy of the context information in different scenarios, and the impact of the RRM algorithm considered. In this section, we will refer to BRISK-C, BRISK-R and BRISK-S whenever BRISK uses ρcell, ρring and ρsector (see Section 3.3) to estimate the UE density, respectively.
6.1. Homogeneous Scenario with Web Traffic
Figure 6 compares the average throughput experienced by the DN per assigned radio resource as a function of its distance to the BS for BRISK-R and SH schemes, considering the homogeneous scenario and web traffic. This metric is used in this study to analyze the operation and performance of mode selection schemes independently of the radio resource allocation. BRISK-R is configured to use ρring parameter obtained with Equation (20) to calculate the benefit and risk of each potential MH connection. As the traffic density increases, the performance of the SH scheme does not change because the number of active DNs is fixed. However, the figure shows how the performance of BRISK-R significantly increases with the UE density because the probability of finding an RN is higher.
The throughput gain that can be obtained with the different mode selection schemes with respect to the SH scheme can be observed in Figure 7. The results are shown for the scenarios with lowest and highest UE density, but the same trends are maintained for intermediate UE densities. As it can be observed, the highest gain is achieved by the optimum scheme. The performance of MH is close to the optimum for the high-density scenario, but it is significantly degraded in the scenario with low density because it is more difficult to find an adequate RN. DMS provides a significant gain compared to SH, but only at very large distances to the BS. The MH scheme that always selects the MH connection mode provides the same throughput gains in the scenario with higher RN density, since it is always possible to find an RN for establishing the MH link. However, it significantly degrades the throughput experienced when the density of nodes is low (Figure 7a) for DNs at distances from the BS shorter than 400 m. This happens because it is not possible to find an RN at distances lower than r2 from the DN. In this case, it is not possible to transfer the throughput experienced by the RN to the DN due to the low performance of the D2D link between the RN and the DN. This result highlights the importance of considering the risk of establishing the MH communication link when selecting the mode for each DN based on the particular context conditions. The results obtained show that BRISK-R guarantees throughput levels equal to or higher than the throughput levels achieved by the SH mode for all DNs and is able to more closely approximate the optimum solution in all UE densities than MH and DMS. These results demonstrate the high flexibility and better capability of BRISK-R to adapt to the context conditions.
To explain the differences between BRISK-R and the optimum scheme, Figure 8 represents the percentage of transmissions for which these schemes select the MH mode as a function of the distance between BS and DN. The results obtained show that this percentage increases for both schemes as the UE density is augmented. The results obtained show that BRISK-R is in general more conservative than the optimum scheme. This is especially the case for medium and high UE densities, where the optimum scheme nearly always establishes MH connections. For low UE densities (15 RN and 50 RN), BRISK-R is still more conservative than the optimum scheme at distances to the BS lower than 250 m. However, at distances larger than 250 m the optimum scheme more often selects the SH mode BRISK-R, which results in the different throughput gains observed in Figure 7.
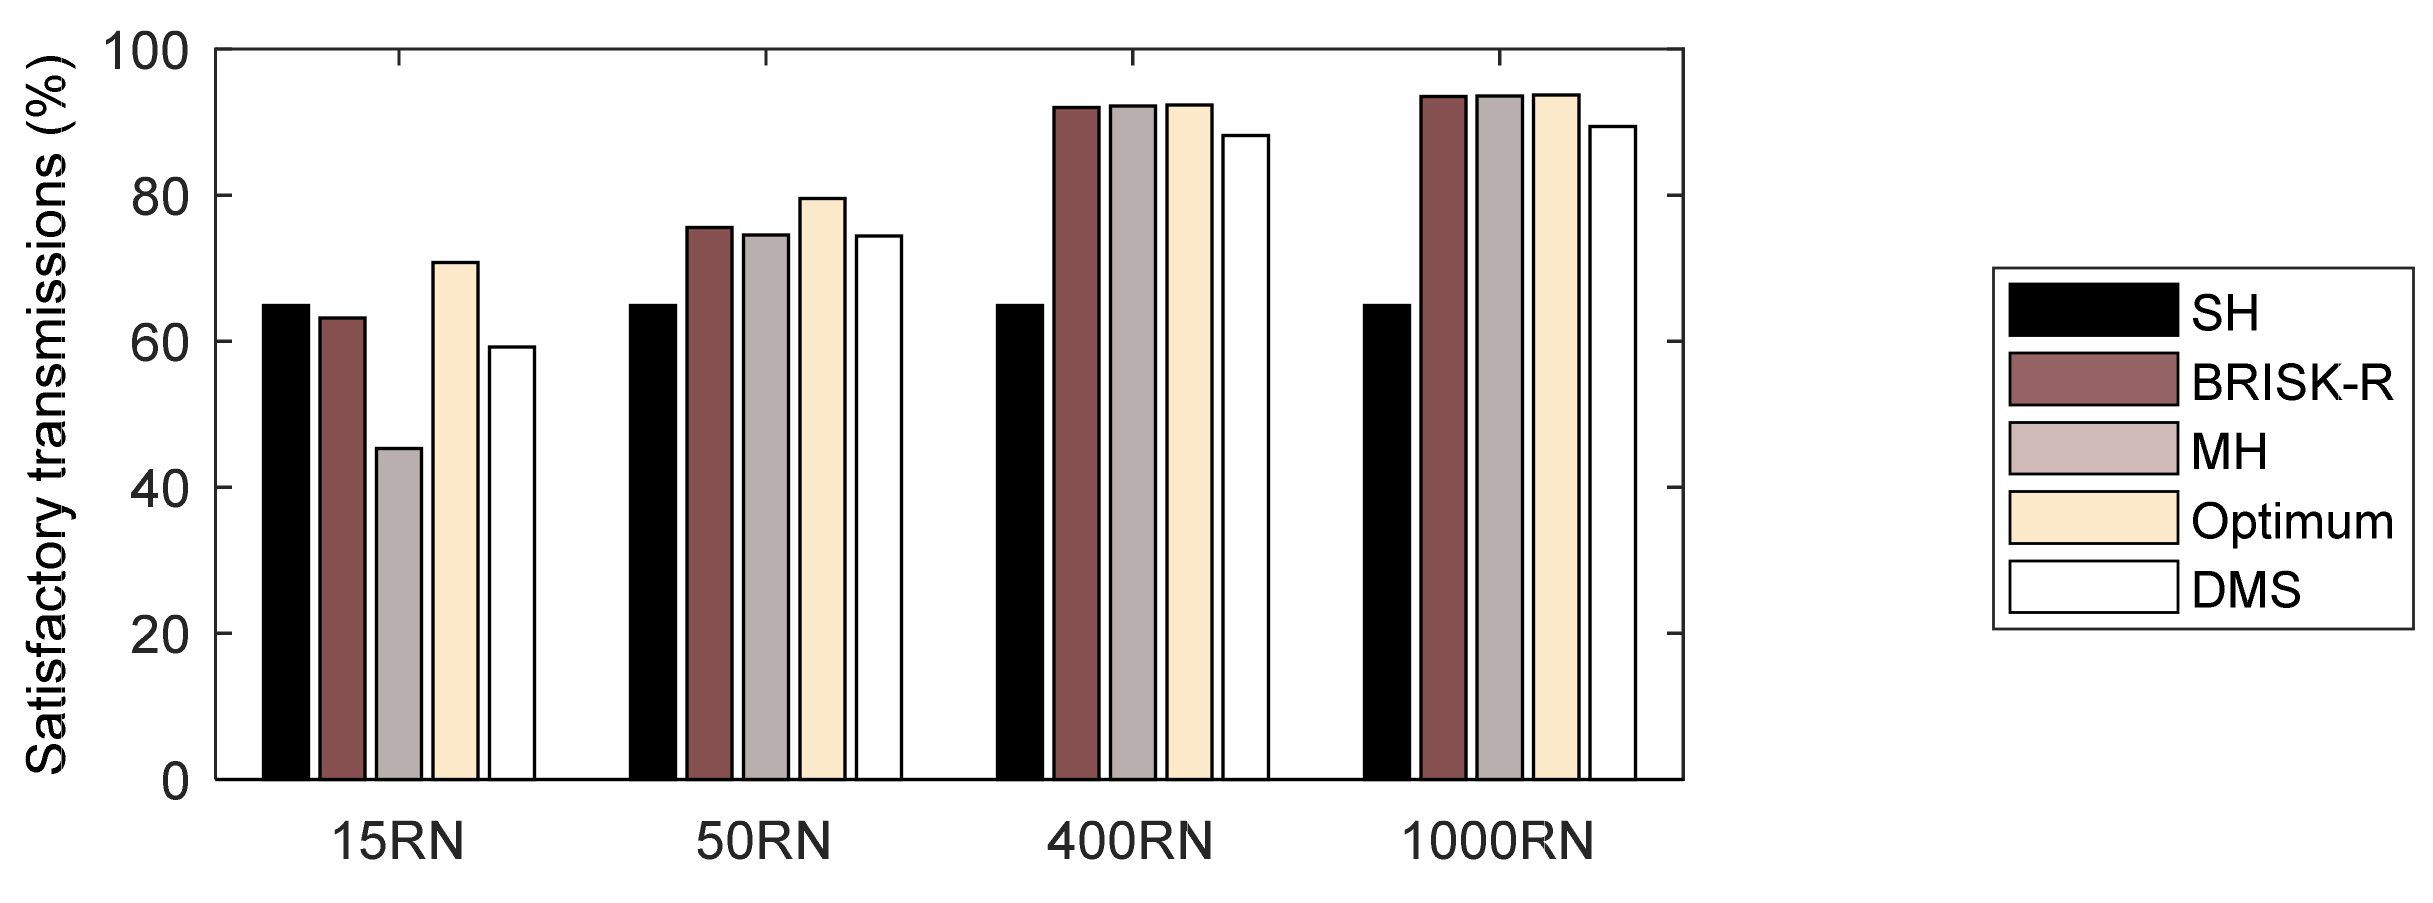
To show the benefits of the proposed mode selection scheme at the application level, Figure 9 depicts the percentage of satisfactory transmissions for the different schemes evaluated, considering web traffic and the homogeneous scenario. The transmission of a web page is considered satisfactory in this study if it is done in less than 4 seconds, following 3GPP TS 22.105. As it can be observed, the best results are always achieved by the optimum scheme. The results obtained show that at medium and high densities (400 RN and 1000 RN), MH and BRISK-R are able to achieve the same performance than the optimum solution, which is reasonable given the results shown in Figure 7b. In these two scenarios, the performance achieved with DMS is lower, and the SH scheme achieves the worst performance (as previously explained, the performance of SH does not depend on the density). For the 50 RN scenario, BRISK-R outperforms MH, DMS and SH. For the lowest density scenario (15 RN), MH is significantly degraded (as already observed in Figure 7a) and BRISK-R again outperforms MH, and DMS. In this scenario, the percentage of satisfactory transmissions of DMS is degraded compared to SH despite achieving a throughput gain higher or equal than SH (see Figure 7a). This effect is produced due to a higher throughput variability observed with DMS that results in that a higher number of DNs cannot satisfactorily access to a web page.
6.2. Homogeneous Scenario with Mixed Multimedia Traffic
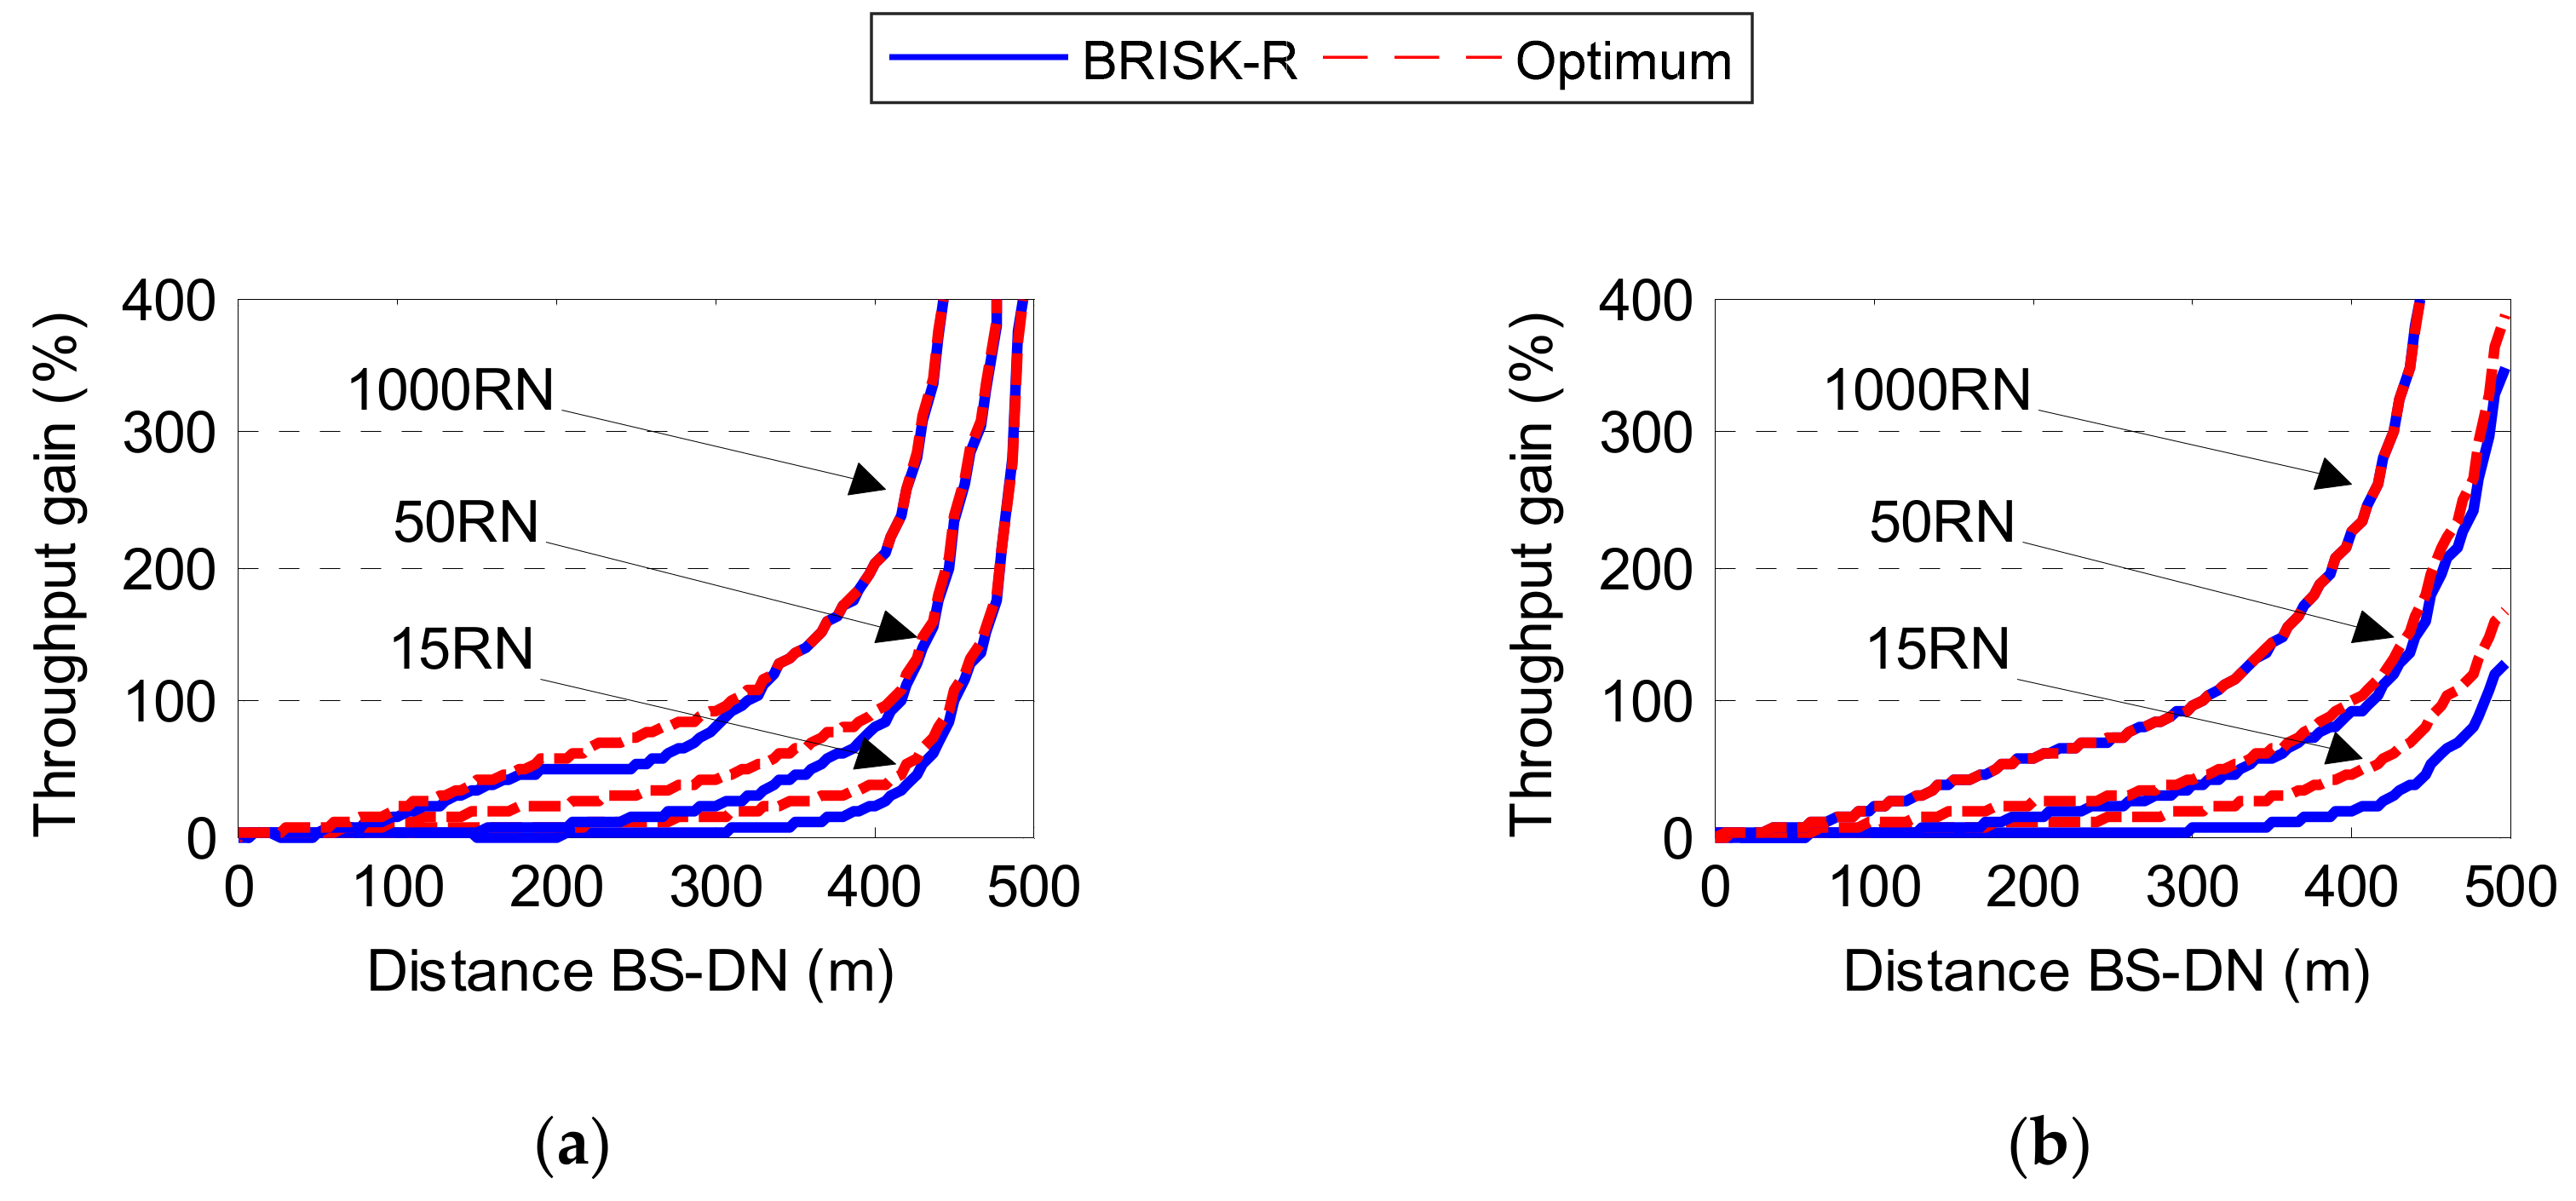
To demonstrate that the superior performance achieved by BRISK-R does not depend on the type of traffic demanded by the UEs, we have evaluated it considering different multimedia traffic. To this aim, the different mode selection schemes are evaluated in this section considering UEs demanding email services, in addition to web traffic. Figure 10 shows the throughput gain achieved with all schemes with respect to SH, differentiating the transmissions for email and web traffic, for the lowest and the highest UE densities in the homogeneous scenario. DMS has been omitted in this case for clarity, since is offers the worst performance, as it was shown in the previous section. The results in Figure 10 demonstrate that the same trends are obtained for the different traffic types considered, compared with the scenario where only web traffic was considered (analyzed in the previous section). Figure 10 shows that BRISK-R is able to always guarantee throughput levels equal to or higher than those obtained with the SH mode for all DNs demanding email or web traffic. The throughput gains achieved with BRISK-R increases with the RN density. These results also show that always selecting the MH mode is not adequate when the density of nodes is low since there is a high risk of not finding adequate RNs. Always selecting the MH mode finally degrades the throughput experienced by the DN for both email and web traffic (as already presented in Section 6.1). These results demonstrate again the higher capability of BRISK-R to adapt to the context conditions compared to the reference techniques, since it is able to more closely approximate to the optimum solution under high and low densities, considering a mix of multimedia traffic.
To further demonstrate the potential of BRISK to support mixed multimedia traffic from the application perspective, Figure 11 plots the percentage of satisfactory transmissions for both email and web traffic, all UE densities and all the mode selection schemes (except DMS, as it provides the worst performance) in the homogeneous scenario. As it can be observed, the best performance is achieved with the optimum scheme for both types of traffic. BRISK-R is able to more closely approximate to the optimum scheme in all the scenarios, since the performance of MH is significantly degraded under low UE densities. These results show that BRISK-R is able to approximate to the optimum solution from the application perspective thanks to consider both the benefits and risks of each communication mode based on the particular context conditions to calculate the expected performance that each mode can achieve.
6.3. Circularly Symmetric Scenario with Web Traffic
To compare BRISK with the other reference schemes in a scenario where the UEs are not uniformly distributed, Figure 12 shows the throughput gain with respect to SH in the circularly symmetric scenario considering web traffic. DMS is omitted again because it provides the worst performance. It only considers web traffic, but the same trends have been observed when introducing mixed multimedia traffic. In the circularly symmetric scenario (Figure 12), the throughput levels achieved by the different schemes evaluated are in general higher than in the homogeneous scenario (Figure 7), especially for low UE density. This is particularly relevant for DNs located at distances between 100–400 m from the BS with BRISK-R and MH. This is the case because UEs (potential RNs) tend to concentrate close to the BS, and it is therefore more likely that an adequate MH connection can be established that outperforms the SH. BRISK-R selects the MH mode for more DNs located at distances between 100–400 m from the BS since the risk of the MH mode is lower than when nodes are homogeneously distributed in the cell. This results in higher throughput gains shown in Figure 12a compared with Figure 7a. The scheme that always selects the MH mode for all DNs (shown as MH in the figures) still decreases the throughput experienced for DNs located close to the BS since it does not consider the benefits and risks of the different communication modes in the mode selection process. Figure 12a shows that the performance of BRISK-R and MH is lower than the performance achieved with the optimum scheme in the low UE density scenario. MH slightly outperforms BRISK-R at medium distances to the BS, but its performance significantly decreases at low distances, where it obtains a lower performance than the SH mode. Figure 12 shows that, under high density scenarios, BRISK-R and MH can approximate to the throughput levels achieved by the optimum scheme, thanks to the high probability of being able to find an RN to establish an MH connection. BRISK-R is able to outperform the SH mode in all the scenarios, and more closely approximates to the optimum scheme.
6.4. Context Information
BRISK is a context-aware mode selection scheme whose performance can be improved if the accuracy of the context information used as input is increased. The previous results have demonstrated the performance of BRISK-R which estimates the benefits and risks of each MH connection considering the average UE density in certain QoS rings, ρring. The accuracy of this estimation decreases with BRISK-C, which makes use of the average UE density in the overall cell, ρcell. This effect can be observed in Figure 13 for the homogeneous and circularly symmetric scenarios. This figure shows the RiskMH estimated by BRISK-R and BRISK-C, and the real one measured in the simulation. As it can be observed, the risks are better estimated with ρring than with ρcell, because it more accurately represents the local context of the DN requesting the service. The risk estimated with ρcell is the same in both scenarios (15 RN and 50 RN), despite the high difference in the UE distribution.
Using more accurate context information, i.e., ρring, BRISK is able to better estimate the context conditions. As a consequence, BRISK-R outperforms BRISK-C, as it can be observed in Figure 14. This figure shows the throughput gain obtained by BRISK-R with respect to BRISK-C for the circularly symmetric scenario with web traffic. The results obtained show that the throughput gains are always positive and can easily reach values around 5–15%.
Under non-symmetric scenarios, the context information used by BRISK can be improved to estimate the UE density for each sector in the cell. In this type of scenario, ρcell and ρring might not be sufficient to accurately estimate the benefits and risks of the MH connection. Using ρsector, BRISK can better estimate the RiskMH in non-symmetric scenarios, as illustrated in Figure 15, considering a cell with 3 sectors of 120° (S1, S2, and S3), where sector S1 contains the attraction area described in Section 4.1. This figure shows that BRISK-S is able to better approximate to the real risk measured in the simulation than BRISK-R and BRISK-C. Both BRISK-R and BRISK-C estimate the same risk in all the three sectors. However, the risk of establishing a MH connection is lower in S1 due to the presence of the attraction zone. BRISK-C does not properly adapt to the UE density variation as a function of the distance between the BS and DN. BRISK-R is able to better perform this adaptation but does not differentiate between sectors. The best result is achieved by BRISK-S thanks to a more accurate use of context information. As a consequence, BRISK-S is able to perform better mode selection decisions and obtain a higher throughput, as it can be observed in Figure 16.
6.5. Impact of the RRM Scheme
Finally, BRISK has been evaluated using different RRM algorithms to demonstrate that the same trends and the benefits are maintained. Figure 17 compares the throughput gain with respect to SH achieved by BRISK-R and the optimum scheme for two different RRM algorithms (MAXIHU and MinP), for different UE densities in the homogeneous scenario considering web traffic. As it can be observed, BRISK-R is able to guarantee at least the same performance than SH with both RRM algorithms. It provides higher gains for DNs located at larger distances to the BS. As the UE density increases, the throughput gains achieved by BRISK-R approximate to those achieved with the optimum scheme. The same trends and conclusions are obtained for MAXIHU and MinP. The differences between the two RRM schemes are produced due to their different methods to assign radio resources, which affect the benefits that each DN can be achieved with the SH and MH modes, and therefore the mode selection performed by BRISK. However, the performance achieved by BRISK can be considered nearly independent of the RRM algorithm.
7. Conclusions
This paper has proposed and evaluated a mode selection scheme for 5G multi-hop cellular networks based on UE-related context information. The proposed scheme selects the most adequate connection mode considering the benefits and risks of establishing SH and MH connections. The benefits and risks of each connection mode are estimated based on information about the density of UEs and the distance between BS and the DN. By considering the benefits and risks of selecting each connection mode, the proposed mode selection scheme is able to select the MH mode when UE context conditions are adequate to achieve better performance than traditional SH links. The obtained results have shown that the proposed mode selection scheme is able to achieve the expected benefits offered by MCN. The proposed mode selection scheme significantly improves the throughput levels experienced by UEs when compared with traditional cellular systems, especially for UEs at the cell edge in scenarios with medium or high UE densities. In addition, it is capable to approximate to the performance achieved by an ideal mode selection scheme. The conducted study has demonstrated the importance of considering accurate UE context information in the decision process to maximize the benefit of the system and has also shown the capability of the proposed scheme to adapt its mode selection decision to different and varying operating conditions within the cell.
Author Contributions
Conceptualization, M.C.L.-E. and J.G.; Formal analysis, M.C.L.-E.; Funding acquisition, J.G. and M.S.; Investigation, M.C.L.-E. and J.G.; Methodology, M.C.L.-E. and J.G.; Software, M.C.L.-E.; Supervision, J.G. and M.S.; Validation, M.C.L.-E.; Writing—original draft, M.C.L.-E.; Writing—review & editing, M.S. and J.G.
Funding
This work was supported by the Spanish Ministry of Economy, Industry, and Competitiveness, AEI, and FEDER funds (TEC2017-88612-R, TEC2014-57146-R) and the Generalitat Valenciana (GV/2016/049).
Conflicts of Interest
The authors declare no conflict of interest.
References
- Akpakwu, G.A.; Bruno, J.S.; Gerhard, P.H.; Adnan, M.A. A Survey on 5G Networks for the Internet of Things: Communication Technologies and Challenges. IEEE Access 2018, 6, 3619–3647. [Google Scholar] [CrossRef]
- Najm, I.A.; Hamoud, A.K.; Lloret, J.; Bosch, I. Machine Learning Prediction Approach to Enhance Congestion Control in 5G IoT Environment. Electronics 2019, 8, 607. [Google Scholar] [CrossRef]
- Lucas-Estañ, M.C.; Sepulcre, M.; Raptis, T.P.; Passarella, A.; Conti, M. Emerging Trends in Hybrid Wireless Communication and Data Management for the Industry 4.0. Electronics 2018, 7, 400. [Google Scholar] [CrossRef]
- Ren, Y.; Liu, F.; Liu, Z.; Wang, C.; Ji, Y. Power Control in D2D-Based Vehicular Communication Networks. IEEE Trans. Veh. Technol. 2015, 64, 5547–5562. [Google Scholar] [CrossRef]
- Coll-Perales, B.; Golzalves, J.; Maestre, J. 5G and Beyond: Smart Devices as Part of the Network Fabric. IEEE Netw. 2019, 1–8. [Google Scholar] [CrossRef]
- Li, H.; Dong, K.O.M. ECCN: Orchestration of Edge Centric Computing and Content Centric Networking in 5G Radio Access Network. IEEE Wirel. Commun. Mag. 2018, 25, 88–93. [Google Scholar] [CrossRef]
- NetWorld2020. Smart Networks in the context of NGI—Strategic Research and Innovation Agenda 2021–2027. Available online: https://www.networld2020.eu/wp-content/uploads/2018/11/networld2020-5gia-sria-version-2.0.pdf (accessed on 1 June 2019).
- Boccardi, F.; Heath, R.W.; Lozano, A.; Marzetta, T.L.; Popovski, P. Five disruptive technology directions for 5G. IEEE Commun. Mag. 2014, 52, 74–80. [Google Scholar] [CrossRef] [Green Version]
- 3GPP SP-180785. New SID On Enhanced Relays For Energy Efficiency And Extensive Coverage Tsg-Sa Meeting. Available online: https://portal.3gpp.org/ngppapp/CreateTdoc.aspx?mode=view&contributionUid=SP-180785 (accessed on 1 June 2019).
- Cisco Visual Networking Index: Global Mobile Data Traffic Forecast Update, 2017–2022. February 2019. Available online: https://www.cisco.com/c/en/us/solutions/collateral/service-provider/visual-networking-index-vni/white-paper-c11-738429.html (accessed on 1 June 2019).
- Dun, H.; Ye, F.; Jiao, S.; Liu, D. Power Control for Device-to-Device Communication with a Hybrid Relay Mode in Unequal Transmission Slots. Electronics 2018, 7, 17. [Google Scholar] [CrossRef]
- Jameel, F.; Hamid, Z.; Zeadali, S.; Jabeen, F. A Survey of Device-to-Device Communications: Research Issues and Challenges. IEEE Commun. Surv. Tutor. 2018, 20, 2133–2168. [Google Scholar] [CrossRef]
- 3GPP TR 36.746 v15.1.0. Study on Further Enhancements to LTE Device to Device (D2D), UE to Network Relays for Internet of Things (IoT) and Wearables. Available online: https://portal.3gpp.org/desktopmodules/Specifications/SpecificationDetails.aspx?specificationId=3110 (accessed on 1 June 2019).
- Nishiyama, H.; Ito, M.; Kato, N. Relay-by-Smartphone: Realizing Multihop Device-to-Device Communications. IEEE Commun. Mag. 2014, 52, 56–65. [Google Scholar] [CrossRef]
- Ali, A.; Shah, G.A.; Arshad, J. Energy Efficient Resource Allocation for M2M Devices in 5G. Sensors 2019, 19, 1830. [Google Scholar] [CrossRef] [PubMed]
- 3GPP TR 36.877. LTE Device to Device (D2D) Proximity Services (ProSe); User Equipment (UE) radio transmission and reception (Release 12). Available online: https://portal.3gpp.org/desktopmodules/Specifications/SpecificationDetails.aspx?specificationId=2576 (accessed on 1 June 2019).
- Wang, J.; Song, M.; Zhan, X.; Man, Y. An Adaptive Mode Select Mechanism between Multi-hop and Cellular Networks. In Proceedings of the 3rd International Conference on Pervasive Computing and Applications (ICPCA), Alexandria, Egypt, 6–8 October 2008; pp. 812–815. [Google Scholar] [CrossRef]
- Xu, Y.; Wang, S. Mode Selection for Energy Efficient Content Delivery in Cellular Networks. IEEE Commun. Lett. 2016, 20, 728–731. [Google Scholar] [CrossRef]
- Liu, Z.; Ji, Y. Intercell Interference Coordination under Data Rate Requirement Constraint in LTE-Advanced Heterogeneous Networks. In Proceedings of the IEEE 79th Vehicular Technology Conference (VTC Spring), Seoul, Korea, 18–21 May 2014; pp. 1–5. [Google Scholar]
- Liu, Y. Optimal Mode Selection in D2D-Enabled Multibase Station Systems. IEEE Commun. Lett. 2016, 20, 470–473. [Google Scholar] [CrossRef] [Green Version]
- Li, J.; Lei, G.; Manogaran, G.; Mastorakis, G.; Mavromoustakis, C.X. D2D Communication Mode Selection and Resource Optimization Algorithm With Optimal Throughput in 5G Network. IEEE Access 2019, 7, 25263–25273. [Google Scholar] [CrossRef]
- Shah, S.W.H.; Rahman, M.M.U.; Mian, A.N.; Imran, A.; Mumtaz, S.; Dobre, O.A. On the Impact of Mode Selection on Effective Capacity of Device-to-Device Communication. IEEE Wirel. Commun. Lett. 2019, 8, 945–948. [Google Scholar] [CrossRef]
- Shaikh, F.S.; Wismüller, R. Routing in Multi-Hop Cellular Device-to-Device (D2D) Networks: A Survey. IEEE Commun. Surv. Tutor. 2018, 20, 2622–2657. [Google Scholar] [CrossRef]
- Lee, J.; Wang, H.; Seo, W.; Hong, D. QoS-guaranteed Transmission Mode Selection for Efficient Resource Utilization in Multi-hop Cellular Networks. IEEE Trans. Wirel. Commun. 2008, 7, 3697–3701. [Google Scholar] [CrossRef]
- Zhang, H.; Hong, P.; Xue, K. Mobile-based Relay Selection Schemes for Multi-hop Cellular Networks. J. Commun. Netw. 2013, 15, 45–53. [Google Scholar] [CrossRef]
- Wang, J.; Xu, X.; Tang, X.; Zhang, S.; Tao, X. Analytical Modeling of Mode Selection for UE-To-Network Relay Enabled Cellular Networks with Power Control. In Proceedings of the IEEE International Conference on Communications Workshops (ICC Workshops), Kansas City, MO, USA, 20–24 May 2018; pp. 1–6. [Google Scholar] [CrossRef]
- Xu, X.; Wang, J.; Tao, X. Analytical Modeling for Caching Enabled UE-to-Network Relay in Cellular Networks. IEEE Access 2018, 6, 51061–51068. [Google Scholar] [CrossRef]
- Li, Y.; Song, C.; Chen, D.J.S. A Dynamic Graph Optimization Framework for Multihop Device-to-Device Communication Underlaying Cellular Networks. IEEE Wirel. Commun. 2014, 21, 52–61. [Google Scholar] [CrossRef]
- Mukherjee, S.; Avidor, D.; Hartman, K. Connectivity, Power, and Energy in a Multihop Cellular-Packet System. IEEE Trans. Veh. Technol. 2007, 56, 818–836. [Google Scholar] [CrossRef]
- Lucas-Estañ, M.C.; Gozalvez, J. On the Real-Time Hardware Implementation Feasibility of Joint Radio Resource Management Policies for Heterogeneous Wireless Networks. IEEE Trans. Mob. Comput. 2013, 12, 193–205. [Google Scholar] [CrossRef]
- Coll-Perales, B.; Perales, C.B.; Soriano, S.J. Empirical Performance Models for P2P and Two Hops Multi-hop Cellular Networks with Mobile Relays. In Proceedings of the 8th ACM Performance Monitoring, Measurement and Evaluation of Heterogeneous Wireless and Wired Networks Workshop (PM2HW2N), Barcelona, Spain, 3–8 November 2013. [Google Scholar] [CrossRef]
- Gong, Z.; Haenggi, M. Interference and Outage in Mobile Random Networks: Expectation, Distribution, and Correlation. IEEE Trans. Mob. Comput. 2014, 13, 337–349. [Google Scholar] [CrossRef]
- Bettstetter, C. Topology properties of Ad hoc networks with random waypoint mobility. ACM SIGMOBILE Mobile Comput. Commun. Rev. 2003, 7, 50–52. [Google Scholar] [CrossRef]
- 3GPP, Technical Specification Group Radio Access Network. Study on LTE Device to Device Proximity Services; Radio Aspects, 3GPP TR 36.843, Version 12.0.1. 2014. Available online: https://portal.3gpp.org/desktopmodules/Specifications/SpecificationDetails.aspx?specificationId=2544 (accessed on 1 June 2019).
- 3GPP, Technical Specification Group Radio Access Network. Evolved Universal Terrestrial Radio Access (E-UTRA); Physical Layer Procedures, 3GPP TS 36.213, v11.1.0. 2012. Available online: https://portal.3gpp.org/desktopmodules/Specifications/SpecificationDetails.aspx?specificationId=2427 (accessed on 1 June 2019).
- Nain, P.; Towsley, D.; Liu, B.; Liu, Z. Properties of random direction models. In Proceedings of the IEEE 24th Annual Joint Conference of the IEEE Computer and Communications Societies (INFOCOM), Miami, FL, USA, 13–17 March 2005; pp. 1897–1907. [Google Scholar] [CrossRef]
- Pries, R.; Magyari, Z.; Tran-Gia, P. An HTTP Web Traffic Model Based on the Top One Million Visited Web Pages. In Proceedings of the 8th EURO-NGI Conference on Next Generation Internet (NGI), Karlskrona, Sweden, 25–27 June 2012; pp. 133–139. [Google Scholar] [CrossRef]
- IEEE 802.16. Broadband Wireless Access Working Group. IEEE 802.16m Evaluation Methodology Document (EMD); IEEE: Hoboken, NJ, USA, 2008. [Google Scholar]
- Ahmed, M.H. Call admission control in wireless networks: a comprehensive survey. IEEE Commun. Surv. Tutor. 2005, 7, 49–68. [Google Scholar] [CrossRef]
Figure 1.
Single Hop (SH) and Multi-Hop (MH) modes in a 2-hop Multi-hop Cellular Network (MCN) scenario.
Figure 1.
Single Hop (SH) and Multi-Hop (MH) modes in a 2-hop Multi-hop Cellular Network (MCN) scenario.
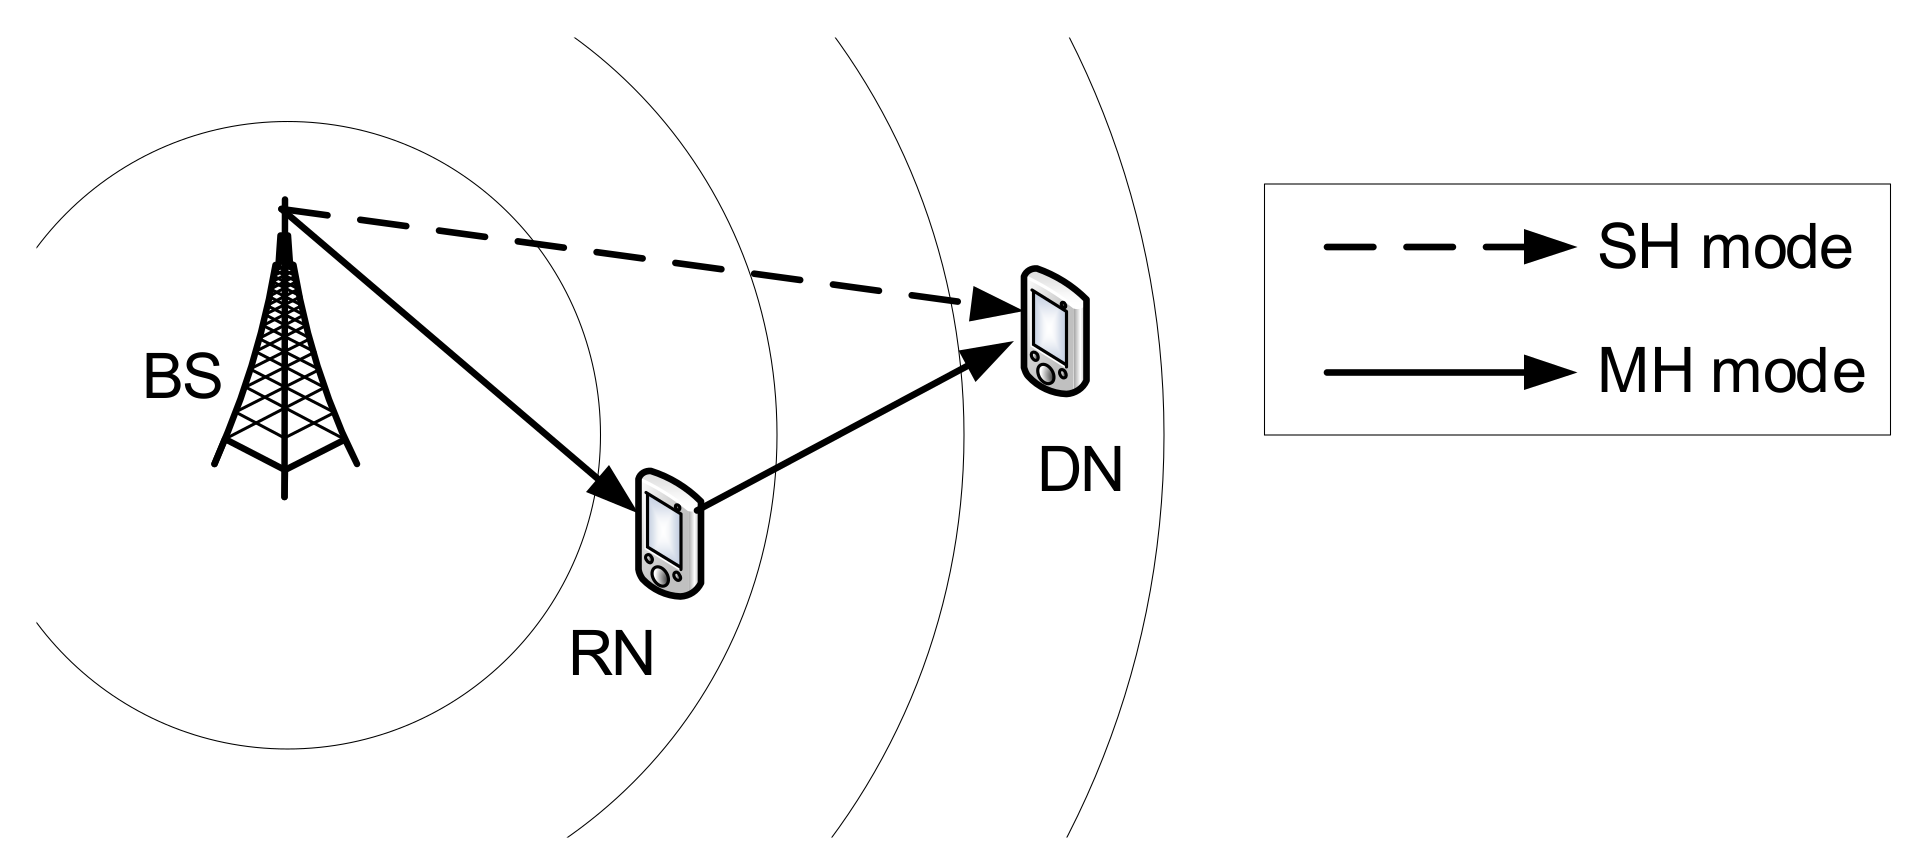
Figure 2.
Two-hop MH throughput level experienced by the destination node (DN) as a function of the distance between the DN and the relay node (RN) [31].
Figure 2.
Two-hop MH throughput level experienced by the destination node (DN) as a function of the distance between the DN and the relay node (RN) [31].

Figure 3.
Areas where an MH connection can provide a better performance than an SH connection.

Figure 4.
UE distribution as a function of the distance to the base station (BS) in different evaluation scenarios: (a) Circularly symmetric scenario; (b) Non-symmetric scenario.
Figure 4.
UE distribution as a function of the distance to the base station (BS) in different evaluation scenarios: (a) Circularly symmetric scenario; (b) Non-symmetric scenario.

Figure 5.
Throughput achieved by the DMS scheme as a function of the distance between DN and BS and dref: (a) 50 RN scenario; (b) 400 RN scenario.
Figure 5.
Throughput achieved by the DMS scheme as a function of the distance between DN and BS and dref: (a) 50 RN scenario; (b) 400 RN scenario.
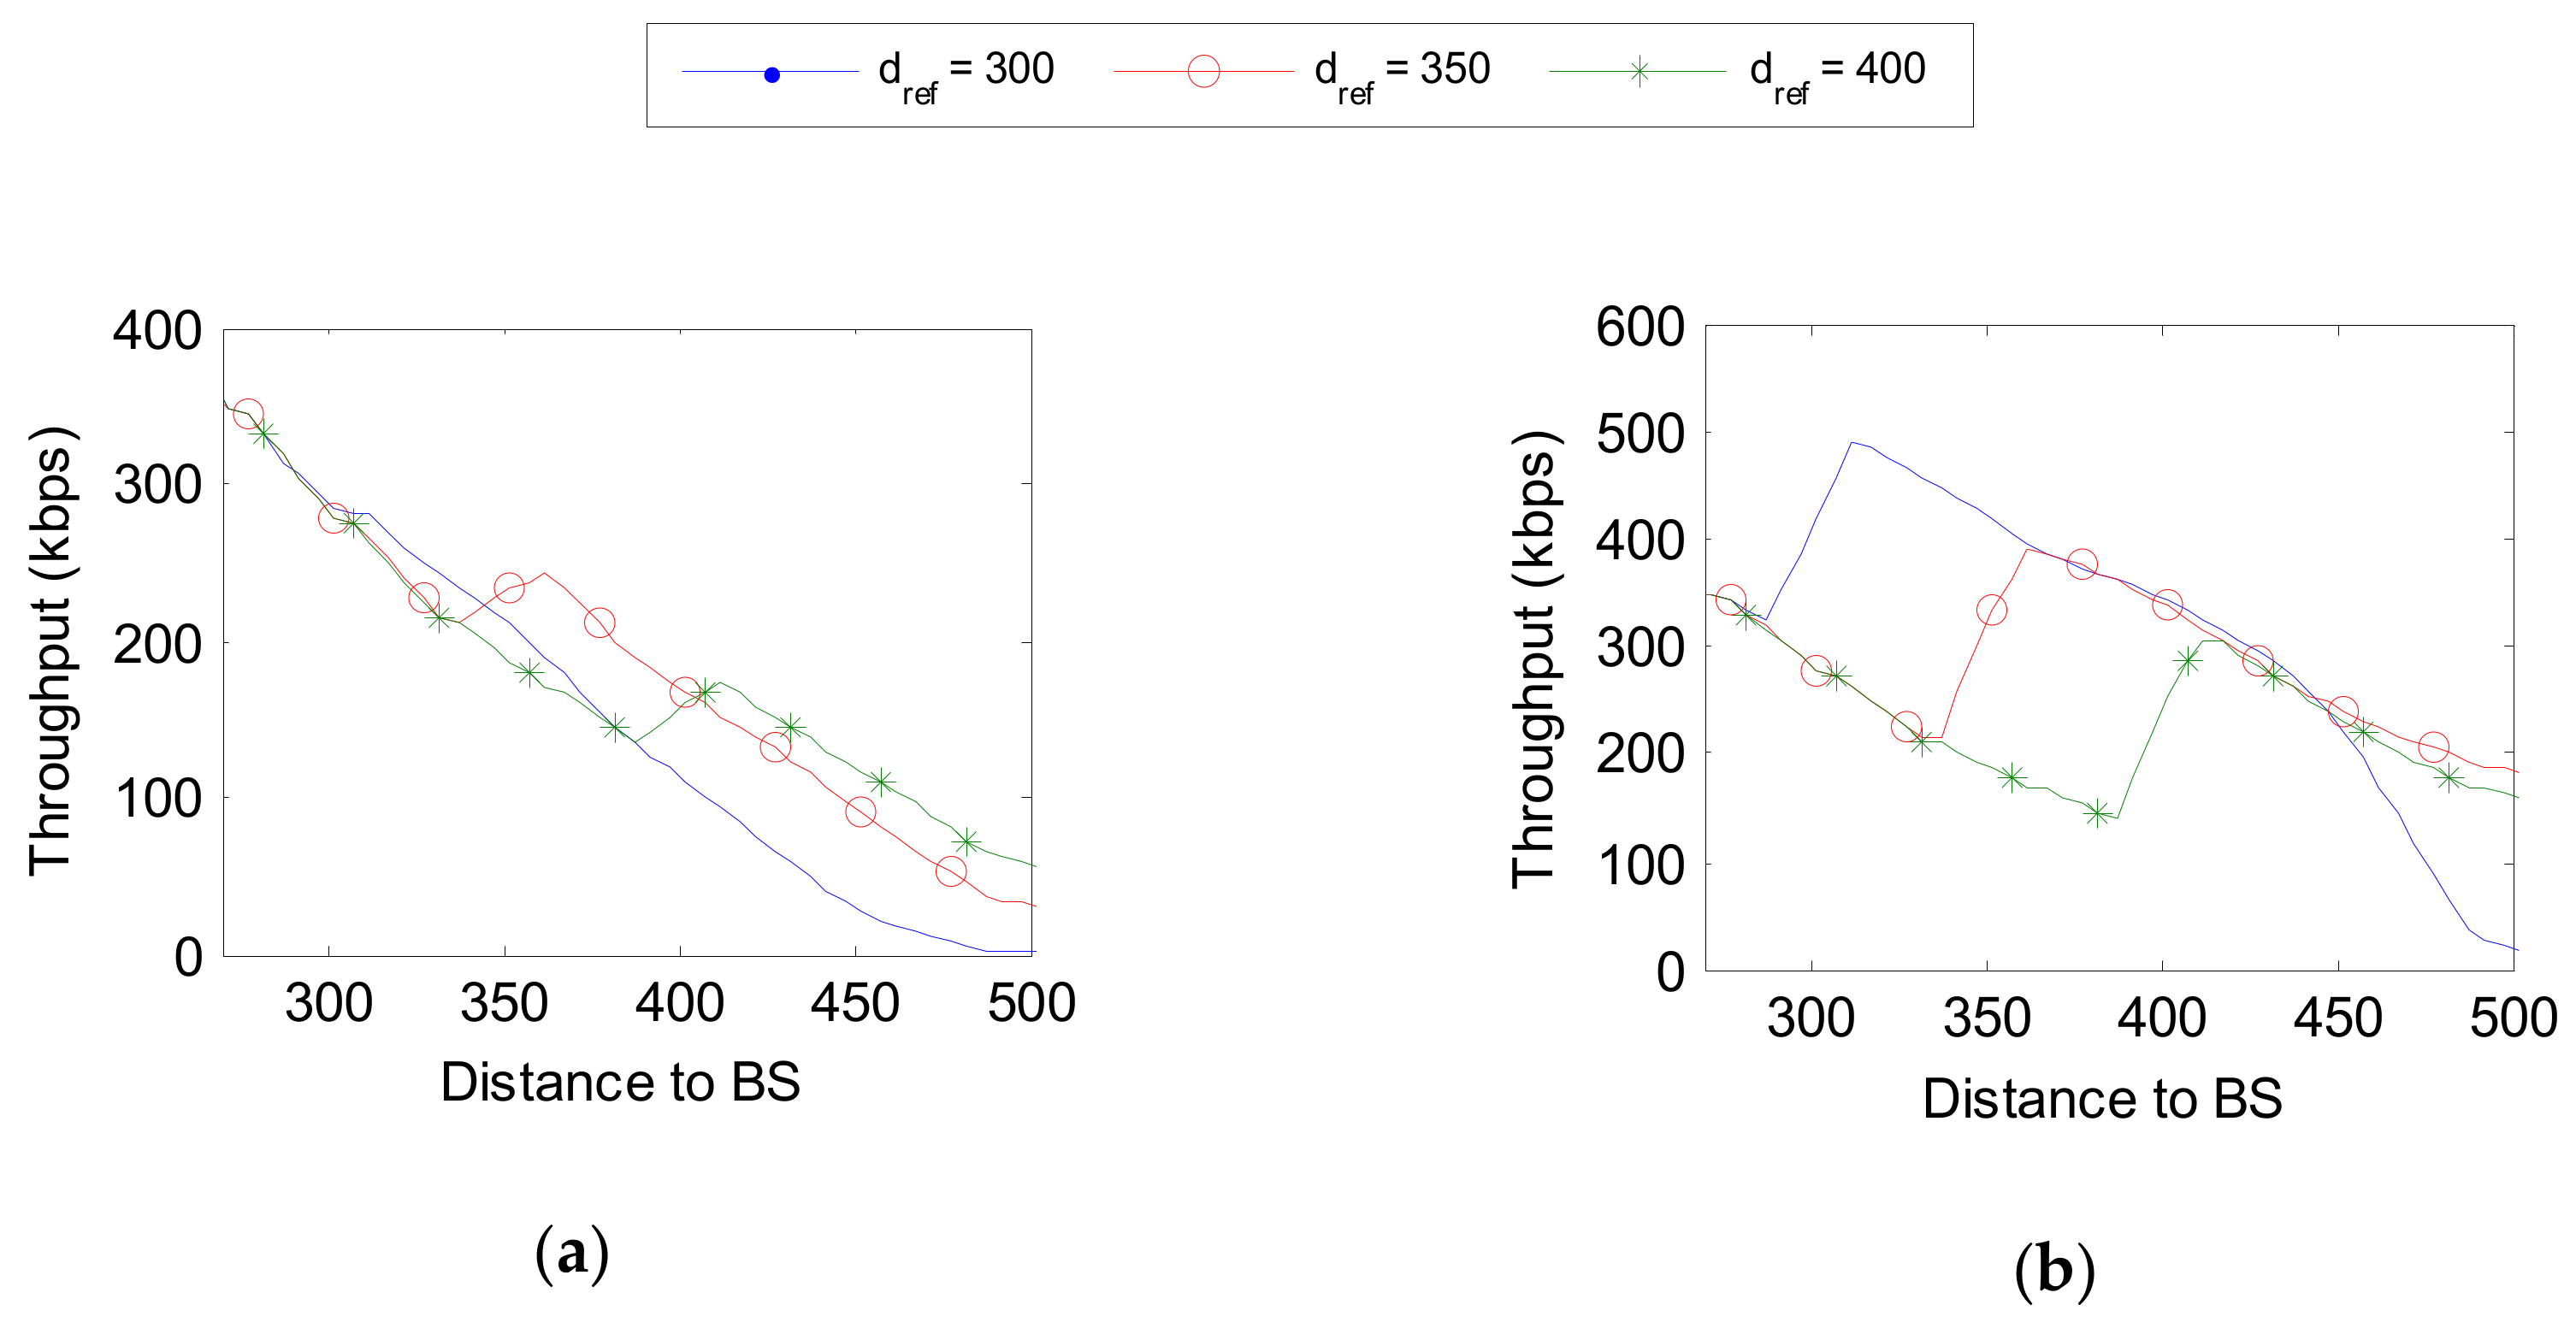
Figure 6.
Throughput comparison (for different UE densities) as a function of the distance between DN and BS—web traffic & homogeneous scenario.
Figure 6.
Throughput comparison (for different UE densities) as a function of the distance between DN and BS—web traffic & homogeneous scenario.

Figure 7.
Throughput gain obtained with the mode selection schemes with respect to SH—web traffic & homogeneous scenario. (a) 15 RN scenario; (b) 1000 RN scenario.
Figure 7.
Throughput gain obtained with the mode selection schemes with respect to SH—web traffic & homogeneous scenario. (a) 15 RN scenario; (b) 1000 RN scenario.

Figure 8.
Percentage of transmissions for which the mode selection scheme selects MH—web traffic & homogeneous scenario.
Figure 8.
Percentage of transmissions for which the mode selection scheme selects MH—web traffic & homogeneous scenario.
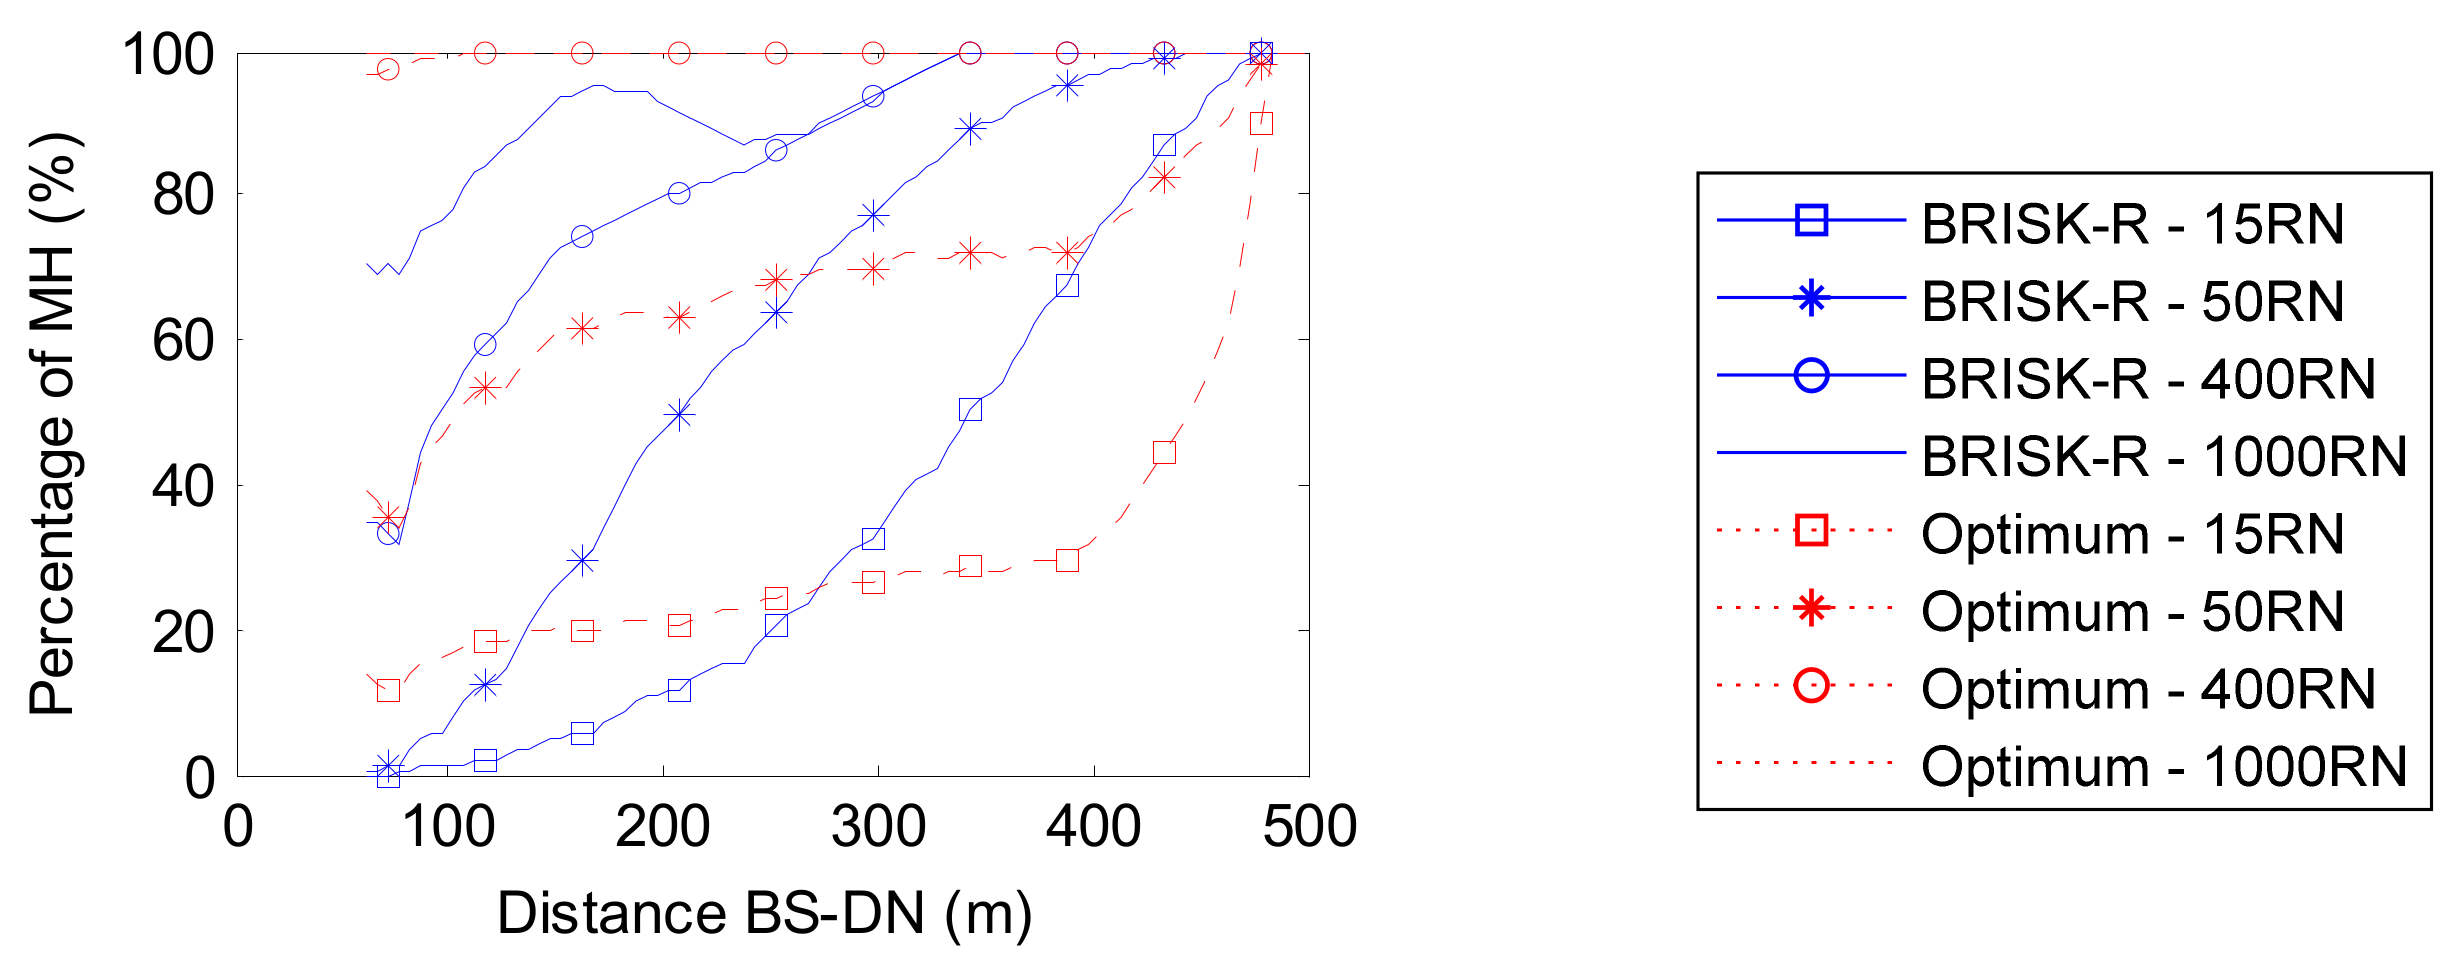
Figure 9.
Percentage of satisfactory transmissions—web traffic & homogeneous scenario.

Figure 10.
Throughput gain obtained with the mode selection schemes with respect to SH—mixed multimedia traffic & homogeneous scenario. (a) Email transmissions—15 RN; (b) Web transmissions—15 RN; (c) Email transmissions—1000 RN; (d) Web transmissions—1000 RN.
Figure 10.
Throughput gain obtained with the mode selection schemes with respect to SH—mixed multimedia traffic & homogeneous scenario. (a) Email transmissions—15 RN; (b) Web transmissions—15 RN; (c) Email transmissions—1000 RN; (d) Web transmissions—1000 RN.
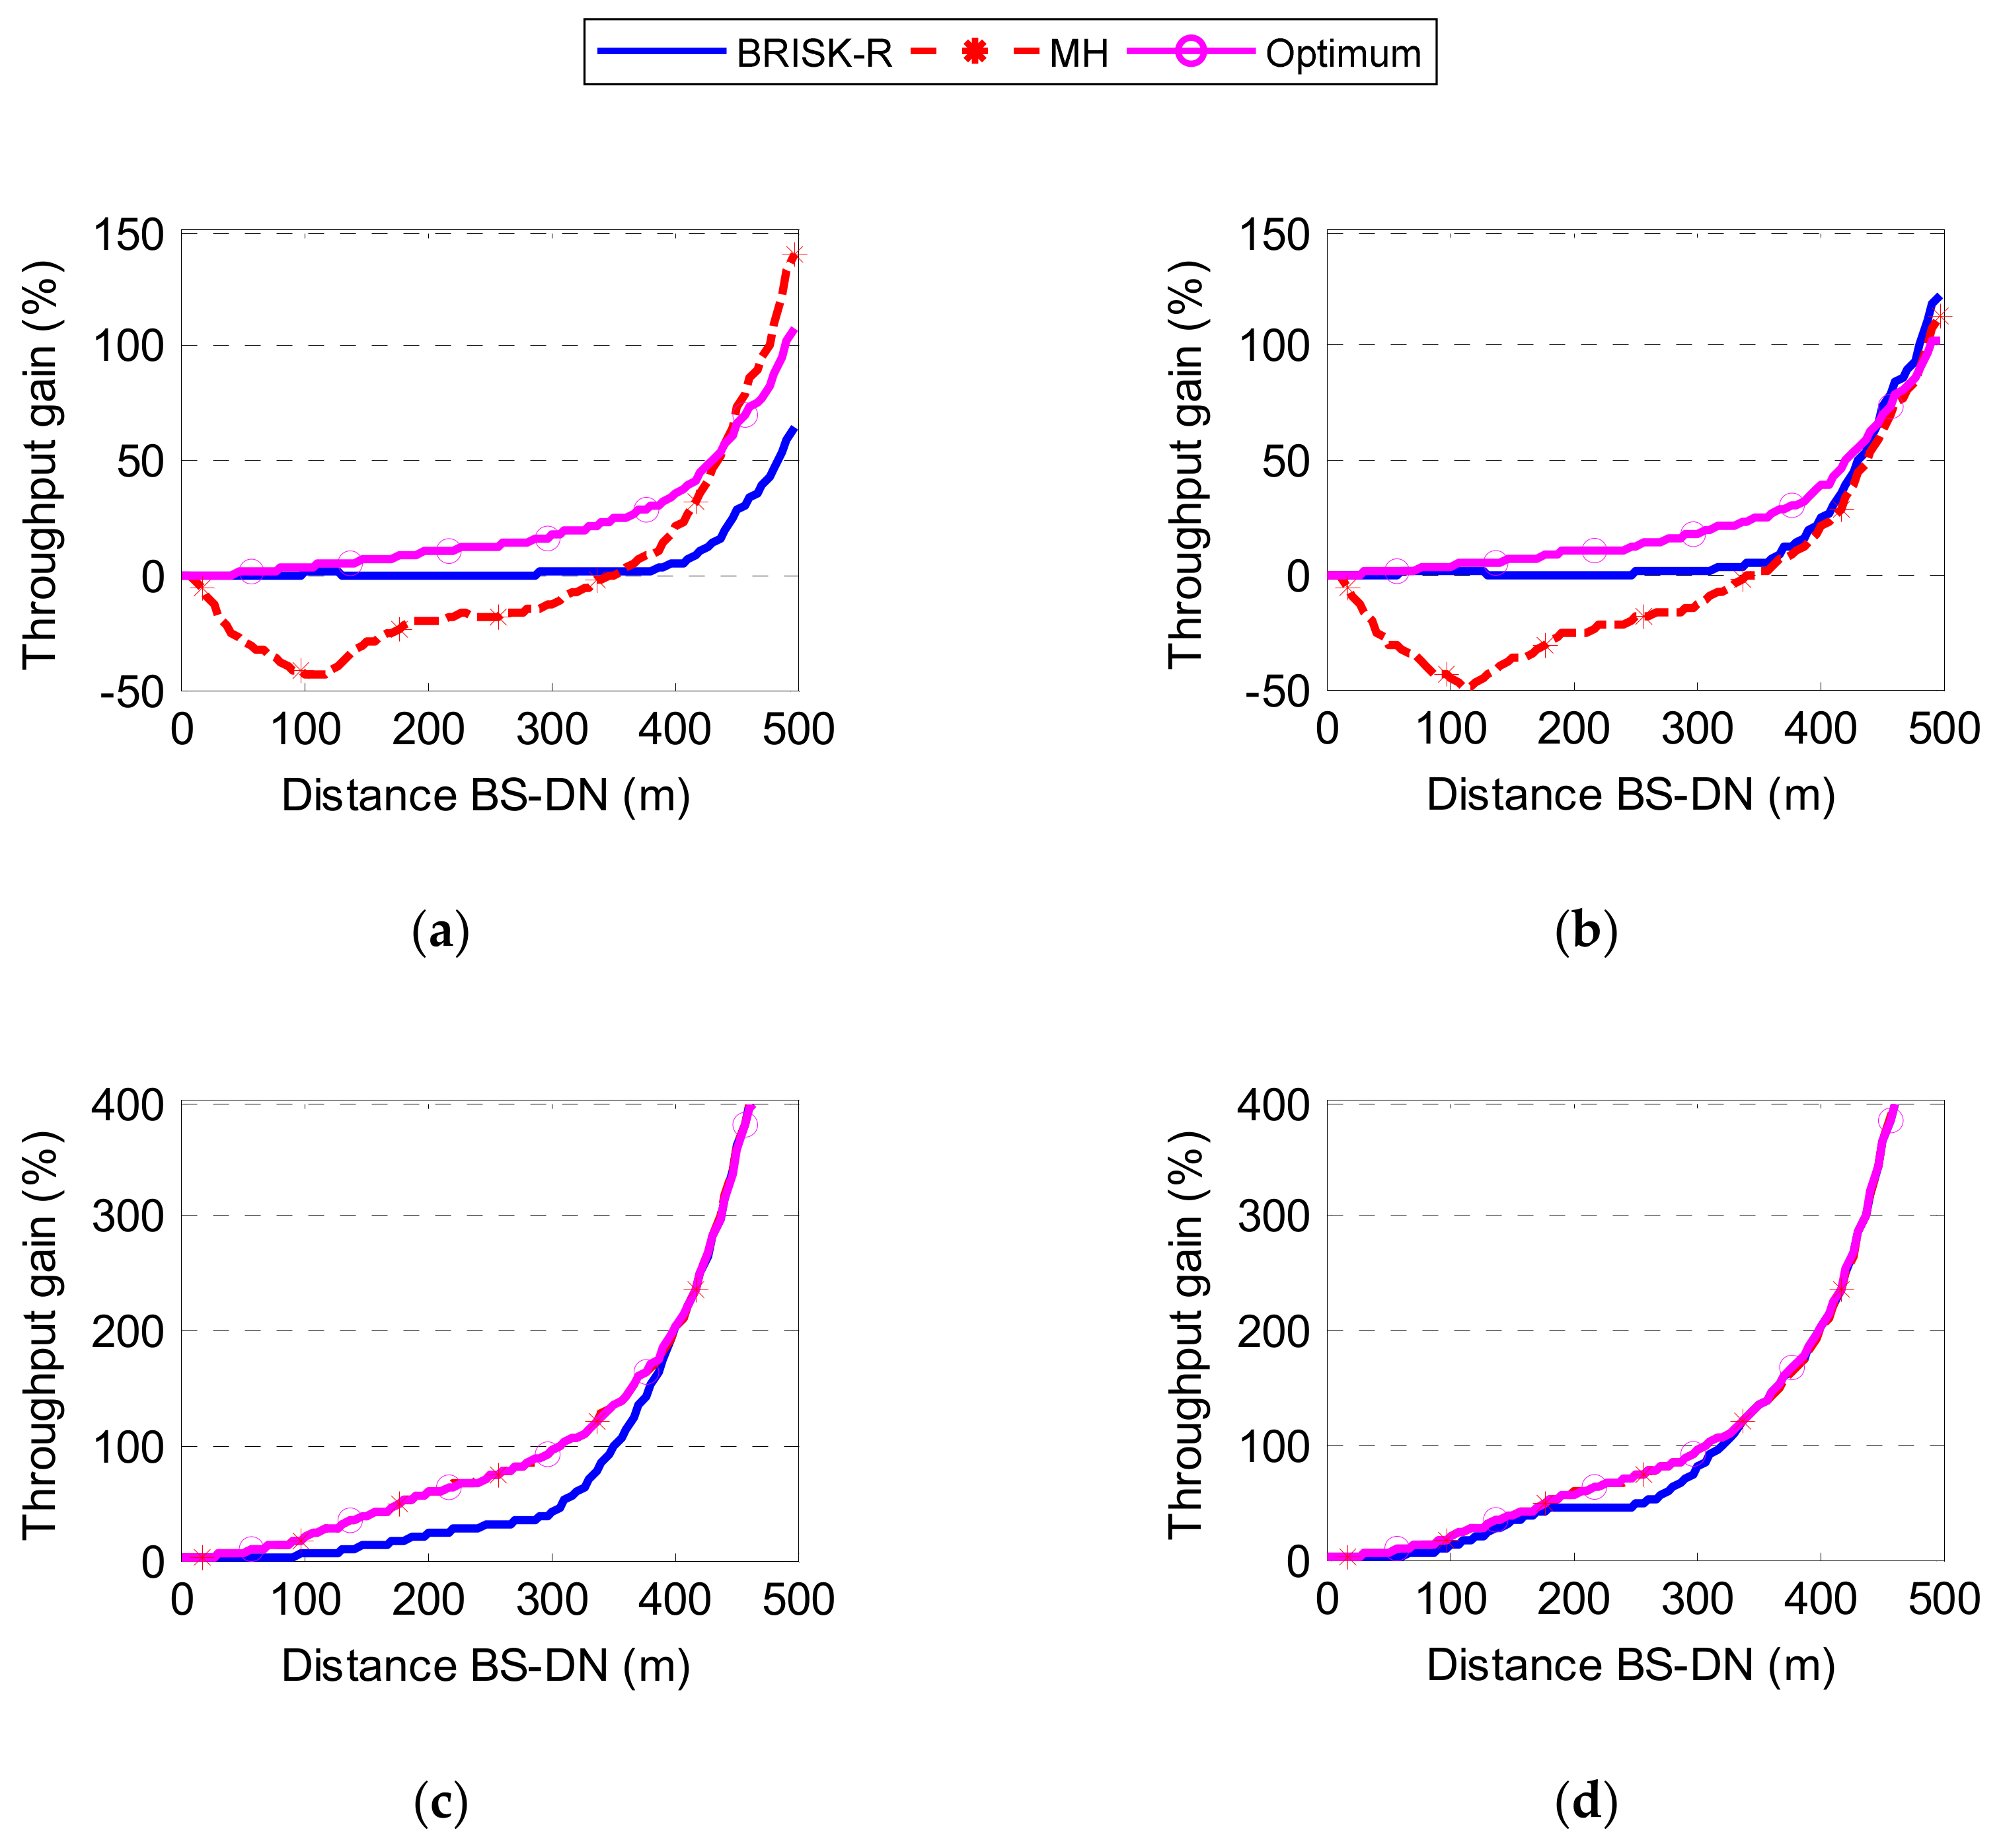
Figure 11.
Percentage of satisfactory transmissions—mixed multimedia traffic & homogeneous scenario. (a) Email transmissions; (b) Web transmissions.
Figure 11.
Percentage of satisfactory transmissions—mixed multimedia traffic & homogeneous scenario. (a) Email transmissions; (b) Web transmissions.

Figure 12.
Throughput gain obtained with the mode selection schemes with respect to SH—web traffic & circularly symmetric scenario. (a) 15 RN scenario; (b) 1000 RN scenario.
Figure 12.
Throughput gain obtained with the mode selection schemes with respect to SH—web traffic & circularly symmetric scenario. (a) 15 RN scenario; (b) 1000 RN scenario.
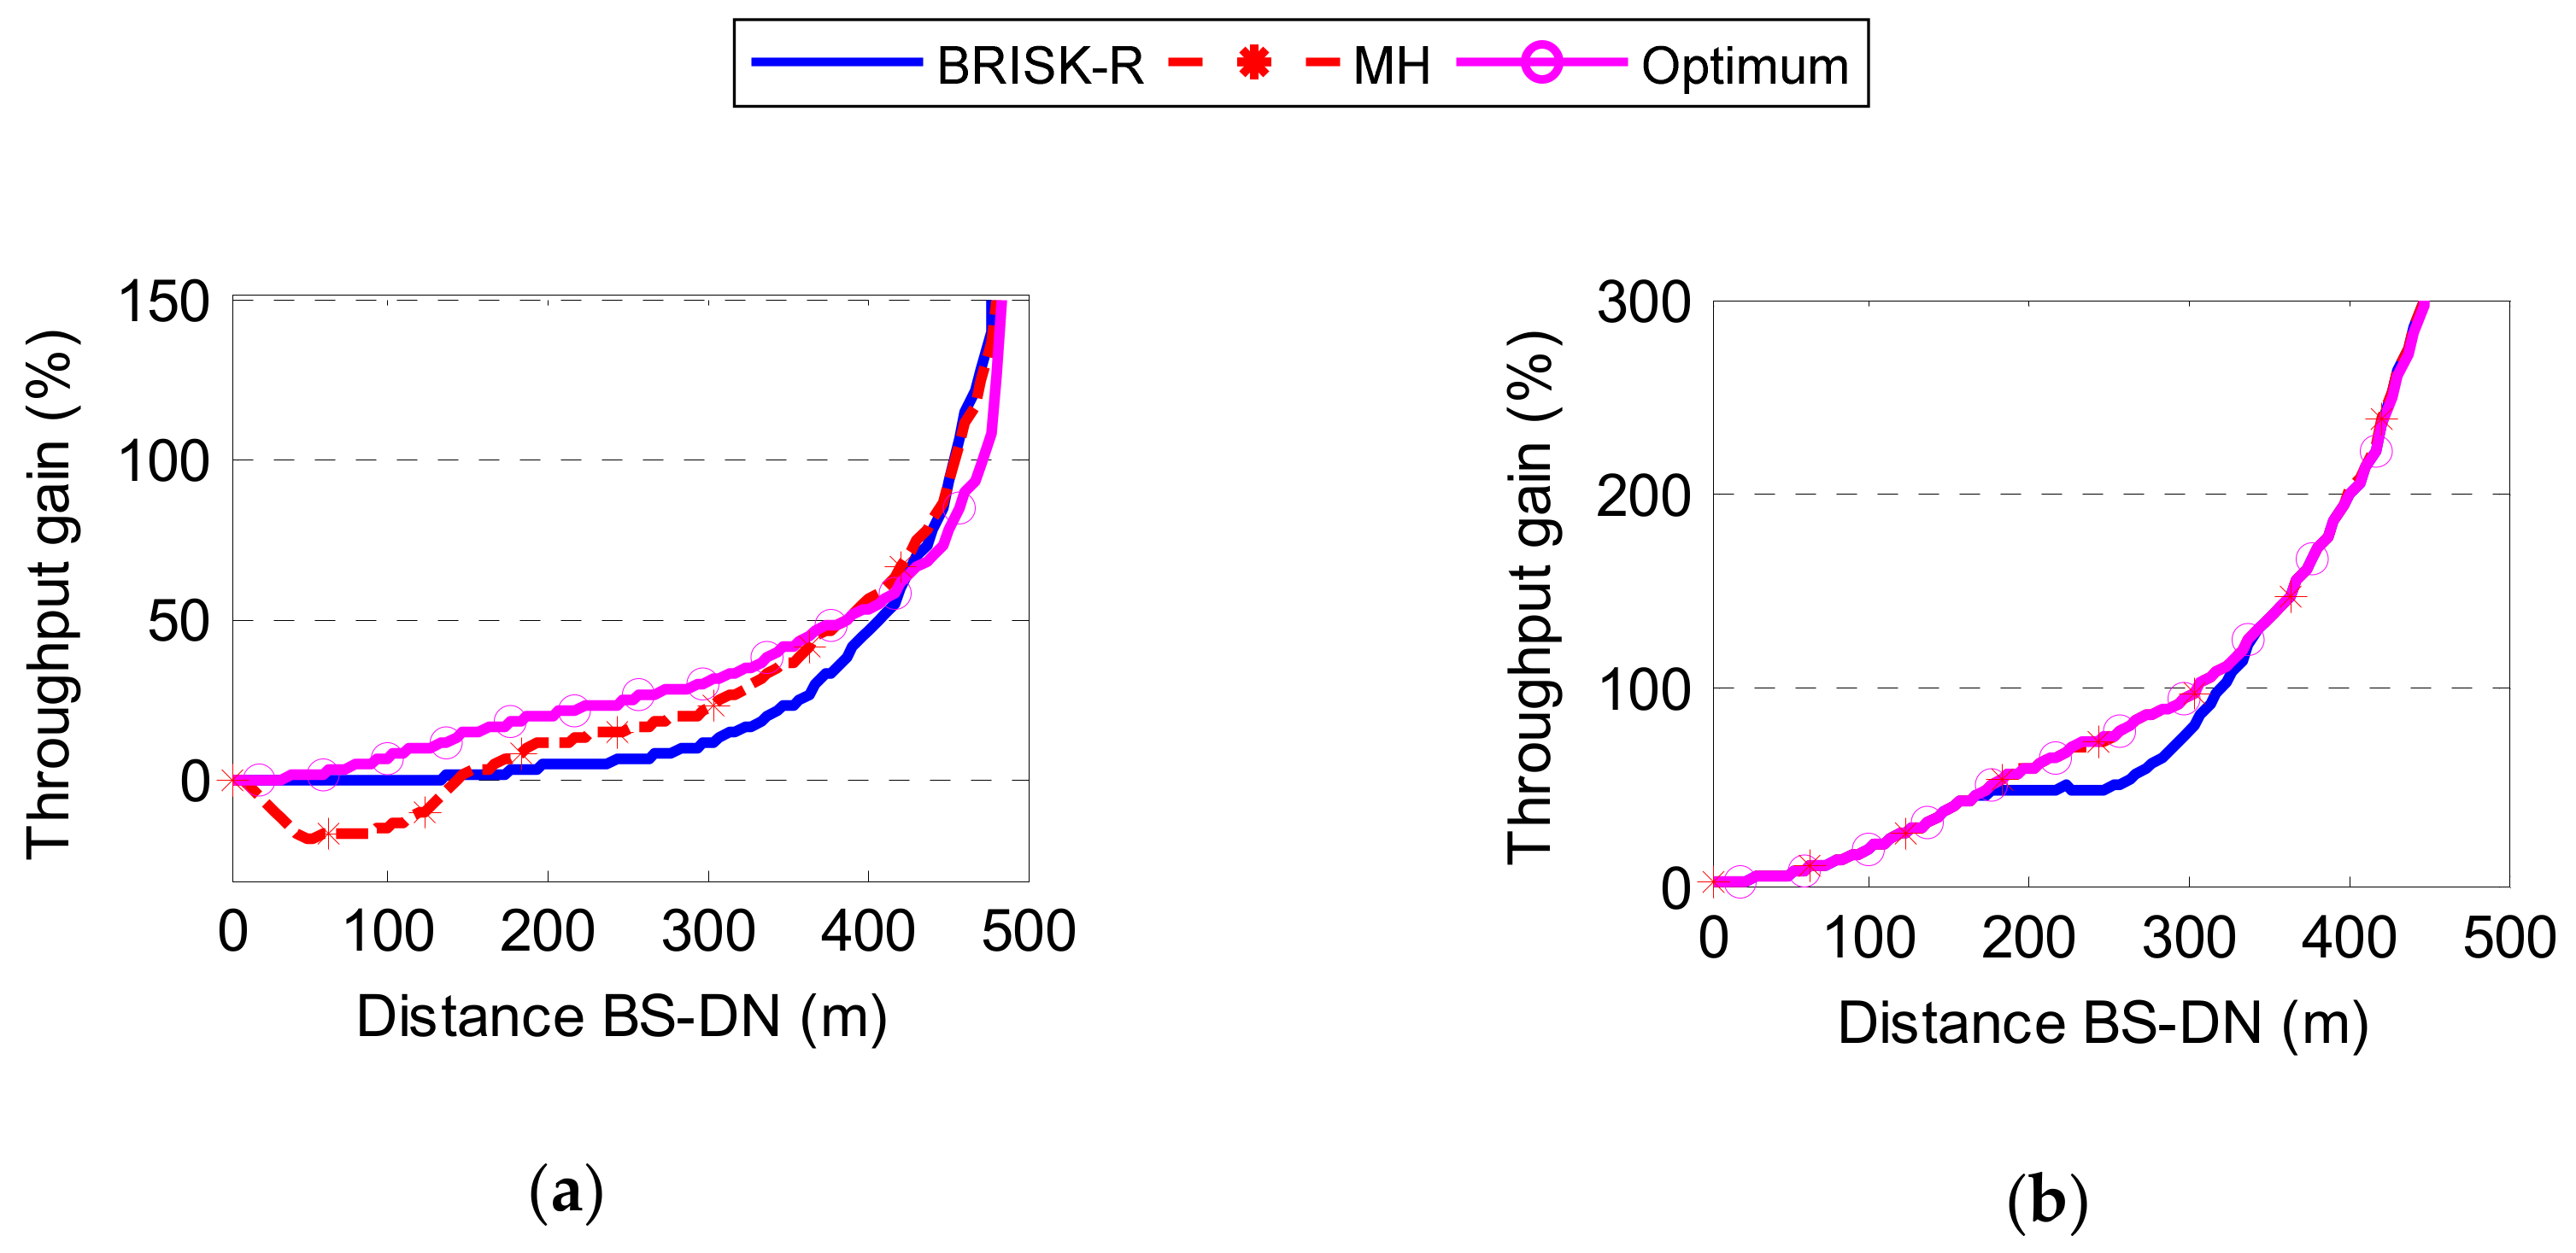
Figure 13.
Real and estimated risk of selecting MH as a function of the distance between DN and BS—15 RN and 50 RN web traffic. (a) Homogeneous scenario; (b) Circularly symmetric scenario.
Figure 13.
Real and estimated risk of selecting MH as a function of the distance between DN and BS—15 RN and 50 RN web traffic. (a) Homogeneous scenario; (b) Circularly symmetric scenario.

Figure 14.
Throughput gain obtained with BRISK-R with respect to BRISK-C—web traffic & circularly symmetric scenario.
Figure 14.
Throughput gain obtained with BRISK-R with respect to BRISK-C—web traffic & circularly symmetric scenario.
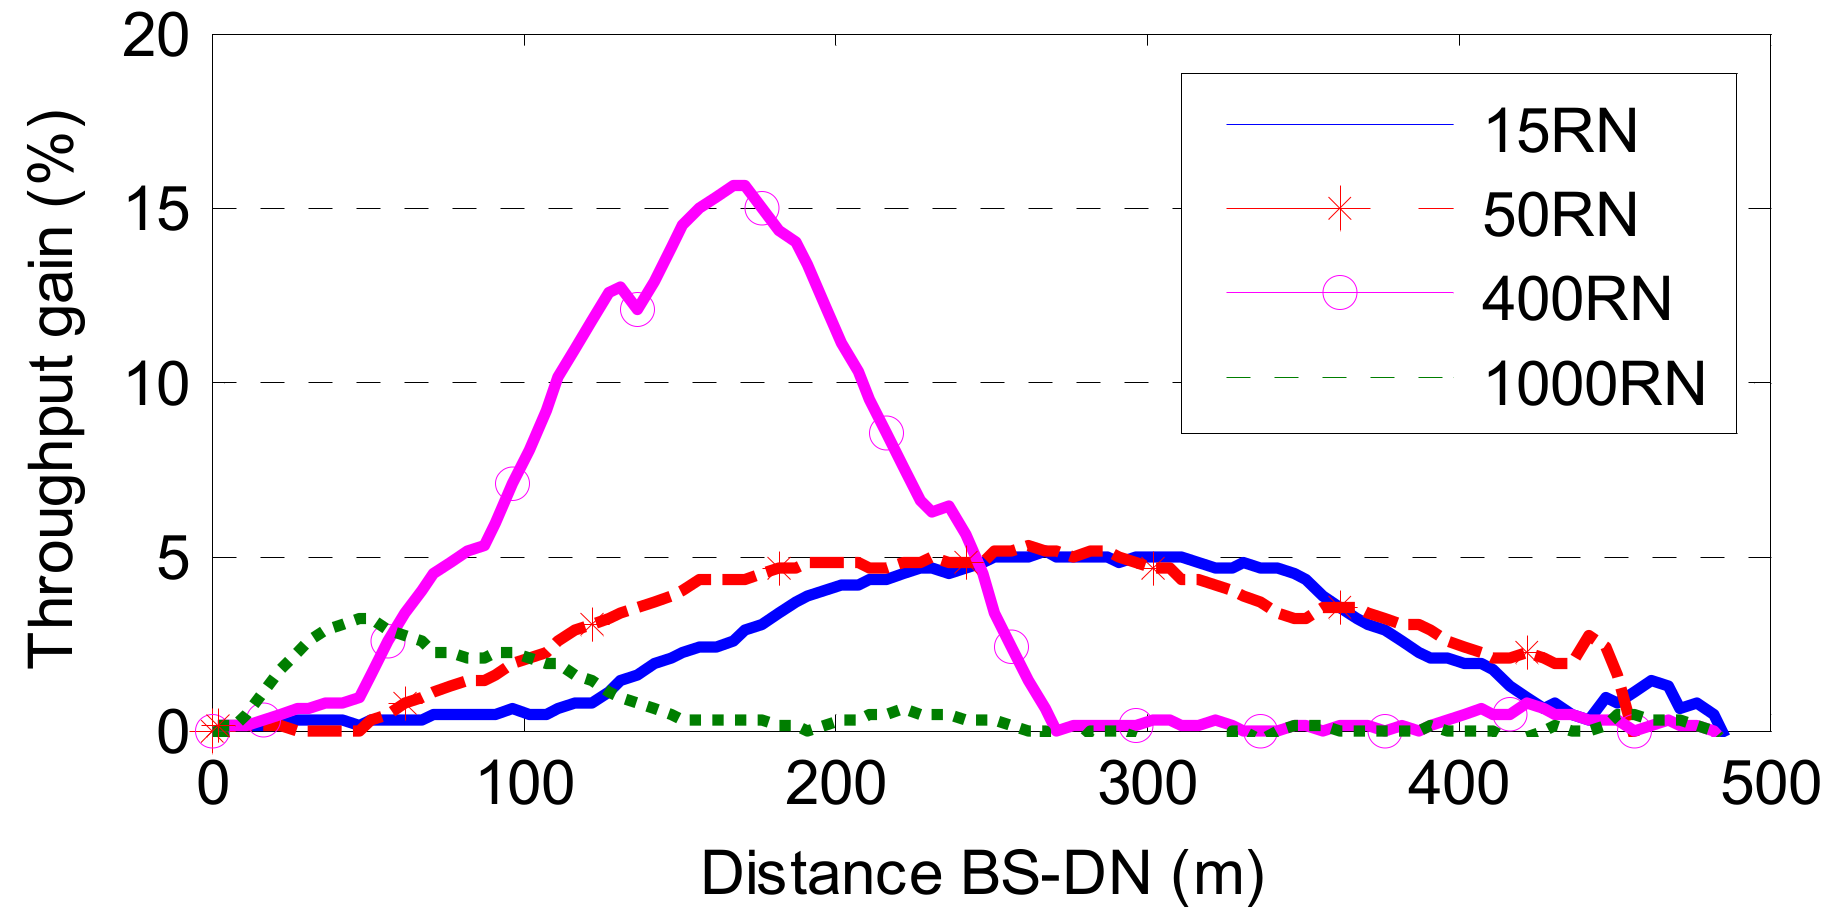
Figure 15.
Real and estimated risk of selecting MH as a function of the distance between DN and BS—15 RN web traffic & non-symmetric scenario. (a) S1; (b) S2–S3.
Figure 15.
Real and estimated risk of selecting MH as a function of the distance between DN and BS—15 RN web traffic & non-symmetric scenario. (a) S1; (b) S2–S3.

Figure 16.
Throughput gain obtained with BRISK-C, BRISK-R and BRISK-S with respect to SH—15 RN web traffic & non-symmetric scenario. (a) S1; (b) S2–S3.
Figure 16.
Throughput gain obtained with BRISK-C, BRISK-R and BRISK-S with respect to SH—15 RN web traffic & non-symmetric scenario. (a) S1; (b) S2–S3.
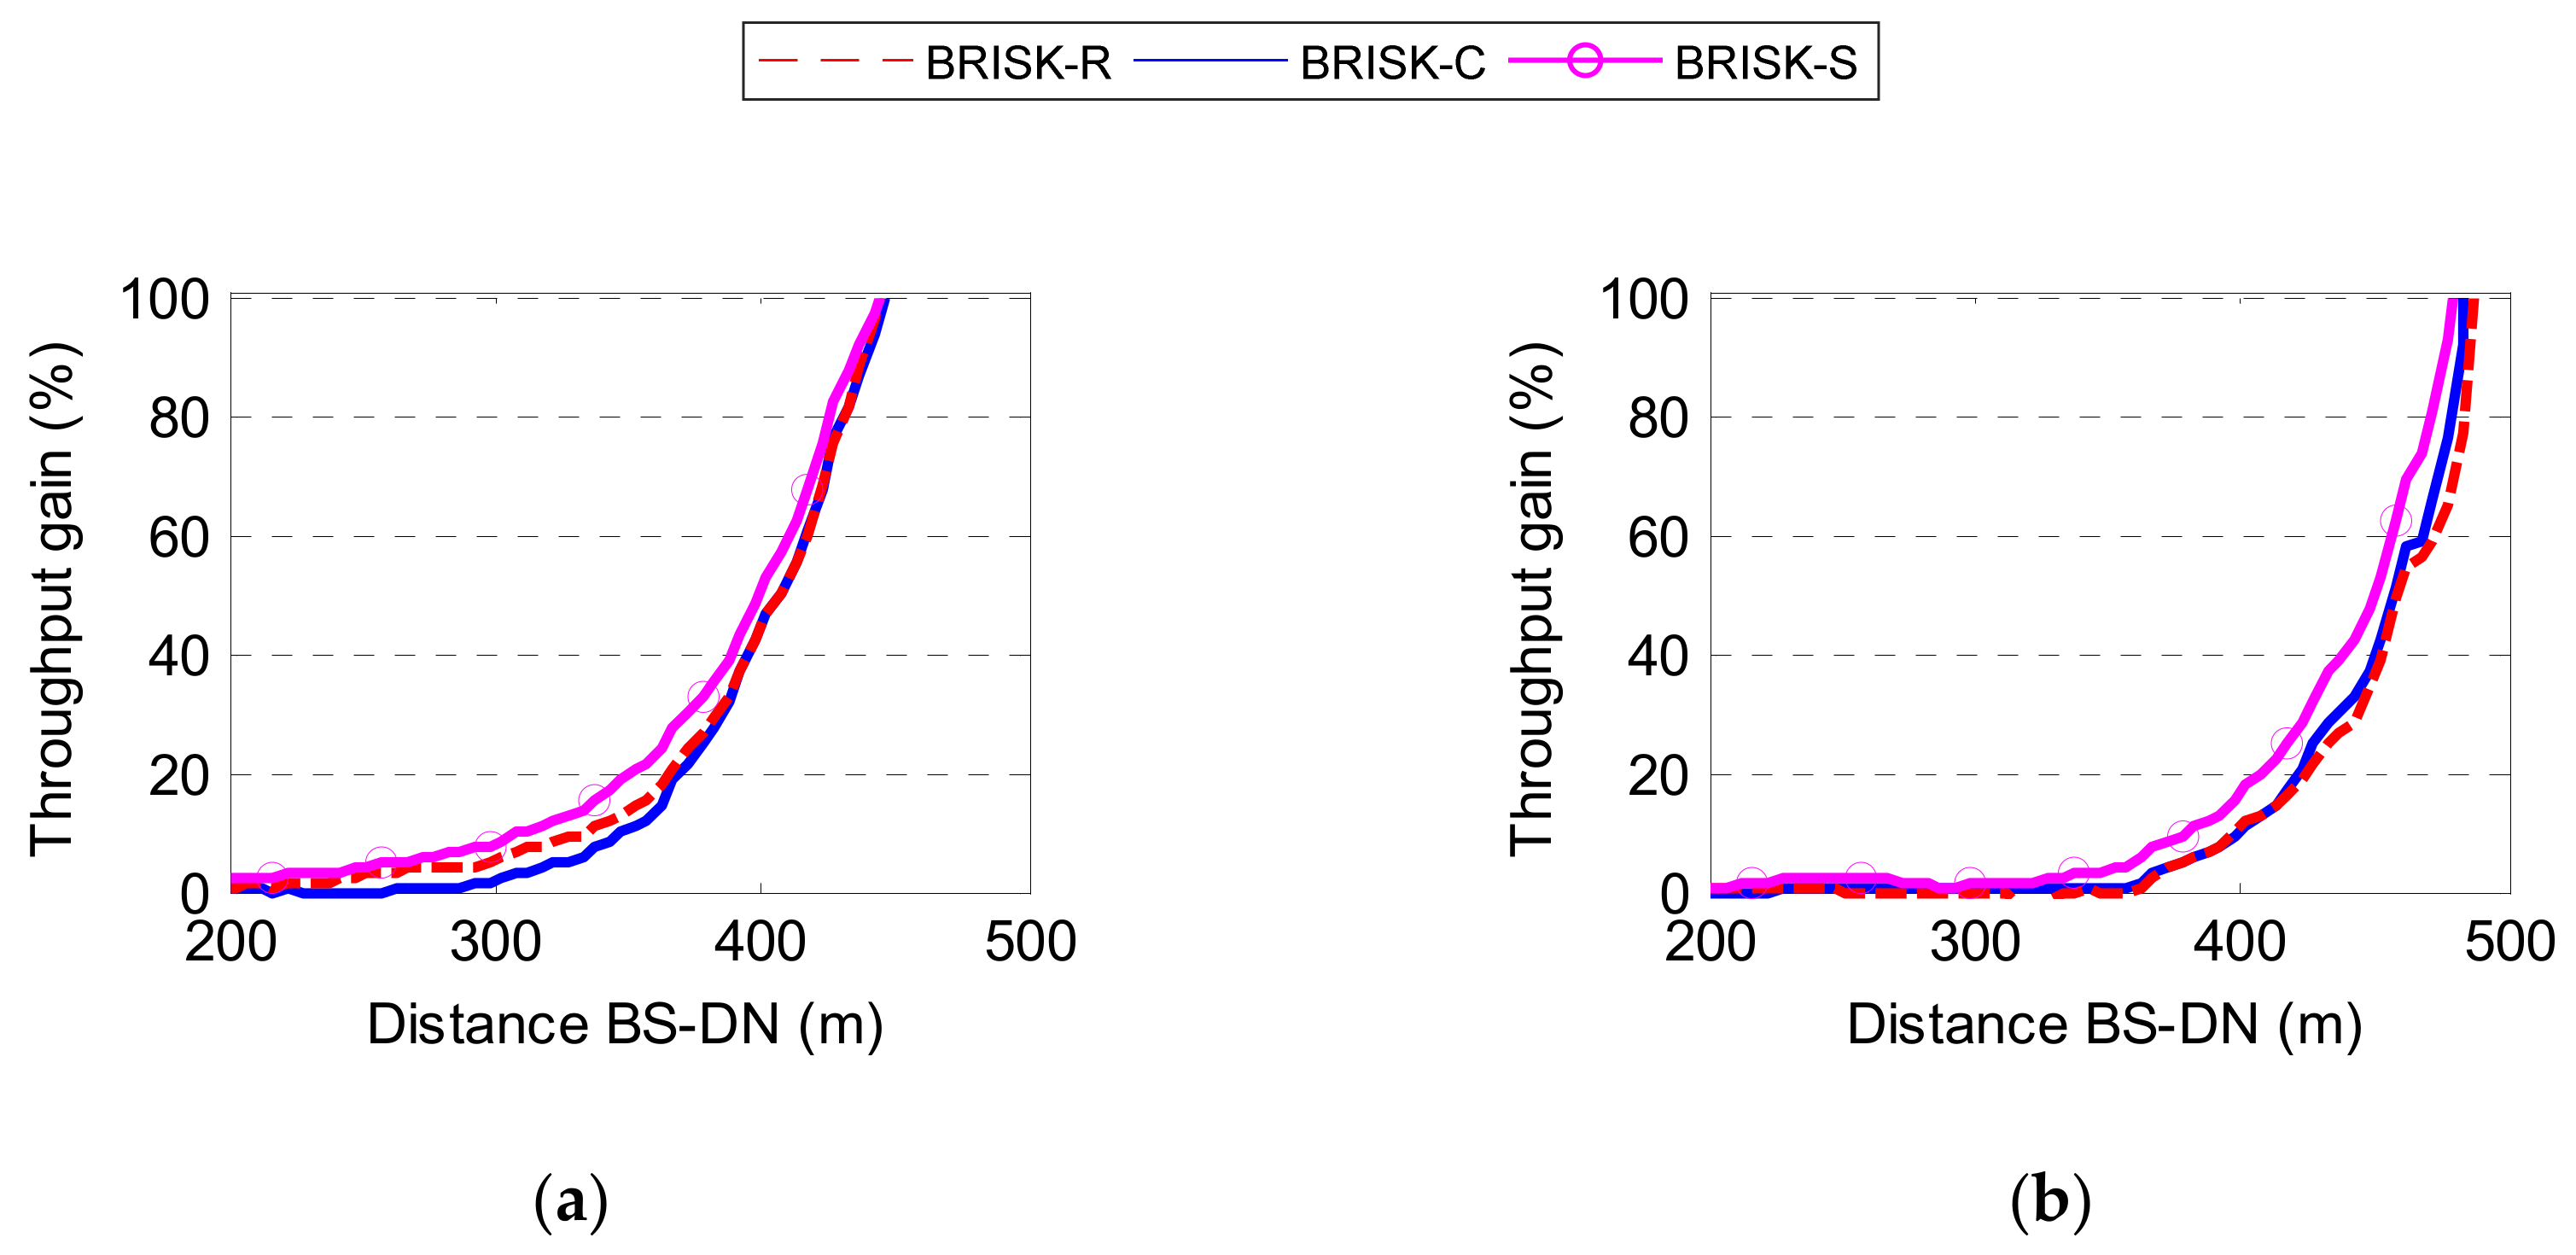
Figure 17.
Throughput gain obtained with BRISK-R and the Optimum scheme with respect to SH when applied MAXIHU and MinP RRM schemes—web traffic & homogeneous scenario. (a) MAXIHU; (b) minP.
Figure 17.
Throughput gain obtained with BRISK-R and the Optimum scheme with respect to SH when applied MAXIHU and MinP RRM schemes—web traffic & homogeneous scenario. (a) MAXIHU; (b) minP.


Table 1.
Evaluation Scenarios and User Equipments (UE) Densities.
| Scenario | Number of UEs in Cell | UE Density ρcell (UEs/km2) | UEs within a r1 (150 m) Radius Circumference |
|---|---|---|---|
| 15 RN | 15 | 19.1 | 1.4 |
| 50 RN | 50 | 63.7 | 4.5 |
| 400 RN | 400 | 509.3 | 36.0 |
| 1000 RN | 1000 | 1273.2 | 90.0 |
© 2019 by the authors. Licensee MDPI, Basel, Switzerland. This article is an open access article distributed under the terms and conditions of the Creative Commons Attribution (CC BY) license (http://creativecommons.org/licenses/by/4.0/).
Share and Cite
MDPI and ACS Style
Lucas-Estañ, M.C.; Gozalvez, J.; Sepulcre, M. Context-Aware Mode Selection for 5G Multi-Hop Cellular Networks. Electronics 2019, 8, 840. https://doi.org/10.3390/electronics8080840
AMA Style
Lucas-Estañ MC, Gozalvez J, Sepulcre M. Context-Aware Mode Selection for 5G Multi-Hop Cellular Networks. Electronics. 2019; 8(8):840. https://doi.org/10.3390/electronics8080840
Chicago/Turabian StyleLucas-Estañ, M. Carmen, Javier Gozalvez, and Miguel Sepulcre. 2019. "Context-Aware Mode Selection for 5G Multi-Hop Cellular Networks" Electronics 8, no. 8: 840. https://doi.org/10.3390/electronics8080840
Note that from the first issue of 2016, this journal uses article numbers instead of page numbers. See further details here.