Article

High-Accuracy Parameter Identification Method for Equivalent-Circuit Models of Lithium-Ion Batteries Based on the Stochastic Theory Response Reconstruction

School of Control Science and Engineering, Shandong University, Jinan 250061, China
*
Authors to whom correspondence should be addressed.
Electronics 2019, 8(8), 834; https://doi.org/10.3390/electronics8080834
Submission received: 20 June 2019 / Revised: 24 July 2019 / Accepted: 24 July 2019 / Published: 26 July 2019
(This article belongs to the Section Systems & Control Engineering)

Abstract

:
The precision of battery modeling is usually determined by the identification of model parameters, which is dependent on the measured outside characteristic data of batteries. However, there is a lot of noise because of the environment noise and measurement error, leading to poor estimation accuracy of model parameters. This paper proposes a stochastic theory response reconstruction (STRR) method to reconstruct the measured battery voltage data, which can eliminate the noise interference and ensure high-precision model parameter identification. The relationship between the battery voltage and current is established based on the the second-order equivalent circuit model (ECM) by the convolution theorem, and the impulse function is calculated by the correlation function between the measured voltage and current. Then, the battery voltage is reconstructed and used to identify model parameters with the recursive least squares (RLS) algorithm. All data for model parameter identification is produced through the pseudo random binarysequence (PRBS) excitation signal. Finally, the Urban Dynamometer Driving Schedule (UDDS) and Federal Urban Driving Schedule (FUDS) tests are conducted to validate the performance of the proposed method. Experimental results show that when compared with the traditional solution using low-pass filter, the proposed method can eliminate the noise interference more effectively and has higher identification accuracy.

1. Introduction

Electric vehicles (EVs) are receiving considerable attention as effective solutions to environmental pollution and energy crisis in recent years [1,2]. Due to the high energy density, long cycle life, and low self-discharge rate, etc., lithium-ion batteries have been used widely in EVs [3,4,5]. The battery management system (BMS) needs to estimate and predict all kinds of battery states accurately, such as the state of charge (SOC), state of health (SOH), and state of power (SOP) to ensure the high-efficiency and safety of batteries [6,7,8]. Unfortunately, these states cannot be measured directl, and they usually need be estimated and predicted based on battery models [9,10,11,12,13,14,15].
Electrochemical models [10,11], analytical models [11,13], and equivalent circuit models (ECMs) [9,10,11,12,15] are commonly used for battery modeling. Electrochemical models use nonlinear partial differential equations to describe the internal electrochemical reaction process of batteries. Although the model precision is high, model parameters are numerous, and computational burden is heavy. Analytical models use explicit equations to describe working performance. However, these equations are difficult to solve. ECMs have the advantages of simple structure, minor calculation, etc., which seems to be more suitable for BMS [16], such as in [17], where the second-order ECM is used to represent the battery system. When the battery model is determined, the suitable model parameter identification algorithm should be selected to identify the battery model parameters. In [14], the particle swarm optimization (PSO) algorithm is selected to identify the battery ECM parameters, which has fast convergence speed and high computational efficiency. In [18], the lookup table approach is used to obtain the battery model parameters. In [19], the hybrid pulse power characterization (HPPC) procedure is used to extract model parameters. The cell parameters are experimentally determined by conducting DC check-up (CU) and AC EIS-measurements under monitored temperature and relaxation conditions in [20]. The pulse power test, EIS test, and pulsed multisine signal test are discussed in detail for parameter identification in [21]. Also, the joint Kalman filtering (JKF) [22] or dual Kalman filtering (DKF) [23,24] can be adopted to estimate the model parameters. However, the JKF algorithm needs to expand the dimension of the original system state variables, which may cause high-dimensional vectors and complex matrix operations. The DKF algorithm uses two independent Kalman filters to estimate the system state and parameters, respectively, which can avoid the increase of dimensionality that leads to the complicated calculation. Therefore, the DKF algorithm is more widely used. Besides, the dual extended Kalman filter (DEKF) method, which consists of two extended Kalman filters (EKFs), is used to estimate the battery model parameters in [25]. However, the performance of the EKF-based method greatly depends on the accuracy of the model, and the noise information should be known in advance. In addition, adaptive filter approaches are used to identify the battery model parameters in [26]. Besides, because of the simplicity and practicality, the recursive least squares (RLS) method is widely used, such as in [27,28,29], where the RLS method is used to identify the model parameters. Therefore, the RLS method was selected to identify the model parameters in this paper. The modeling accuracy is influenced by the measured outside characteristic data of batteries that is corrupted by the unavoidable ambient noise and measurement error, the used battery model, the extraction procedure, etc. In this paper, we focused on the influence of the noise in the measured data on the parameter estimation.
In view of this situation, in [30], the 16-order wavelet transform matrix is utilized to decompose the noisy signal; however, the performance of the denoising technique is dependent on the threshold value. If the threshold value is set improperly, the performance of the denoising technique will decline. Besides, the low-pass filter is used to reduce the noise interference; for example, a fourth-order Butterworth filter is designed in [31]. Also, in [32], the measured data is firstly filtered by the low-pass filter before performing the parameter identification. However, the optimal cut-off frequency and order of the filter are difficult to select, which will take a lot of time to determine the optimal parameters. The amplitude and phase of the signal also may change, which can affect the accuracy of battery model parameter identification. Therefore, this paper proposes a stochastic theory response reconstruction (STRR) method to reconstruct the measured battery voltage data. The noise can be effectively eliminated, and battery model parameters are identified accurately with RLS. This method need not set the order and cut-off frequency, and the amplitude and phase of the reconstructed voltage will not change. Therefore, the tedious process of debugging parameters is omitted, and this method can maintain the authenticity of the real signal well.
The main contributions of this paper can be summarized as follows: (1) A battery voltage reconstruction method named STRR is proposed. (2) The STRR method can reconstruct the battery voltage to eliminate the noise interference, which can be used to ensure high-precision model parameter identification. (3) The Butterworth low-pass filter is designed to be compared with the STRR method by experimental approach, which indicates the performance of the proposed method.
The remaining sections of this paper are organized as follows. Section 2 describes the lithium-ion battery ECM and the parameter identification algorithm. The STRR method is described in Section 3 detailedly. Section 4 presents the experimental design. Section 5 shows the experimental results, which validate the performance of the proposed method. Conclusions are given in Section 6.

2. Battery Model and Parameter Identification

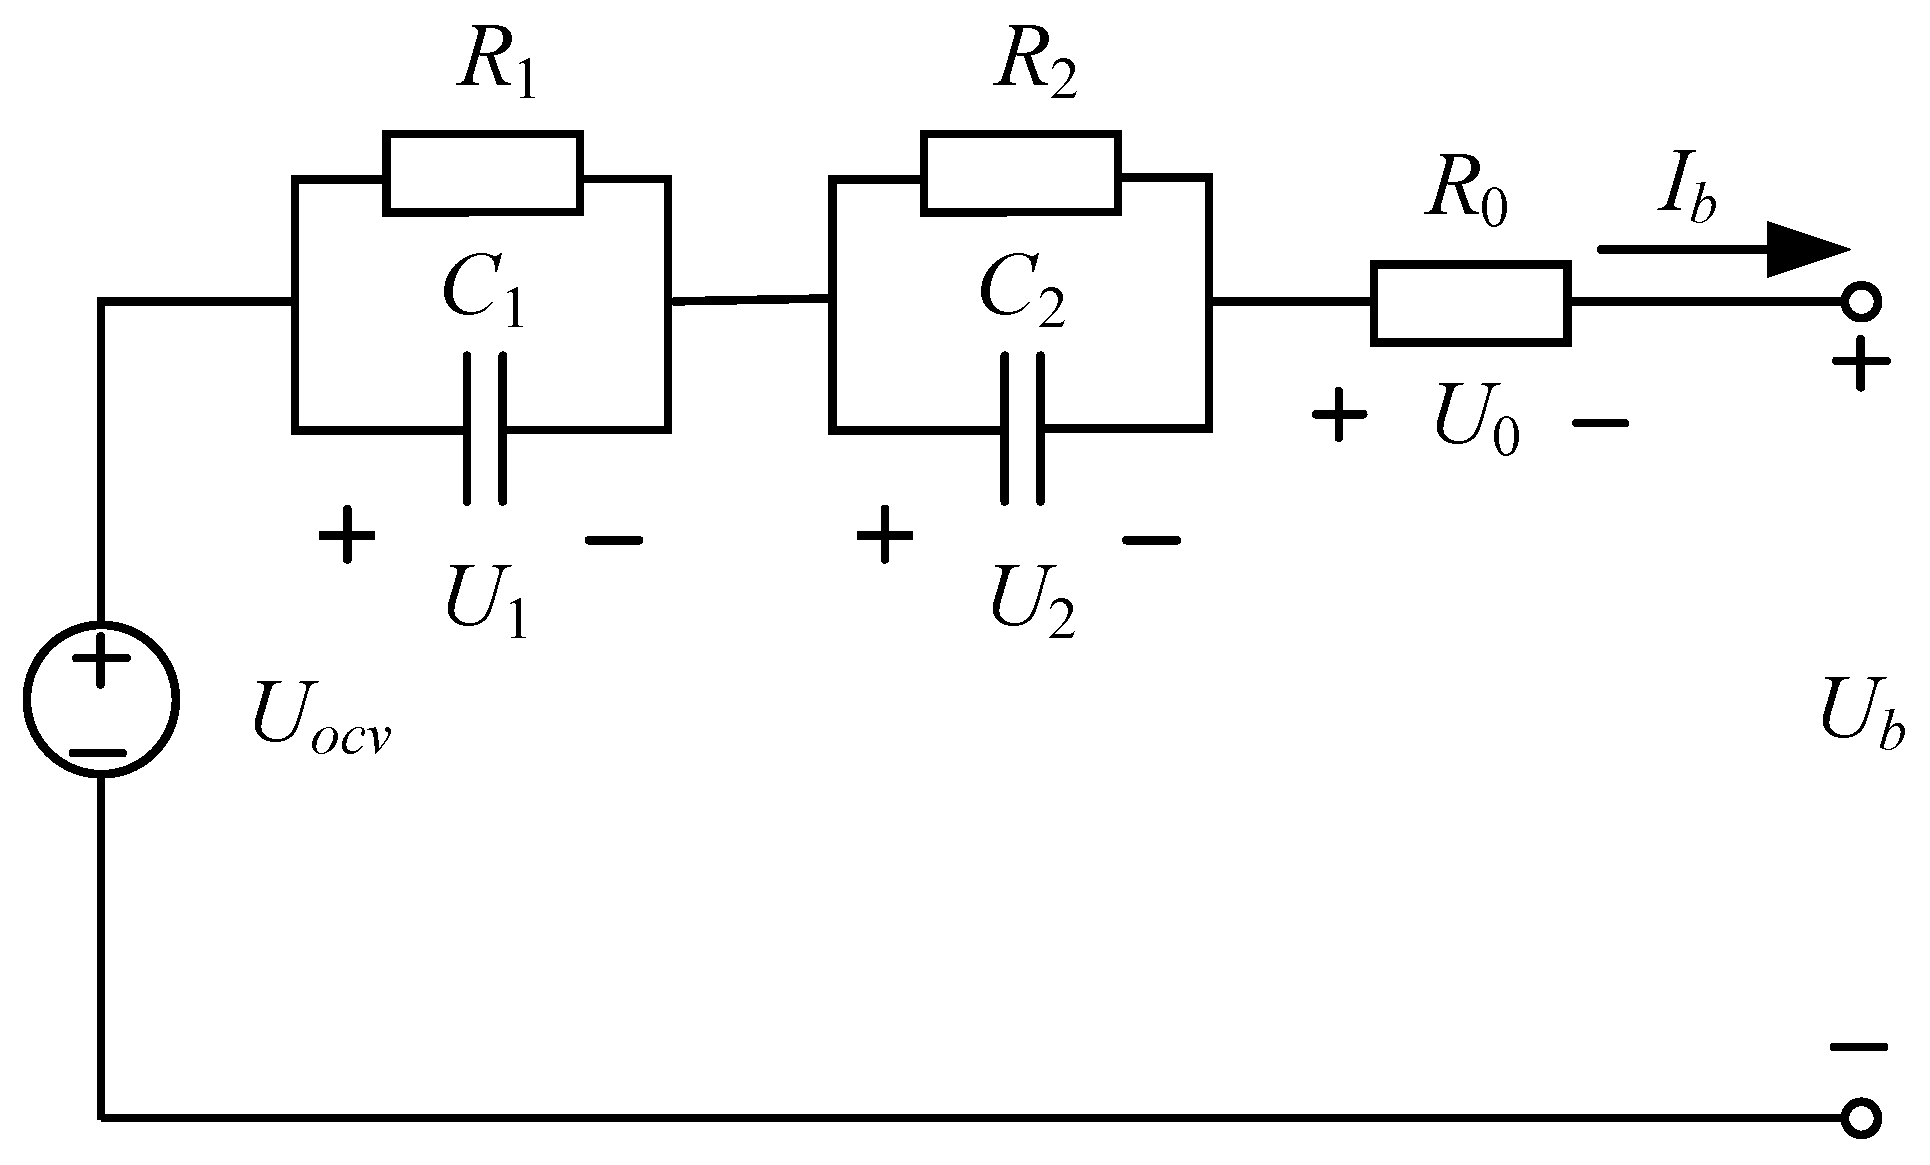
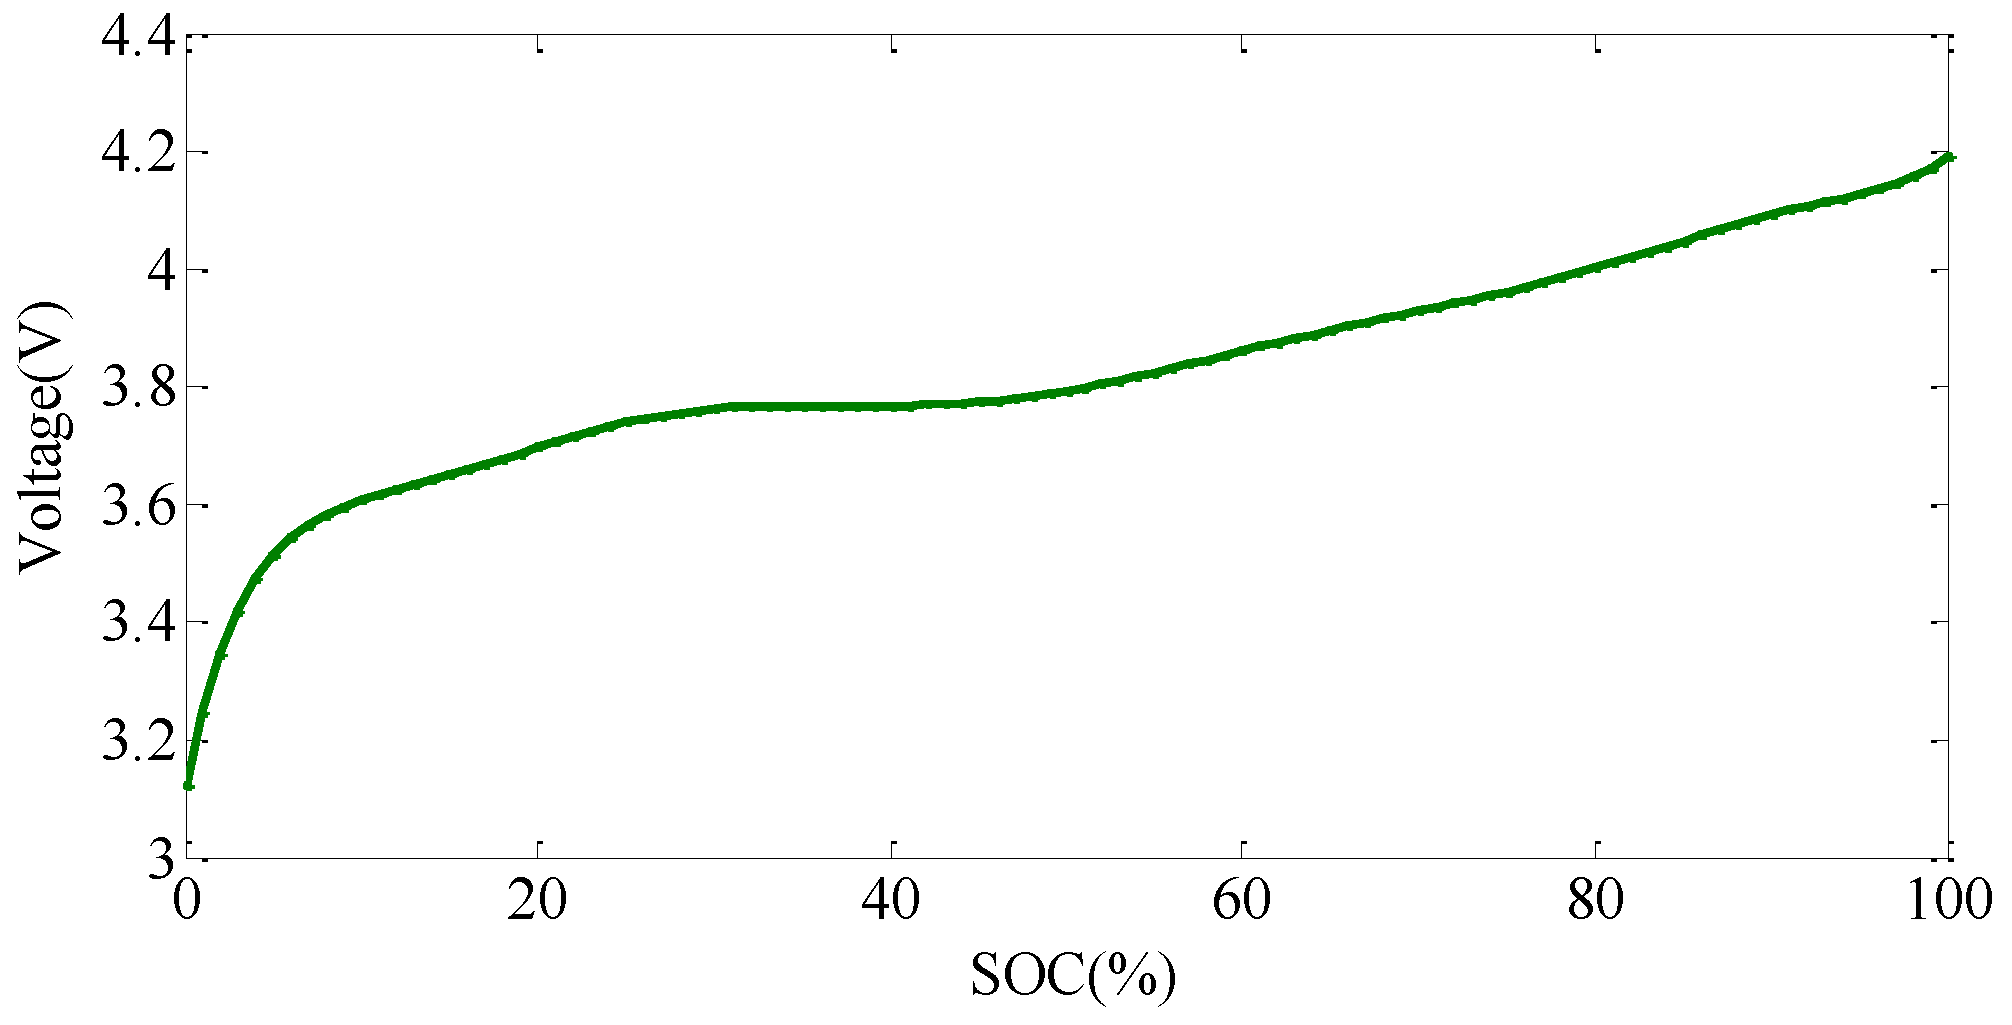
2.1. The Second-Order ECM of Lithium-Ion Battery

Generally, in order to capture the battery dynamic characteristics and estimate the battery model parameters accurately, a suitable battery model must be selected. As mentioned in Section 1, the ECM is widely used because of simple structure and minor calculation, etc. As the number of RCnetworks increases in the ECM, the precision of the battery model will increase. However, calculation burden will be heavier. Therefore, the second-order ECM achieves a compromise between the model precision and the model complexity [33,34,35,36,37]. This paper selected the second-order ECM to capture the battery dynamic characteristics. The schematic diagram of the second-order ECM is shown in Figure 1.
As shown in Figure 1, U o c v represents the open circuit voltage (OCV), R i (i = 1, 2) represents the polarization resistance, C i (i = 1, 2) represents the polarization capacitance, U i (i = 1, 2) is the polarization voltage across the corresponding parallel resistor capacitor network, R 0 is the internal resistance, U b represents the terminal voltage, and I b is the load current. According to Kirchhoff’s laws, the state space equation of the model can be expressed as:
U 1 ( k ) U 2 ( k ) S ( k ) = e T / ( R 1 C 1 ) 0 0 0 e T / ( R 2 C 2 ) 0 0 0 1 × U 1 ( k 1 ) U 2 ( k 1 ) S ( k 1 ) + R 1 ( 1 e T / ( R 1 C 1 ) ) R 2 ( 1 e T / ( R 2 C 2 ) ) η T / C × I b ,
U b ( k ) = U o c v ( k ) U 1 ( k ) U 2 ( k ) I b R 0 ,
where S is the SOC of battery, η represents the Coulombic efficiency, T is the sampling interval, and C is the available capacity of the battery, which can be affected by charge-discharge current rate, ambient temperature, and the battery life.

2.2. Parameter Identification Based on RLS

In this paper, the OCV model is specifically introduced in Section 4.2, and the RC parameters are identified based on the RLS. From Equations (1) and (2), the transfer function of the second-order ECM can be written as:
G ( s ) = U b ( s ) U o c v ( s ) I b ( s ) = ( R 0 + R 1 1 + τ 1 s + R 2 1 + τ 2 s ) ,
where τ 1 = R 1 C 1 , τ 2 = R 2 C 2 .
Then, the transfer function is transformed from S domain to Z domain based on bilinear transformation, which can be expressed as:
s = 2 ( 1 z 1 ) T ( 1 + z 1 ) .
Substituting Equation (4) for Equation (3), the discrete transfer function of the system can be written as:
G ( z 1 ) = b 3 + b 4 z 1 + b 5 z 2 1 b 1 z 1 b 2 z 2 ,
where parameters b i (i = 1, 2, ..., 5) can be identified by RLS. The RC parameters of the ECM can be obtained by the following equations:
R 0 = b 3 b 4 + b 5 b 1 b 2 + 1 ,
R 0 + R 1 + R 2 = b 3 + b 4 + b 5 b 1 + b 2 1 ,
τ 1 τ 2 = T 2 ( b 2 + 1 ) 4 ( b 1 + b 2 1 ) ,
τ 1 + τ 2 = T ( b 1 b 2 + 1 ) 4 ( b 1 + b 2 1 ) ,
τ 1 ( R 0 + R 2 ) + τ 2 ( R 0 + R 1 ) = T ( b 3 b 5 ) b 1 + b 2 1 .
Let y ( k ) = U b ( k ) U o c v ( k ) , Equation (5) can be written as:
y ( k ) = b 1 y ( k 1 ) + b 2 y ( k 2 ) + b 3 I ( k ) + b 4 I ( k 1 ) + b 5 I ( k 2 ) .
Defining Equations (12) and (13) as:
ϕ = y ( k 1 ) , y ( k 2 ) , I ( k ) , I ( k 1 ) , I ( k 2 ) T ,
θ = b 1 , b 2 , b 3 , b 4 , b 5 T .
Then Equation (11) can be written as:
y ( k ) = ϕ ( k ) T θ ( k ) .
Defining the estimator of θ as θ ^ , Equation (14) can be expressed as:
y ( k ) = ϕ ( k ) T θ ^ ( k ) + ε ( k ) .
When the square sum of ε is minimum, the parameters are optimal, and the mathematical formula can be written as:
J = k = 1 N ε ( k ) 2 = k = 1 N ( y ( k ) ϕ ( k ) θ ^ ( k ) T ) 2 .
When the derivative of θ is zero, the solution can be obtained:
θ ^ = ( Ψ T Ψ ) 1 Ψ T Y ,
Ψ = ϕ 1 , ϕ 2 , . . . , ϕ N T ,
Y = y 1 , y 2 , . . . , y N T .
Then the RLS algorithm can be written as:
K k + 1 = P k ϕ k + 1 ( ϕ k + 1 T P k ϕ k + 1 + 1 ) 1 ,
P k + 1 = P k K k + 1 ϕ k + 1 T P k ,
θ ^ k + 1 = θ ^ k + P k + 1 ( Y k + 1 ϕ k + 1 T θ ^ k ) ,
where K k + 1 and P k represent the gain and the error covariance matrix of the algorithm, respectively.

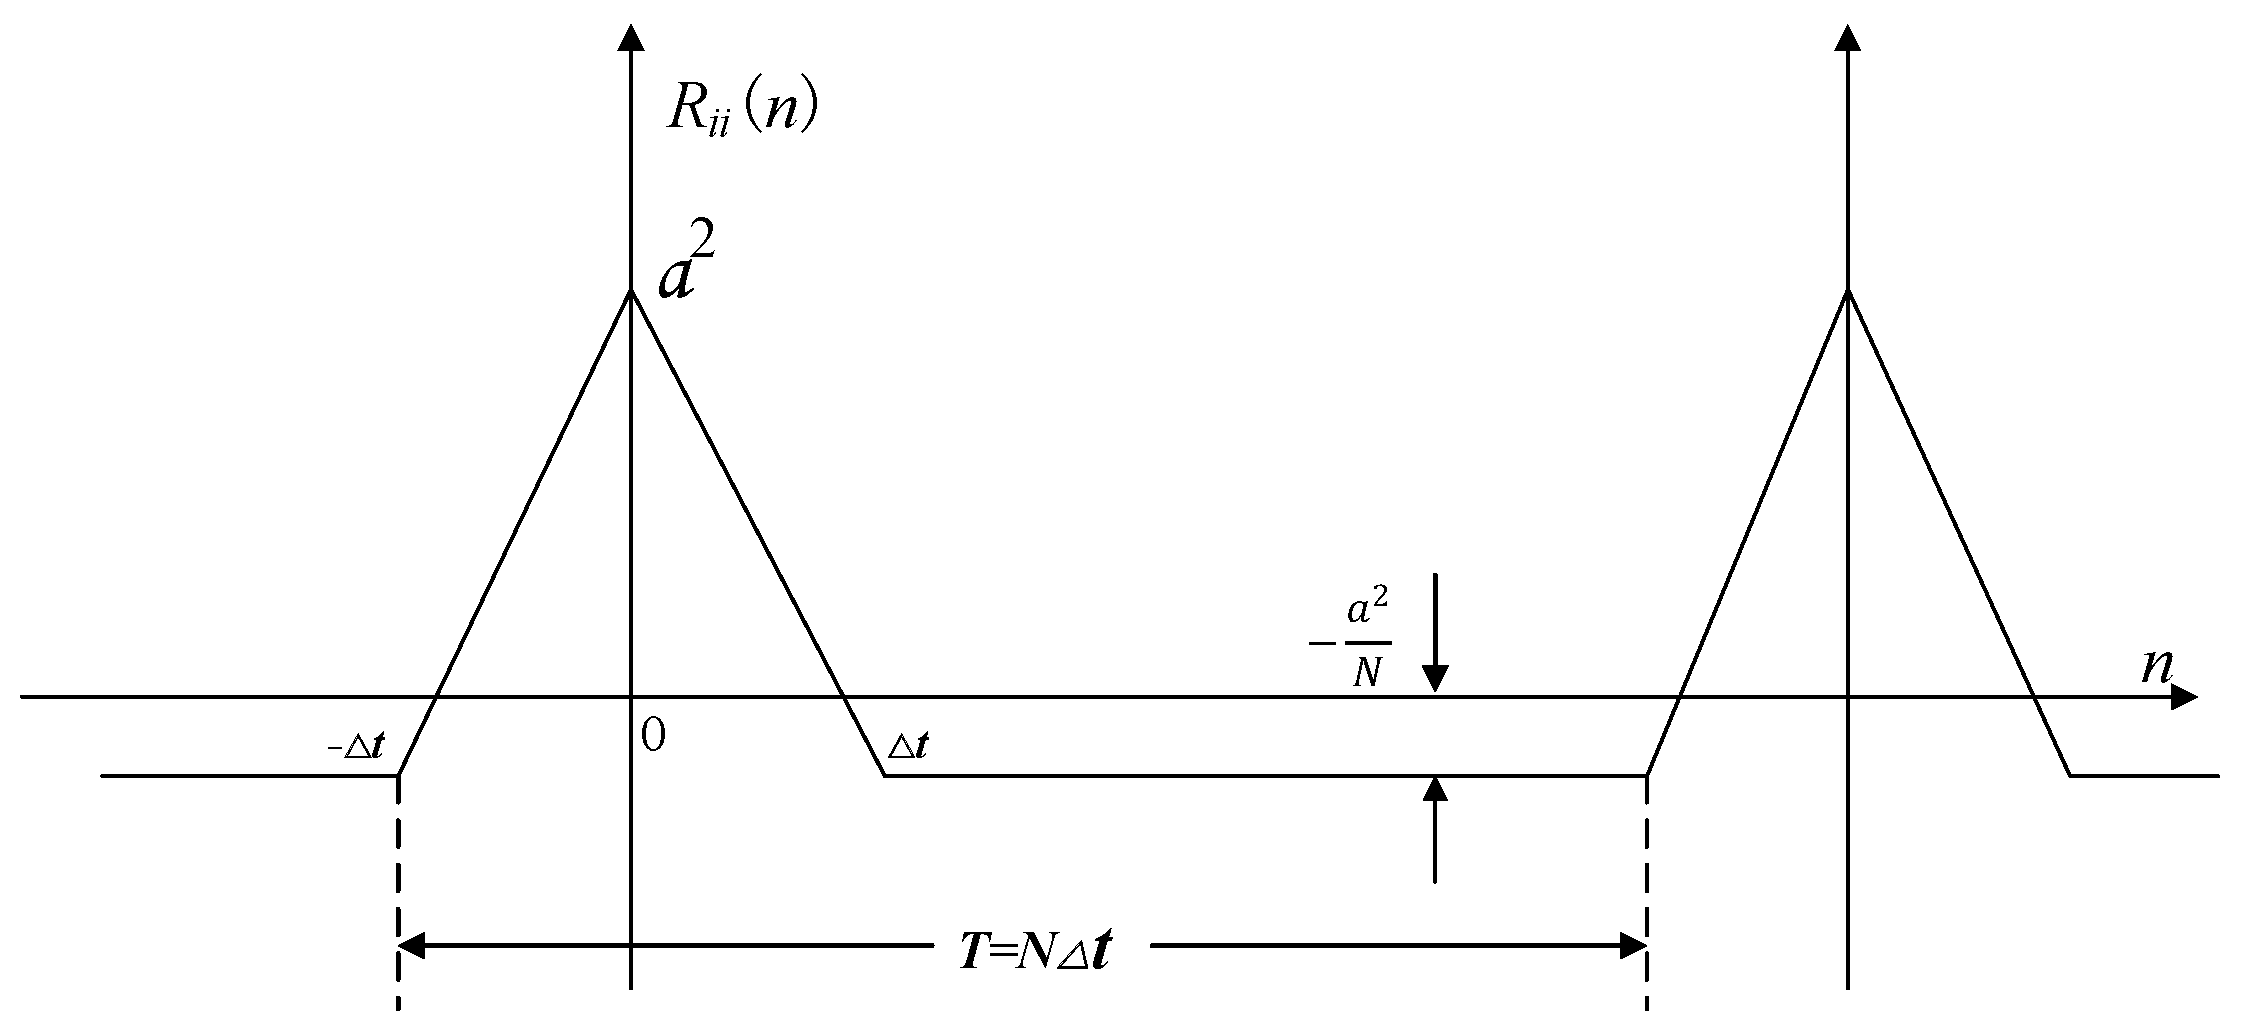
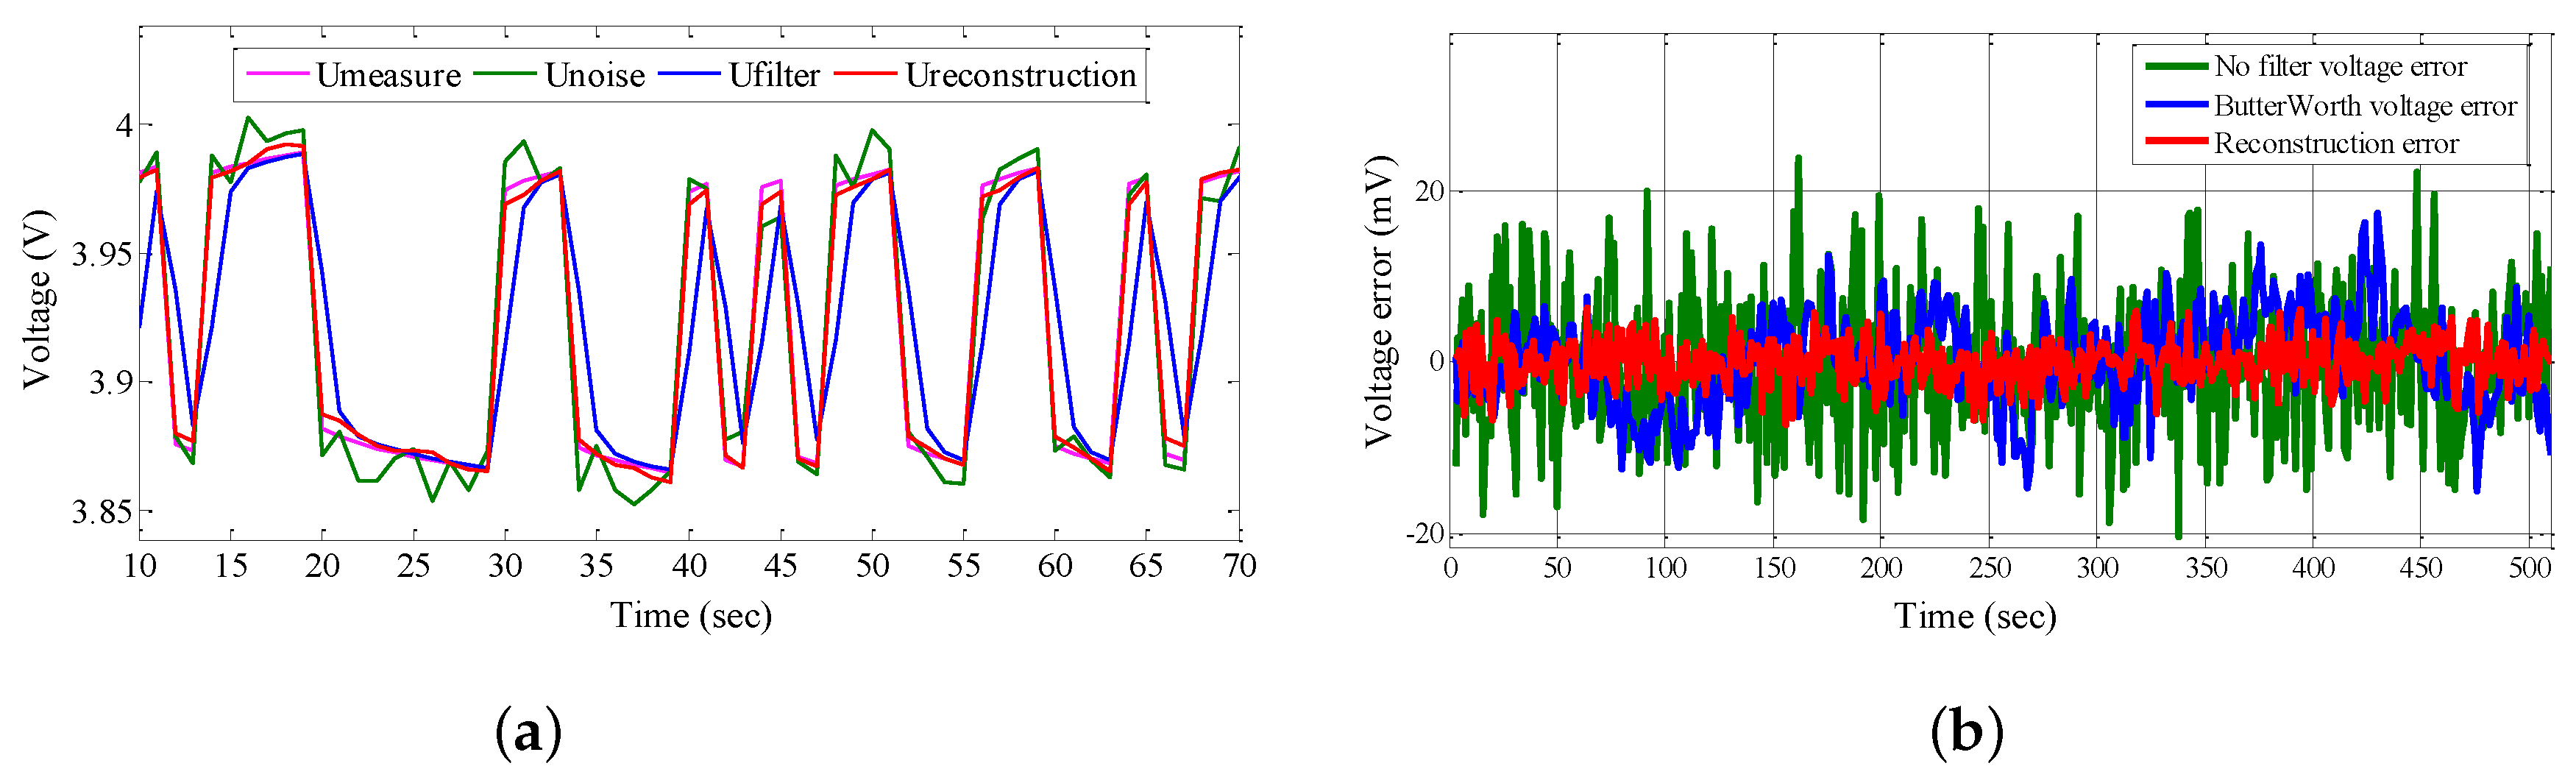
3. The Reconstruction Method of Battery Voltage
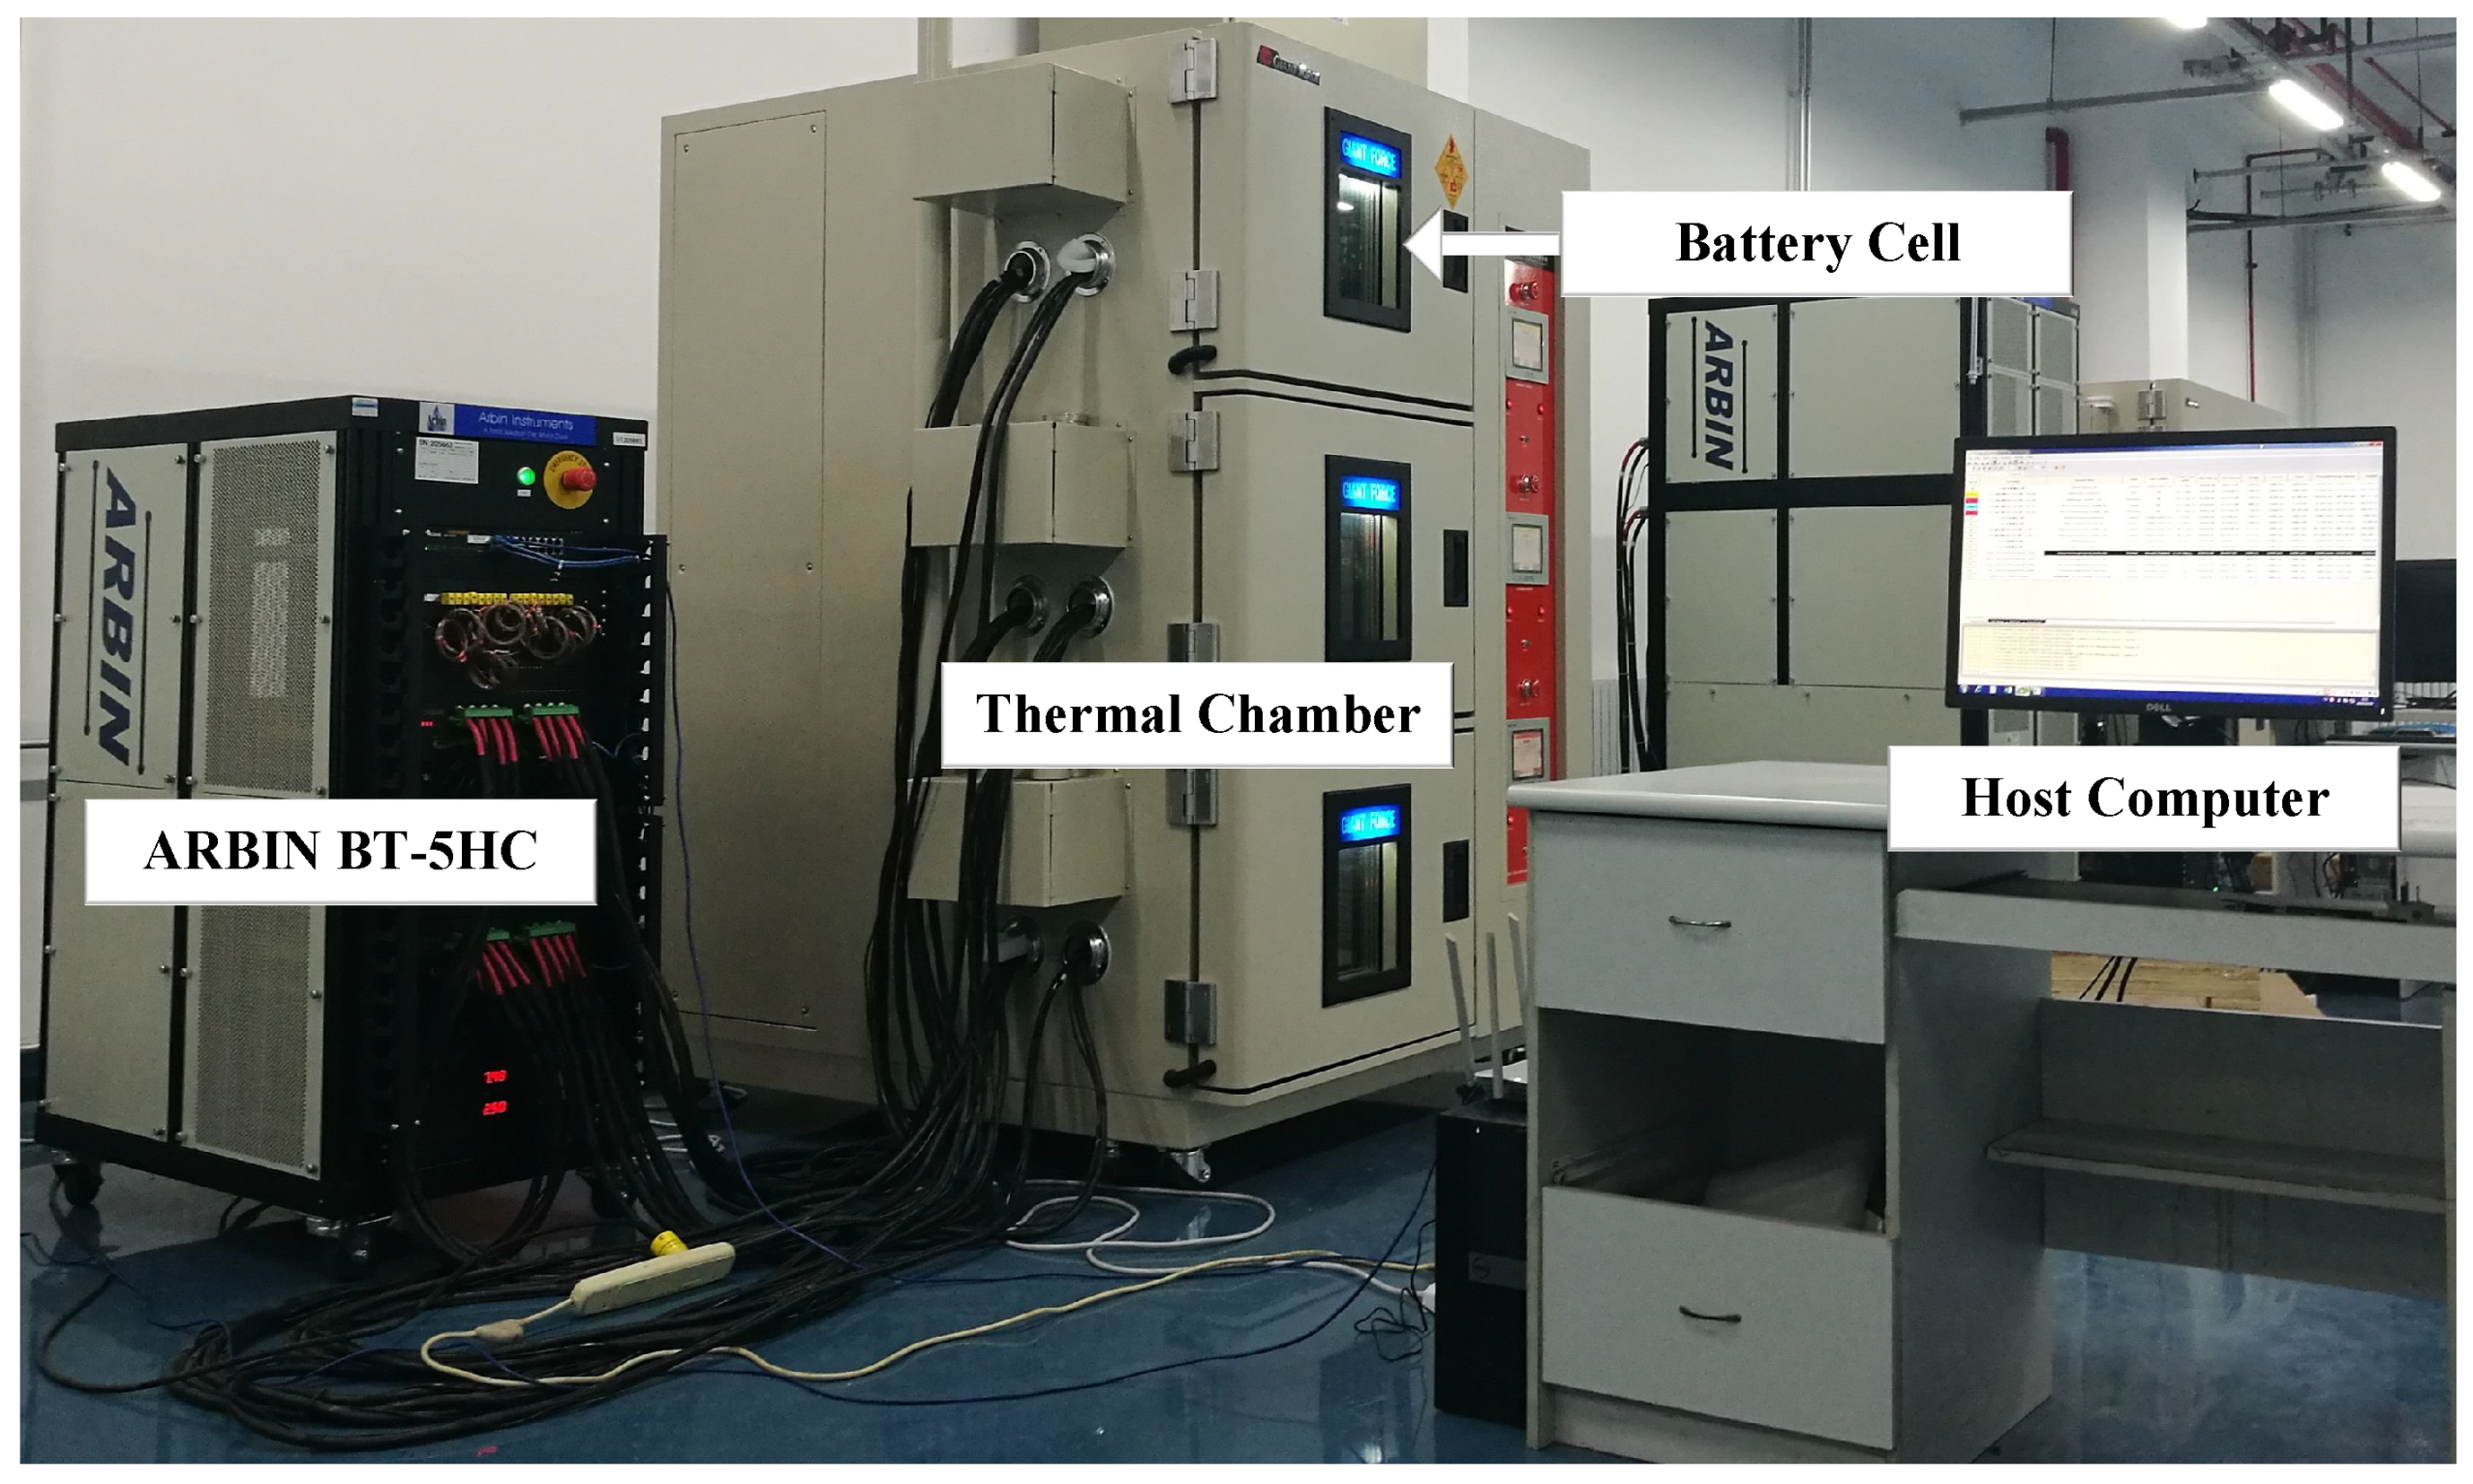
The measured outside characteristic data of batteries is vital for the parameter identification. However, because of the noise interference, the measured data cannot be obtained accurately, which leads to poor estimation accuracy of the model parameters. In order to restrain the noise, the voltage is reconstructed by the STRR method. Based on the convolution theorem, the relationship between the voltage U b and the current I b can be expressed as Equation (23) when the battery system is steady.
U b ( k ) = n = 0 g ( k n ) I b ( n ) = n = 0 g ( n ) I b ( k n ) ,
when the impulse function g is obtained, the terminal voltage signal U b can be reconstructed based on the current I b .
Assuming the noise value of kth sampling instant is ε ( k ) , at this time the measured voltage U m can be expressed as:
U m ( k ) = U b ( k ) + ε ( k ) = n = 0 g ( n ) I b ( k n ) + ε ( k ) .
Defining R u i as the correlation function between U m and I b can be expressed as:
R u i ( m ) = E { I b ( k m ) U m ( k ) } = E { I b ( k m ) ( n = 0 g ( n ) I b ( k n ) + ε ( k ) ) } = n = 0 g ( n ) R i i ( m n ) + E { I b ( k m ) ε ( k ) } ,
where R i i is the self-correlation function of I b .
Since the current I b and the noise ε are independent, the correlation function between them can be written as:
E { I b ( k m ) ε ( k ) } = 0 .
Therefore, the correlation function R u i can be expressed as:
R u i ( m ) = n = 0 g ( n ) R i i ( m n ) .
Then, the matrix form of Equation (27) can be expressed as:
R u i = φ i i g ,
where:
R u i = [ R u i ( 0 ) , R u i ( 1 ) , R u i ( 2 ) , . . . , R u i ( N 1 ) ] T ,
g = [ g ( 0 ) , g ( 1 ) , g ( 2 ) , . . . , g ( N 1 ) ] T ,
φ i i = R i i ( 0 ) , R i i ( 1 ) , , R i i ( N + 1 ) R i i ( 1 ) , R i i ( 0 ) , , R i i ( N + 2 ) R i i ( N 1 ) , R i i ( N 2 ) , , R i i ( 0 ) .
Therefore,
R u i ( 0 ) R u i ( 1 ) R u i ( N 1 ) = R i i ( 0 ) , R i i ( 1 ) , , R i i ( N + 1 ) R i i ( 1 ) , R i i ( 0 ) , , R i i ( N + 2 ) R i i ( N 1 ) , R i i ( N 2 ) , , R i i ( 0 ) × g ( 0 ) g ( 1 ) g ( N 1 ) ,
where N represents the sampling number.
When I b is pseudo random binarysequence (PRBS) signal, the period of PRBS can be expressed as:
N 1 = 2 n 1 ,
where n represents the stage number of the sequence.
The self-correlation function R i i can be expressed as:
R i i ( m ) = a 2 m = 0 a 2 N 1 1 m N 1 1 ,
where a represents the amplitude of the PRBS, and R i i is even function.
When the value of period N 1 is equal to the value of sampling number N, R i i can be expressed as:
R i i ( m ) = a 2 m = 0 a 2 N 1 m N 1 .
Substituting Equation (35) into Equation (31):
φ i i = a 2 , a 2 N , , a 2 N a 2 N , a 2 , , a 2 N a 2 N , a 2 N , , a 2 = a 2 N N , 1 , , 1 1 , N , , 1 1 , 1 , , N .
Therefore, Equation (28) can be written as:
g = φ i i 1 R u i .
R u i can be obtained based on Equation (38):
R u i ( m ) = 1 N n = 0 N 1 U m ( n ) I b ( n m ) .
The matrix form of Equation (38) can be written as follows:
R u i ( 0 ) R u i ( 1 ) R u i ( N 1 ) = I b ( 0 ) , I b ( 1 ) , , I b ( N + 1 ) I b ( 1 ) , I b ( 0 ) , , I b ( N + 2 ) I b ( N 1 ) , I b ( N 2 ) , , I b ( 0 ) × U m ( 0 ) U m ( 1 ) U m ( N 1 )
Then, substituting Equations (36) and (39) into Equation (37), the pulse function g can be obtained. Finally, the reconstructed voltage U r can be obtained based on the following equation:
U r ( k ) = n = 0 N 1 g ( k n ) I b ( n ) .

4. Experiment Setup

4.1. Battery Test Bench Setup

In order to validate the effect of the parameter identification based on the STRR method, the battery cell test bench setup is shown in Figure 2. It consists of a battery charging and discharging cycler ARBINBT-5HC, a host computer to program and store experimental data, a thermal chamber to regulate the operation temperature, and a LiNiMnCoO ternary lithium-ion battery cell. The voltage range of the battery cycler is 0–5 V, and the current range is −60–60 A. The testing accuracy of the current and voltage are both within 0.02%. The measured data is transmitted to the computer through TCP/IP ports. The battery cell is connected to the ARBINBT-5HC cycler and placed inside the thermal chamber. The specifications of the ternary lithium-ion battery are shown in Table 1.

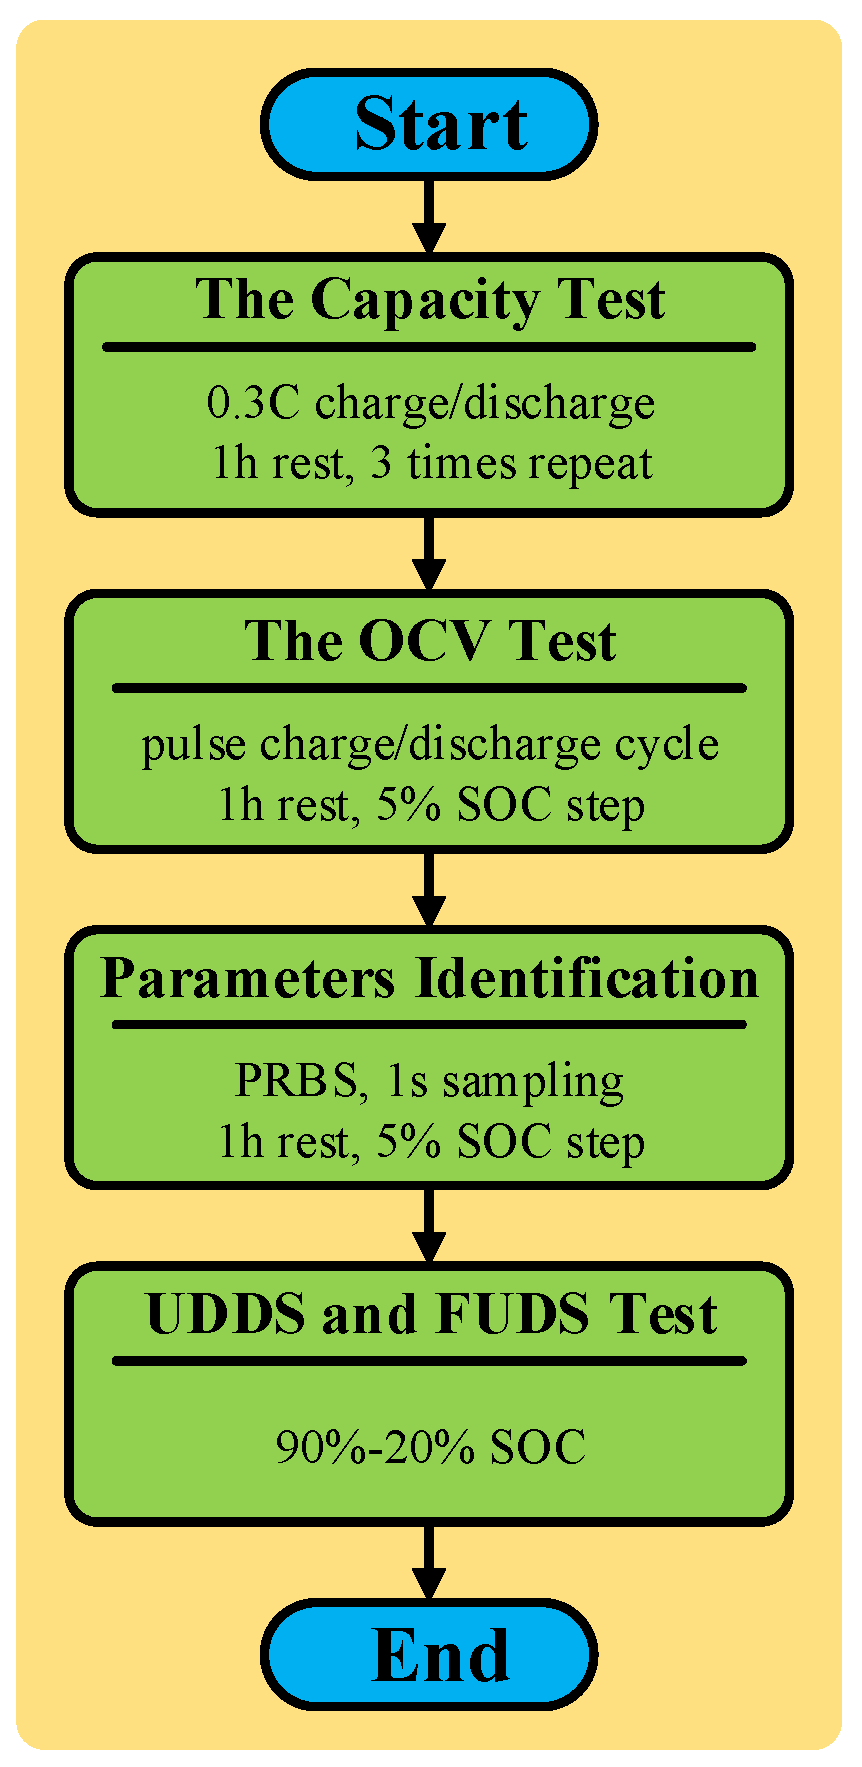
4.2. Battery Cell Test Scheme

The test procedure is shown in Figure 3. To verify the superiority of the proposed method, the battery test experiments are conducted at 25 °C and 40 °C, and the sampling interval is 1 s.
Firstly, the available capacity test is conducted. The test procedure consists of the following steps:
  • Charge the battery at 0.3 C constant current until the cell voltage reaches 4.2 V.
  • Charge the battery with constant voltage 4.2 V until the current reduces to 0.02 C.
  • Rest the battery for 1 h before discharging the battery cell.
  • Discharge the battery at the 0.3 C constant current until the discharging cut-off voltage is reached.
  • Repeat the above procedure three times, adopting the average value as the battery cell capacity.
In order to obtain the relationship map of OCV–SOC, the OCV test is carried out, and it consists of the following steps:
  • Charge the battery to fully charged state.
  • Discharge the battery 5% of the available capacity with the 0.3 C constant current.
  • Rest the battery for 1 h.
  • Repeat the above discharging and rest process until the battery discharging cut-off voltage is reached.
  • Take the opposite current for the charging process.
In order to simplify the relationship between OCV and SOC, the OCV is defined as the average value of the charge and discharge OCV. Figure 4 shows the OCV test result at 25 °C. The curve is fitted by nine-order polynomial, and the formula is expressed as:
O C V = 1843.14 S O C 9 8875.95 S O C 8 + 18048.43 S O C 7 20138.06 S O C 6 + 13414.64 S O C 5 5444.93 S O C 4 + 1324.41 S O C 3 185.01 S O C 2 + 14.40 S O C + 3.12 .
In order to identify the second-order ECM parameters, the PRBS excitation signal is conducted to collect the voltage and current data. When the sequence period N 1 is equal to the value of sampling number N, the self-correlation function of the current can be expressed as:
R i i ( n ) = a 2 T 0 T I b ( t ) I b ( t + n ) d t ,
where n = m Δ t, m = 0, 1, 2, ..., N 1 .
Then, the discrete expression of Equation (39) can be written as:
R i i ( m Δ t ) = a 2 N Δ t k = 0 N 1 I b ( k Δ t ) I b ( k Δ t + m Δ t ) Δ t .
When m = 0, the random sequence I b ( k Δ t ) I b ( k Δ t + m Δ t ) is equal to 1, therefore:
R i i ( m Δ t ) = a 2 .
When m = 1, 2, ..., N 1 , the following can be achieved:
R i i ( m Δ t ) = a 2 N Δ t k = 0 N 1 I b ( k Δ t ) I b ( k Δ t + m Δ t ) Δ t = a 2 N k = 0 N 1 I b ( k Δ t ) I b ( ( k + m ) Δ t ) .
It is proved that I b ( k Δ t ) I b ( k Δ t + m Δ t ) is still the PRBS, and over a period of time, the number of 1 which is the output of the new sequence is N 1 2 , and the number of 1 is N + 1 2 .
Therefore, Equation (45) can be expressed as:
R i i ( m Δ t ) = a 2 N k = 0 N 1 I b ( k Δ t ) I b ( ( k + m ) Δ t ) = a 2 N ( N 1 2 N + 1 2 ) = a 2 N .
The waveform of the self-correlation function of PRBS is shown in Figure 5.
When the clock time is twice as much as sampling time, the sampling number N is twice as much as the period of the sequence N 1 . The self-correlation function R i i can be written as:
R i i ( m ) = a 2 m = 0 ( N 1 1 ) a 2 2 N 1 m = 1 a 2 N 1 2 m N 1 .
In this paper, the stage number of the signal is set to 8. Therefore, the period is 255 s, which is expressed as N 1 = 2 8 1 . The sampling interval is 1 s, and the clock time is 2 s. Therefore, the sampling number is 510. The test current and voltage response waveforms of PRBS signal at 70% SOC at 25 °C are shown in Figure 6a,b, respectively.
When the battery is used in EVs, the current of battery may change drastically. Therefore, the Urban Dynamometer Driving Schedule (UDDS) and Federal Urban Driving Schedule (FUDS) tests are conducted to verify the modeling performance based on the proposed method. In the UDDS test, the battery cell is fully charged and then discharged 10% of the available capacity. When SOC drops below 20%, the test will be stopped, and the FUDS test has the same procedure.

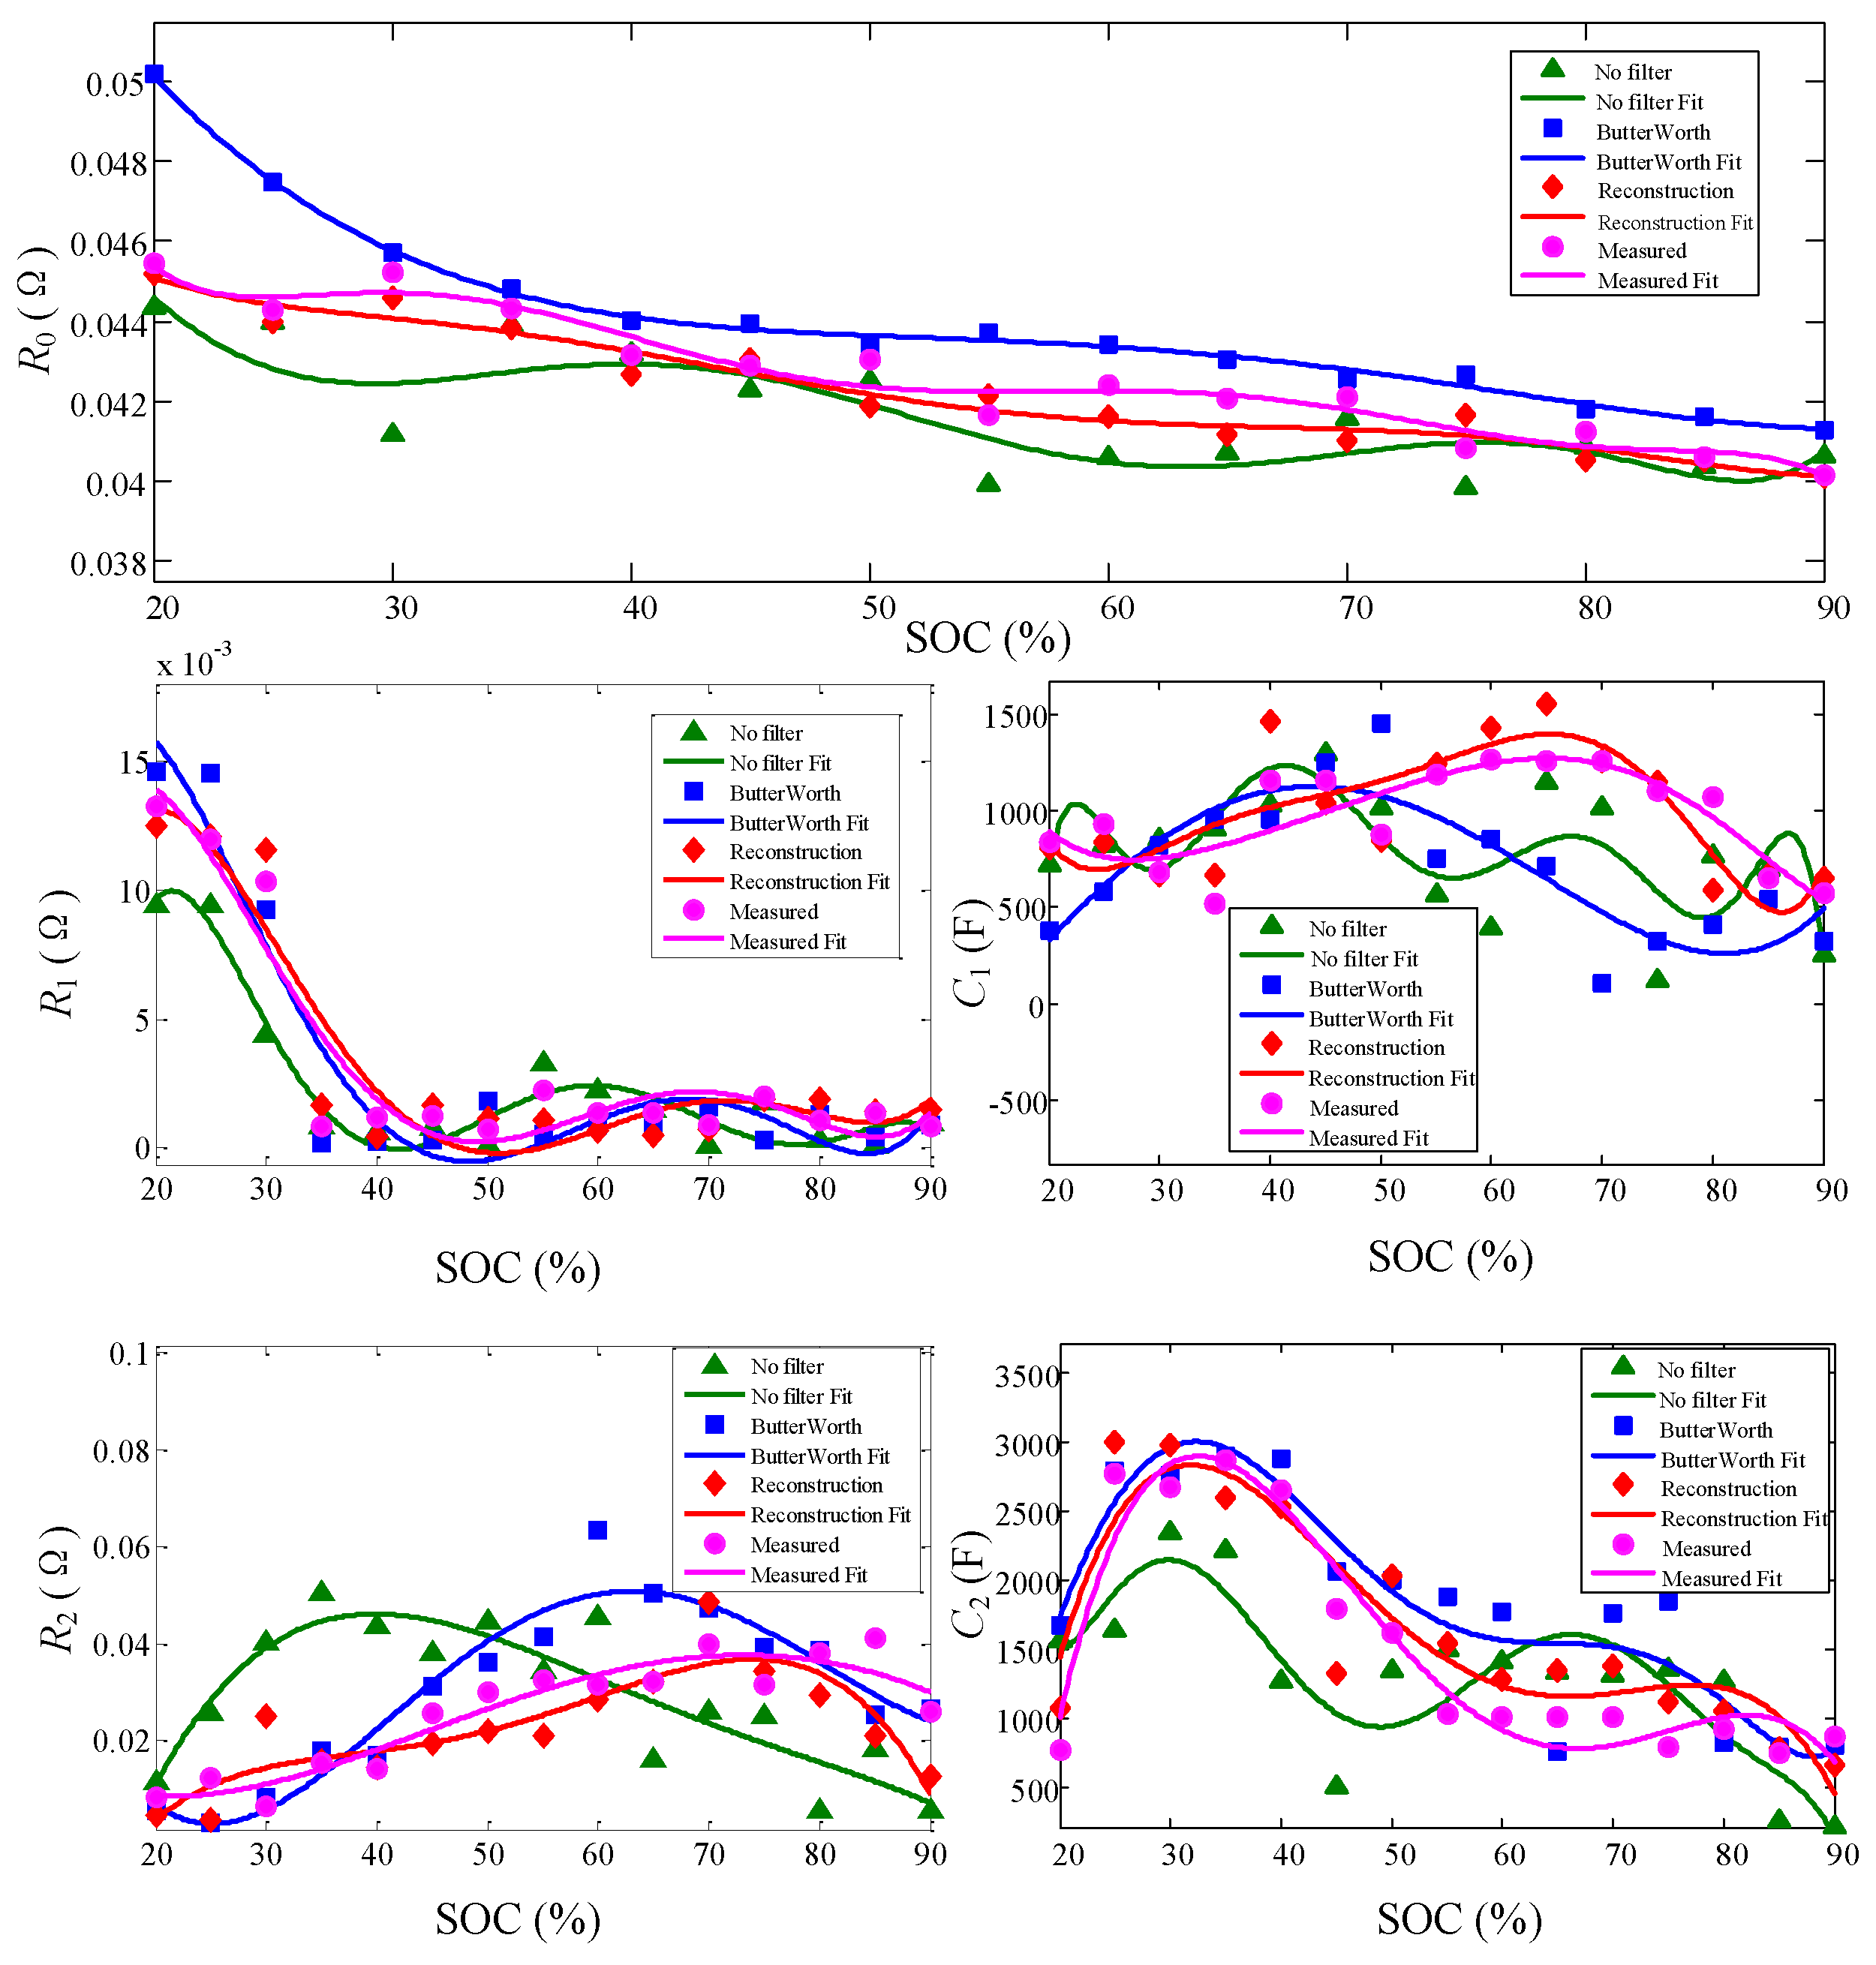
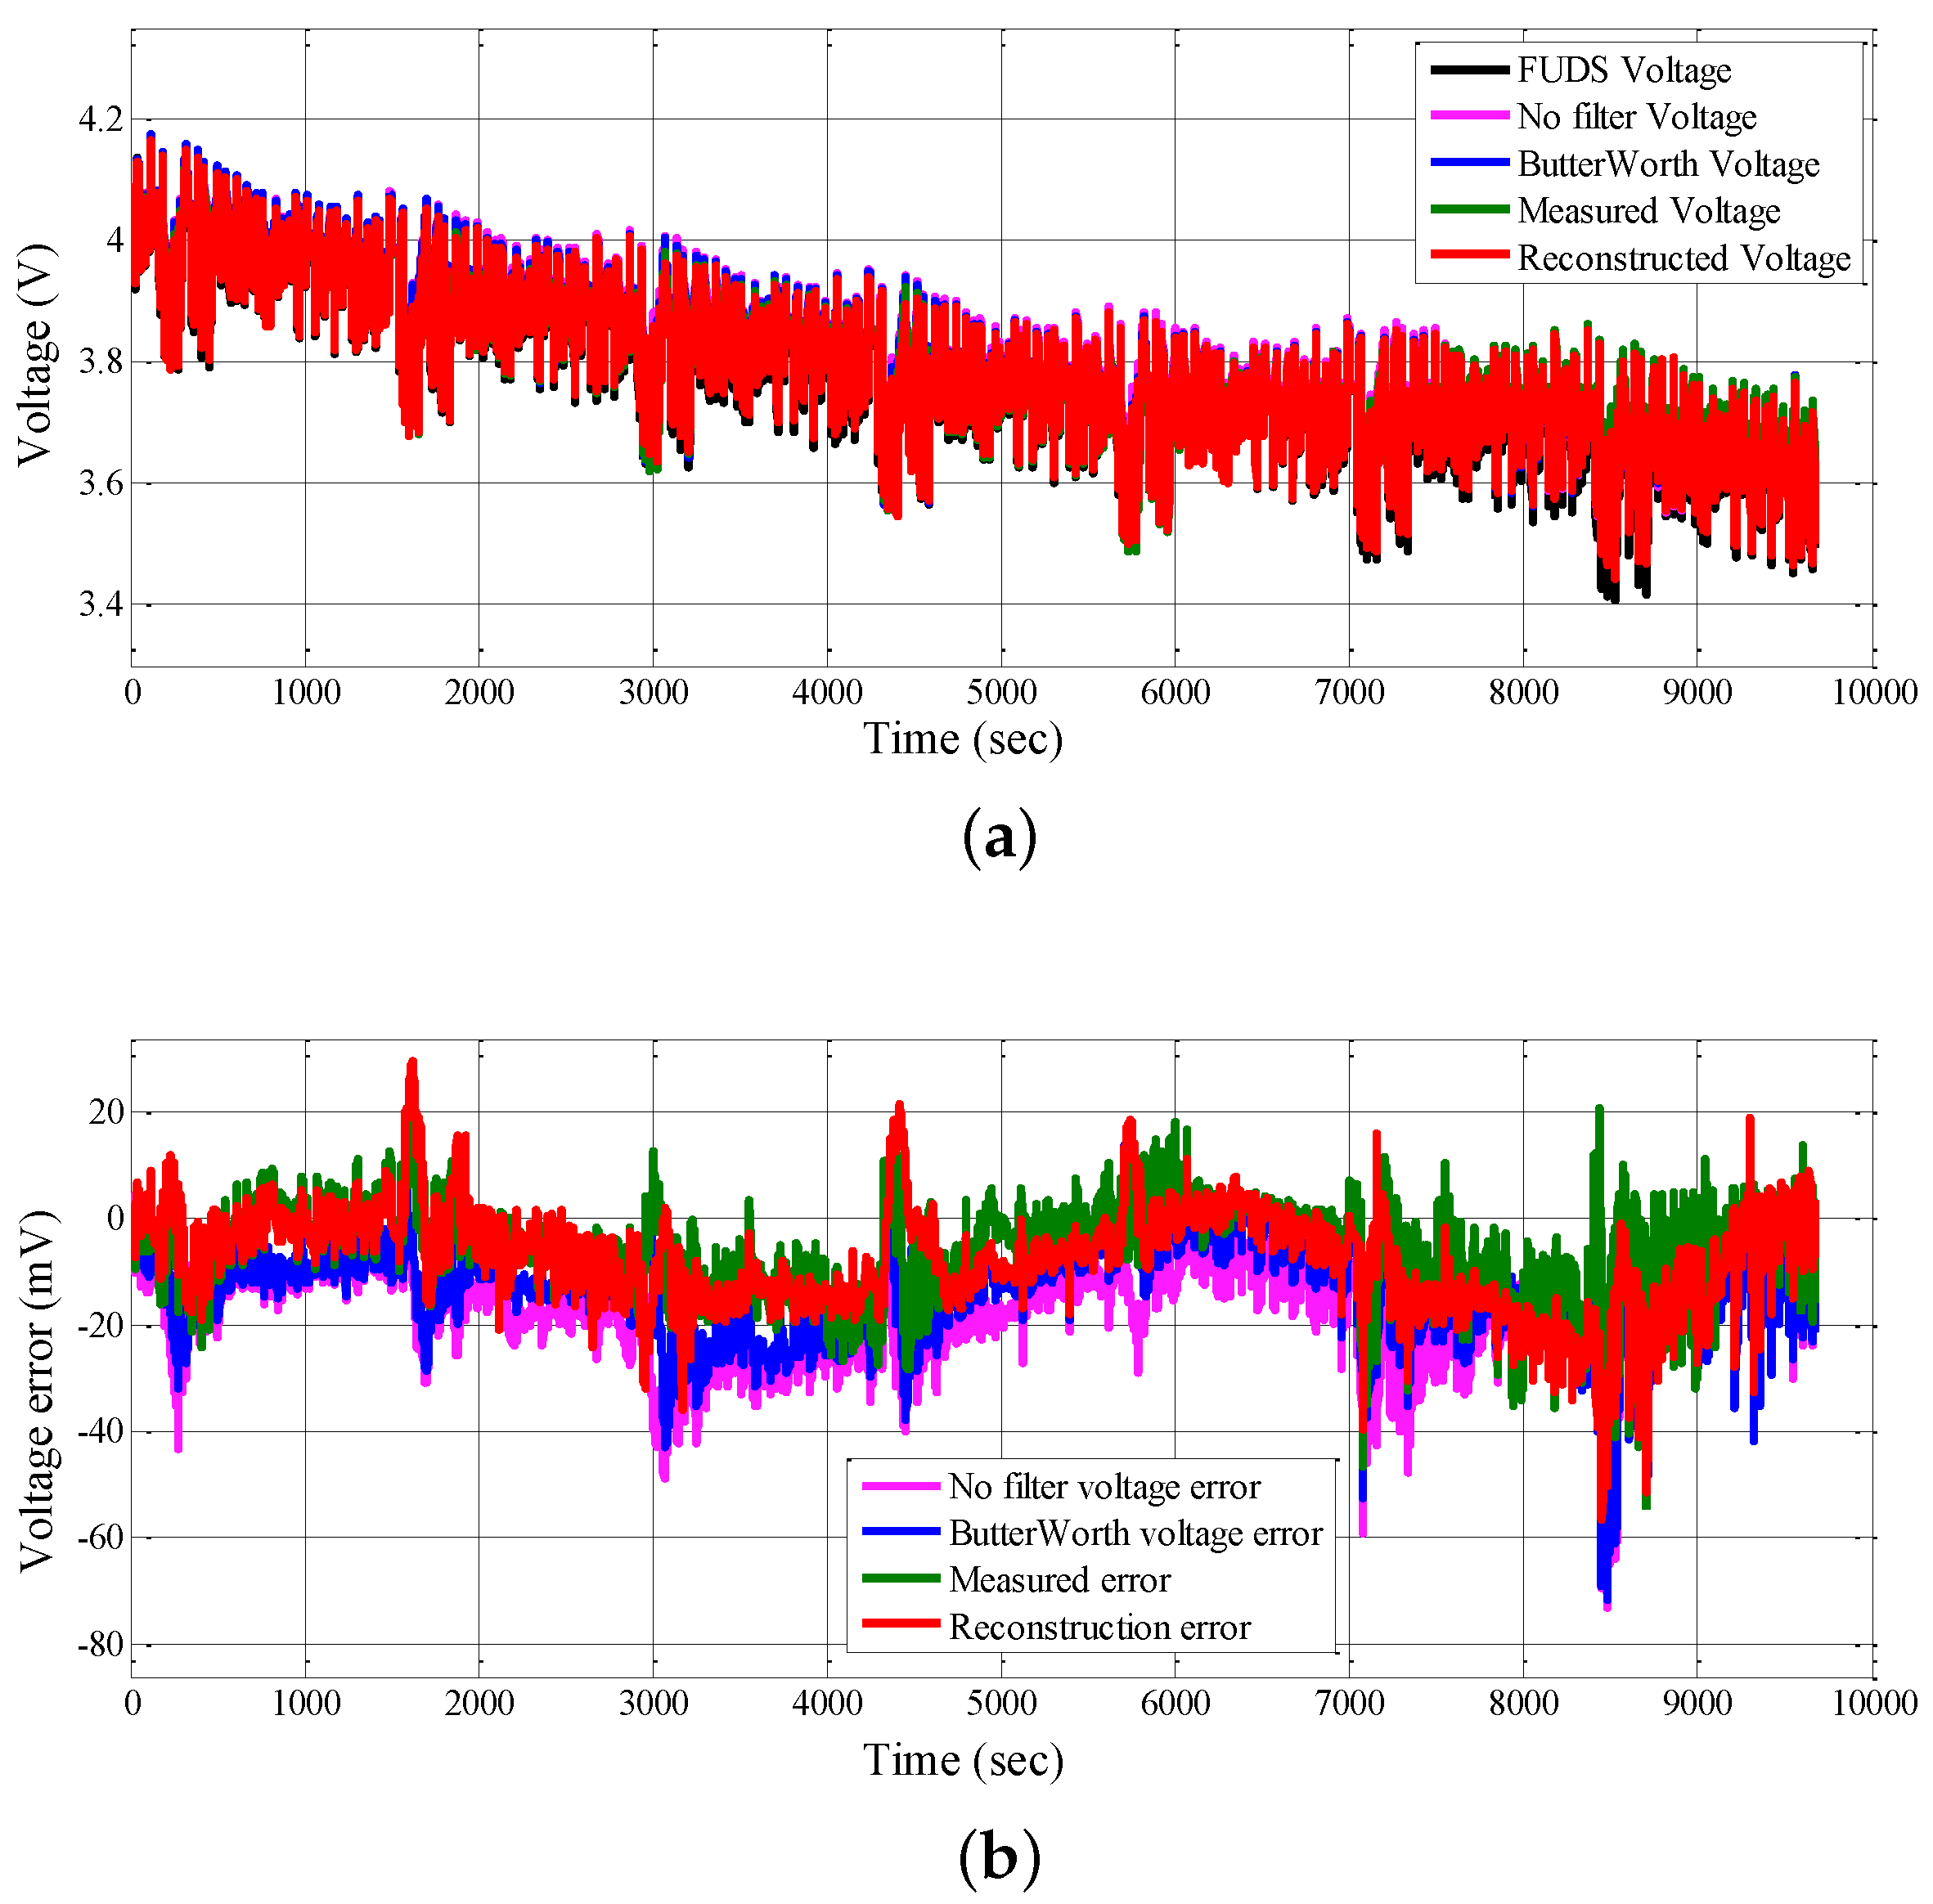
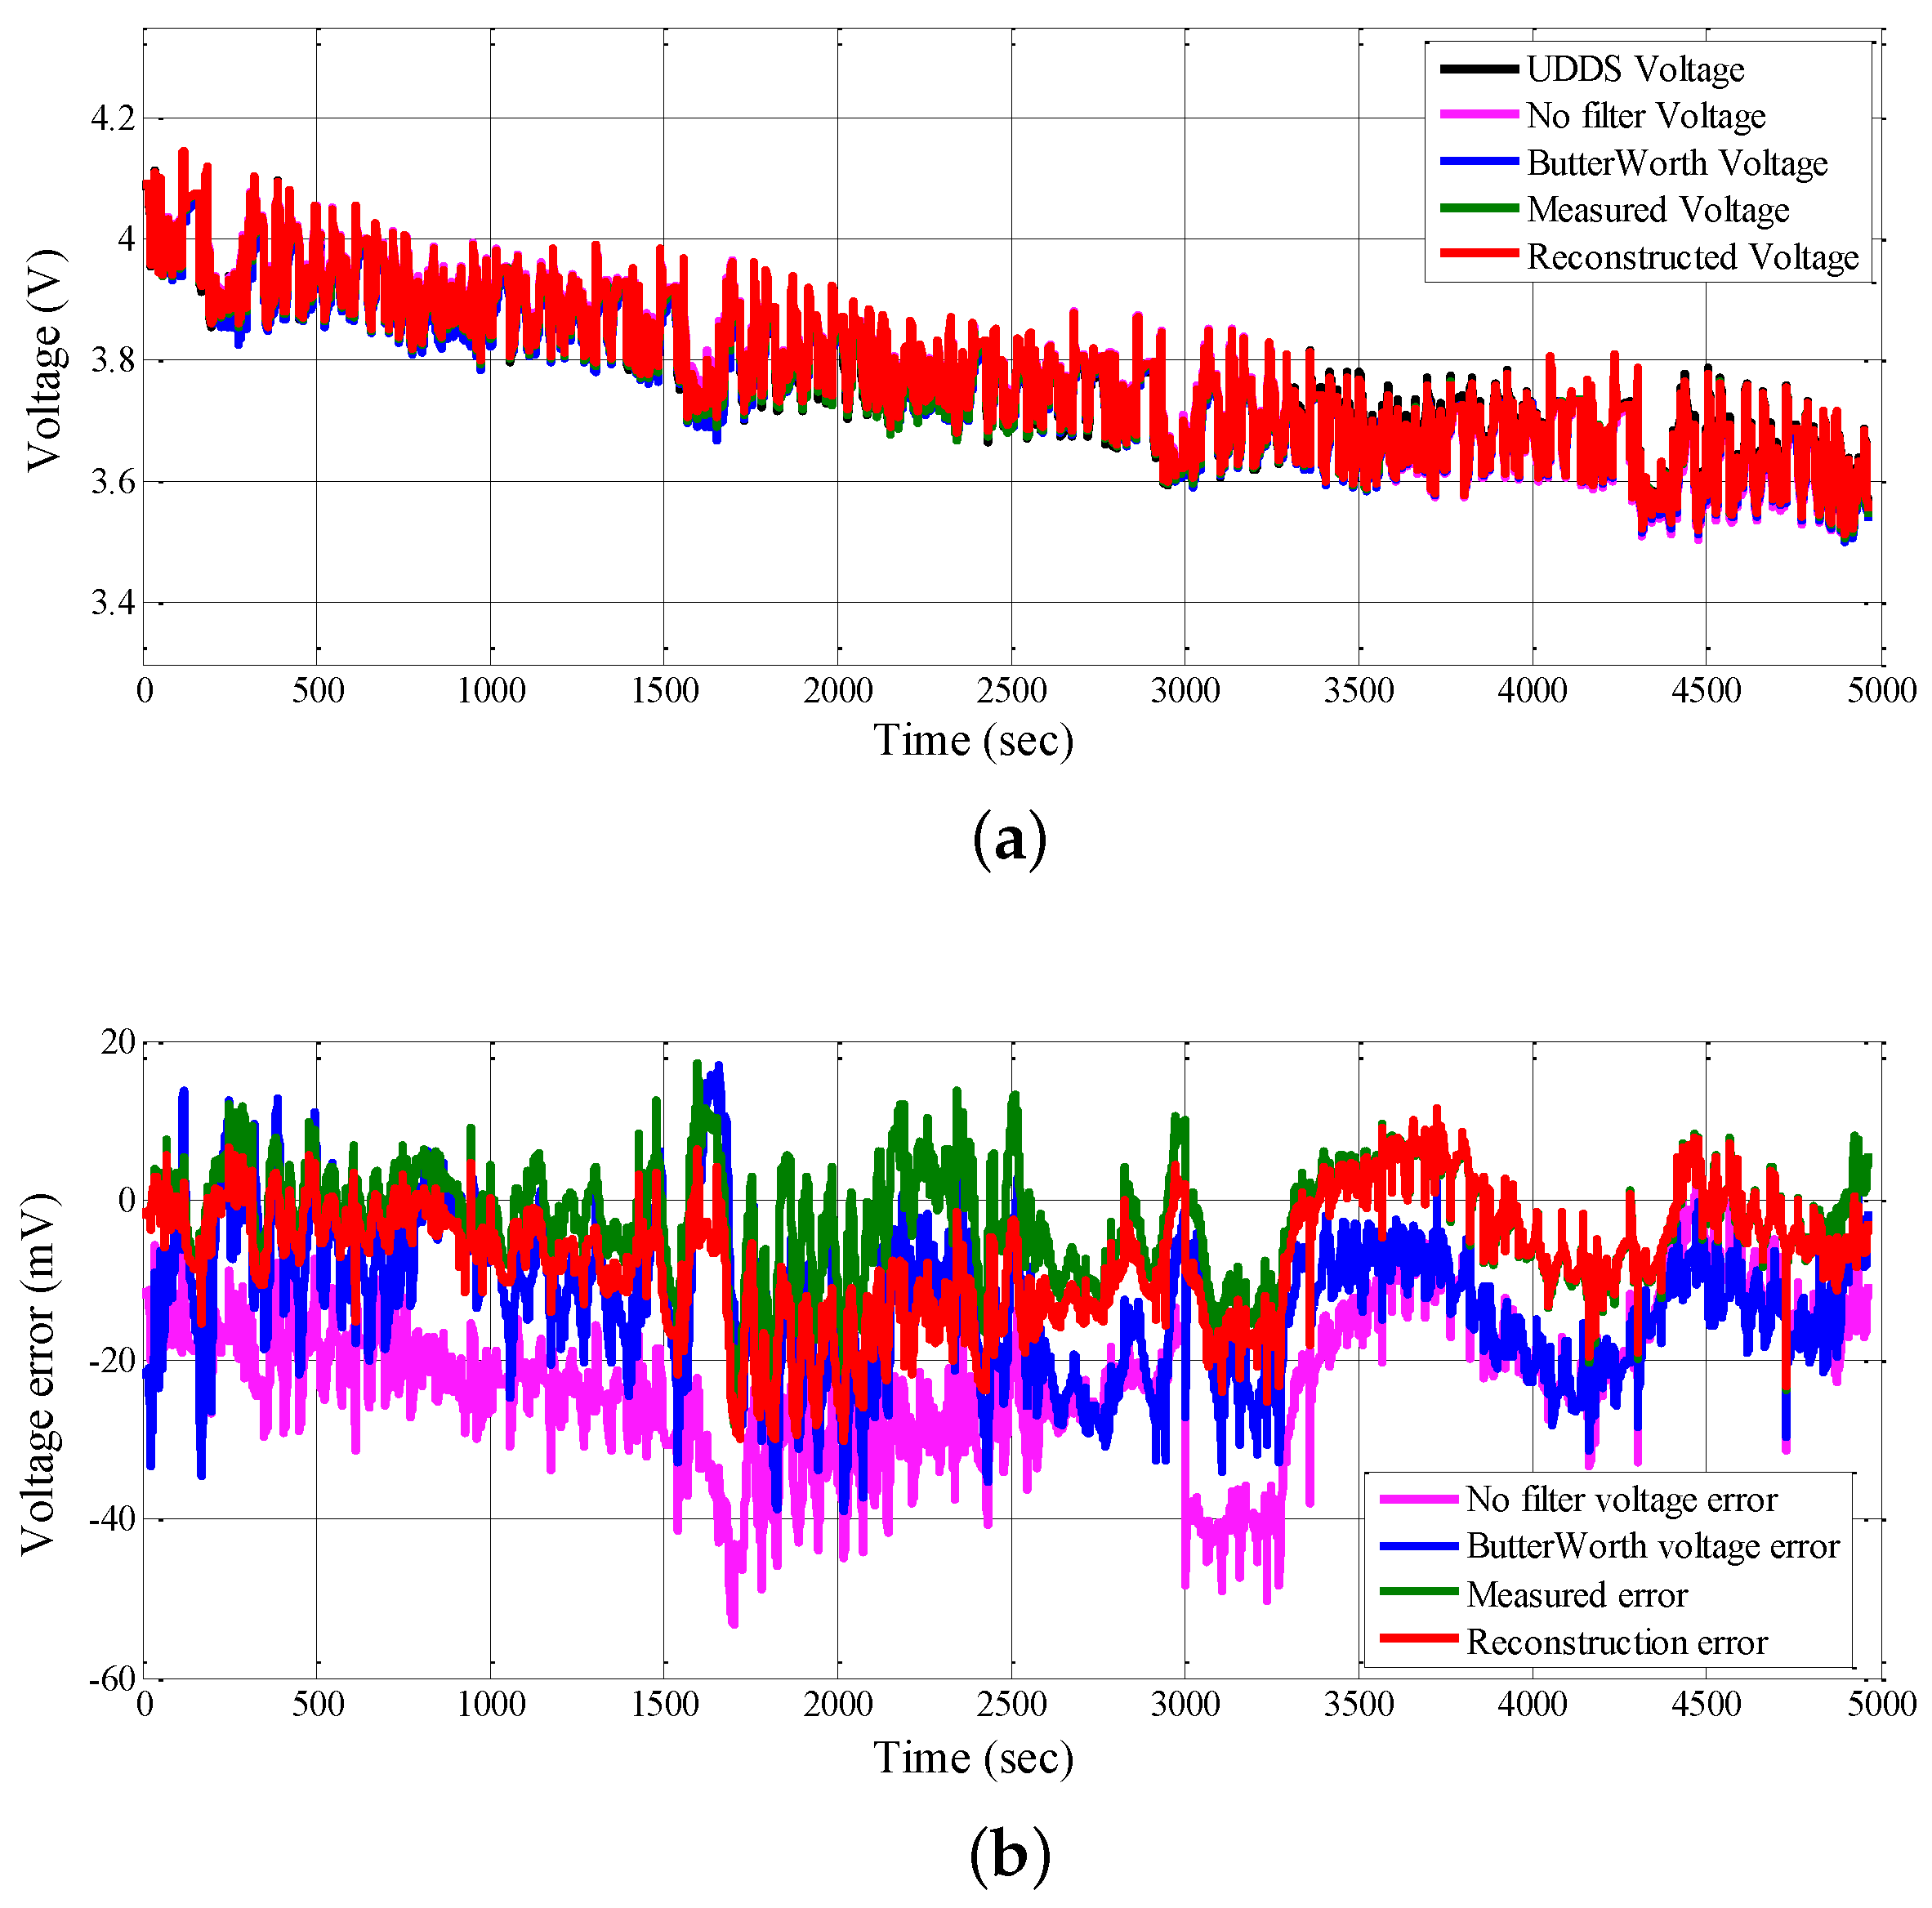
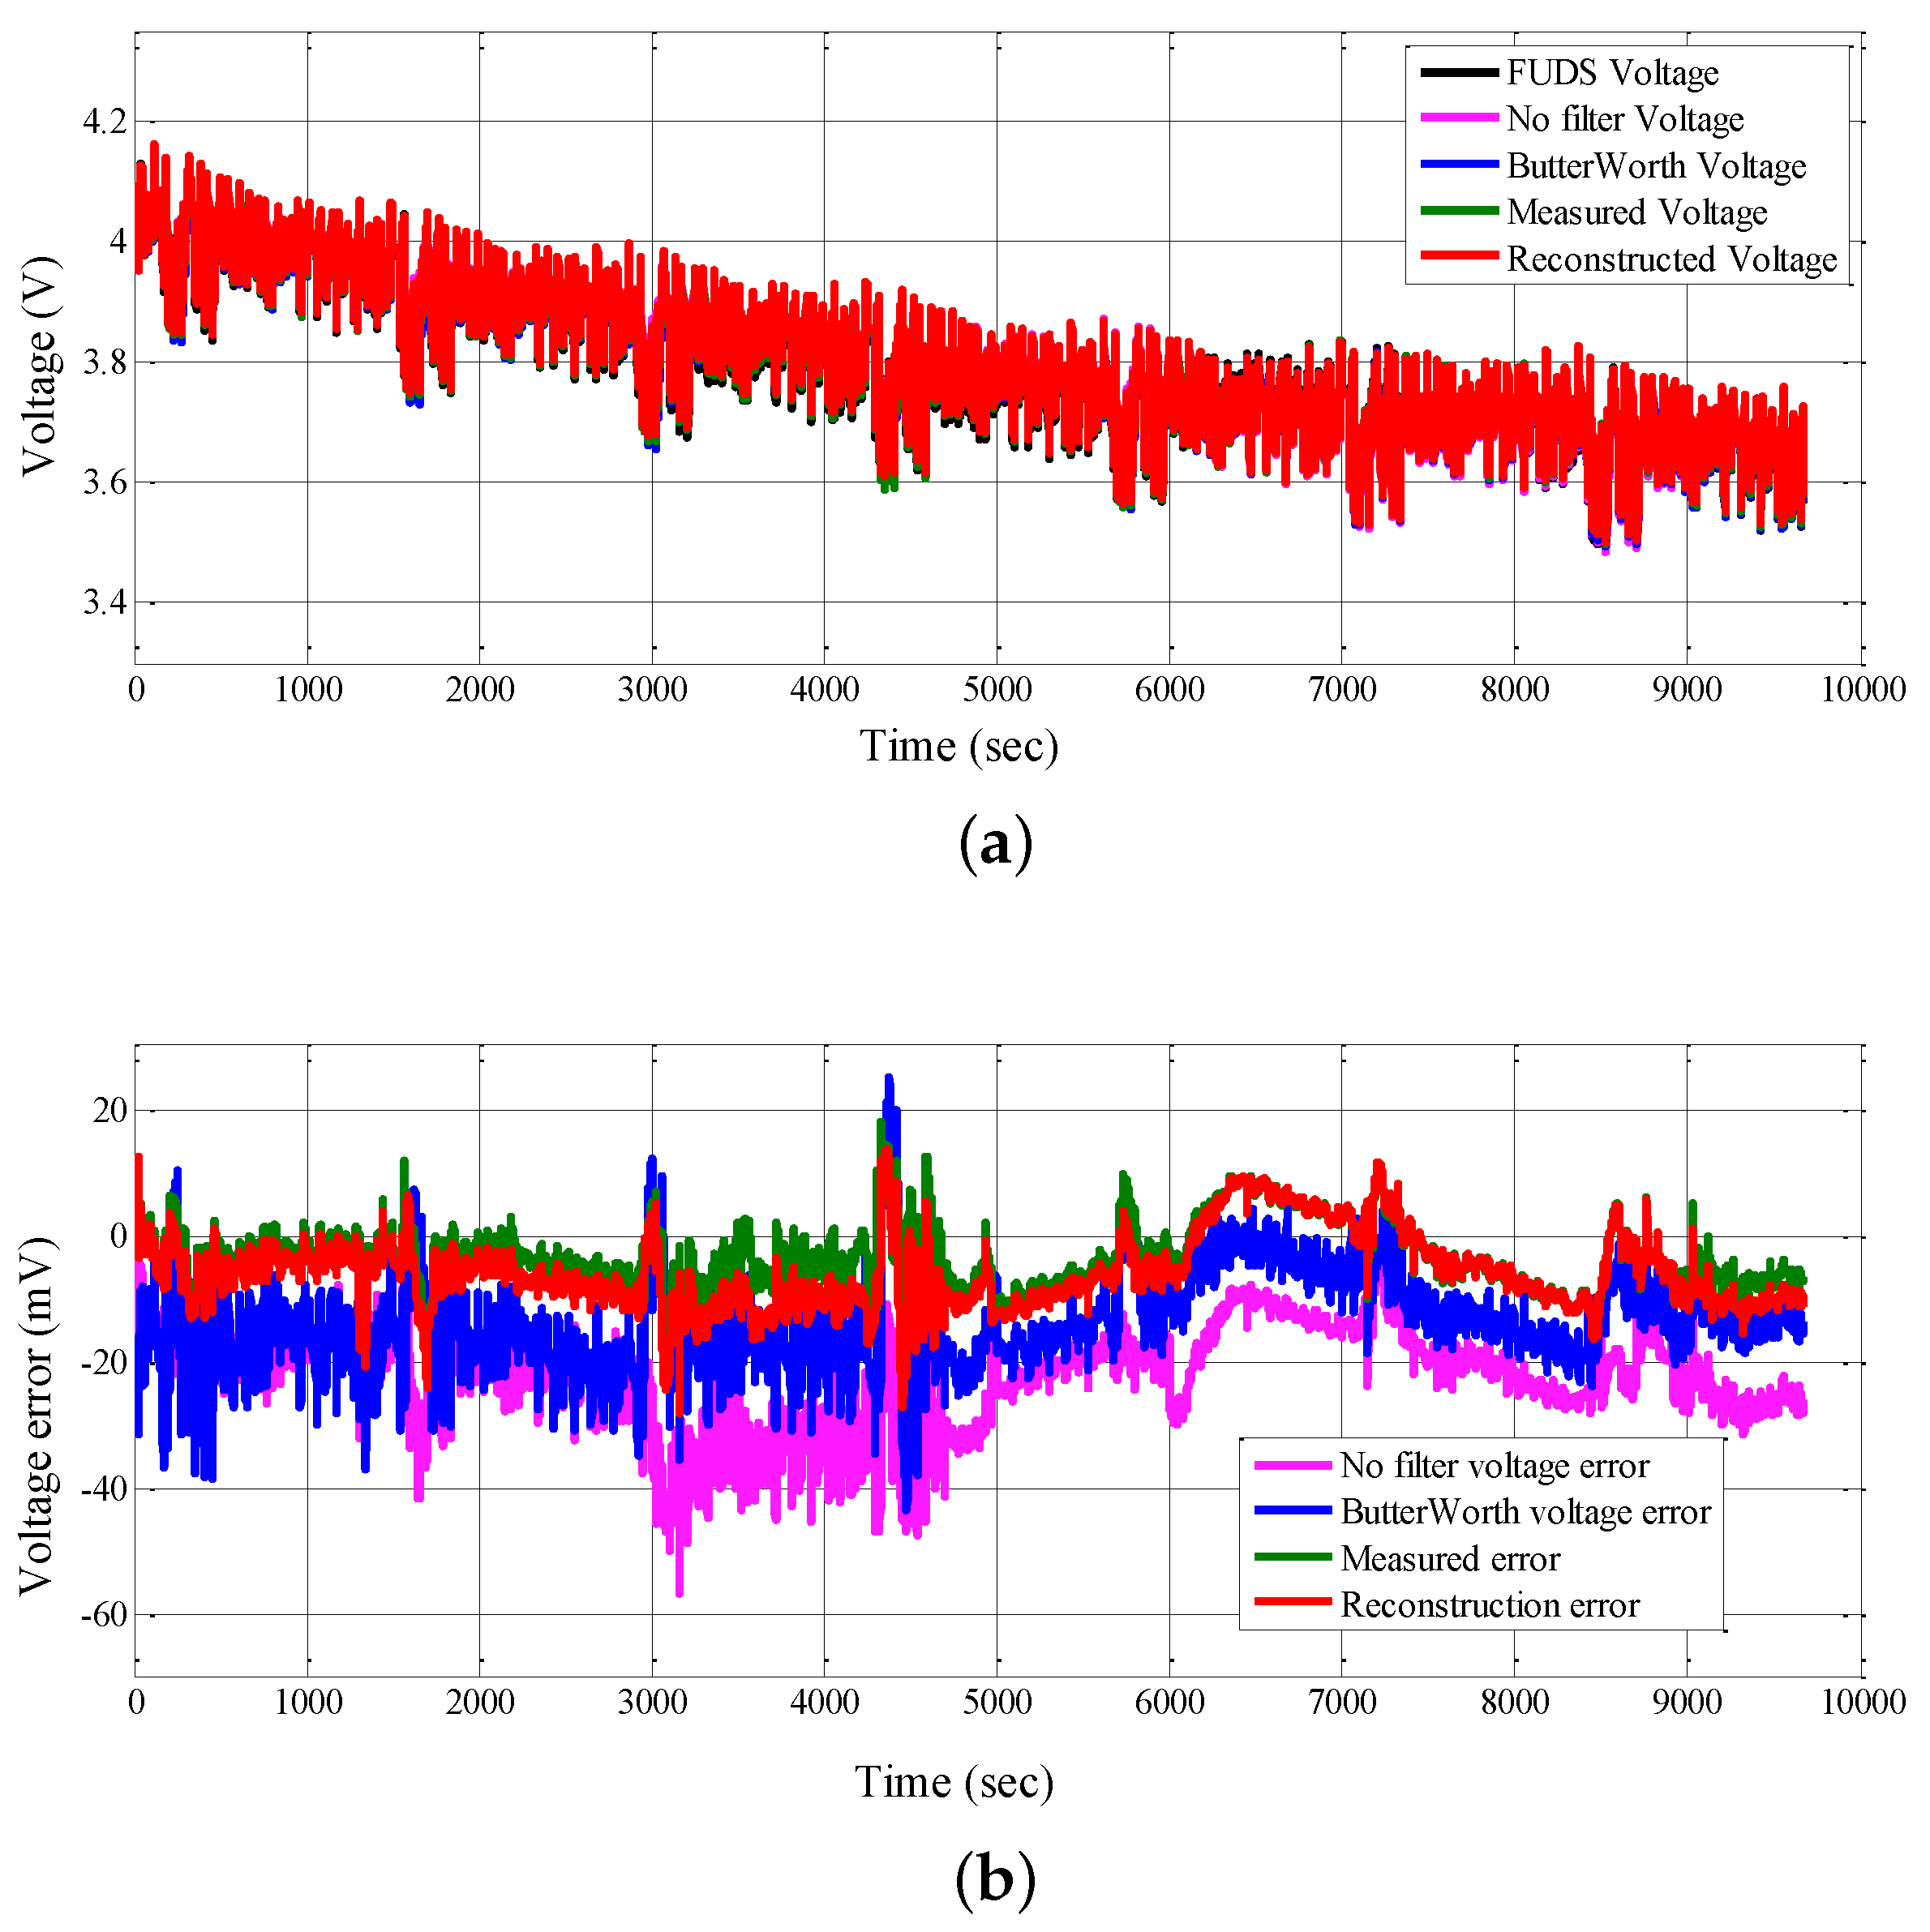
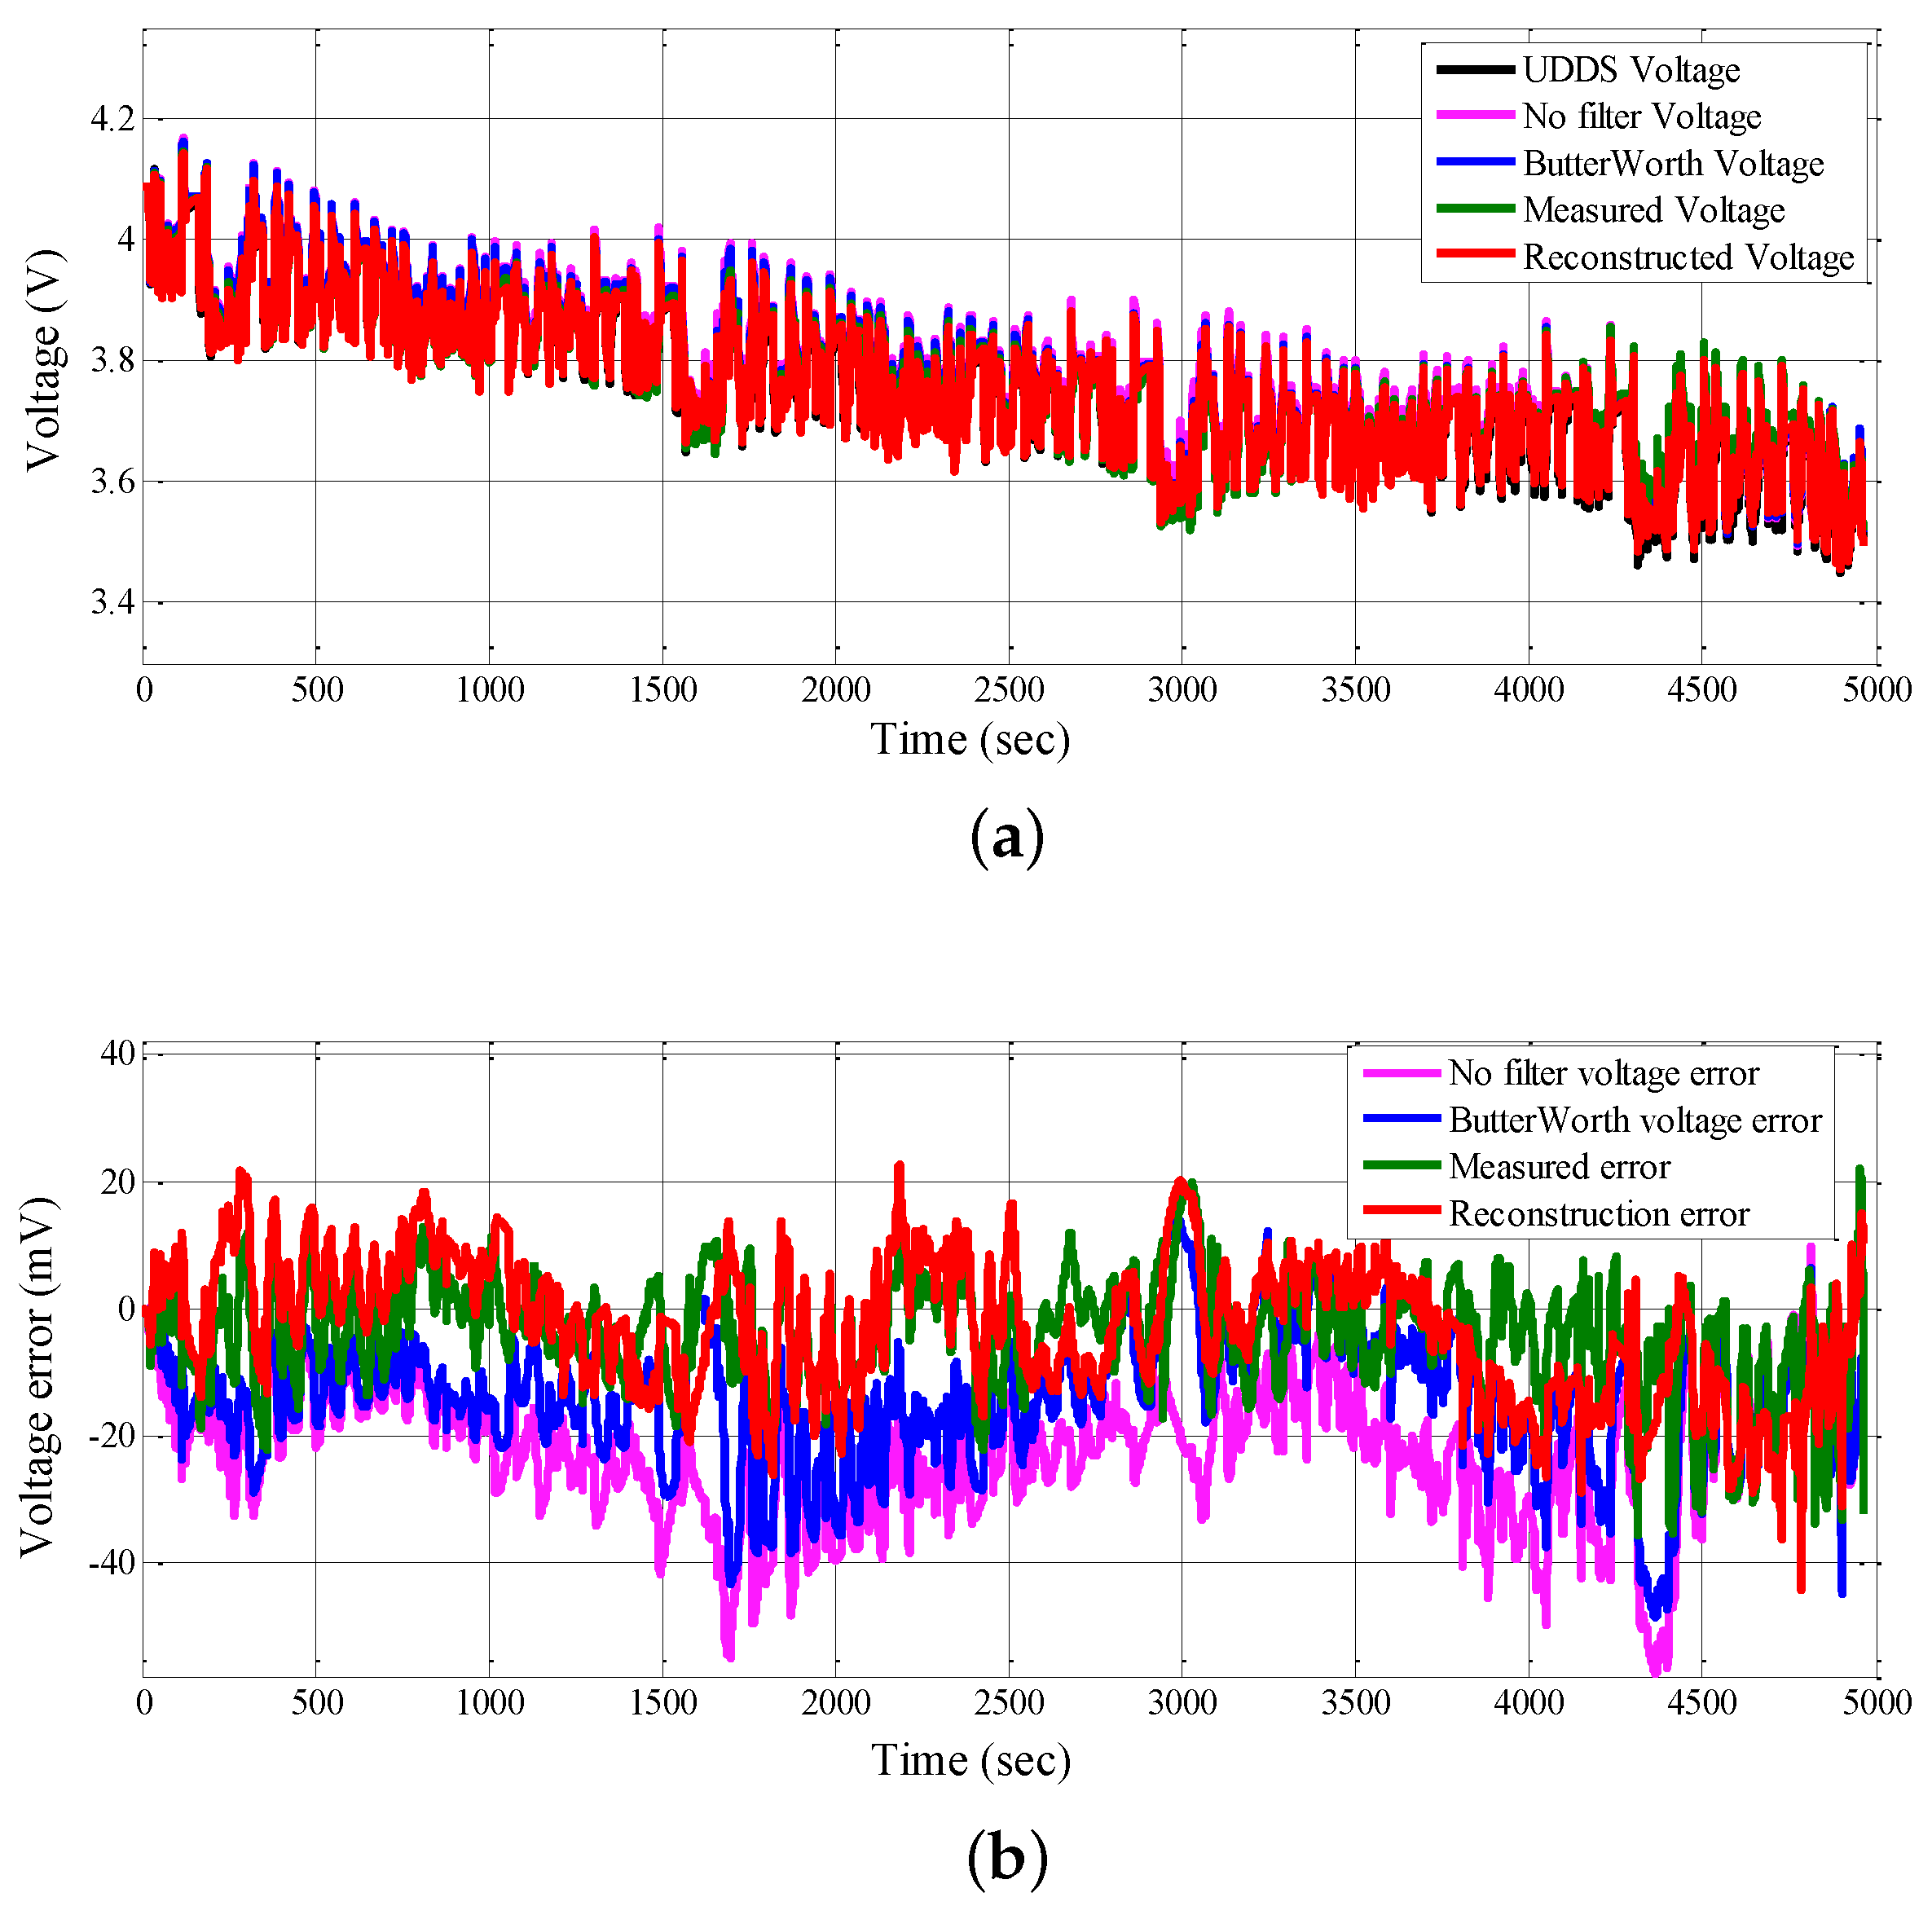
5. Experimental Results and Discussions

To verify the performance of the proposed method, the white noise with standard deviation σ v = 8 mV is applied to the measured PRBS test voltage response. Then, the battery cell voltage is reconstructed by the STRR method based on the measured current and the noisy voltage. Besides, the first-order Butterworth low-pass filter with the cut-off frequency of 0.267 Hz is also designed to filter the white noise, which is used to compare with the reconstructed voltage to verify the performance of the STRR method.
As shown in Figure 7, the measured voltage, the noisy voltage, the filtered voltage, and the reconstructed voltage are compared under the PRBS signal at 70% SOC at 25 °C. As shown in Figure 7a, the noise can be restrained by the Butterworth filter; however, the phase and the amplitude of the filtered voltage are changed. These changes make the voltage distortion and greatly affect the accuracy of model parameter identification. On the contrary, the noise is restrained effectively in the reconstructed voltage, which maintains the authenticity of the real voltage well. The errors between different voltages and the measured voltage are shown in Figure 7b. Obviously, on the whole, the error between the reconstructed voltage and the measured voltage is minimal compared with the others, which indicates that the reconstructed voltage is closer to the true value.
The RLS method is used to identify the second-order ECM parameters based on the noisy voltage, the filtered voltage, the reconstructed voltage, and the measured voltage, respectively. The identified model parameters under different SOCs and voltages at 25 °C are shown in Figure 8. In order to observe the changing trend of parameters more clearly, the method of polynomial fitting is used to make the curve of parameters smooth. It can be seen that R 0 and R 1 decrease as the SOC increases, and the values of R 0 and R 1 identified by different voltages are similar. R 2 , C 1 , and C 2 have a similar tendency, which increases first and then decreases. As shown in Figure 8, the parameters identified by the reconstructed voltage and the measured voltage are similar, which can demonstrate the effectiveness of the proposed method.
The PRBS test current reported in Figure 6a has been applied to a single battery cell, and the corresponding cell voltage has been measured, as shown in Figure 8b, which is called “measured voltage”. On the basis of the theory presented, a single OCV model has been derived and four groups of parameter values of the RC model have been derived: no filter, Butterworth, reconstruction, and measured, as shown in Figure 8. Then the UDDS test current is applied to the same battery cell, and the measured output voltage is called “UDDS voltage” and compared with the voltages derived from the models: no filter model, Butterworth model, reconstruction model, and measured model. Figure 9a shows the “UDDS voltage” and simulated voltage results under the UDDS test at 25 °C, where the simulated voltage signals are close to the “UDDS voltage”. Therefore, they can accurately simulate the battery dynamical characteristics. As shown in Figure 9b, the modeling performance of the proposed method outperforms the Butterworth filter method, on the whole. Figure 10 shows the simulated voltage results and errors under the FUDS test, which indicates the same conclusion as Figure 9.
This paper adopted the mean absolute error (MAE), the root mean square error (RMSE), and the maximum error (ME) to quantitatively compare the modeling accuracy based on different voltages, which can be written as Equations (48)–(50).
M A E = 1 N k = 1 N | U k U ^ k | ,
R M S E = 1 N k = 1 N ( U k U ^ k ) 2 ,
M E = | U k U ^ k | m a x ,
where U k is the measured voltage, and U ^ k is the simulated voltage. U n o m is the battery rated nominal voltage, and N is the sampling number. The quantitative error metrics of different voltages under the UDDS and the FUDS tests at 25 °C are listed in Table 2.
As shown in Table 2, the MAE, RMSE, and ME of the measured voltage under the UDDS test are 7.1 mV, 9.4 mV, and 35.5 mV, respectively. The MAE, RMSE, and ME of the measured voltage under the FUDS test are 7.7 mV, 10.3 mV, and 54.7 mV, respectively. Compared to the others, the modeling errors of the measured voltage are minimal. Taking the modeling errors of the measured voltage as the benchmark, the modeling errors of the reconstructed voltage are closest to the benchmark, and then the errors shown in Table 2 are used to quantitatively verify the effectiveness of the proposed method.
According to Table 2, the MAE, RMSE, and ME of the reconstructed voltage is reduced by approximately 40.3%, 38.4%, and 14.3%, respectively, compared with the MAE, RMSE, and ME of the filtered voltage under the UDDS test. In addition, under the FUDS test, compared with the MAE, RMSE, and ME of the filtered voltage, the MAE, RMSE, and ME of the reconstructed voltage is reduced by approximately 30.9%, 36.5%, and 21.1% , respectively.
In order to validate the effectiveness of the proposed method, the experiment was also carried out at 40 °C. Figure 11 and Figure 12 show the simulated voltage results and errors under the UDDS test and the FUDS test at 40 °C, respectively. Table 3 shows the quantitative error metrics of different voltages under the UDDS and FUDS tests at 40 °C. Also, as shown in Table 3, the modeling errors of the measured voltage are minimal, and the the modeling errors of the reconstructed voltage is closest to them.
The MAE, RMSE, and ME of the reconstructed voltage is reduced by approximately 36.9%, 34%, and 23.1% compared with the MAE, RMSE, and ME of the filtered voltage, respectively, under the UDDS test. Under the FUDS test, the MAE, RMSE, and ME of the reconstructed voltage is reduced by approximately 48.6%, 46.4%, and 35.7% , respectively, compared with the MAE, RMSE, and ME of the filtered voltage.
These results indicate that the STRR method can eliminate the noise and effectively improve the modeling accuracy.

6. Conclusions

Due to the noise interference, the measured battery voltage cannot be obtained accurately, which leads to poor estimation accuracy of model parameters. Therefore, this paper proposed a method named stochastic theory response reconstruction, or STRR, to eliminate the noise and ensure high-precision model parameter identification. The battery voltage is reconstructed by applying the stochastic theory. Compared with the traditional solution using the low-pass filter, the STRR method need not select the optimal cut-off frequency and order, and it can effectively restrain the noise. Moreover, the model parameters can be accurately identified based on the reconstructed voltage.
The experimental results at different temperatures show that the reconstructed voltage has higher modeling precision compared with the low-pass filtering method. Taking the modeling errors based on the measured voltage as the benchmark, the modeling accuracy of the reconstructed voltage and filtered voltage is then compared. Under the UDDS test at 25 °C, the MAE, RMSE, and ME of the reconstructed voltage is reduced by approximately 40.3%, 38.4% and 14.3% in comparison with that of the filtered voltage. The MAE, RMSE, and ME of the reconstructed voltage is reduced by approximately 30.9%, 36.5% and 21.1%, respectively, under the FUDS test. At 40°C, similar conclusions can be drawn.
Therefore, the STRR method can eliminate the noise interference effectively and ensure high precision model parameter identification.

Author Contributions

Conceptualization, F.W. and B.D.; Funding acquisition, B.D. and C.Z.; Methodology, F.W.; Project administration, B.D. and C.Z.; Validation, F.W. and R.Z.; Writing—original draft, F.W.; Writing—review & editing, B.D., C.Z., R.Z., Y.S. and J.Z.

Funding

This research work is supported by the National Key Research and Development Program of China (No. 2018YFB0104000), National Natural Science Foundation of China (No. 61527809, U1764258, 61633015).

Conflicts of Interest

The authors declare no conflict of interest.

Abbreviations

The following abbreviations are used in this manuscript:
STRRstochastic theory response reconstruction
ECMequivalent circuit model
DCdirect current
ACalternating current
EISelectrochemical impedance spectroscopy
RLSrecursive least squares
PRBSpseudo random binarysequence
UDDSUrban Dynamometer Driving Schedule
FUDSFederal Urban Driving Schedule
EVselectric vehicles
BMSbattery management ststem
SOCstate of charge
SOHstate of health
SOPstate of power
OCVopen circuit voltage
MAEmean absolute error
RMSEmean absolute error

References

  1. Lievre, A.; Sari, A.; Venet, P.; Hijazi, A.; Ouattarabrigaudet, M.; Pelissier, S. Practical online estimation of lithium-ion battery apparent series resistance for mild hybrid vehicles. IEEE Trans. Veh. Technol. 2016, 65, 4505–4511. [Google Scholar] [CrossRef]
  2. Xia, B.; Chen, C.; Tian, Y.; Wang, M.; Sun, W.; Xu, Z. State of charge estimation of lithium-ion batteries based on an improved parameter identification method. Energy 2015, 90, 1426–1434. [Google Scholar] [CrossRef]
  3. Hannan, M.A.; Lipu, M.S.H.; Hussain, A.; Mohamed, A. A review of lithium-ion battery state of charge estimation and management system in electric vehicle applications: Challenges and recommendations. Renew. Sustain. Energy Rev. 2017, 78, 834–854. [Google Scholar] [CrossRef]
  4. Shang, Y.; Zhang, Q.; Cui, N.; Zhang, C. A cell-to-cell equalizer based on three-resonant-state switched-capacitor converters for series-connected battery strings. Energies 2017, 10, 206. [Google Scholar] [CrossRef]
  5. Gao, Z.; Chin, C.; Chiew, J.; Jia, J.; Zhang, Z. Design and Implementation of a Smart Lithium-Ion Battery System with Real-Time Fault Diagnosis Capability for Electric Vehicles. Energies 2017, 10, 1503. [Google Scholar] [CrossRef]
  6. Wang, Y.; Zhang, C.; Chen, Z. A method for state-of-charge estimation of LiFePO4 batteries at dynamic currents and temperatures using particle filter. J. Power Sources 2015, 279, 306–311. [Google Scholar] [CrossRef]
  7. Rivera-Barrera, J.P.; Muñoz-Galeano, N.; Sarmiento-Maldonado, H.O. SoC estimation for lithium-ion batteries: Review and future challenges. Electronics 2017, 6, 102. [Google Scholar] [CrossRef]
  8. Lai, X.; Yi, W.; Zheng, Y.; Zhou, L. An all-region state-of-charge estimator based on global particle swarm optimization and improved extended kalman filter for lithium-ion batteries. Electronics 2018, 7, 321. [Google Scholar] [CrossRef]
  9. Ko, S.T.; Ahn, J.H.; Lee, B.K. Enhanced equivalent circuit modeling for li-ion battery using recursive parameter correction. J. Electr. Eng. Technol. 2018, 13, 1147–1155. [Google Scholar]
  10. Zhou, Y.; Huang, M. On-board capacity estimation of lithium-ion batteries based on charge phase. J. Electr. Eng. Technol. 2018, 13, 733–741. [Google Scholar]
  11. Kim, T.; Qiao, W. A hybrid battery model capable of capturing dynamic circuit characteristics and nonlinear capacity effects. IEEE Trans. Energy Convers. 2011, 26, 1172–1180. [Google Scholar] [CrossRef]
  12. He, H.; Xiong, R.; Guo, H.; Li, S. Comparison study on the battery models used for the energy management of batteries in electric vehicles. Energy Convers. Manag. 2012, 64, 113–121. [Google Scholar] [CrossRef]
  13. Manwell, J.; McGowan, J. Lead acid battery storage model for hybrid energy systems. Sol. Energy 1993, 50, 399–405. [Google Scholar] [CrossRef]
  14. Zhu, R.; Duan, B.; Zhang, C.; Gong, S. Accurate lithium-ion battery modeling with inverse repeat binary sequence for electric vehicle applications. Appl. Energy 2019, 251, 113339. [Google Scholar] [CrossRef]
  15. Zhang, Q.; Li, Y.; Shang, Y.; Duan, B.; Cui, N.; Zhang, C. A fractional-Order kinetic battery model of lithium-Ion batteries considering a nonlinear capacity. Electronics 2019, 8, 394. [Google Scholar] [CrossRef]
  16. Hu, X.; Li, S.; Zhang, C.; Peng, H. A comparative study of equivalent circuit models for Li-ion batteries. J. Power Sources 2012, 198, 359–367. [Google Scholar] [CrossRef]
  17. Gao, Z.; Chin, C.; Toh, W.; Chiew, J.; Jia, J. State-of-Charge Estimation and Active Cell Pack Balancing Design of Lithium Battery Power System for Smart Electric Vehicle. J. Adv. Transp. 2017, 2017, 6510747. [Google Scholar] [CrossRef]
  18. Gao, Z.; Chin, C.; Woo, W.; Jia, J. Integrated Equivalent Circuit and Thermal Model for Simulation of Temperature-Dependent LiFePO4 Battery in Actual Embedded Application. Energies 2017, 10, 85. [Google Scholar] [CrossRef]
  19. Orcioni, S.; Buccolini, L.; Ricci, A.; Conti, M. Lithium-ion Battery Electrothermal Model, Parameter Estimation, and Simulation Environment. Energies 2017, 10, 375. [Google Scholar] [CrossRef]
  20. Rumpf, K.; Naumann, M.; Jossen, A. Experimental investigation of parametric cell-to-cell variation and correlation based on 1100 commercial lithium-ion cells. J. Energy Storage 2017, 14, 224–243. [Google Scholar] [CrossRef]
  21. Barai, A.; Uddin, K.; Dubarry, M.; Somerville, L.; McGordon, A.; Jennings, P.; Bloom, I. A comparison of methodologies for the non-invasive characterisation of commercial Li-ion cells. Prog. Energy Combust. Sci. 2019, 72, 1–37. [Google Scholar] [CrossRef]
  22. Hessam, M.; Alexey, P.; Ole, M. Joint unscented Kalman filter for state and parameter estimation in managed pressure drilling. In Proceedings of the 2013 European Control Conference (ECC), Zurich, Switzerland, 17–19 July 2013; pp. 1645–1650. [Google Scholar]
  23. Dai, H.; Wei, X.; Sun, Z.; Wang, J.; Gu, W. Online cell SOC estimation of Li-ion battery packs using a dual time-scale Kalman filtering for EV applications. Appl. Energy 2012, 95, 227–237. [Google Scholar] [CrossRef]
  24. Zhang, X.; Wang, Y.; Yang, D.; Chen, Z. An on-line estimation of battery pack parameters and state-of-charge using dual filters based on pack model. Energy 2016, 115, 219–229. [Google Scholar] [CrossRef]
  25. Pei, L.; Zhu, C.; Wang, T.; Lu, R.; Chan, C. Online peak power prediction based on a parameter and state estimator for lithium-ion batteries in electric vehicles. Energy 2014, 66, 766–778. [Google Scholar] [CrossRef]
  26. Xiong, R.; Sun, F.; Gong, X.; Gao, C. A data-driven based adaptive state of charge estimator of lithium-ion polymer battery used in electric vehicles. Appl. Energy 2014, 113, 1421–1433. [Google Scholar] [CrossRef]
  27. Guo, X.; Kang, L.; Yao, Y.; Huang, Z.; Li, W. Joint estimation of the electric vehicle power battery state of charge based on the least squares method and the kalman filter algorithm. Energies 2016, 9, 100. [Google Scholar] [CrossRef]
  28. Song, Z.; Ho, J.; Hofmann, H.; Lin, X.; Sun, J. Parameter identification and maximum power estimation of battery/supercapacitor hybrid energy storage system based on cramer-rao bound analysis. IEEE Trans. Power Electron. 2019, 34, 4831–4843. [Google Scholar] [CrossRef]
  29. Allafi, W.; Uddin, K.; Zhang, C.; Sha, R.; Marco, J. On-line scheme for parameter estimation of nonlinear lithium ion battery equivalent circuit models using the simplified refined instrumental variable method for a modified Wiener continuous-time model. Appl. Energy 2017, 204, 497–508. [Google Scholar] [CrossRef]
  30. Zhang, Z.; Cheng, X.; Lu, Z. SOC estimation of lithium-Ion batteries with AEKF and wavelet transform matrix. IEEE Trans. Power Electron. 2017, 32, 7626–7634. [Google Scholar] [CrossRef]
  31. Huang, C.; Chow, T.; Chow, M. Li-ion battery parameter identification with low pass filter for measurement noise rejection. In Proceedings of the 26th IEEE International Symposium on Industrial Electronics, Edinburgh, UK, 18–21 Jun 2017; pp. 2075–2080. [Google Scholar]
  32. Baronti, F.; Zamboni, W.; Femia, N.; Rahimi-Eichi, H.; Roncella, R.; Rosi, S.; Saletti, R.; Chow, M. Parameter identification of Li-Po batteriesin electric vehicles: A comparative study. In Proceedings of the 2013 IEEE International Symposium on Industrial Electronics, Taipei, Taiwan, 28–31 May 2013. [Google Scholar]
  33. Liaw, B.Y.; Nagasubramanian, G.; Jungst, R.G.; Doughty, D.H. Modeling of lithium ion cells—A simple equivalent-circuit model approach. Solid State Ion. 2004, 175, 835–839. [Google Scholar]
  34. Liaw, B.Y.; Dubarry, M. From driving cycle analysis to understanding battery performance in real-life electric hybrid vehicle operation. J. Power Sources 2007, 174, 76–88. [Google Scholar] [CrossRef]
  35. Andre, D.; Meiler, M.; Steiner, K.; Wimmer, C.; Soczka-Guth, T.; Sauer, D.U. Characterization of high-power lithium-ion batteries by electrochemical impedance spectroscopy. I. Experimental investigation. J. Power Sources 2011, 196, 5334–5341. [Google Scholar] [CrossRef]
  36. Blanco, C.; Sánchez, L.; González, M.; Antón, J.C.; García, V.; Viera, J.C. An equivalent circuit model with variable effective capacity for lifepo4 batteries. IEEE Trans. Veh. Technol. 2014, 63, 3592–3599. [Google Scholar] [CrossRef]
  37. Hu, Y.; Yurkovich, S. Linear parameter varying battery model identification using subspace methods. J. Power Sources 2011, 196, 2913–2923. [Google Scholar] [CrossRef]
Figure 1. Second-order equivalent circuit model (ECM).
Electronics 08 00834 g001
Figure 2. Battery cell test bench.
Electronics 08 00834 g002
Figure 3. Battery cell test scheme. OCV = open circuit voltage; SOC = state of charge; PRBS = pseudo random binary sequence; UDDS = Urban Dynamometer Driving Schedule; FUDS = Federal Urban Driving Schedule.
Electronics 08 00834 g003
Figure 4. The OCV–SOC curve at 25 °C.
Electronics 08 00834 g004
Figure 5. The self-correlation function of random sequence.
Electronics 08 00834 g005
Figure 6. PRBS excitation signal test at 25 °C. (a) PRBS test current waveform at 70% SOC. (b) PRBS test voltage response waveform at 70% SOC.
Electronics 08 00834 g006
Figure 7. Comparison of the measured, noisy, filtered, and reconstructed voltages. (a) Comparison of different voltage waveforms. (b) Errors between different voltages and measured voltage.
Electronics 08 00834 g007
Figure 8. Model parameter variations with different methods at 25 °C.
Electronics 08 00834 g008
Figure 9. Simulated voltage results and errors under UDDS test at 25 °C. (a) Comparison of the UDDS voltage and simulated voltages under UDDS test. (b) Simulated voltage errors with different methods under UDDS test.
Electronics 08 00834 g009
Figure 10. Simulated voltage results and errors under FUDS test at 25 °C. (a) Comparison of the FUDS voltage and simulated voltages under FUDS test. (b) Simulated voltage errors with different methods under FUDS test.
Electronics 08 00834 g010
Figure 11. Simulated voltage results and errors under UDDS test at 40 °C. (a) Comparison of the UDDS voltage and simulated voltages under UDDS test. (b) Simulated voltage errors with different methods under UDDS test.
Electronics 08 00834 g011
Figure 12. Simulated voltage results and errors under FUDS test at 40 °C. (a) Comparison of the FUDS voltage and simulated voltages under FUDS test. (b) Simulated voltage errors with different methods under FUDS test.
Electronics 08 00834 g012
Table 1. Specifications of the ternary lithium-ion battery cell.
TypeNominal Capacity (Ah)Nominal Voltage (V)Discharge Cut-Off Voltage (V)Charge Cut-Off Voltage (V)
186502.53.634.2
Table 2. Error statistics of different voltages under the UDDS and FUDS tests at 25 °C. MAE = mean absolute error (MAE); RSME = root mean square error; ME = maximum error.
MethodUDDSFUDS
MAE [mV]RMSE [mV]ME [mV]MAE [mV]RMSE [mV]ME [mV]
No filter22.624.857.517.619.973.2
ButterWorth14.917.751.613.916.671.9
Measured7.19.435.57.710.354.7
Reconstruction8.910.944.29.612.256.7
Table 3. Error statistics of different voltages under the UDDS and FUDS tests at 40 °C.
MethodUDDSFUDS
MAE [mV]RMSE [mV]ME [mV]MAE [mV]RMSE [mV]ME [mV]
No filter22.424.353.32223.356.3
Butterworth13.415.63913.815.343.4
Measured5.67.128.35.36.323.9
Reconstruction8.110.3307.18.227.9

