1. Introduction
Electromyography is a method that evaluates, through non-invasive techniques, the overall behavior of the muscle fibers that make up the muscle [
1]. Electromyographic signals are those that are produced by a muscle during the process of contraction and relaxation. These signals are generated by the exchange of ions through the membranes of muscle fibers due to muscle contraction.
Electromyography has broad applicability when determining muscle fatigue [
2,
3,
4]. With this technique emerged a project called SENIAM (Surface ElectroMyoGraphy for the Non-Invasive Assessment of Muscles), which has given rise to European recommendations for the selection and placement of sensors, surface electromyography processing methods, simulation models for education and testing, among others [
5,
6,
7,
8].
Currently, a variety of applications are available in different types of sports, through surface electromyography. In this context, muscle fatigue is defined as the variable reduction of the muscle to generate force, which is accompanied by certain transformations in the electromyogram [
9,
10].
For example, several studies claim that there is a linear relationship in the domain of frequency and speed of propagation of muscle fiber. By making a spectral analysis of the signal, fatigue indices can be found; however, when studying changes in amplitude the results are uncertain and contradictory [
11].
In the sports field, with electromyography it is possible to observe muscle fatigue caused by static exercises [
12], in which sustained contractions are generated without varying the length of the muscle, or dynamic, where there are contractions in which there is a flexion and extension of the muscle [
13,
14,
15,
16]. However, its use is sometimes restricted due to factors such as cost and lack of technical knowledge.
In some investigations it has been shown that muscles are recruited differently when they are stimulated voluntarily [
17], since the motor units are activated asynchronously, than when they are stimulated electrically [
18]. In these cases, the question arises: what happens when the muscles are stimulated dynamically? This question coincides with one of the purposes of this work; because when the muscles are stimulated electrically, more information is obtained for physiological investigations or clinical diagnosis [
19].
Considering the previous context, in this work a prototype of electromyograph was made for the detection of fatigue in order to evaluate muscle activity in high competition sports. Specifically, the device was tested with the Volleyball team of Universidad del Magdalena, located in the city of Santa Marta, Colombia. The proposed method for performing fatigue detection among the exercise routines of athletes is highlighted, which is based on the mean frequency and the maximum RMS (Root Mean Square) amplitude of the EMG signal.
This type of prototype is a very useful instrument when analyzing aspects related to fatigue induced to a specific group of muscles in sports training. Generally, methods of muscle mass development based on the generation of localized fatigue are used, appearing because of a long duration of repetitive movements with loads.
For this reason, this type of fatigue should be considered a very important control parameter in muscle training, in order to increase athletic performance. From here, it is important to have a tool that makes it possible to acquire and process EMG signals, in order to provide certain information to assess the existence of muscle fatigue.
This work is organized as follows:
Section 2 presents a detailed description of each of the blocks that make up the prototype. In
Section 3 the experimental results obtained with the athletes of the volleyball team are shown. The discussion and conclusions are presented in
Section 4 and
Section 5.
2. Materials and Methods
For the design of the EMG device, the recommendations described by SENIAM were studied and applied. For the experimental tests, the group of Volleyball athletes of the Universidad del Magdalena was chosen and the routines they perform during their training sessions were used. In addition, with the support of the trainer and the athletes, the records of the myoelectric signal were taken.
The data obtained were stored, processed and visualized with the LabVIEW software, which is a design platform that allowed the digital processing of the signals acquired. Finally, an analysis was performed through a linear regression applied to the variables of interest, which are the mean frequency and the maximum RMS amplitude of the signal. In this way, it was possible to observe the behavior of the data obtained and determine the fatigue indices of each of the players who participated in the sampling of the signal.
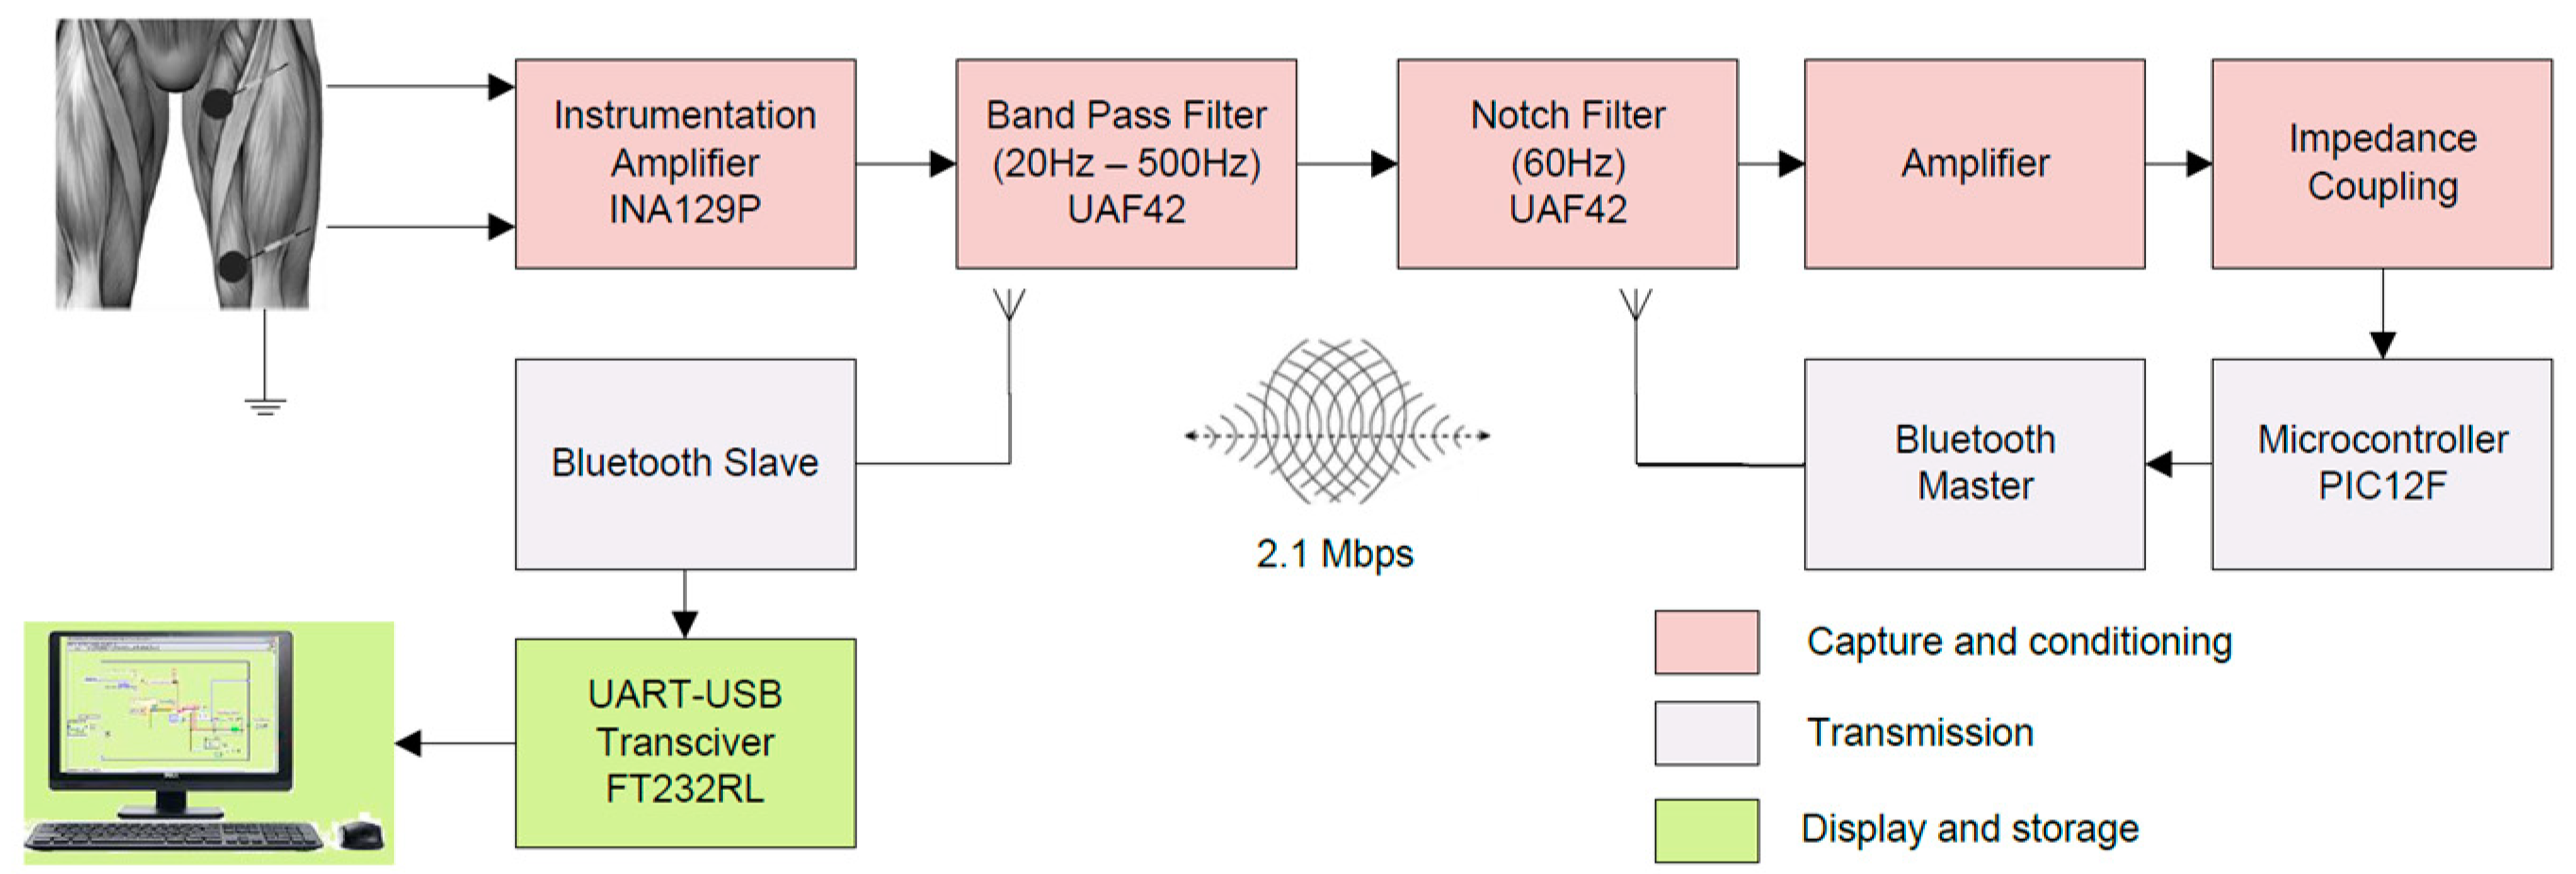
Figure 1 shows a general block diagram of the implemented system. In the following sections we will explain in detail the design process that was carried out for each of the blocks.
2.1. Acquisition of the EMG Signal
For the acquisition of the EMG signal, Medi-trace electrodes were used, which are characterized by being superficial and having an adhesive hydrogel that provides a good adhesion between the skin and the metallic part of the electrode. To adapt the connector of the electrodes to the acquisition circuit, an ECG cable 3-lead shielded with a DIN (Deutsches Institut für Normung) connector was used, to avoid interference.
Considering the recommendations of the SENIAM [
8], the skin of the athletes was adequate to obtain a good contact between the electrode and the skin. This factor is important for a good record of the EMG signals, in terms of amplitude characteristics and lower risk of electrical interference or noise.
Therefore, to take the samples the athletes were shaved in the muscles where the electrodes were located. The next step was to clean the skin with alcohol and let it dry before placing the electrodes. For the vastus lateralis, the electrodes were placed 2/3 in the reference line formed between the anterior superior iliac spine and the external edge of the patella. In the case of the rectus femoris, the electrodes were in the middle of the line between the anterior inferior iliac spine and the apex of the patella [
20].
2.2. Preamplifier
Due to the amplitude of the EMG signal (less than 10 mV) and other factors such as noise, it is necessary to use an amplifier with a high input impedance and a high common mode rejection ratio (CMRR > 95 dB), which is a range considered acceptable by SENIAM [
8]. For this reason, the instrumentation amplifier INA128P was used, which has a CMRR > 120 dB and a high input impedance with an approximate value of 10
10 Ω. In this stage, the gain parameters were adjusted to a factor of 11, in order to amplify the signal acquired by the electrodes. For an established gain of G = 11, the value of R
G is calculated with Equation (1).
2.3. Filter Design
The filtering stage of the signal is divided into two types of filter; one has the task of suppressing the noise produced by the 60 Hz electrical network (notch filter). The other filter is made up of a high pass filter that lets pass the frequencies in the range of 10 to 20 Hz, and a low pass filter with a cutoff frequency in the range of 500 to 1000 Hz [
21,
22]. The high pass filter is necessary to eliminate noise from surrounding muscles or other muscle movements.
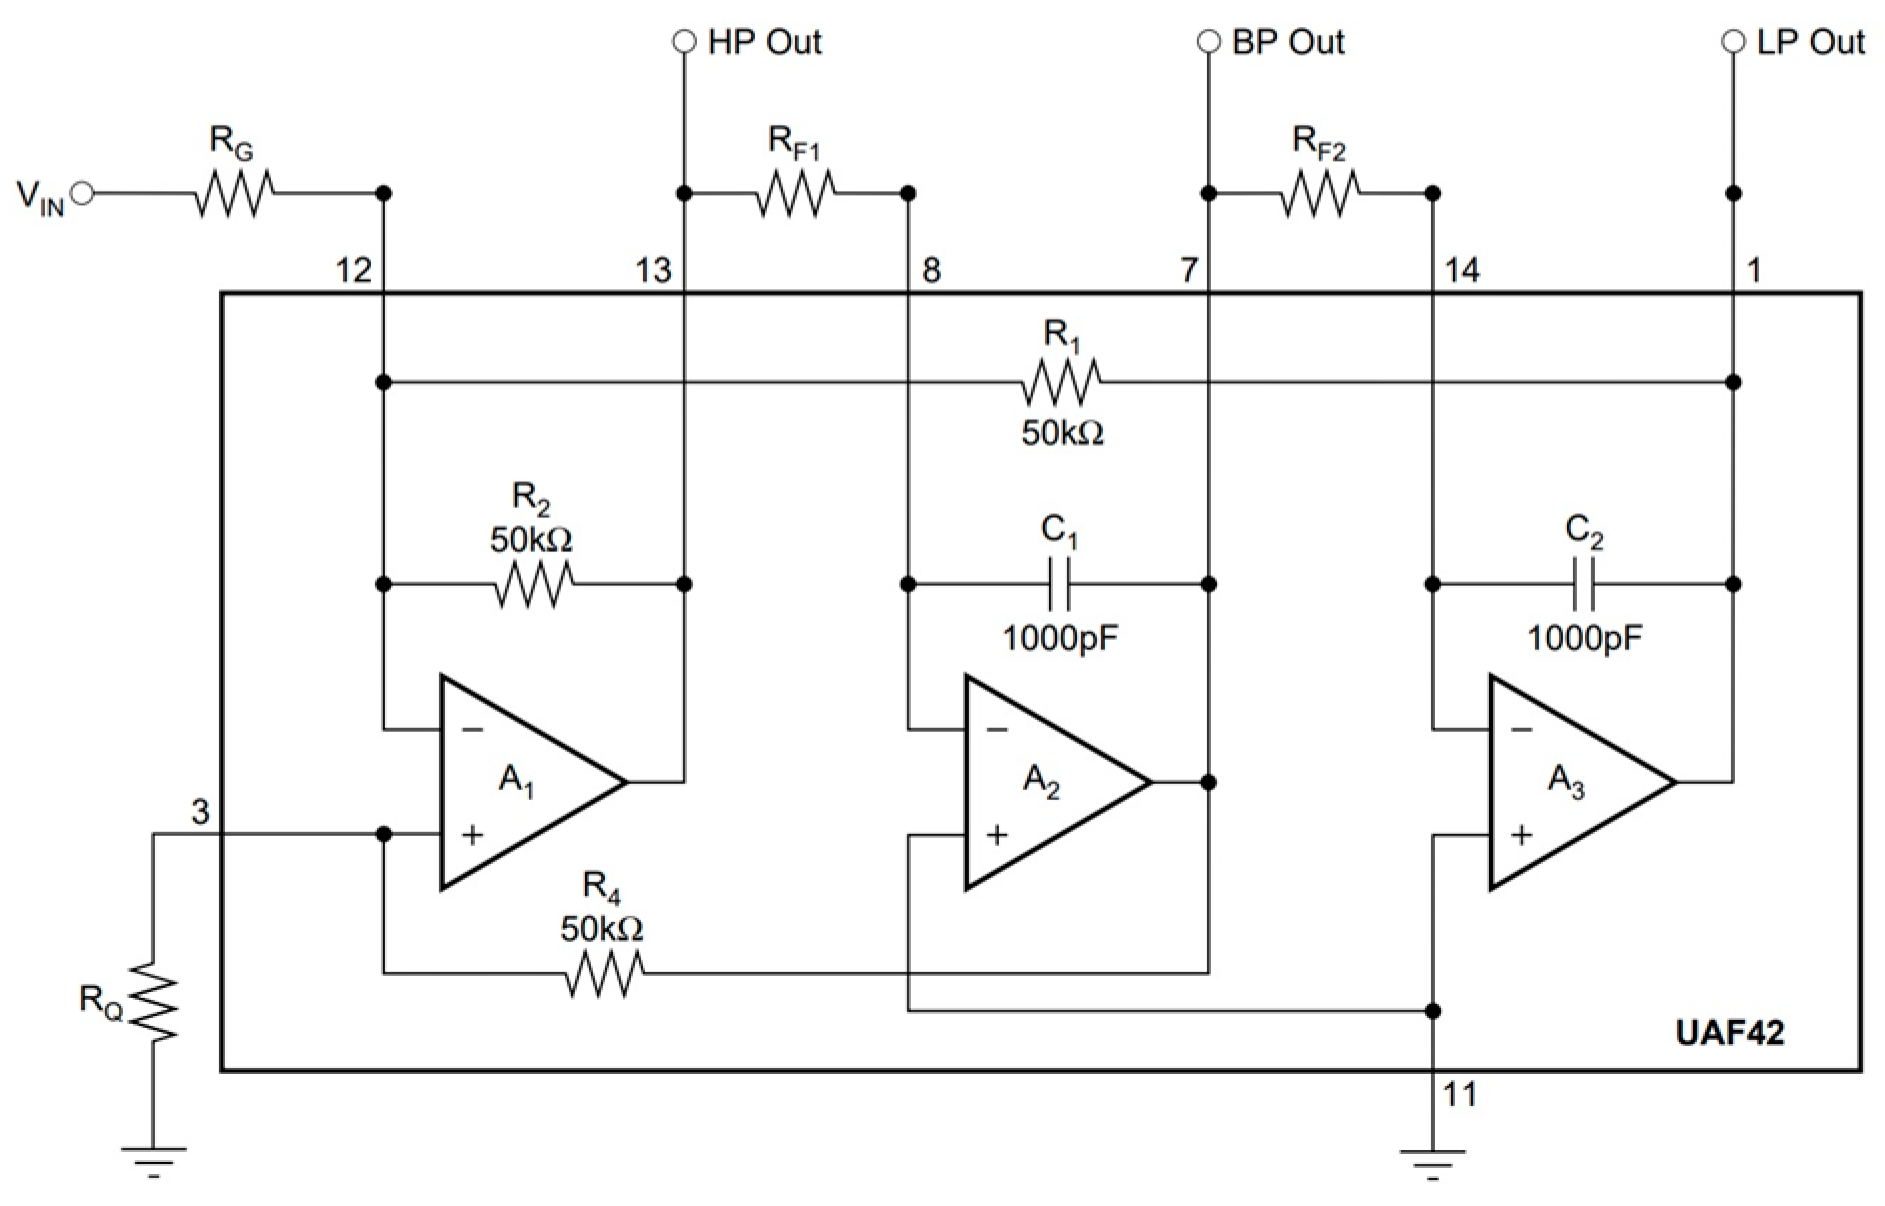
For this stage the integrated circuit UAF42 was used, which is a universal active filter configurable through external resistors that can be calculated by the Filter 42 program of Burr-Brown.
This integrated circuit uses an analogous architecture of variable state, with an inverter amplifier and two integrators. The Filter 42 program allows easy application of many types of filters: Butterworth, Bessel and Chebyshev. An input FET operational amplifier can be used to form additional stages or special filters such as a band-rejection filter [
22].
SENIAM suggests a cut-off frequency for the high-pass filter of less than 10 Hz, in applications with spectral analysis and a cut-off frequency of 20 Hz to record EMG signals in motion. For the low pass filter, the recommended cutoff frequency in general applications is 500 Hz (for a special bandwidth it is 1000 Hz). For this reason, a filter with a 10–500 Hz pass band was designed in this work, given that the EMG record is to be taken under dynamic conditions and with spectral analysis.
2.3.1. Notch Filter
For this filter, the following parameters were defined: Butterworth filter, second order, f
Notch = 60 Hz and bandwidth of 10 Hz. Using the Filter 42 program, a Noninverting Pole-Pair/Zero Subcircuit was obtained with a gain resistor R
3 (
Figure 2) [
22]. The values obtained for each of the components can be seen in
Table 1.
2.3.2. High-Pass Filter
Using the Filter 42 program, a Butterworth high-pass filter with f
0 = 10 Hz and second order was designed. The values of the components that were obtained are shown in
Table 2. In
Figure 3 the implemented design is shown, which corresponds to an Inverting Pole-Pair Subcircuit [
22].
2.3.3. Low-Pass Filter
With the Filter 42 program, a Butterworth low-pass filter with f
0 = 500 Hz and second order was designed. The values of the components that were obtained in this way are shown in
Table 3. In this case, the same configuration described in
Figure 3 was used, which corresponds to an Inverting Pole-Pair Subcircuit [
22].
2.4. Amplifier
After filtering the noise signals, the next step is a new amplification in order to obtain a signal with better amplitude. In this way, it is possible to obtain a higher quality in the processing of the data. As in the preamplifier stage, the instrumentation amplifier INA128P was used, but with a gain of 51 (Equation (2)).
2.5. Coupling Stage
In this stage, an offset voltage was added to the EMG signal acquired, in order to condition it for the analog-digital conversion stage, since negative values are not admitted at this stage. For this purpose, an INA128P with an offset voltage of 2.5 V was implemented.
2.6. Communication Stage
For the connection of the EMG system, a Bluetooth Bee 2.0 transmitter with a data rate of 2.1 Mbps and a UART speed of up to 1 Mbps was used. Taking advantage of this Bluetooth capability, the Nyquist theorem is fulfilled. Thus, the EMG signal can be sampled at a frequency of 5 kHz and a digital analog converter of up to 12 bits of resolution can be used, avoiding oversampling of the signal. These frames were sent asynchronously to another Bluetooth device connected to the computer, to later process them in the LabVIEW software.
2.7. Graphical User Interface
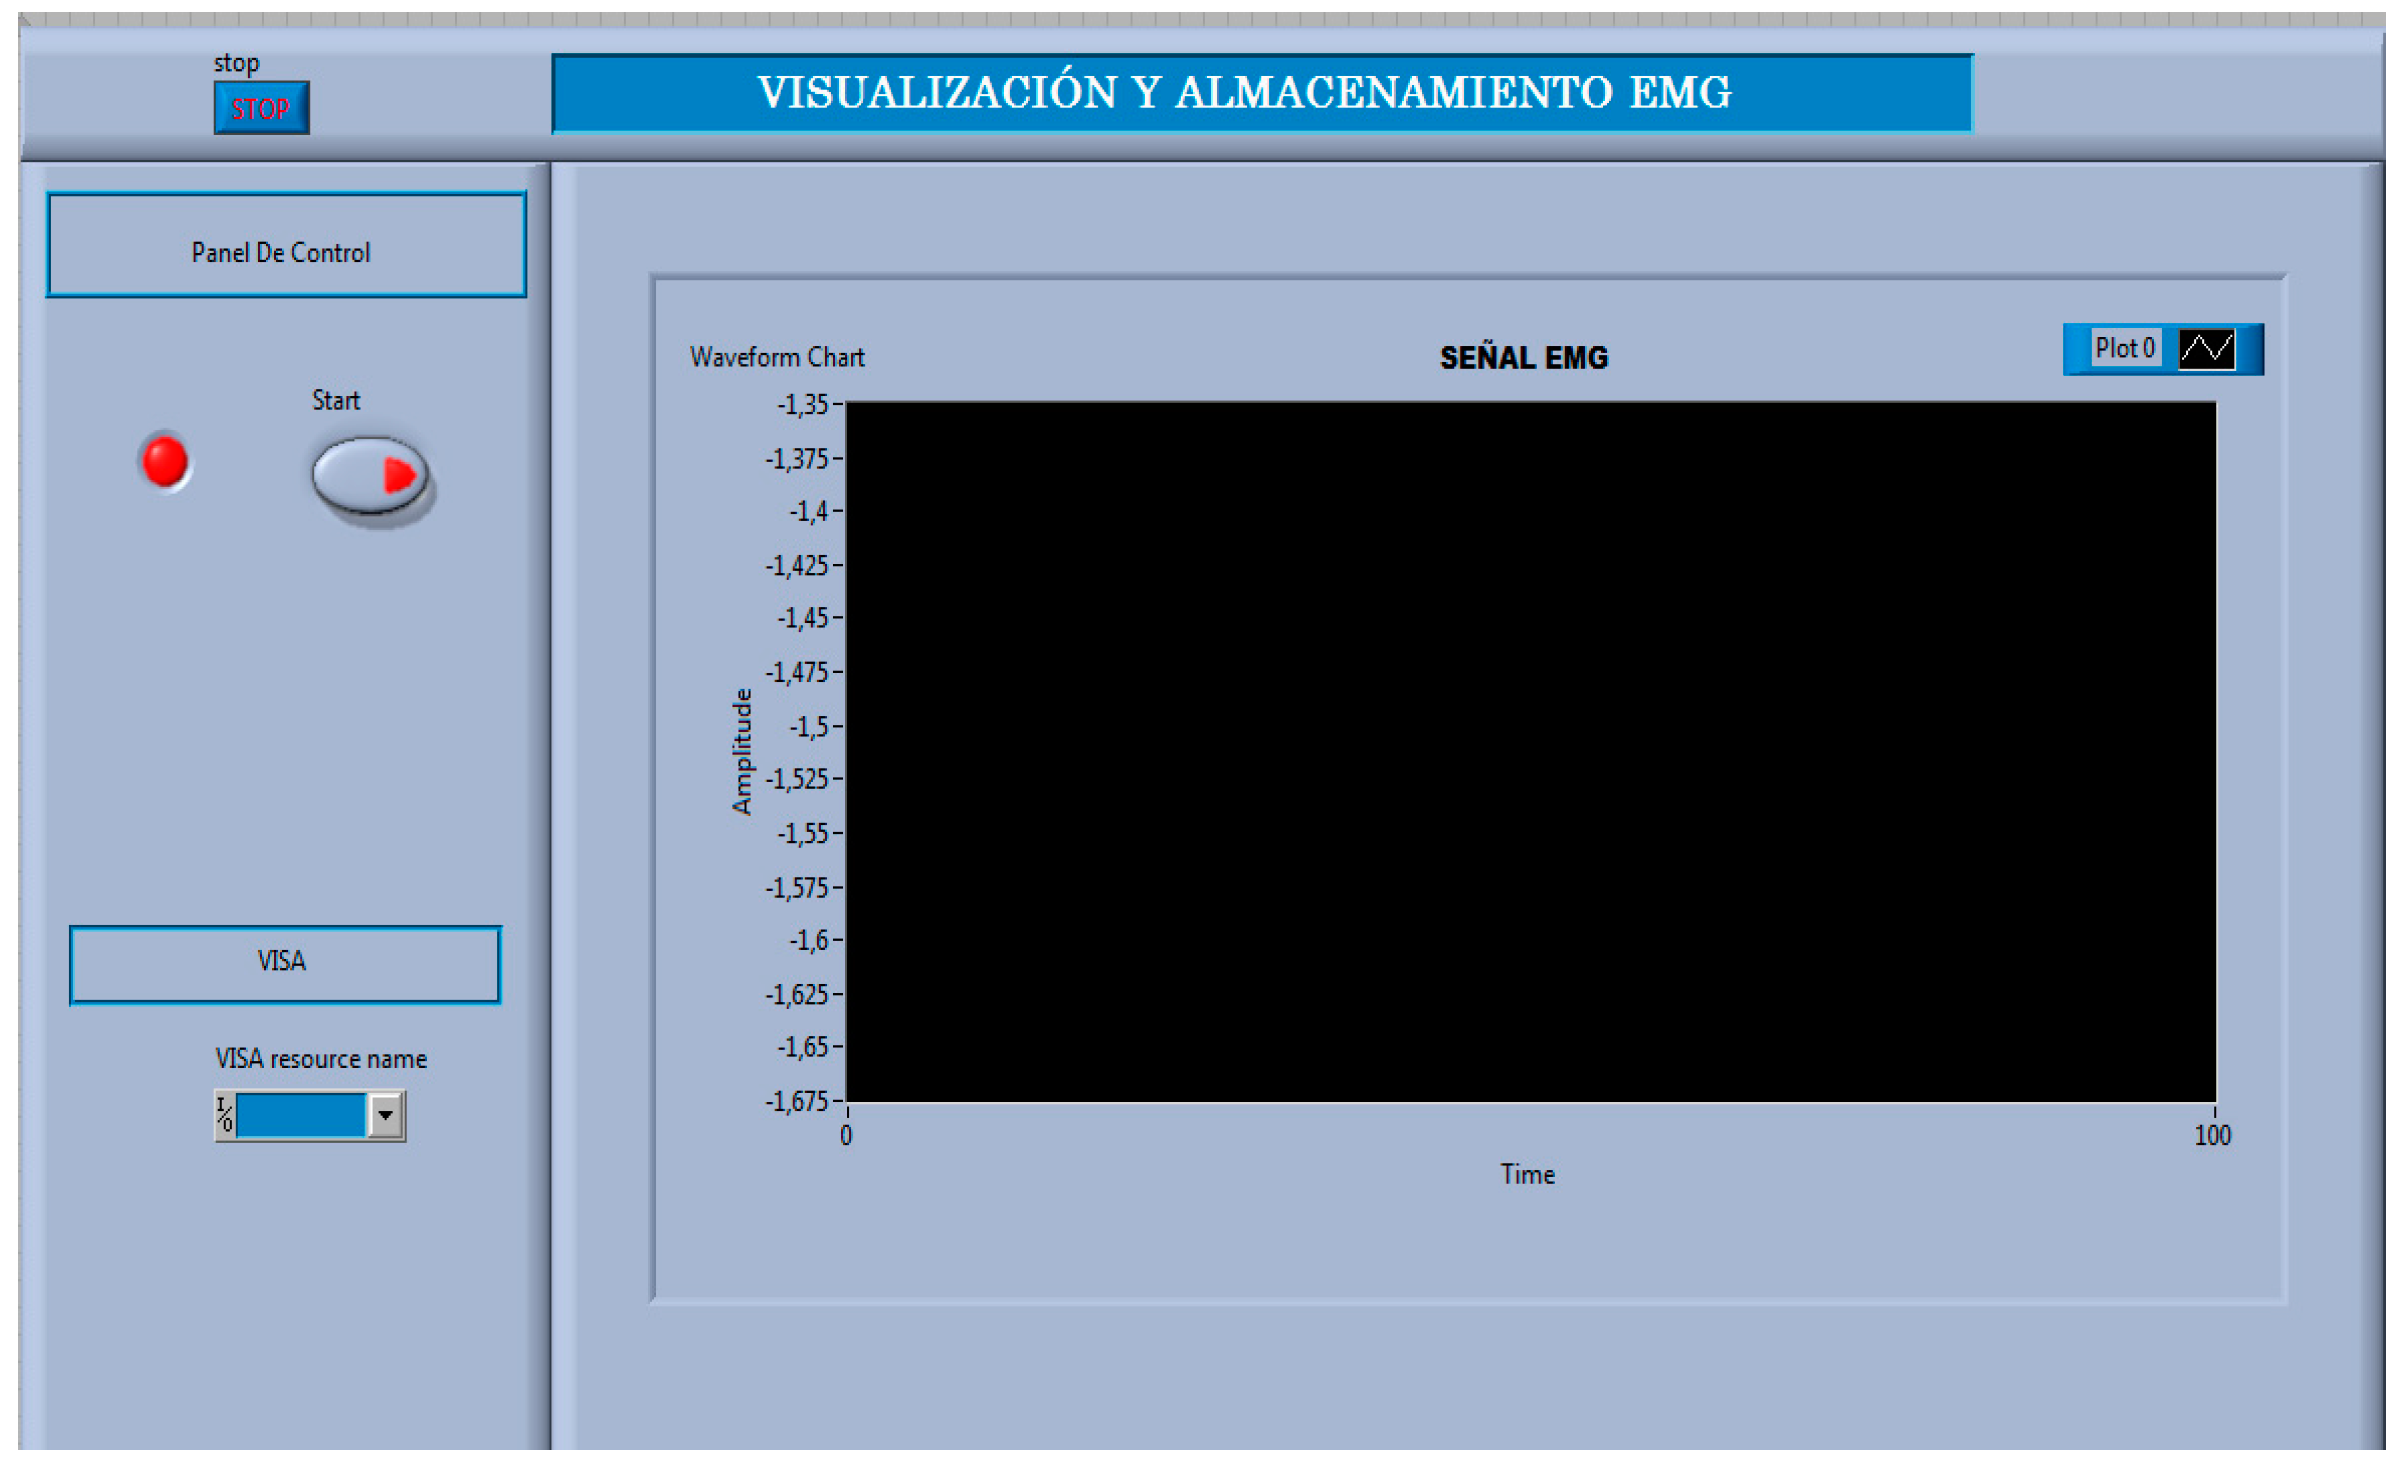
The graphical user interface made in LabVIEW consisted of a control panel, which allows the visualization and storage of the EMG signal (
Figure 4). To visualize the data acquired in the serial port through the Bluetooth bee module, a program was made to read the received data, and then save them for a signal analysis. The serial communication was made using the VISA (Virtual Instrument Software Architecture) of LabVIEW.
With the LabVIEW Write to Measurement File Express VI block, data is written to a measurement base of text files (.lvm) or a binary measurement file (.tdms). For the project purpose, TDMS (Technical Data Management-Streaming) files were stored, which consist of one or more arrays, such as numbers, strings, or Boolean. This TDMS format offers more efficient and accurate storage than the lvm format and has the advantage of saving data in an organized manner. Additionally, it allows writing data continuously in a file with the extension .tdms [
23].
2.8. Storage, Processing and Analysis of the EMG Signal in LabVIEW
This stage consisted of extracting characteristics of dynamic or isotonic exercise, in which several contractions are made. The movement used is called a squat and consists in the repetition of extension and the flexion of the knee, with free load, at the level of the shoulders until it causes fatigue. This exercise contains recovery intervals, that is, when the player is in the initial position, the contribution in the electromyogram corresponds to a resting state of the muscle. For this reason, an analysis was standardized in which only active muscle periods were considered.
According to the storage form, each contraction is divided into file windows with a duration of 250 ms, so that each contraction is composed of several windows. For this reason, a folder was made for each contraction, so that they were divided considering the number of squats performed.
2.8.1. Reading Files from LabVIEW
For the reading of the files, the LabVIEW Read from Measurement File block was used, which performs file reading until the completion of the data and allows specifying the next file to be read.
2.8.2. Digital Processing
Although the EMG signal was filtered at the hardware level, it is necessary to implement software filters, since the signal can have noise levels introduced by the electrical network, which causes problems when performing signal analysis in the frequency domain.
Therefore, a digital filtering was performed with the same criteria used in the analogous stages, that is, a band pass filter with a bandwidth between 10 and 500 Hz and a notch filter of 60 Hz. In this way, IIR (Infinite Impulse Response) filters with Butterworth typology of order 10 were used.
2.8.3. Frequency Analysis
A spectral analysis was performed in order to convert the EMG signal from the time domain to the frequency domain. Thus, information on the frequency components of the signal under study was obtained [
24].
When measuring the power spectrum of a signal over time, it answers the question: in which frequency components is the signal power contained? The measure is the distribution of power values as a function of the frequency, where the power is considered the average of the signal. One of the parameters to be highlighted is the averaging, which indicates how the signal is to be averaged. In this case the LabVIEW Peak Hold was chosen, which maintains the highest power peaks.
Peak Detection: After finding the power spectral density of an EMG signal, it can be clearly seen that the spectral density is not continuous, it presents peaks in certain frequencies, due to the contribution of the muscle fibers that make up each muscle and that the EMG signal is of random origin.
Based on this fact, it was necessary to establish a numerical value for the realization of the study, for which the mean frequency was used. In this way, a program was carried out that detects the number of peaks that exceed a certain threshold and stores the respective frequency value. With this procedure, a frequency distribution table was designed, and by means of a simple calculation the mean frequency of the power spectrum of each of the recorded contractions was obtained.
The peak detector was implemented in LabVIEW with the Peak Detector VI, which searches for the location and amplitude of the local maximums of the spectral density of the EMG signal. Each detected peak has associated an amplitude and a frequency, later the values of these vectors are added and divided by the number of peaks found by means of an algorithm that was implemented in a Math Script node, and in this way the mean frequency is found.
Amplitude Analysis: Amplitude is a parameter that can be analyzed as an indicator of muscle activity through the RMS value. This value has the advantage of providing a power measurement of the EMG signal.
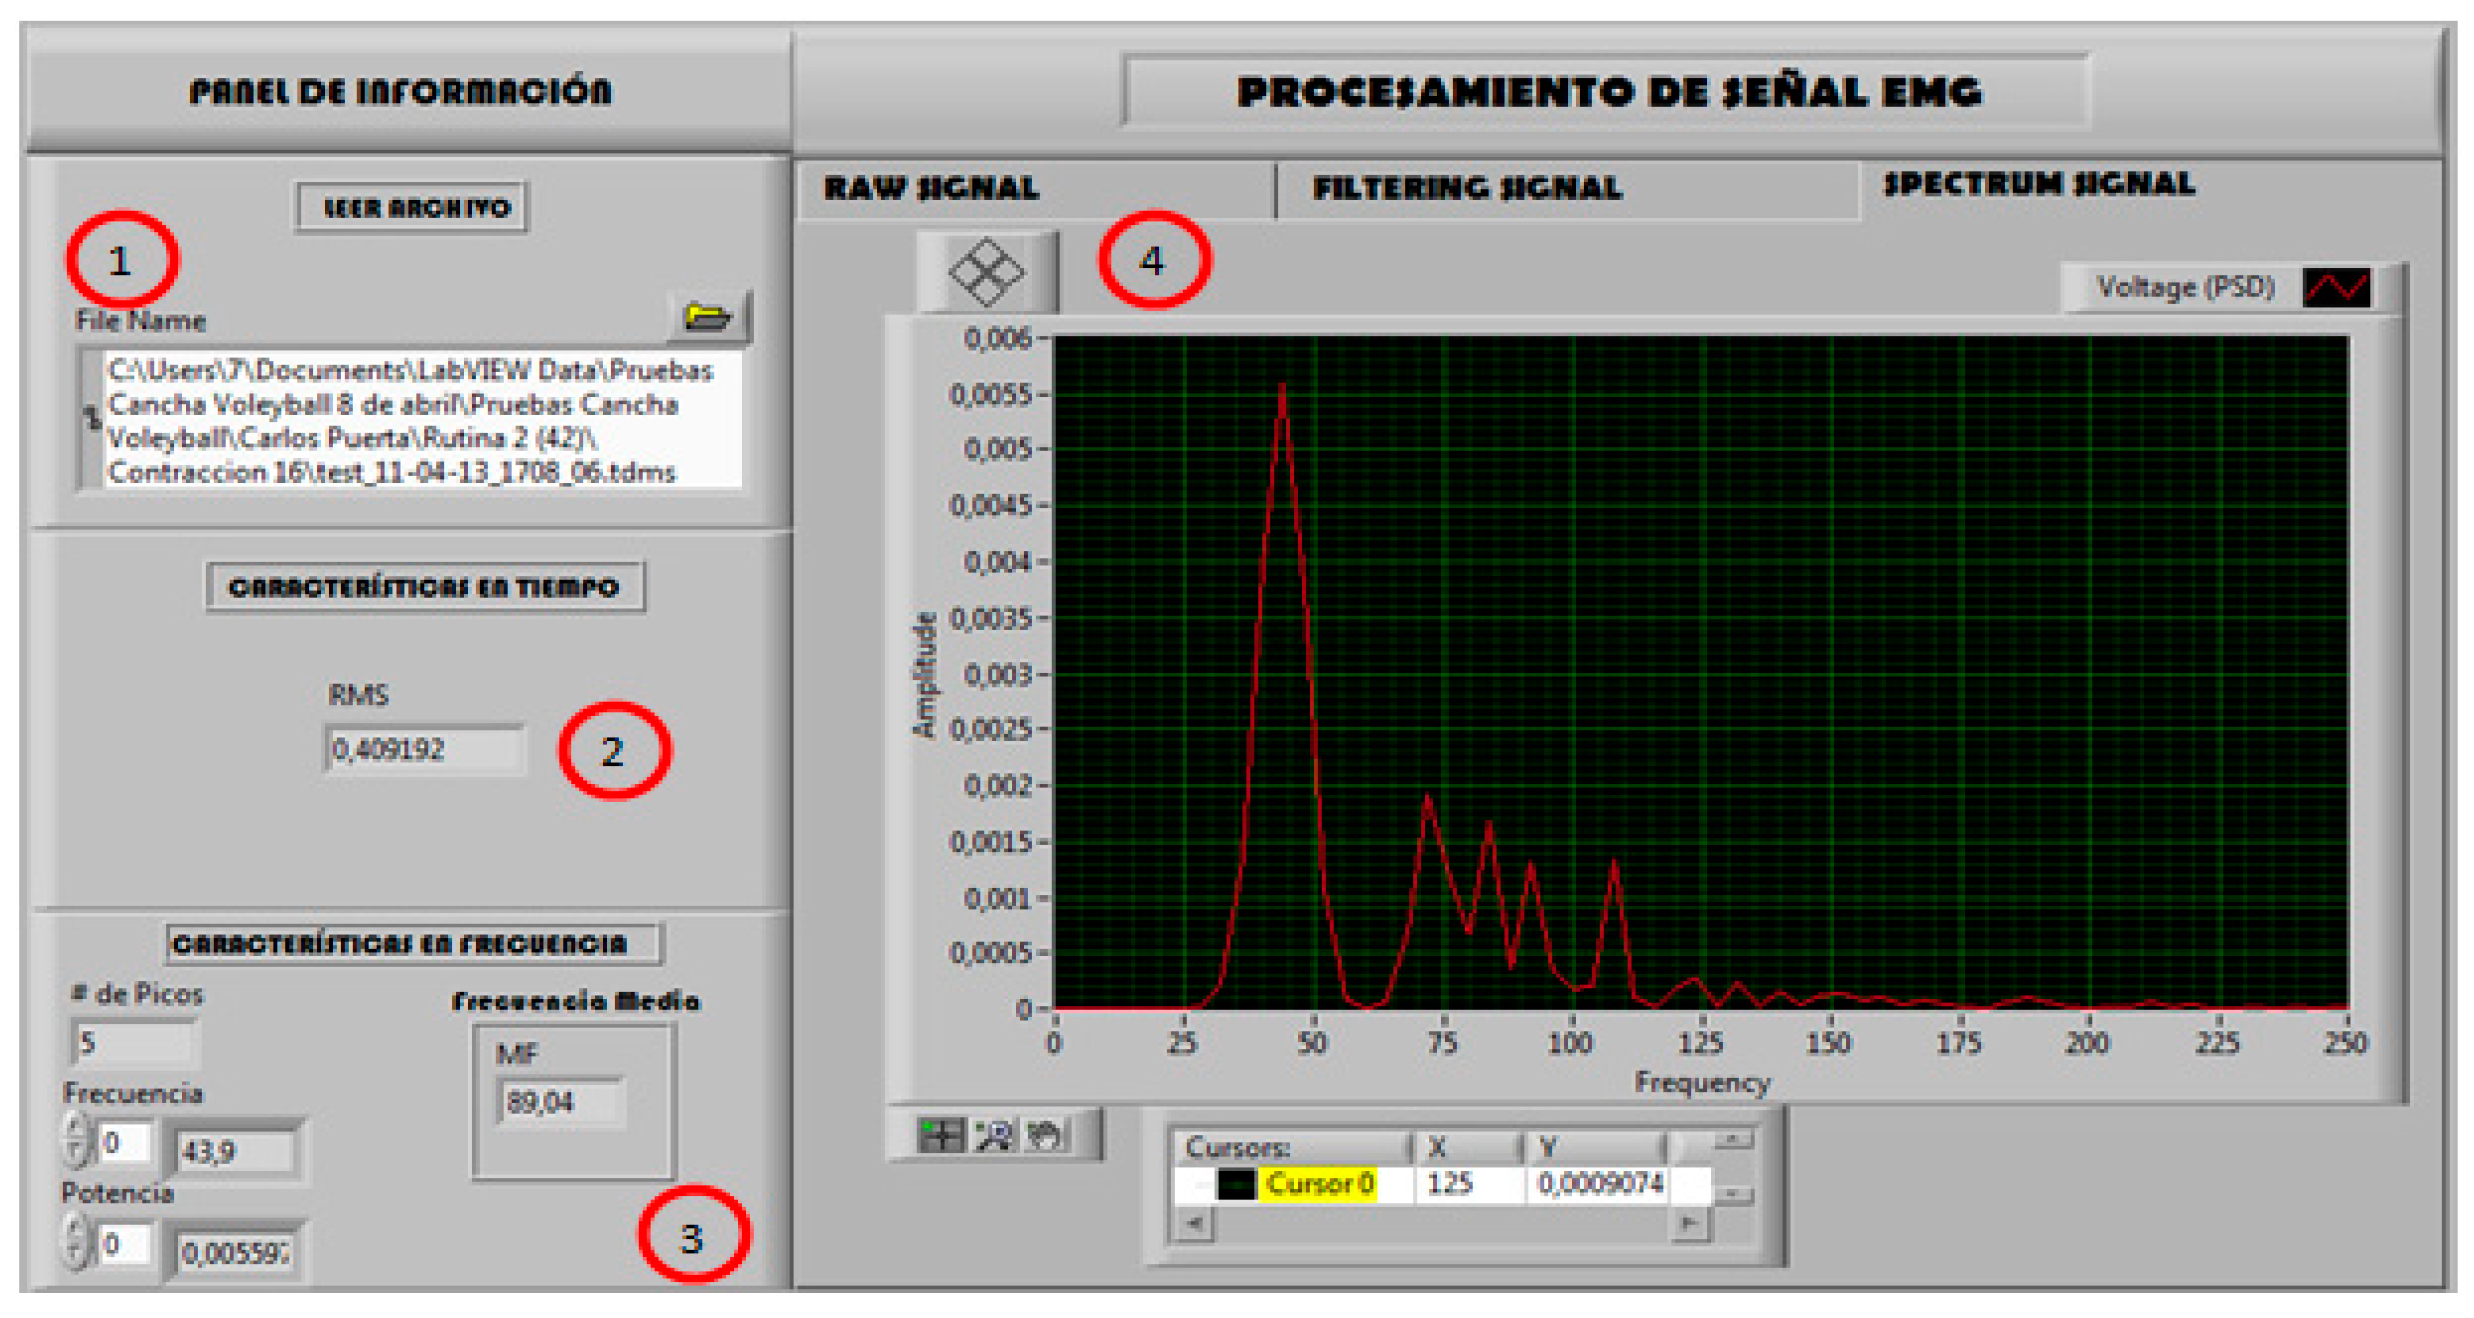
This method shows the relationship between the developed force and the electrical activity during the execution of the exercise. For this, the different degrees of amplitude achieved in correspondence with a certain state of muscular contraction are recorded. First, the negative amplitudes are converted into positive amplitudes, by means of a full-wave rectifier. Then, the maximum value of the RMS peaks is found, in this way, a relationship between the maximum RMS amplitude vs. muscular contraction is established (
Figure 5). In this figure, each of the panels listed represents the following: 1. Reading of files, 2. Characteristics in RMS amplitude, 3. Frequency characteristics and peak detection. 4. Visualization of the spectrum of the EMG signal.
Fatigue Analysis: For the fatigue analysis, a linear regression was performed for the mean frequency and the maximum RMS voltage of each squat or muscle contraction performed. For this purpose, the Software for Statistics and Data Science (Stata) was used. In this way, we could find the slope and the intercept that describes the least squares line, as well as the coefficient of determination R2 that allows us to evaluate the quality of adjustment of the data.
Finally, because in each sampling session three routines were performed, the median was calculated, in order to have a single linear regression equation that describes the total fatigability during the entire exercise session.
2.9. Selection of Players
The study was carried out with the collaboration of seven players from Universidad del Magdalena, belonging to the competitive or high performance cycle of the volleyball team because it is one of the sports in which the muscles under study are exercised (vastus lateralis and rectus femoris). The selection was made with the help of the team coach, in accordance with the sports skills, and the subsequent approval of the players under study, by signing an informed consent.
Table 4 shows the general characteristics of the study population.
2.10. Definition of the Routine to Cause Muscle Fatigue
An isotonic or dynamic training was chosen, which refers to training with free weights. This type of training has the advantage that it does not deviate from the usual procedures used by the fitness coach for the development of muscle mass in players.
In order to assure that the conditions at the time of performing the routines are as homogeneous as possible, a test was defined to determine the maximum weight that each player can lift. The test consisted of performing the exercise (squat), increasing each time the weight until finding the maximum weight that can be lifted by each of the players. In this way, it was established that the constant weight to be lifted in the routines has a proportion of 40% of the maximum weight, based on the fact that the exercise used is strength-resistance.
For this reason, the athlete can resist fatigue for a long period in a static or dynamic muscular exercise, then the possibility of maintaining or repeating work of force and duration depends exclusively on the levels of force and energy supply of the muscles used. On the contrary, when the loads exceed 50% of the maximum weight, the energy source will be almost exclusively anaerobic, that is, in the absence of oxygen [
25]. Consequently, the objective was to cause muscle fatigue by performing an exercise with moderate resistance.
Table 5 shows in detail the test weight that was used for each player.
Before applying the test weights, with the coach’s advice, a warm-up protocol was established with sessions of joint movements, warm-up (15 min) and muscle stretching.
Articular Movements: in this stage each player performs movements in the ankles, elbows, shoulders, knee, neck, trunk, wrist and hip, in order to prepare the muscles and joints.
Warm-up: after the articulation exercises, the players performed a warm up with a trot, trying to always run at the same pace during the time indicated by the coach, around 15 min.
Muscle Stretching: after running, each player performed a muscle stretch that helps with flexibility and decreases the risk of injury. The technique involves slowly stretching the muscle to the extreme and maintaining that tension for a predetermined time [
26].
After the warm-up, we proceeded to execute the session of fatigue exercises, this consists of three routines where the player performs squats with a constant load (test weight) until achieving maximum effort, which is when fatigue appears. The time interval between routine was enough to perform the stretch and recovery protocol (10 min). The time elapsed for the tests was one month.
The exercise starts standing, with the back straight and the feet parallel to a distance approximately equal to the width of the shoulders (the bar with the loads is placed on the trapezoids). When the subject bends down, the back is tilted forward and without curving the spine to avoid injury. When the femur reaches the horizontal, a knee extension is made straightening the trunk to reach the starting position [
27].
3. Results
3.1. Results Obtained with Frequency Analysis
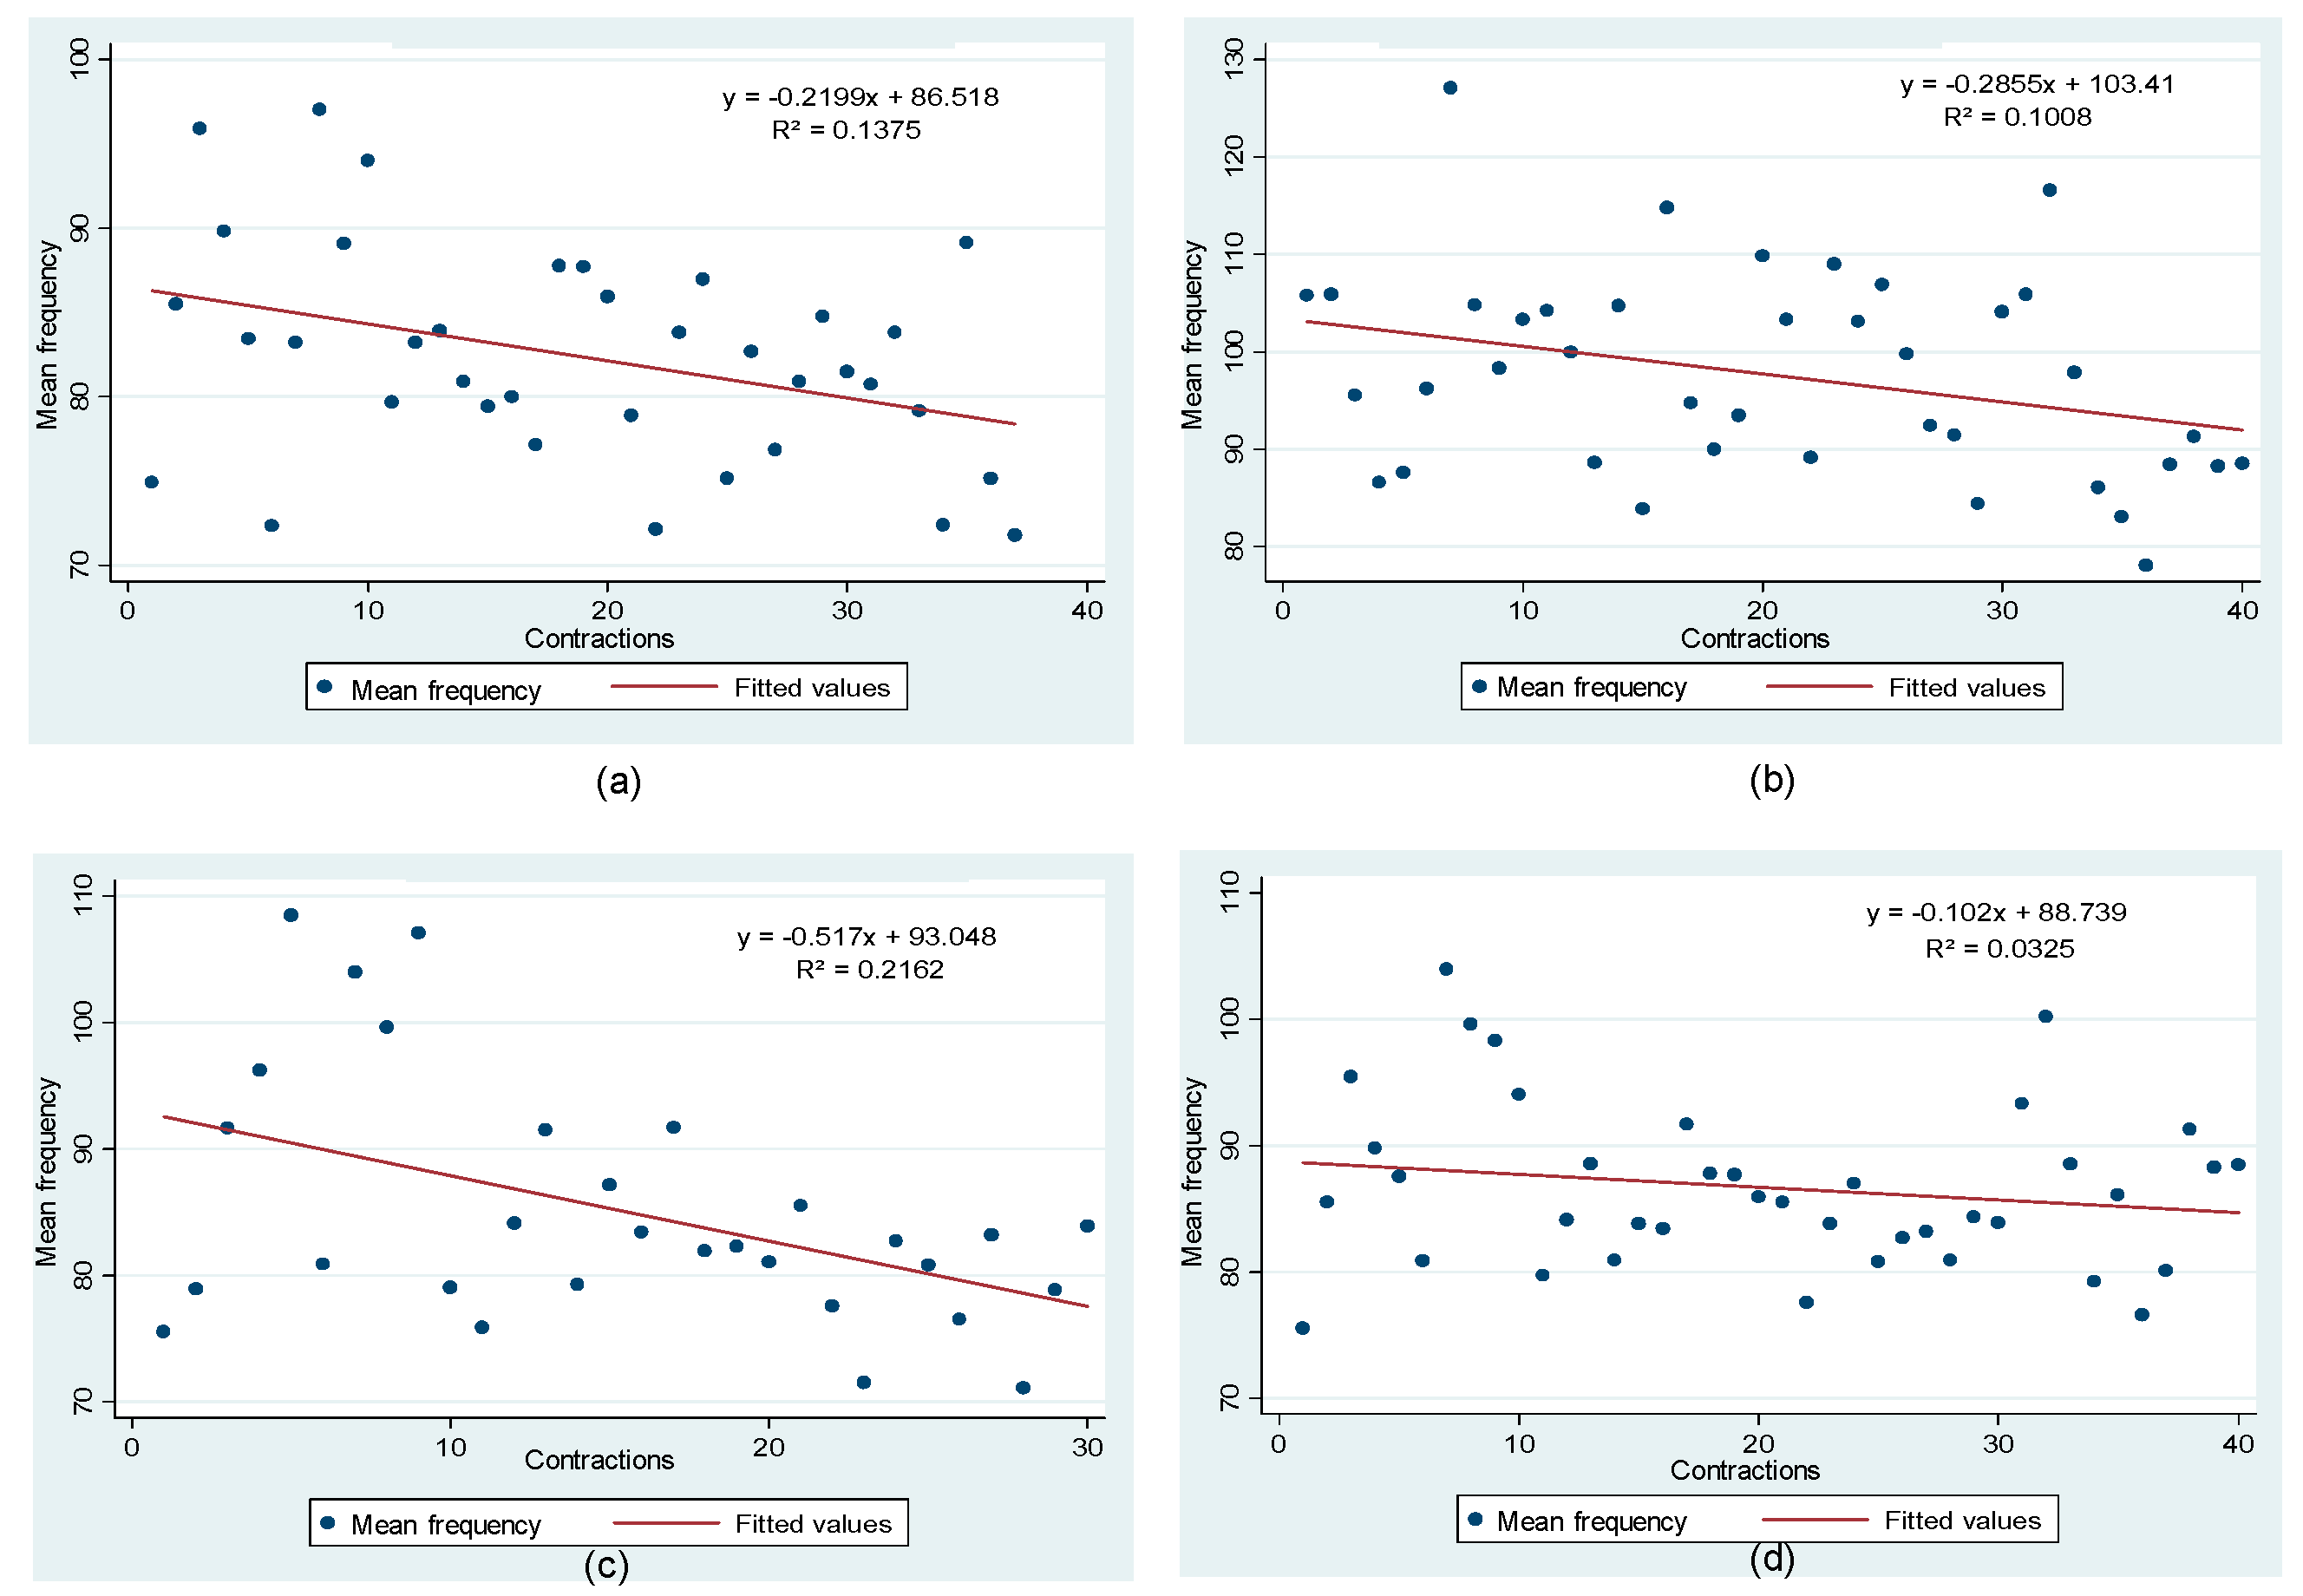
From the records of the data obtained in the tests performed on the population under study, fatigue indices were estimated for each player. Likewise, the degree of fatigability exercised by the routine established in athletes was quantified. The statistical analysis of linear regression between the variables of mean frequency and muscular contractions, shows a decreasing tendency, represented with the negative slopes with values of m = −0.2199, m = −0.2855, m = −0.517 found in routines 1, 2 and 3 respectively (
Figure 6).
The results obtained are in line with that presented in [
28], where it was demonstrated that the mean frequency of the EMG signal decreases progressively during sustained contractions at 50% of the maximum weight. This situation is evidenced in the results shown in
Figure 6, where the frequency decreases during the contractions performed by player 7 during the three routines, with the difference that in this case the tests were with 40% of the maximum weight.
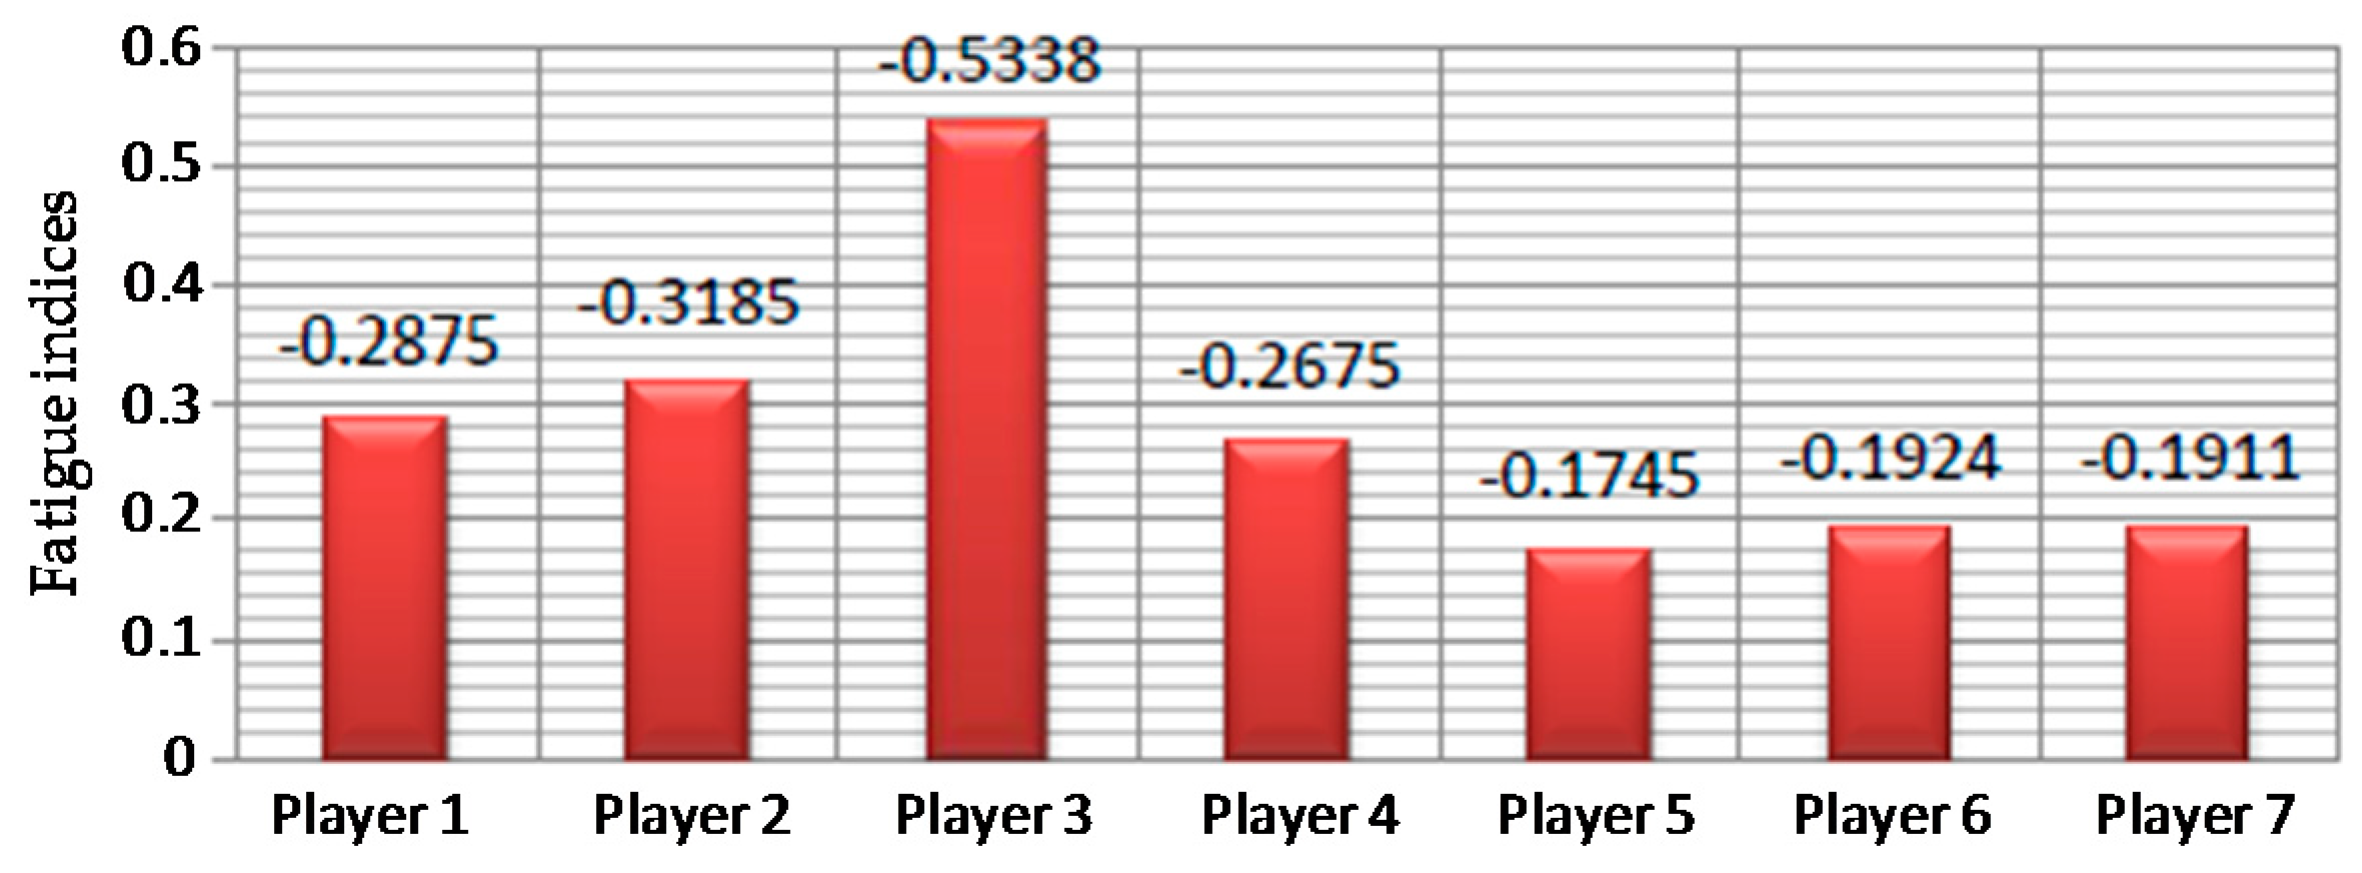
When analyzing the extracted data in the frequency domain, it was found that the slope of the regression polynomial represents the fatigue index. According to what is presented in [
29], the fatigue index value is in a range of −0.1108 and −0.5858 among the routines performed for the vastus lateralis, which is consistent with the values obtained in the present work (
Figure 7).
3.2. Results obtained with the Amplitude Analysis
The authors in [
28] also show that the amplitude of the EMG signal increases continuously as a function of time for the case of player 7, which is an indicator of muscle fatigue. This situation is evidenced in the results of
Figure 8, which shows the relationship of the maximum RMS amplitude versus muscle contractions.
The value obtained from the maximum RMS amplitude during dynamic contractions suggests that the fatigue indicator in these conditions has an increasing behavior, as shown by the slope of the linear regression coefficient obtained for players 2 and 6, with values of m = 0.0037 and m = 0.0018 respectively (
Figure 9).
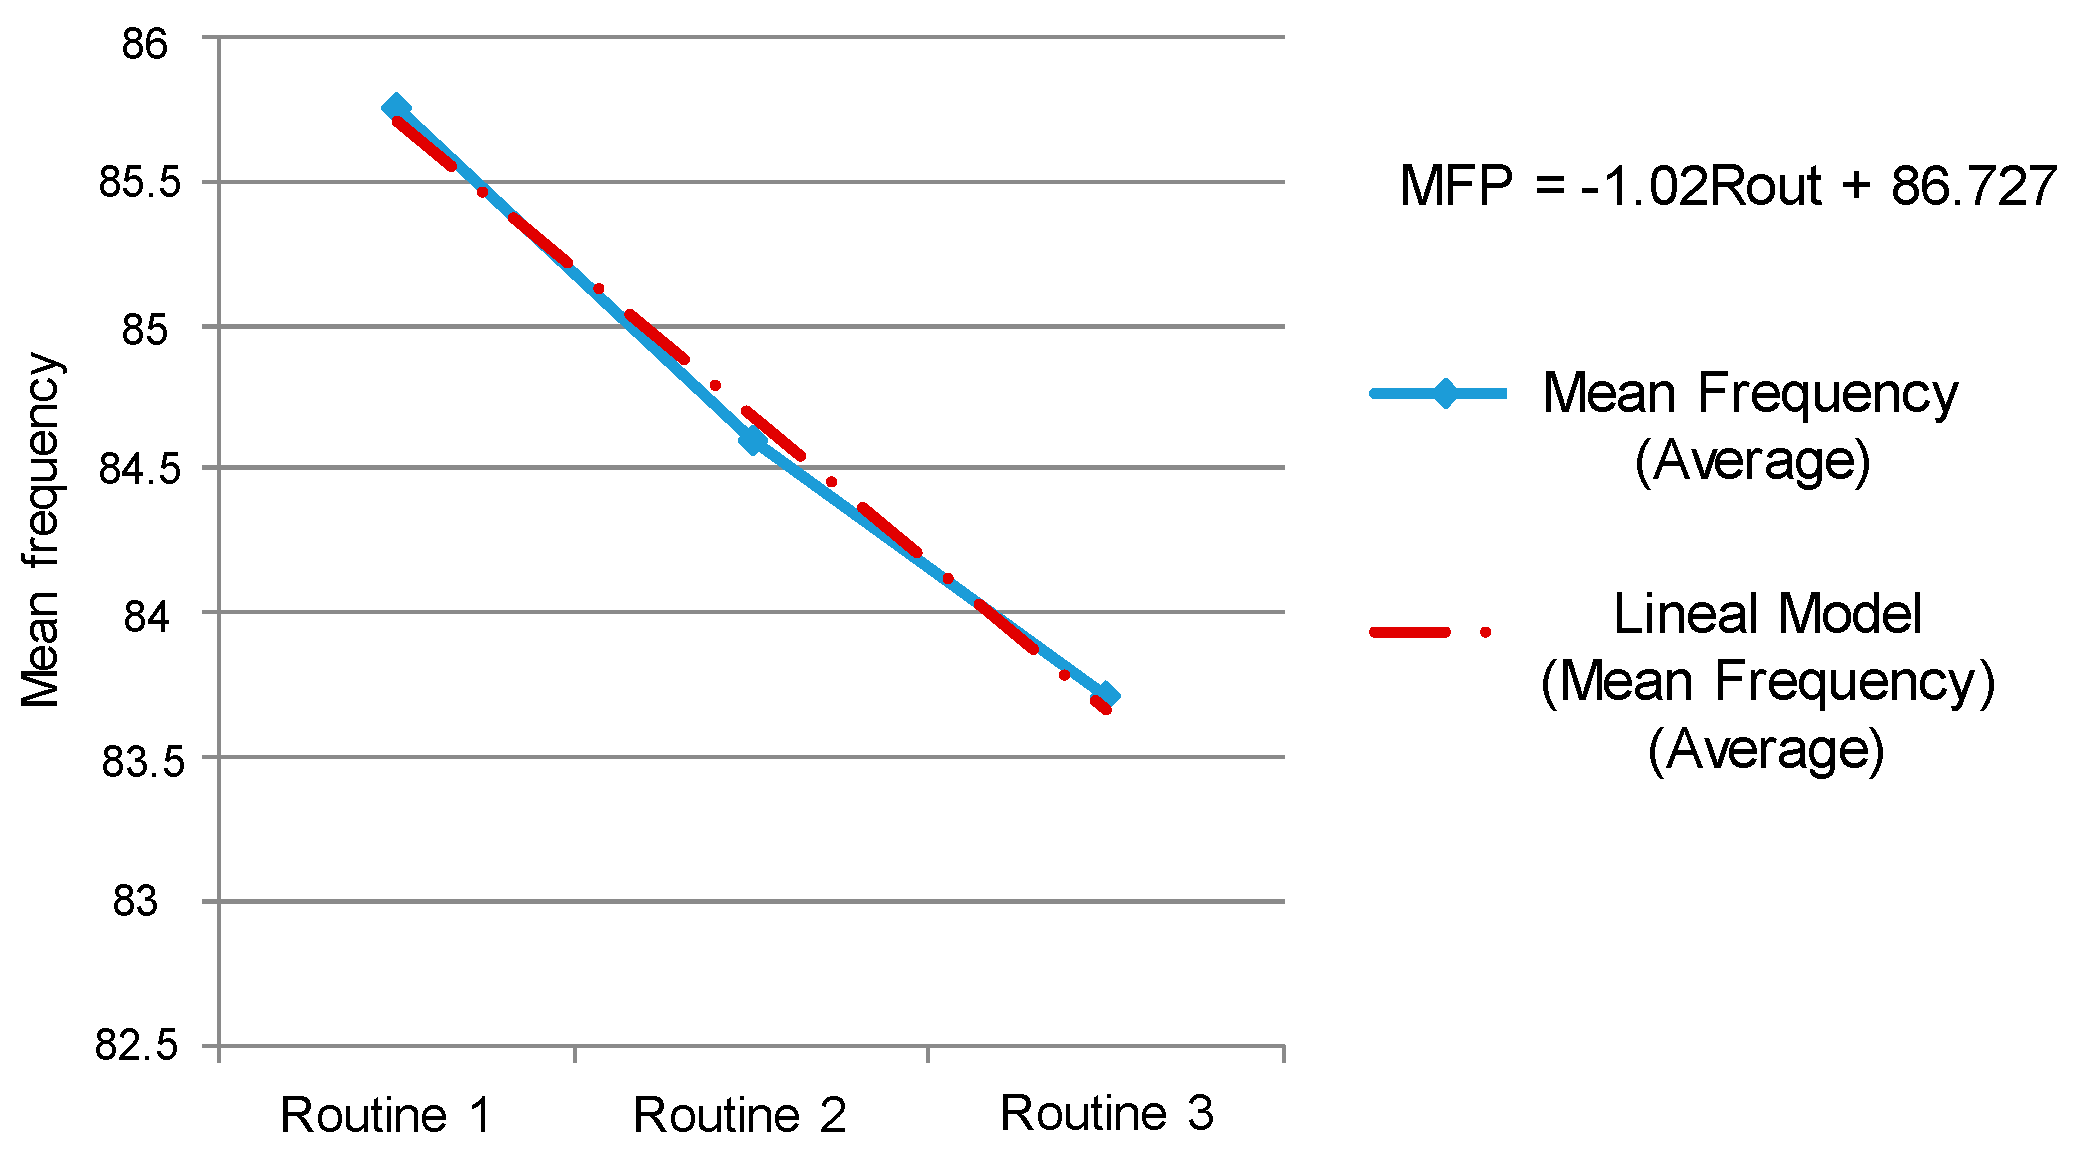
3.3. Results Obtained between Routines
This section shows an analysis of the general progress of the athlete between routines, as a new alternative method to estimate fatigue indexes. This consists in finding a representative value of each exercise routine. To do this, we found the average of the values of the mean frequency and maximum RMS amplitude, and then a graph was made to visualize the evolution of the parameters between routines 1, 2 and 3 for each player. In most cases it could be established that the frequency decreases and the RMS value increases as muscle fatigue appears, as can be seen in
Figure 10 and
Figure 11.
4. Discussion
In this work two electromyographic parameters were tested to indicate fatigue in athletes through exercises that employ dynamic contractions. The above, considering the relationship found between the contraction factor with the mean frequency and maximum RMS amplitude of the EMG signal [
30,
31], therefore it can be affirmed that the frequency analysis in the experienced conditions is the best method to estimate fatigue indexes.
In the time domain, the voltage allows establishing muscle strength through the amplitude of the signal, and to a lesser extent it allows determining muscle fatigue. For this reason, the results obtained in the analysis of the RMS values of this work were unsatisfactory. This premise is also valid in isometric conditions, when exercises are performed with a test load.
An important aspect to be highlighted in the amplitude analysis is the quality of exercise mechanics performed by the athlete. When the player began to feel a decrease in his strength he did not correctly execute the squat, to the point of not reaching enough to fatigue the muscle under study. For this reason, the muscle entered into a resting state, which was evidenced in the analysis of the RMS amplitude.
However, the experiences showed an increase in amplitude and decrease in frequency during the tests, which shows that the athletes experienced some type of muscular fatigue. This situation coincides with that indicated in [
32], where the authors made a comparison between the mean frequency and amplitude, under dynamic conditions, and ensures that it is possible to identify four regions during a muscular activity:
(1) When the force increases (amplitude and frequency increase) [
33]; (2) in the fatigue state (increases the amplitude and decreases the frequency) [
34]; (3) when the force decreases (amplitude and frequency decreases) [
35] and (4) in the period of recovery (amplitude decreases and frequency increases) [
36]. Consequently, the adoption of the methodology applied in this work confirmed several of the assumptions raised by other authors.
5. Conclusions
A device for the acquisition of muscular activation consisting of a single channel was designed. With this, the EMG signal registers of the vastus lateralis and rectus femoris muscles were obtained. With the tests carried out it can be affirmed that many factors can affect the results because the EMG signal is time-variant and can be easily disturbed. This is due to its random nature and the type of dynamic contraction used for the study.
The integration of all parts of the electromyographic system is adequate to detect the fatigue experienced by athletes, since the statistical analysis yielded satisfactory results and congruent with what was raised by other authors. The analysis of fatigue in dynamic conditions of the two parameters studied, in frequency and time, showed that it is more pertinent to estimate the fatigue indices in the frequency domain.
However, it was shown that the athletes with the highest performance obtained the best results in the tests. This shows that the fatigue analysis serves as an indicator to evaluate the performance of the players. When the exercise is not executed properly, the results are inconsistent. This situation was evidenced in the results obtained in the time domain, where the linear regression of the data did not present an ascending trend in some cases. There were fluctuations that showed interference problems during the exercise.
The software made in LabVIEW responded to the requirements for visualization, storage and digital processing of the EMG signal. Currently, the software allows recording and extraction of parameters in mean frequency and maximum RMS voltage of the EMG signal independently.
The whole system gives a framework for future work with exercise registers related with fatigue detection. Findings in this work have been important for researchers in recent projects at Universidad del Magdalena.
The detection of fatigue from EMG signals is a task that can be performed and has the potential to become an important marker for sports training and monitoring. The characteristics of EMG are behavioral biometric characteristics, and the results shown in this study confirm that there are actually some patterns associated not only with the exploration site, the type or intensity of the exercise, but with the athlete itself. This implies that there is a field of study related to the development of biometric systems in sport.


