1. Introduction
Sweating is a natural human phenomenon that regulates core body temperature. Eccrine sweat glands that are distributed along the body are responsible for cooling the human body via thermoregulation. Constituents of sweat along with its mechanisms have been the interest of researchers since the early 20th century [
1,
2,
3]. In the last few decades, sweat related research included sweat content detection, such as pH [
4,
5], Sodium [
6,
7,
8], Lactate [
9,
10], conductivity [
11], alcohol [
12], as well as sweat rate detection [
13,
14]. Although sweat information can provide important information, this data would be more beneficial if it was provided in real-time. Therefore, similar to any physiological activity monitoring systems, such as heart rate or temperature, portable and real-time sweat monitoring devices were explored [
11,
15,
16,
17].
With the real-time sweat monitoring devices on the rise, sweat collection methods become more crucial. Traditional methods, such as whole body wash [
18] or absorbent pads [
19] cannot be used for these portable devices, where only microliters of sweat are necessary. Therefore, significant efforts were spent on first modifying the traditional sweat collection methods to fit into a smaller form-factor for portability, such as Macroduct [
16,
20] (a commercial sweat collection device that was developed for Cystic Fibrosis diagnosis on infants [
21]), fabric wicking [
6], and modified absorbent pads [
22]. Currently, devices that are directly exposed to the skin were developed as tattoos [
9,
23] and flexible substrates [
15,
24]. Recently, a conductive thread-based textile sweat sensor was developed that has a novel approach of using an embedded conductivity sensing into the fabric; eliminating the need of sweat collection [
25].
There has yet to be an established method of testing these devices despite the extensive device development attempts. Obviously, human subject tests are the golden standard to validate a device for real-time human sweat monitoring. However, using human subjects during the development of the device itself is time-consuming and characterization cannot be performed due to the variance of sweating mechanisms, not only from subject to subject, but also different regions or times of sweat collection from the same subject [
26]. Most of the researchers settle with traditional methods of preparing artificial sweat in various concentrations in advance and running the sweat solution through a syringe pump to simulate the rate of sweat [
16,
27]. A standardized testing platform with an automatically controlled sweat concentration generation system would help to accelerate the development of sweat collection, concentration, and sweat rate devices. It should be noted here that this kind of platform does not eliminate the need for human trials. It is known that hundreds of preliminary testing would be needed before human trials during wearable device design and prototyping. A testing platform would significantly reduce the development testing phase of a sweat sensor device prototyping. The validation would still need to be done via human trials. However, the premature testing of sweat sensor prototypes on humans complicate the device optimization, as various parameters need to be taken into account before making sure that the device operates as intended. A standardized testing platform would allow for researchers to explore more ideas and prototype versions before validating the best design on humans. For example, Heikenfeld’s group has developed an artificial skin model that is useful in characterizing sweat collection devices [
28]. This model is suitable for sweat collection research and it could potentially be used in a testing platform that is proposed in this article. Similarly, textile-based devices [
25] could also be more realistically tested on a sweating platform. Furthermore, other flexible sensing prototypes, such as breathing rate devices based on moisture sensing, could also be tested on the sweating arm model [
29].
Sweating occurs through sweat glands that are distributed throughout the human body [
17,
30]. Sweat is secreted in sweat coils under the skin and is brought to the skin surface through the sweat ducts that have pores of around 50 µm. The main purpose of eccrine sweat glands is to regulate body temperature through cooling. As the sweat evaporates through the skin, the temperature of the skin is lowered to help cool down the core body temperature. A number of sweat glands in a body region vary significantly between 150 glands/cm
2 (forearm) to 600 glands/cm
2 (hand) [
31]. Therefore, testing a sweat sensing device in various regions of the body produces different results and it should be accounted for during validation.
In this article, we propose an automated and computer controlled testing environment for sweat monitoring devices. Through a simple graphical user interface and the close replication of a human arm, the proposed system allows for the testing of sweat monitoring devices in different shapes and sizes. With an emphasis on user intuitiveness, the system was designed, whereby the user is not required to program to test the device. Furthermore, extensive statistical experiments have been conducted to validate reliable system operation in various conditions.
2. Materials and Methods
The primary element used in the proposed system is the testing solution that was obtained by combining saline solution and water in a mixing tank, both of which are initially stored in individual 1.5-L buckets (Marinecolor® Acrylic Made Liquid Storage Bucket from Amazon (Seattle, WA, USA). Both the water and saline solutions are extracted from their respective tanks through a brushless DC motor (Anself Ultra-quiet Mini DC12V Micro Brushless Water Oil Pump 240 L/H 5W Lift 3M from Amazon (Seattle, WA, USA) and a 0.25 inch quick connect check valve (Hydronix from Amazon (Seattle, WA, USA) that is attached at bottom of each tank. The extracted liquids are mixed in two steps to obtain a uniform concentration of the testing solutions. In the first step, both the extracted liquids from the pumps are sprayed into the mixing tanks via multiple three-dimensional (3D) printed sprinkler modules (Stratasys Objet30 Pro and PolyJet VEROBLUE RGD840 as the printing material). This uniform spraying mixes both liquids as they gravitate to the bottom. In the second step, a peristaltic DC pump (Langer Instruments—Model: BQ50-1J-A, Tucson, AZ, USA) placed in the middle of the tank to extract and pump the solution on a continual basis to obtain the desired uniform concentration and flow rates of 0.25 µL/min to 20 mL/min in the testing solution. Once the testing has completed, the solution is drained through the brass liquid solenoid valves (Adafruit—product ID #996, New York City, NY, USA) to the bottom trash bin. The custom-made metal controller box (Diarco model 16–24 hand press brake was used) was used to place all of the electronic components where a metal frame was slid into the box.
The automation of the test setup was accomplished by utilizing a Raspberry Pi 3 single board computer (SBC) to control the onboard electronics, conduct data analysis, and present the user interface. The concentration of the mixed testing solution was tested on a continual basis while using the Atlas Scientific EZO-EC conductivity sensor (Amazon, Seattle, WA, USA). The analog voltage signal from the conductivity sensor was communicated to the SBC via the conductivity circuit. If the concentration of the testing solution is not at the desired level, the appropriate motors from a water tank or saline solution tank are activated to pump more liquid into the testing solution. An eight-channel DC 5 V relay module (JBtek 8 Channel DC 5 V Relay Module from Amazon (Seattle, WA, USA) was used to control each pump in order to provide sufficient current to drive the motors and electronically isolate the pumps from SBC. Reliable pump and sprinkler operation was ensured via a separate 110 V to 5 V (10 A) and 100 V to 12 V (10 A) switching power supplies, respectively. The analog signal that is required to control the pumps was generated via the MCP4725 12-bit digital to analog converter and the SBC. When the desired concentration of the testing solution is obtained, it is pumped to the arm model via a 0.25-inch microflow silicone tubing, which is optimum for the required flow speeds with the peristaltic pump that is used in this setup. This arm was developed using Dragon Skin 10, and body double fast set lifecasting platinum silicone accompanied by the universal mold release (Smooth-On, Lehigh, PA, USA). Dragon Skin 10 was chosen for its quick cure time (30 min) and flexible surface properties, which are close to human skin (shore A hardness of 10 A).
The program for the SBC was written in Python and the graphical user interface (GUI) was created by utilizing the general-purpose Tkinter module. The program allows for (a) manual control of all pumps, (b) the ability to continually check saline conductivity, (c) a cleaning function, and (d) the ability to run a trial at a desired conductivity and flow rate.
3. System Design
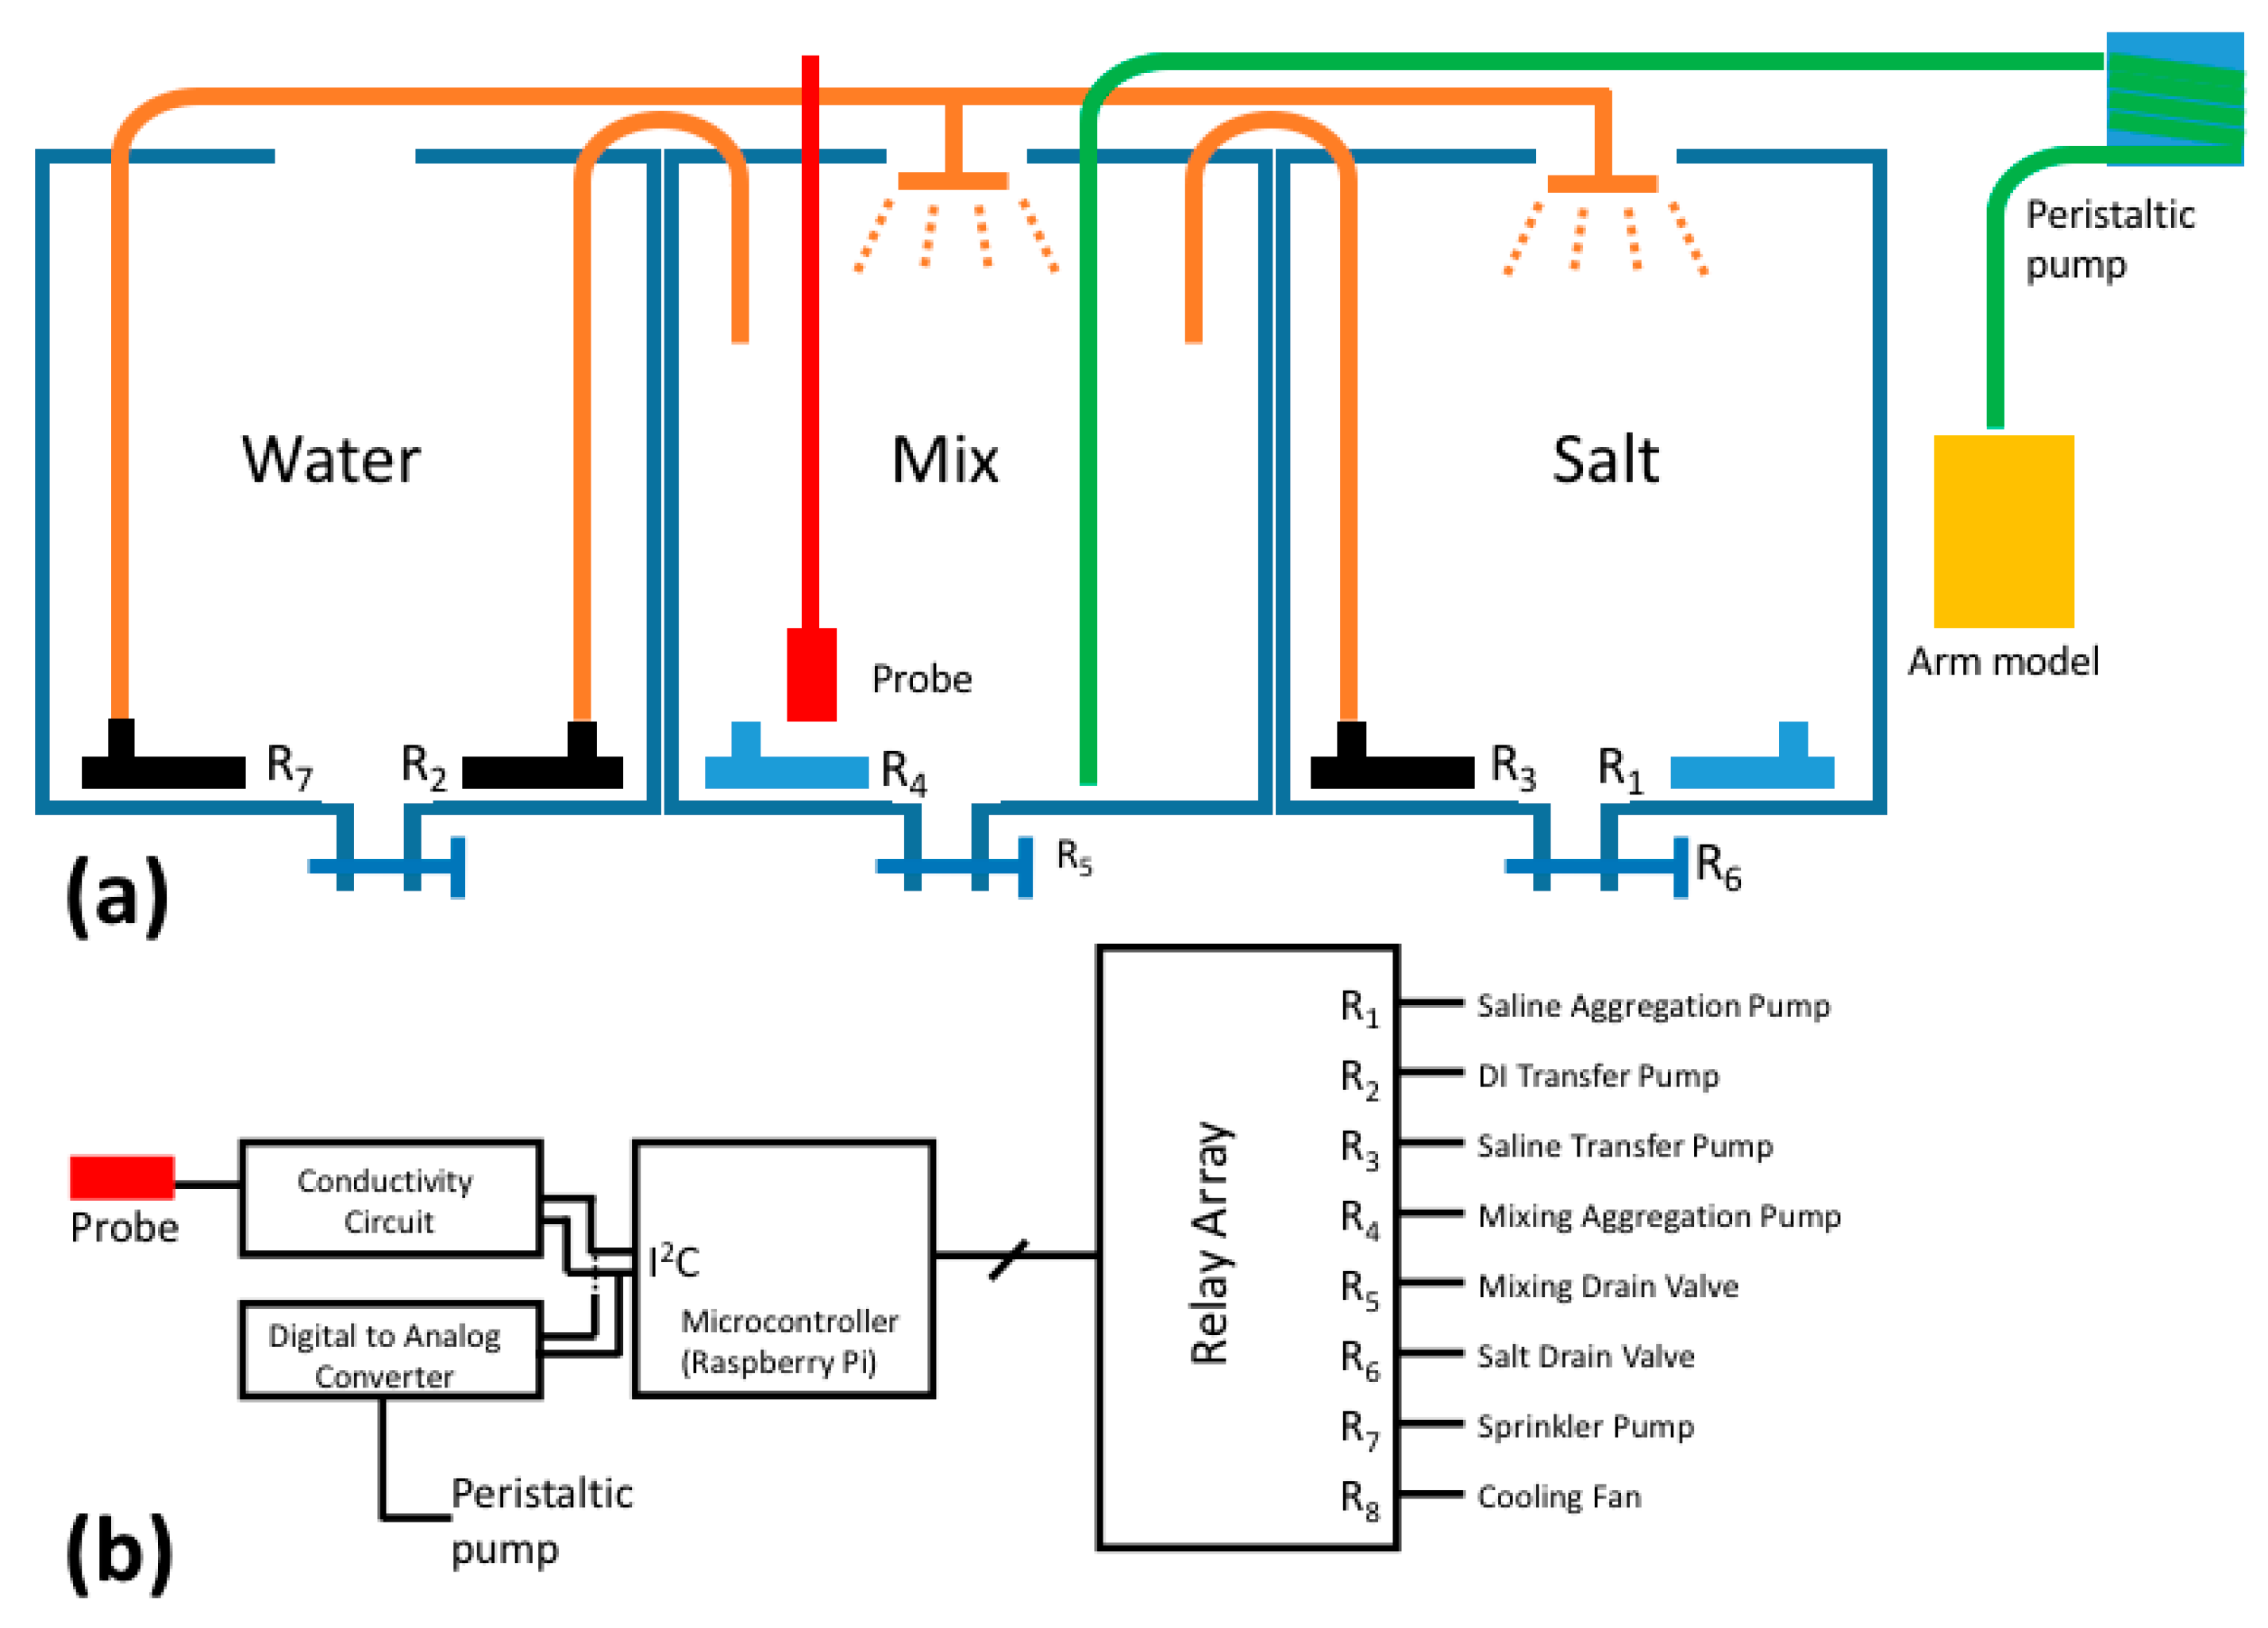
Figure 1a shows the overall view of the sweating arm prototype. There are three tanks that are responsible to mix the set amount of concentration and volume. Water tank only has DI (deionized) water, whereas salt tank has a predetermined, high concentration salt solution. The tank in the middle is the mixing tank in which the water and salt solutions are proportionally added, depending on the desired salt concentration. The amount of mixing solution (i.e., the sweat) can also be adjusted. The desired salt concentration and volume are controlled by turning on relays (R2 and R3) at certain time intervals to make sure the correct amount of solution was added. A control feedback loop was also incorporated into the mixing tank to make sure that the salt concentration is at the right level. A salinity sensor (illustrated as “probe” in
Figure 1a) was used for this purpose; a lower than desired salt concentration triggers the relay from the salt tank in order to increase the salt concentration of the mixing tank, whereas the relay from the water tank was initiated if a higher than desired salt concentration was detected. Two mixing pumps that were placed in the bottom of the salt and mix tanks (R1 and R4) were used to continuously stir the solutions to prevent aggregation.
A peristaltic pump was used to bring the solution to the arm at a specified flow rate (i.e., the sweat rate) once the mixing solution is ready. The tubing from the peristaltic pump goes through a multiplier joint to come to the arm from close holes that represent the sweat pores on the skin. A two-step flushing system was designed and implemented. The tanks were first flushed by enabling the relays at the bottom of each tank to a water bin (R5 and R6). Once the flushing is done, the tanks were rinsed from the top by turning on R7, which allows water to run through the 3D-printed spray heads on the top, so as to make sure tank walls are not contaminated with residual salt water for another test.
Figure 1b gives the circuit schematic for the electronics. A peristaltic pump is controlled via a digital to analog converter (DAC), as the pump works with analog inputs. The probe information is brought to the SBC via a conductivity circuit. Both DAC and the conductivity circuit are connected through the I2C bus control on the SBC. An eight-bit parallel connection to the relay array controls the individual relays for aggregation (R1 and R4), transfer (R2 and R3), drain (R5 and R6), and sprinkle (R7) operations. An eighth valve (R8) was used to activate the cooling fan for the electronics in the box.
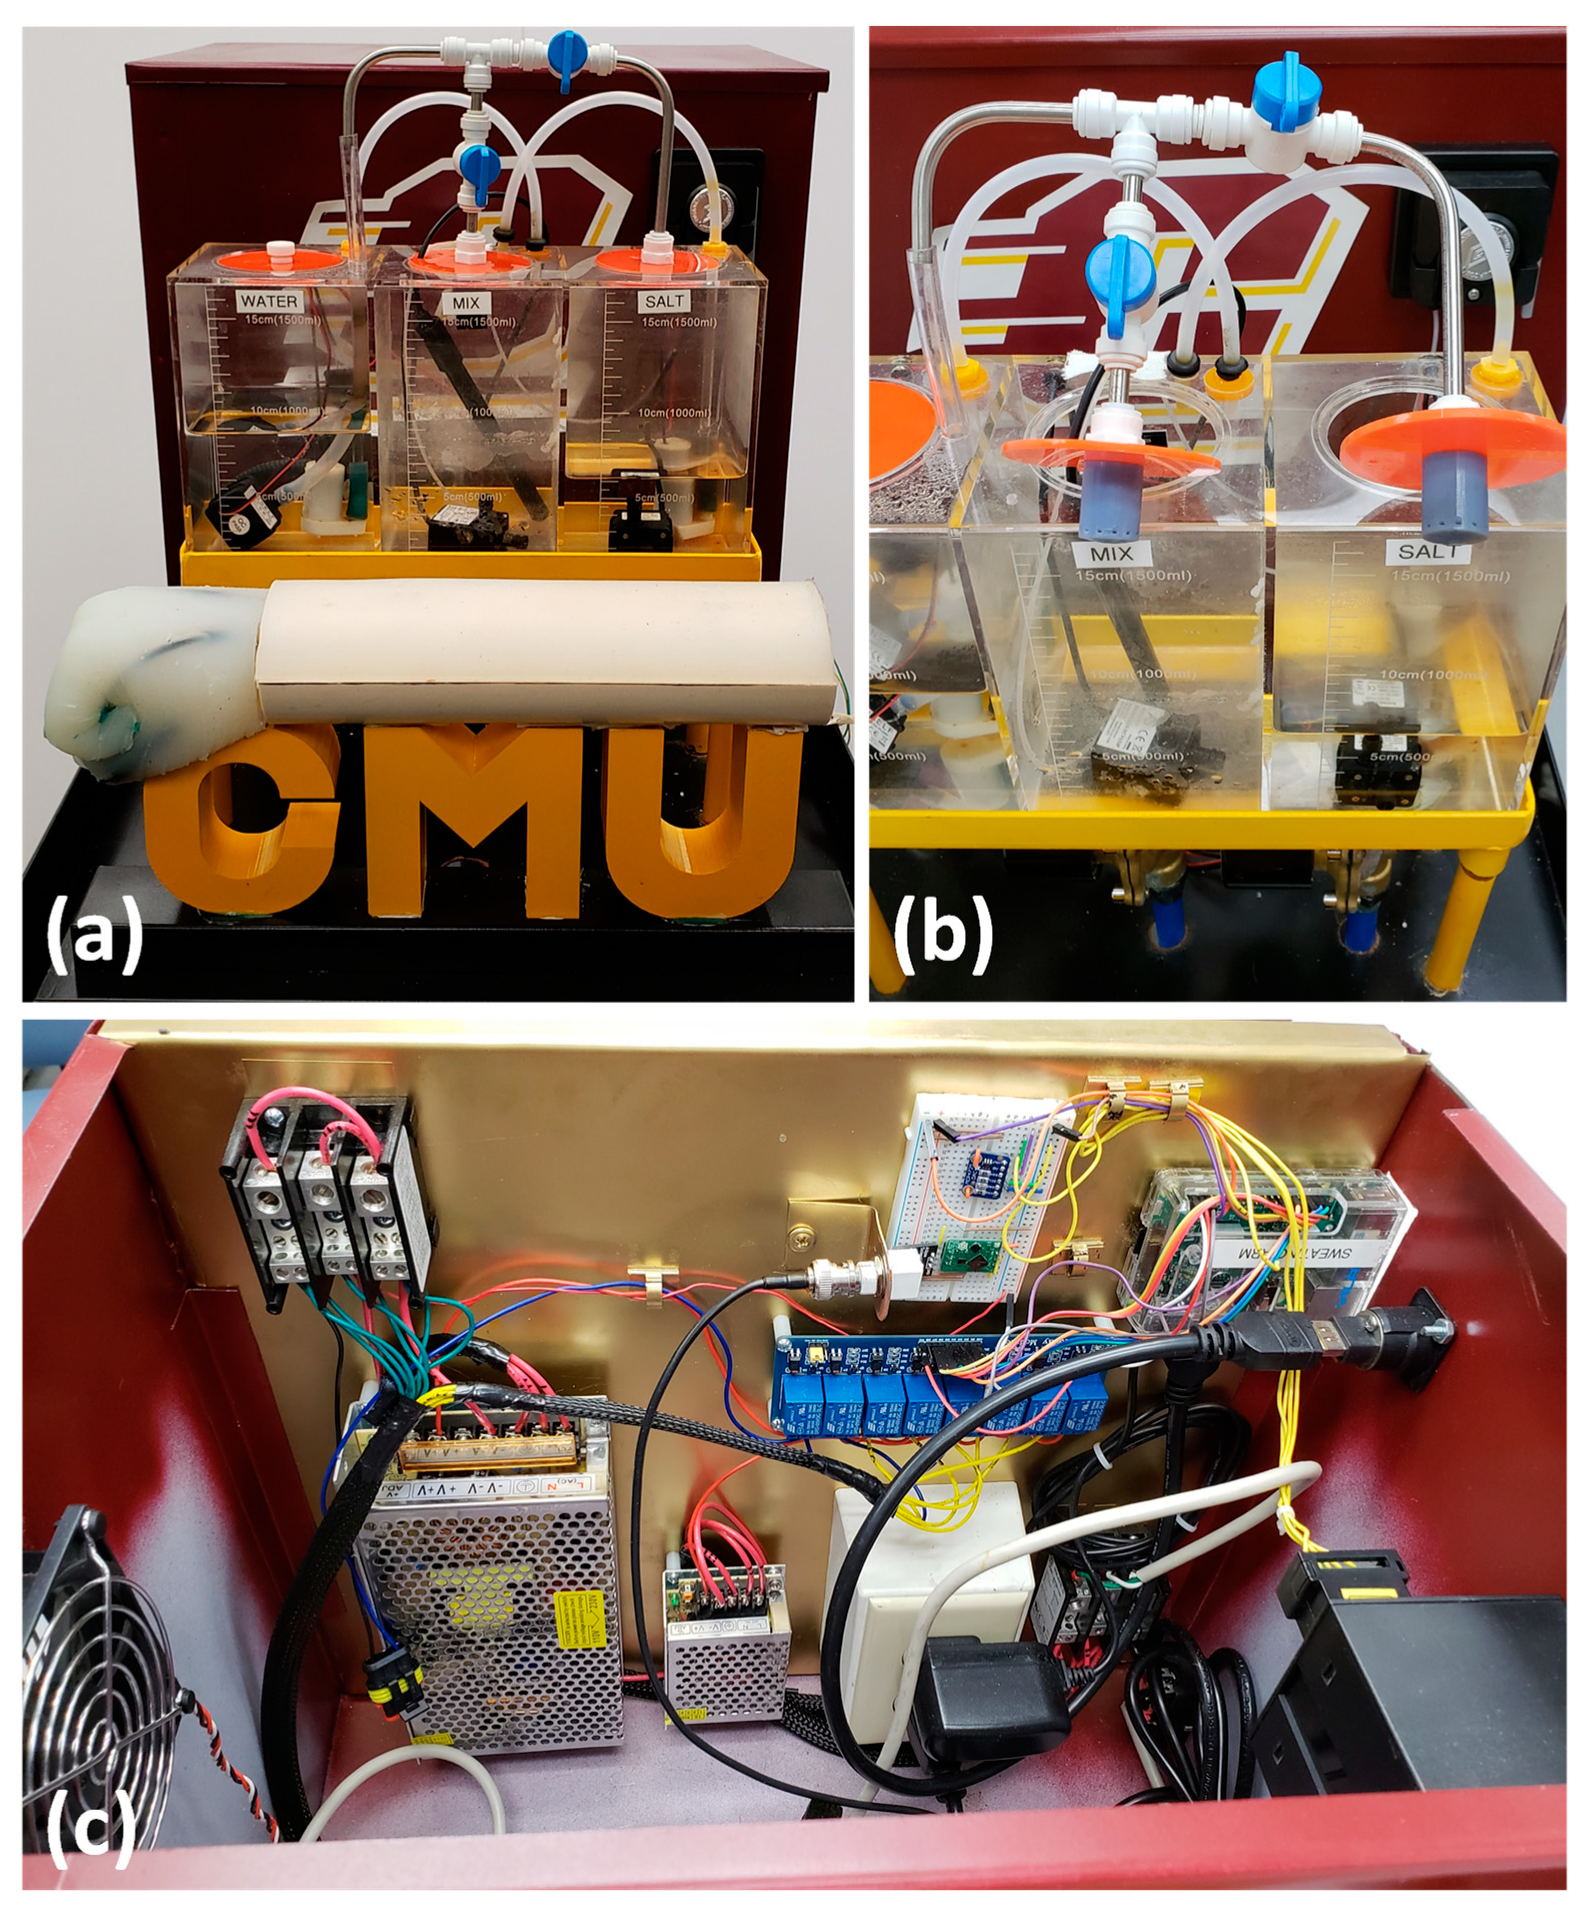
Figure 2a shows the overall physical view of the system. The arm was placed on a stand (C, M, and U letters, representing Central Michigan University) for easy access. The tanks were placed on an in-house made metal stand to accommodate flushing valves.
Figure 2b shows a zoomed view with sprinkler heads that were used to rinse the salt and mixing tanks. The electronics and relays were placed in a metal-bent box to eliminate connection issues, as shown in
Figure 2c. The box was designed by considering the electric codes. The system was housed on a cart for portability and was ready to be plugged into a keyboard, mouse, and monitor.
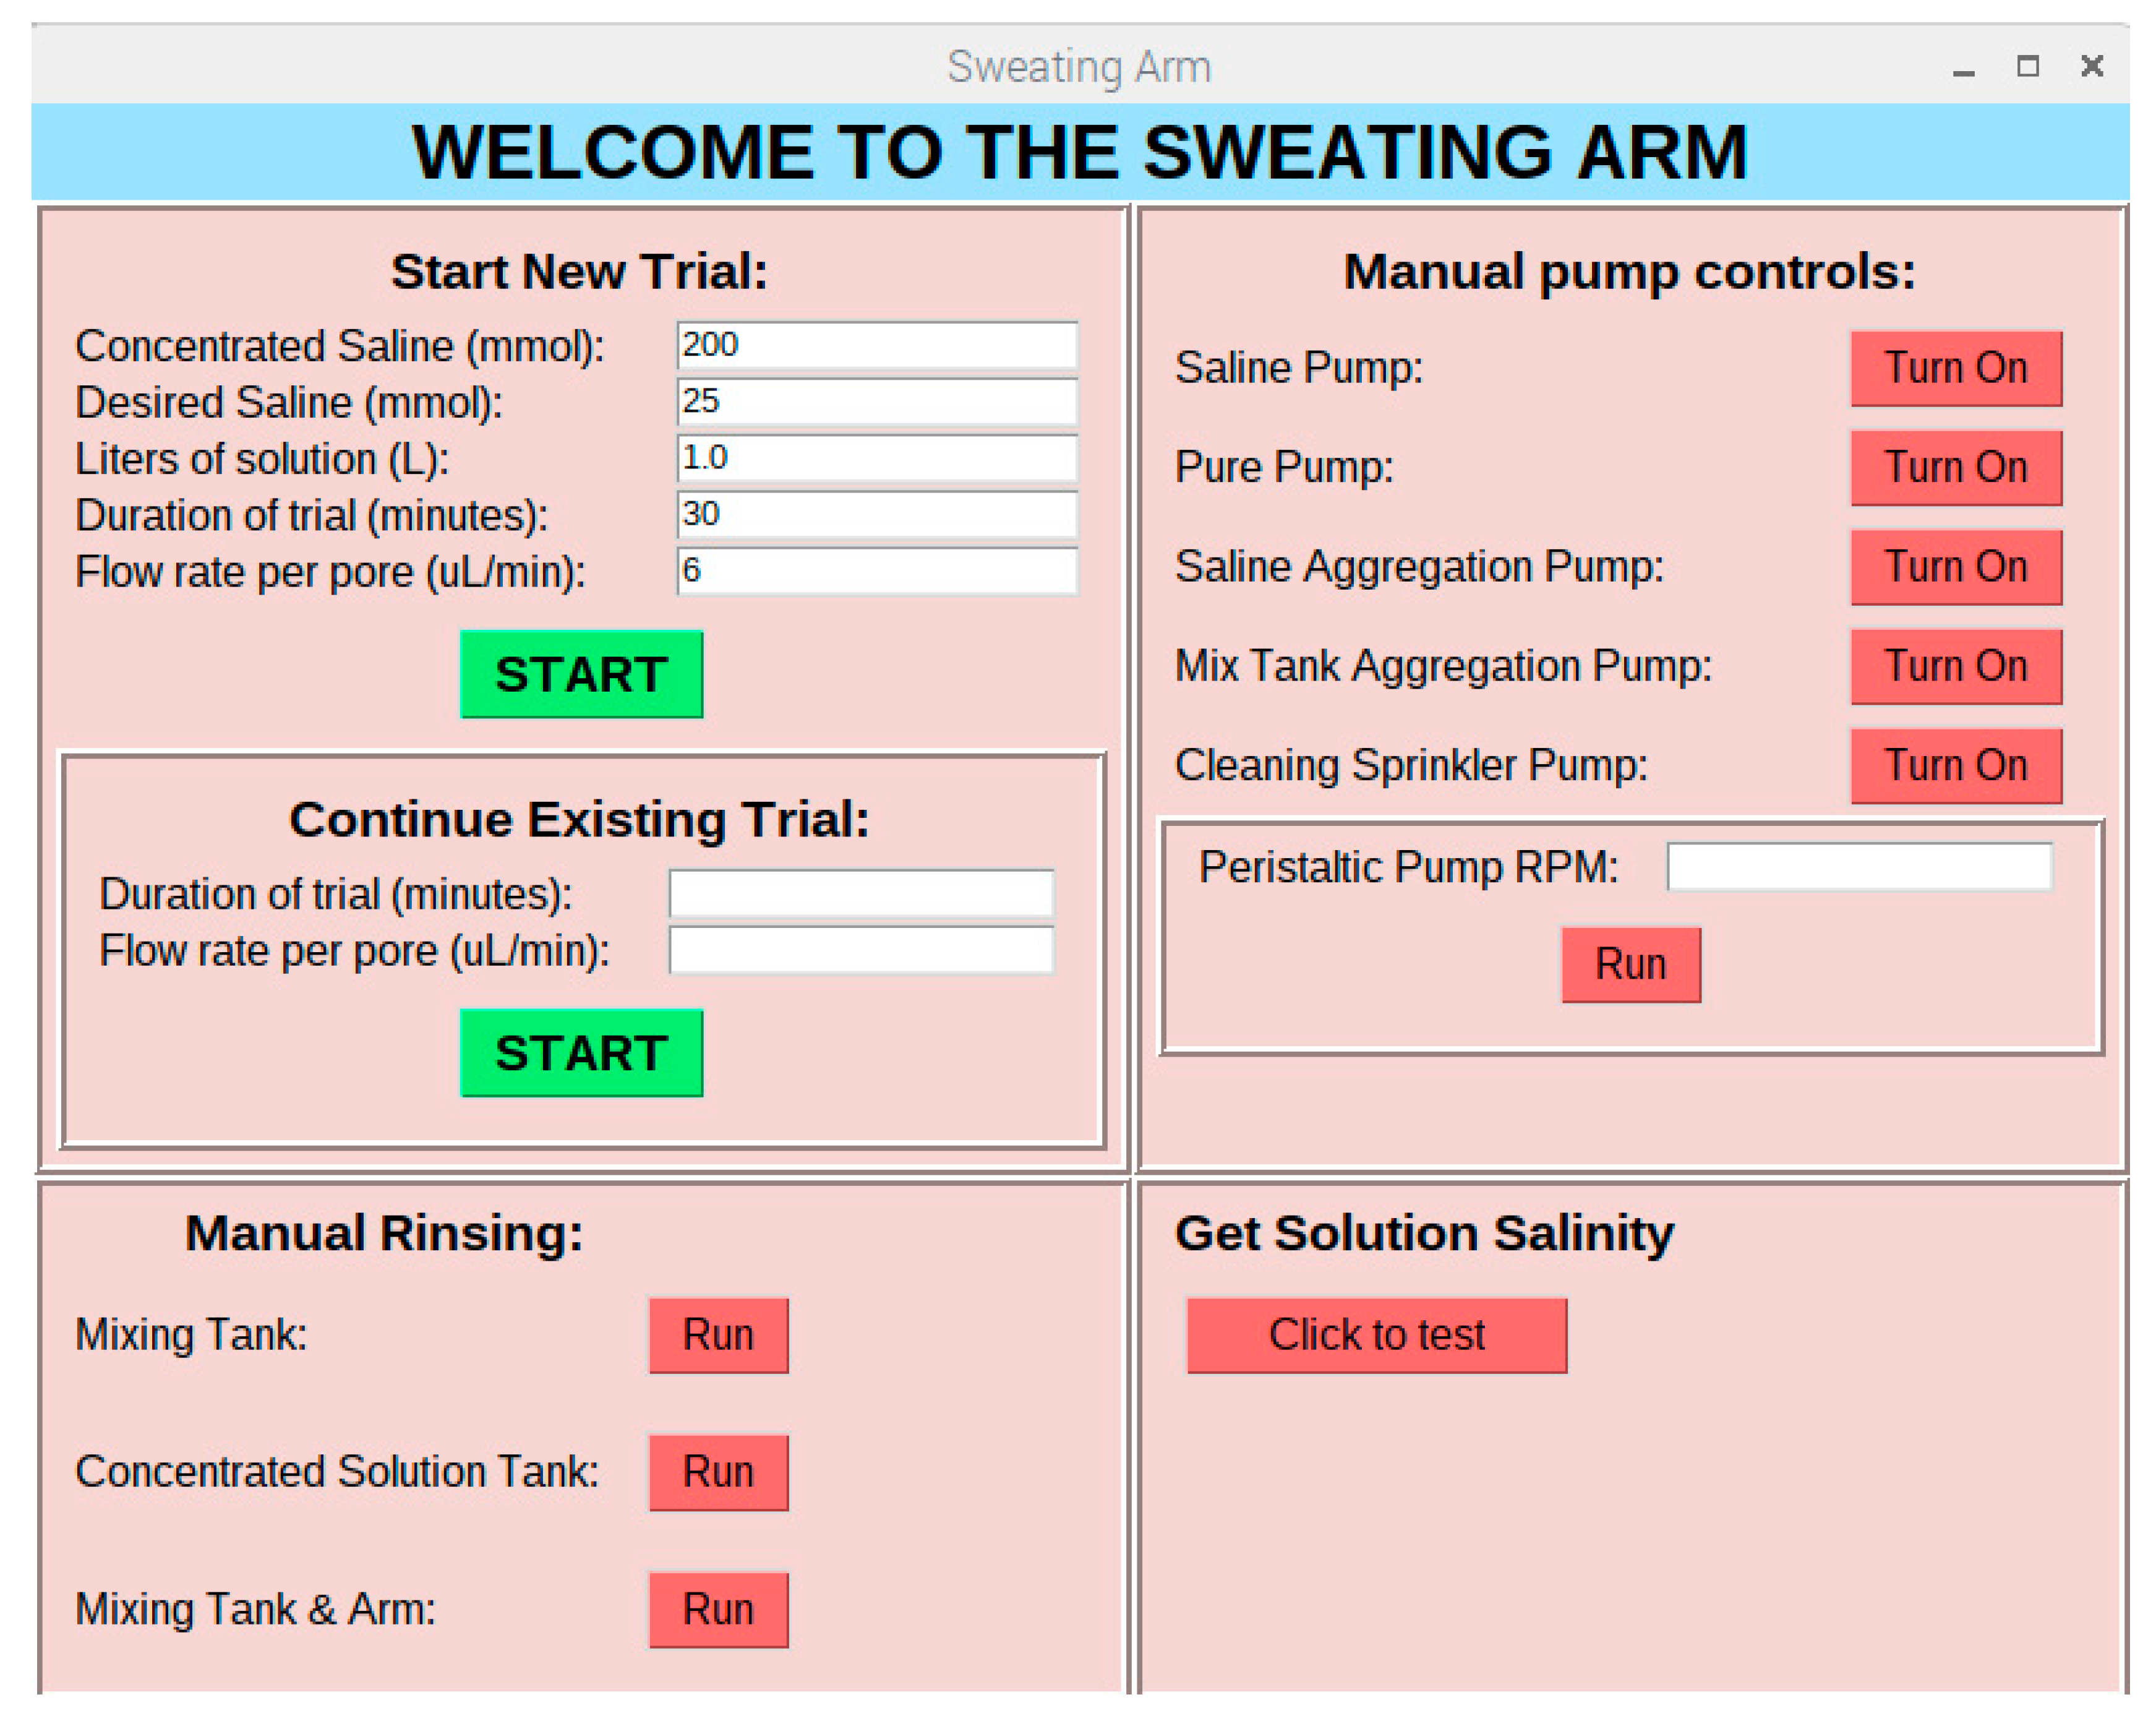
A Graphical User Interface (GUI) was built for the ease of operation as shown in
Figure 3, which eliminates the need for programming by the end user. The interface allows for the manual control of all pumps, checking saline conductivity, a cleaning function, and run a trial at a specific concentration and flow rate.
4. Implementation & Results
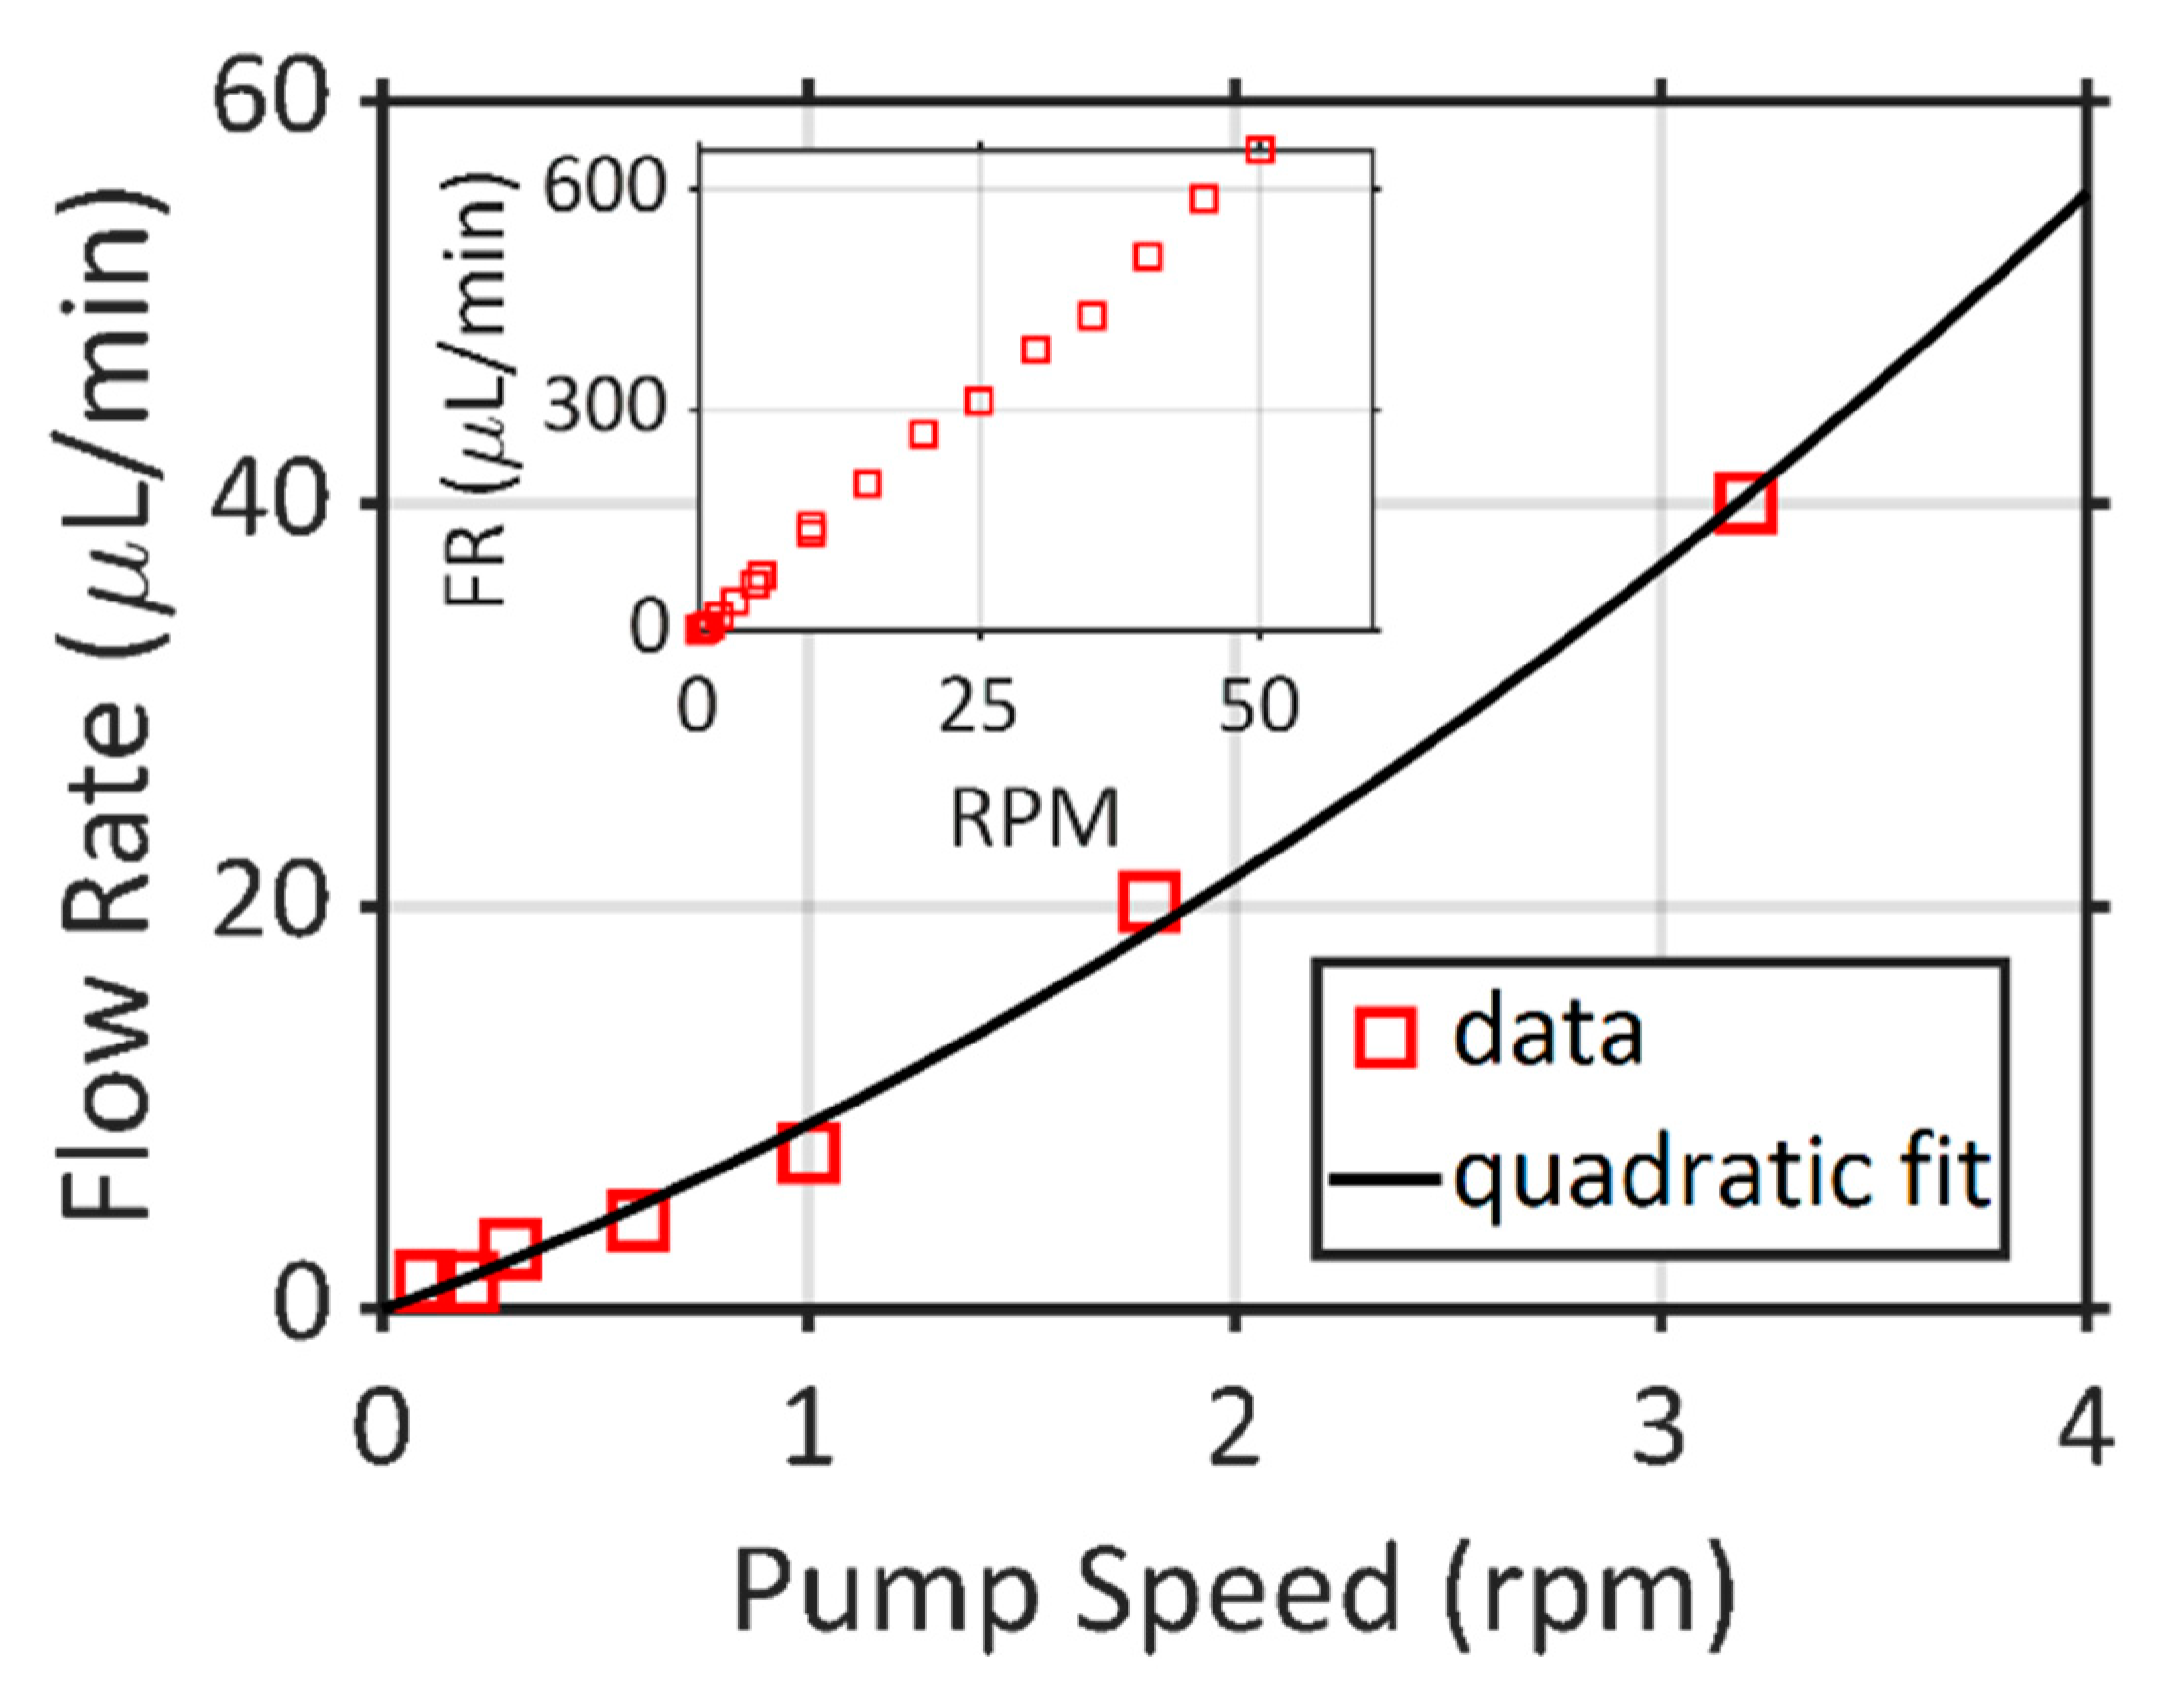
In order to characterize the functionality of the sweating arm system, first, the peristaltic pump was tested. The pump speed in revolutions per minute (rpm) was changed to measure the DI flow rate that comes out the pores of the sweating arm. Letting the arm sweat for a certain time and collecting the resulting DI water and measuring the volume was done to collect the tests. These measurements were conducted in a way where the sweating tubes were collected in a polystyrene weighing dishes and the volume was measured from the weight of the dish as it is filled with sweat. A high resolution weighing scale was used and measurements were done in a closed chamber to prevent water evaporation. The pump speed was directly controlled from the GUI that is shown in
Figure 3. The results were given in µL/min to put it into context with the standard notation of sweat research.
It can be seen from
Figure 4 that the peristaltic pump provides a quadratic control over the flow rate in interest. A second order polynomial was fit (root mean square value of 0.8901,
R2 = 0.9955, and standard deviation of 0.9614) to the data for the slow flow rates (
FR) for varying pump speeds (rpm):
The pump speed can be increased to 50 rpm for high flow rates, as shown in
Figure 4 inset, which would result in a mostly linear increase. However, it is important to note that the flow rate range for athlete sweat rates is less than 50 µL/min [
12]. It is clear that the arm prototype is able to create fluid dispersion at a rate that is compatible with human sweat rate.
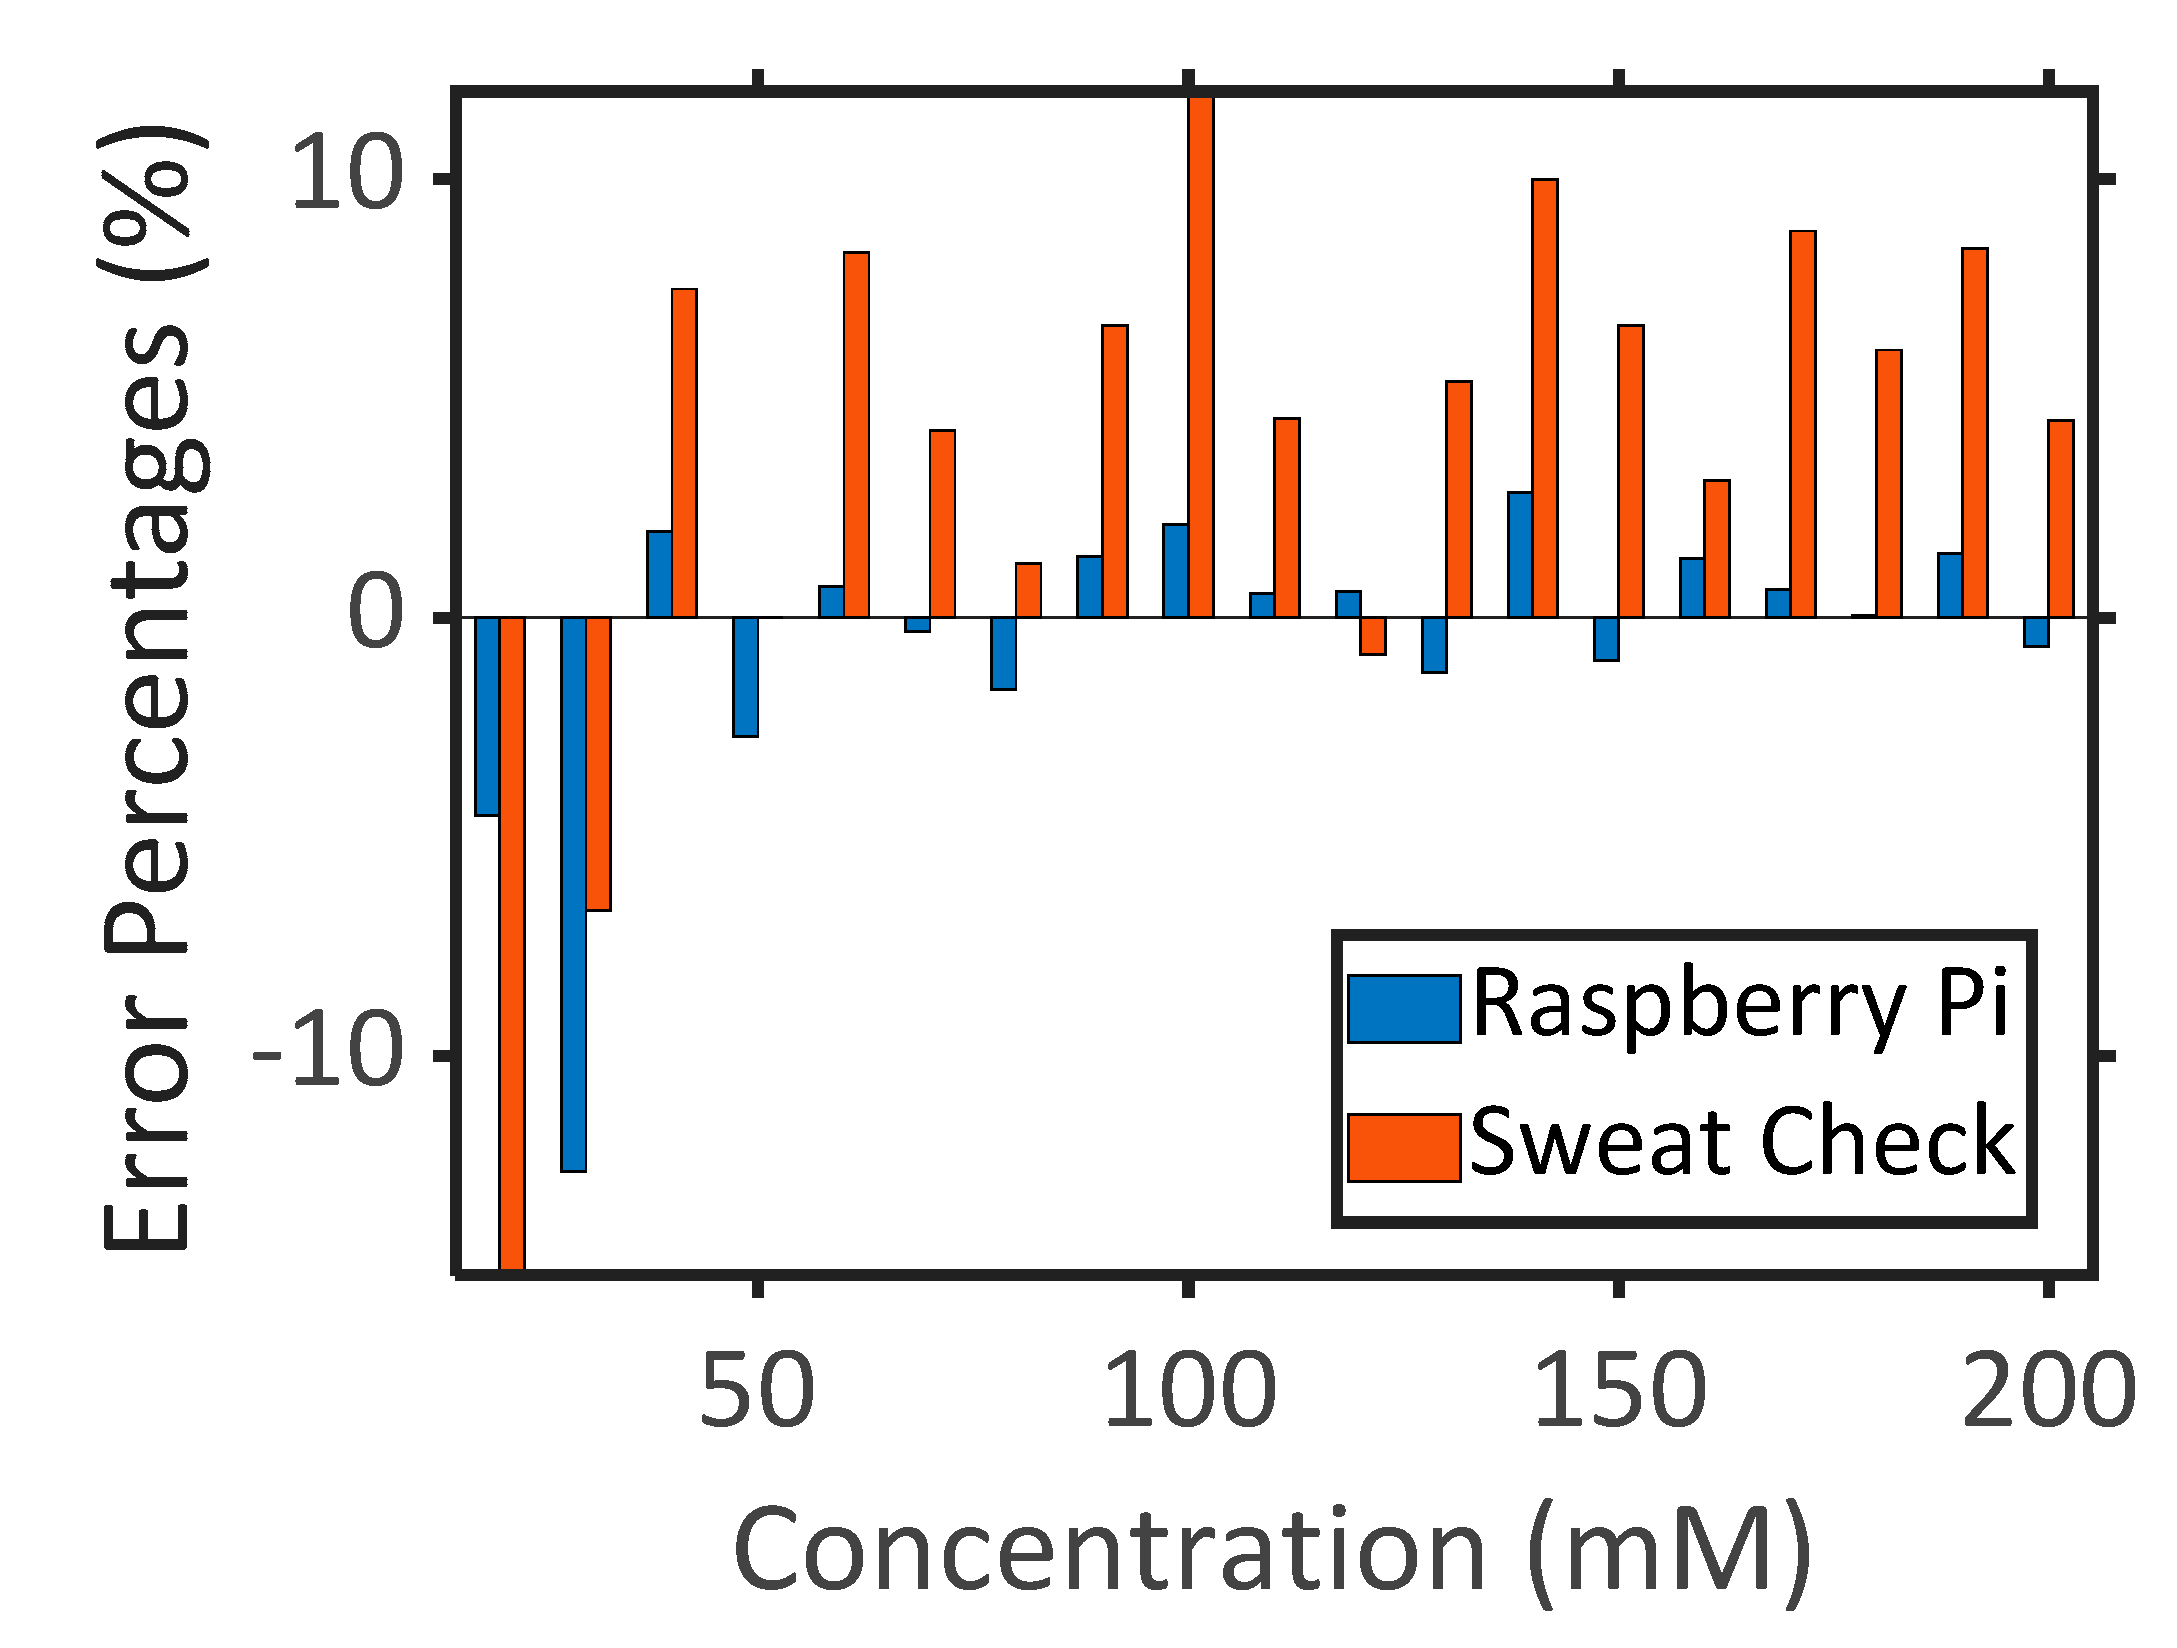
Another aspect of the sweating arm is the controlled concentration of liquids. The sweating arm was designed to provide different concentrations of salt as proof of concept. The concentration was measured via the salinity sensor and was calibrated real time to reach the desired concentration. The desired solution was generated using the feedback that was received from the salinity sensor, which was set to 3% error range. Therefore, the sweating arm system would stop the electroconductivity calibration once the set concentration and desired concentration values are within 3%. A commercial sweat salt checker (Sweat-Chek) was utilized in order to further validate the sweating arm-generated solutions. Once the sweating arm generated the desired solution through the input to the GUI, the concentration of these solutions was measured with the Sweat-Chek again. The percentage errors were calculated as (measured concentration—set concentration)/set concentration × 100 and are plotted in
Figure 5. It is clear that the error in Sweat-Chek device was higher; 6.2% of an average with respect to 2.0% of an average for the sweating arm. We were unable to reach these margins with the commercial system that we calibrated, even though Sweat-Chek data sheet states the error should be within 2% for the range of 75–110 mM, w. Error margins for very low concentrations were much higher for both measurements due to the resolution limitations of both systems.
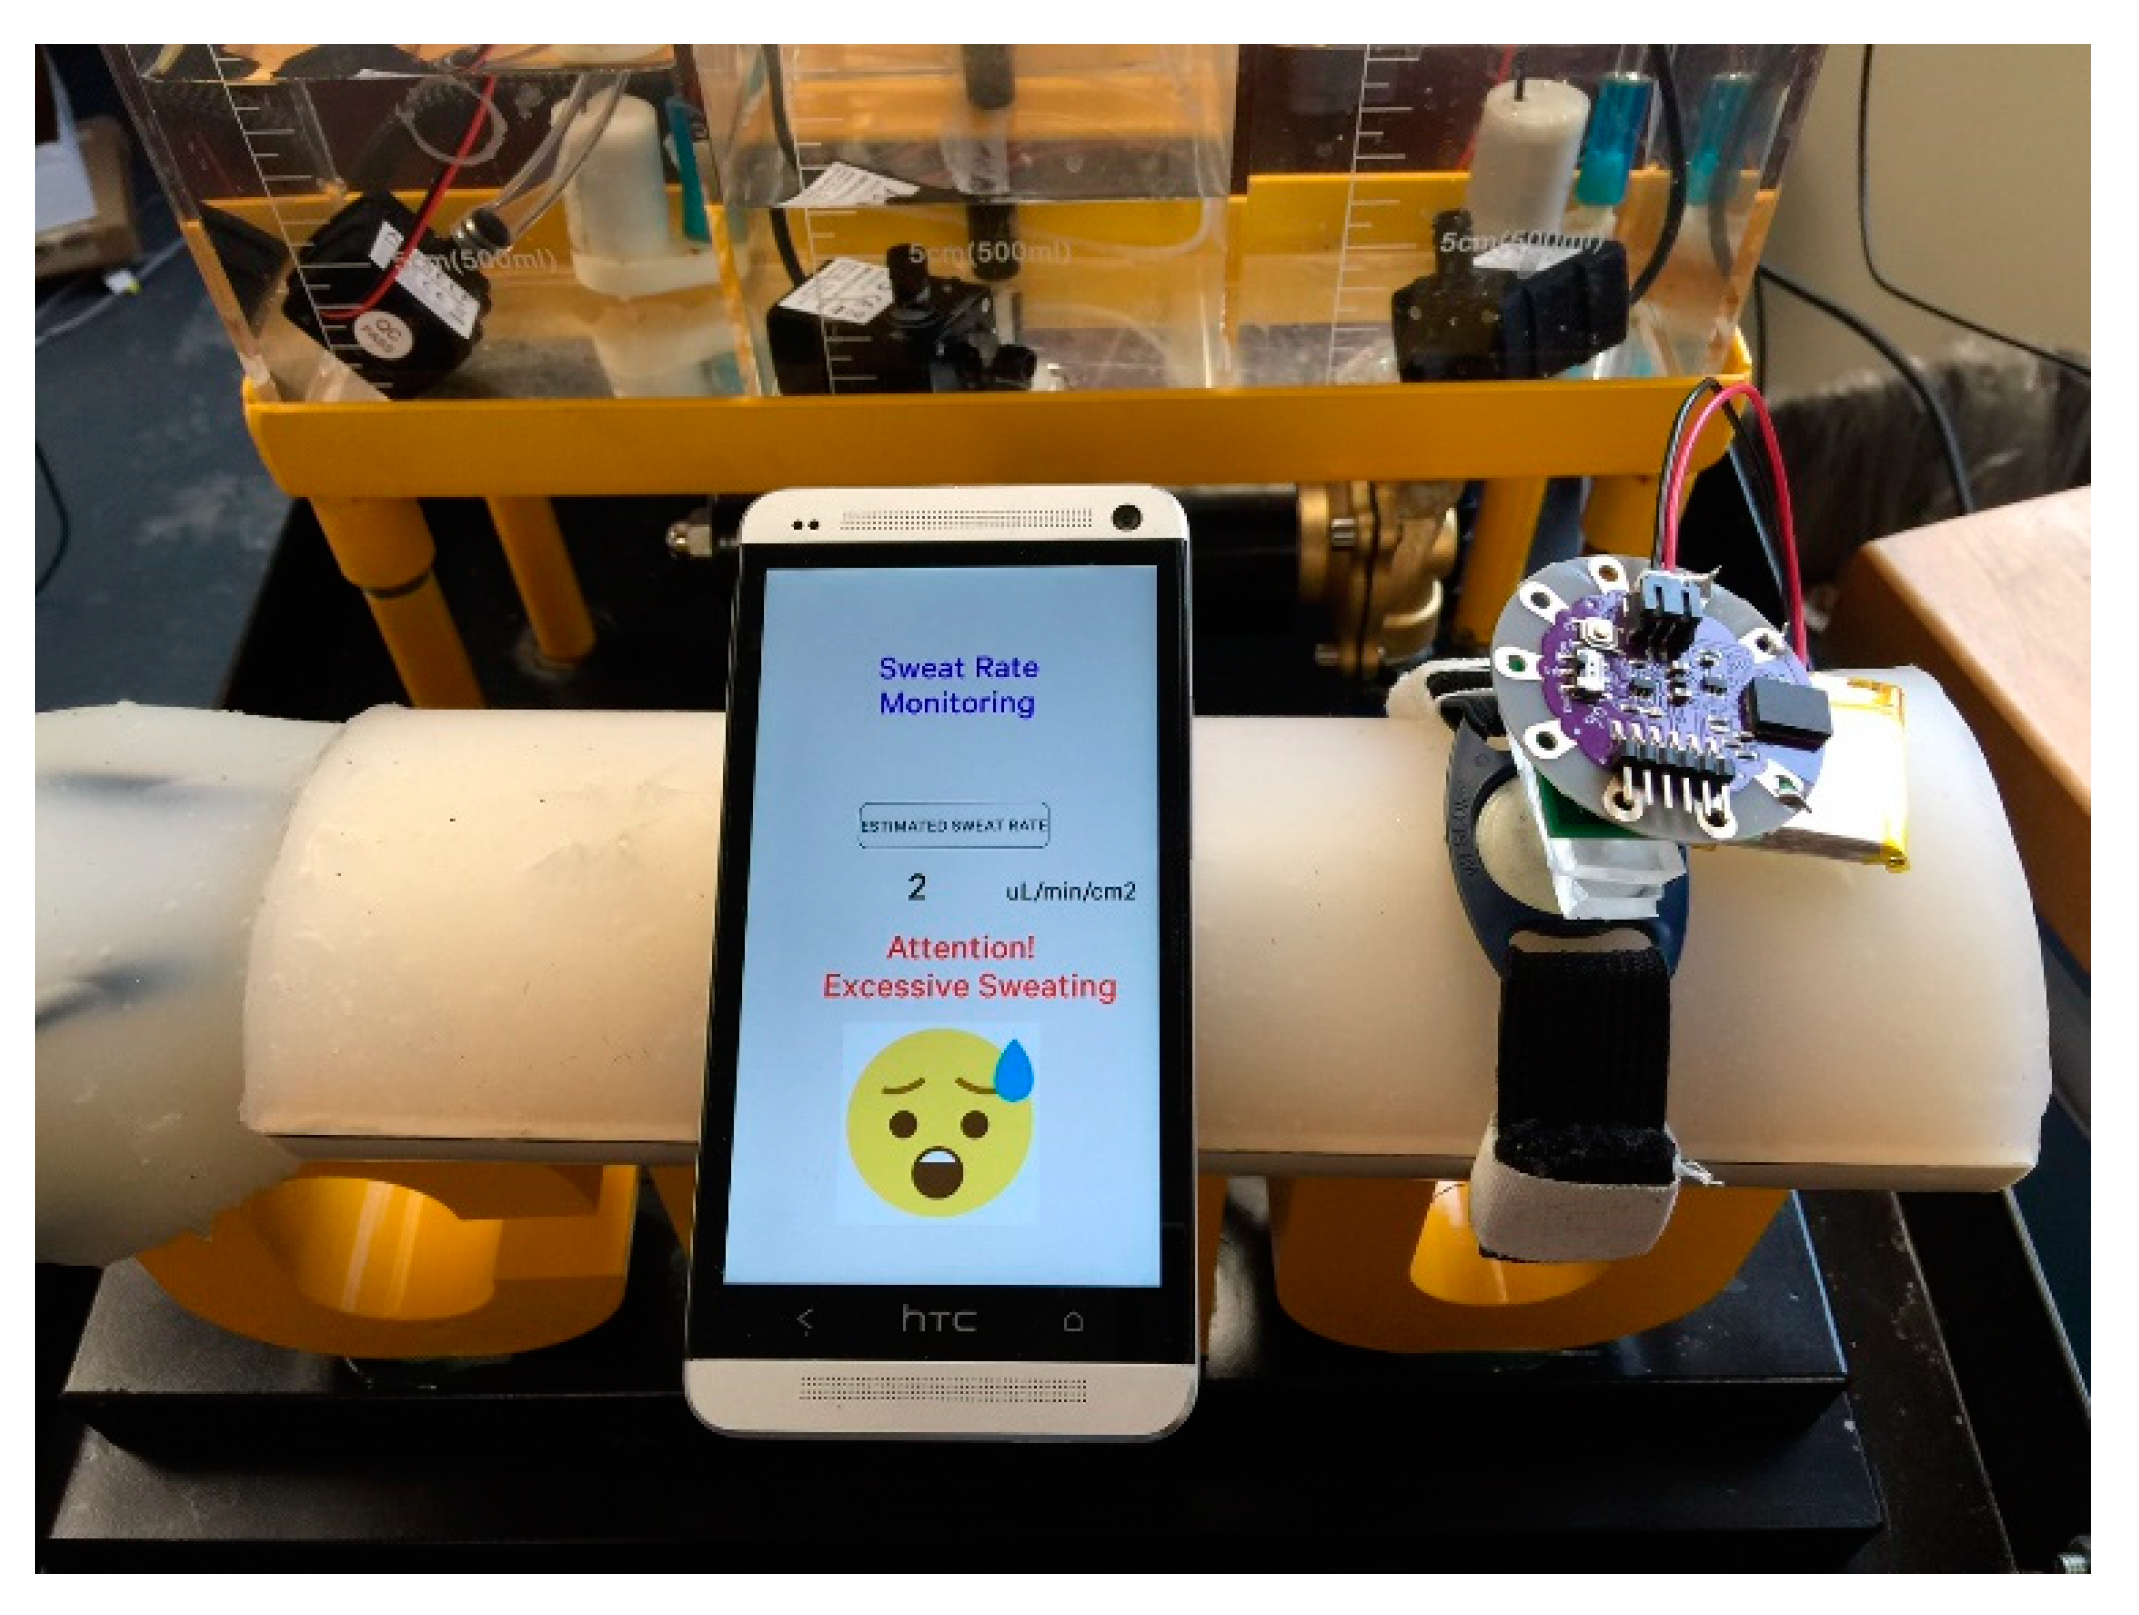
A recently developed sweat rate sensor [
14,
26] was tested on the arm in order to show the functionality of the dispensing capability of the system. The sensor was attached to the arm and tests were conducted. The smartphone shows the results of the sensor device (
Figure 6). The detailed calibration of the sweat rate sensor is provided in [
14]. As the proof-of-concept, the sweat rate was set to 10 µL/min, which translates to 2 µL/min/cm
2 provided the area of the Macroduct sweat collector shown in
Figure 6 is 5 cm
2. It is clear that the desired flow rate that is set by the arm model was achieved at the sweat rate sensor device. This approach gives easy access to testing systems and eliminates the need for human subjects during the device development phase.
The platform has two main aspects: liquid mixing and dispensing. Liquid mixing was performed in a closed-loop system, where the desired concentration was adjusted through the feedback of a commercial conductivity sensor real time. Therefore, this aspect of the testing platform was considered to be reliable as the system uses a commercial product. On the other hand, the aspect of flow rate needs to be verified by taking the environmental conditions into account, since several manipulations to the system were made besides the commercial peristaltic pump, such as the arm cast, sweat holes on the arm, and additional tubing that are required for liquid deliver from/to the peristaltic pump. Therefore, statistical analysis using analysis of variance (ANOVA) was performed on the testing approach to determine how relative humidity (RH), temperature, and concentration (CN) would affect the flow rate (FR). Each parameter was changed and flow rate values were tested in order to test these interactions. Therefore, the following assumptions were made for statistical analysis purposes: First, it was assumed that variation in relative humidity (RH), temperature, and concentration (CN) will not produce diverse results with respect to flow rate (FR). Apart from these factors, various other factors might influence the flow rate. However, it is assumed that all of the other factors do not have a major effect on the flow rate, and so they have been blocked to suppress their respective effects. This includes the measurement precision suppressed by using the same measuring instrument for all the tests and human error that is a complex aspect to address, but was suppressed by making sure that only one person records all of the readings. Further, the experiment is randomized to prevent unspecified disturbances that are associated with time, location, or order of observation from being confounded with effects. This allowed for the assumption that errors are independently distributed random variables.
A hypothesis was made to determine the effect of RH and CN on the flow rate, if any, once the factors of interest were found. It was assumed that all of the RH and saline concentration results in the same flow rate in order to simplify the effects of RH and CN. With this assumption, a few hypotheses were formulated, including:
Overall
- ⚬
Null Hypothesis (H0): The flow rate for different RH on different CN will not vary.
- ⚬
Alternate Hypothesis (HA): Some RHs will result in higher FR than the other.
RH Effect
- ⚬
Null Hypothesis (H0): The RH type does not have an effect on the FR. All of the treatments effects, in this case, are equal to zero. i.e., τ1 = τ2 = τ3 = 0
- ⚬
Alternate Hypothesis (HA): At least one of RHs has a significant effect on the flow rate. i.e., at least one of τ ≠ 0.
Concentration Effect
- ⚬
Null Hypothesis (H0): The CN does not have an effect on the FR. All the treatments effects, in this case, are equal to zero. i.e., β1 = β2 = β3 = 0
- ⚬
Alternate Hypothesis (HA): At least one of CNs has a significant effect on the flow rate. i.e., at least one of β ≠ 0.
Temperature Effect
- ⚬
Null Hypothesis (H0): The temperatures does not have an effect on the FR. All the treatments effects, in this case, are equal to zero. i.e., α1 = α2 = α3 = 0
- ⚬
Alternate Hypothesis (HA): At least one of the temperatures has an effect. i.e., at least one of α ≠ 0.
Interaction Effects
- ⚬
Null Hypothesis (H0): None of the interactions have any effect on the flow rate. i.e., (τβ)ij = (βα)jk = (τα)ik = (τβα)ijk = 0
- ⚬
Alternate Hypothesis (HA): At least one interaction has a significant effect on the flow rate.
After all of the levels in factors of the study were found and the data collection strategy was formulated, the test was implemented to obtain the data using a random order. Temperature and RH tests were carried out in a walk-in, closed-loop environmental chamber. While the majority of the factors that might affect the flow rate were considered and precautions were taken, each test was replicated three times in order to account for any measurement error. The data analysis started with the assumption that the interaction of RH and CN does not have a significant effect on the FR. Additionally, it was assumed that different temperatures might have a significant effect on the FR. Accordingly, the temperature was held as constant and a Graeco Latin Square (GLS) design test was performed to observe whether the RH has a major effect on the FR. The saline concentration type was blocked and the RH used is randomized to find the effect of RH on FR. With the temperatures being included, the study had three factors to test for their significance. This can be found while using the GLS design. However, GLS helps in finding the significance of the main effects; it assumes that there is no interaction among the main effects. There is always a possibility that the interaction of the main factors might have a significant effect on the system output. A study was performed to identify the various methods by which the significance of interactions can be found to find this interaction effect. The Latin Square and Graeco Latin Square designs are ruled out, as they do not account for the interaction effects. The two-factorial design that was again ruled out as the study had more than two levels in each factor to test. Finally, the test method was determined to be the general factorial design, as it was possible to test for more than two levels in each factor along with accounting for the main factor interactions.
The flow rate data used to perform the general factorial test is shown in
Table 1 for three different RH (30%, 40%, 50%), CN (40 mM, 50 mM, 60 mM), and temperatures (20 °C, 27.5 °C, 35 °C). The values that were chosen were the most common values in human sweating and environmental conditions. A combination of factorials and randomization methods were used to collect a total of 324 (12 per combination of RH, CN, and T) test observations. The potential error from data collection methodologies and human error are minimized by converging the 12 observations to three averages that are presented in each cell of
Table 1. General factorial design test is performed on the above data and
Table 2 depicts the ANOVA results. These results clearly demonstrate that all of the main factors of relative humidity, saline concentration, temperature, and all of their interactions do not have any significant effect on the system flow rate, validating the statistical reliability of the proposed testing system.
It is important to note that the flow rate in actual humans (i.e., sweat rate) is significantly correlated to environmental conditions and the physical condition of the body [
11,
14]. The aim of the statistical analysis in this work was to show that the environmental conditions of the test setup do not affect the accuracy of artificially generated flow rates, which is important for the consistent testing of a sweat sensor before the sensor is tested on humans.


 and
and 


