Article

Development of a Stand-Alone Photovoltaic System Considering Shaded Effect for Energy Storage and Release

Department of Electrical Engineering, National Chin-Yi University, No. 57, Sec. 2, Zhongshan Rd., Taiping Dist., Taichung 41170, Taiwan
*
Author to whom correspondence should be addressed.
Electronics 2019, 8(5), 567; https://doi.org/10.3390/electronics8050567
Submission received: 17 April 2019 / Revised: 11 May 2019 / Accepted: 19 May 2019 / Published: 22 May 2019

Abstract

:
The purpose of this study was to develop a photovoltaic system that stores energy for use in direct current micro-grid systems or to supply electric power to consumers living in remote areas. If the photovoltaic module array is shaded, the signals of conventional maximum power point trackers (MPPT) may be trapped at the local power maxima. Therefore, this study developed a smart maximum power point tracker to track the maximum power point (MPP). The control method adopted a teaching learning based optimization (TLBO) algorithm. To adjust the energy flow direction of the direct current load terminal, this study proposed an energy accumulation and release strategy that used a high-boost/buck-ratio bidirectional converter to control the battery charge and discharge for energy accumulation and release. In addition, this study developed an inverter to convert direct current into alternating current for alternating current loads.

1. Introduction

A photovoltaic system contains an array, a power conditioner, and a system for power transmission and distribution. The output power of the photovoltaic module array is affected by the amount of sunlight and temperature; thus, the output power can vary nonlinearly. Certain obstructions, such as stains, leaves, dark clouds, and building shadows, can partially shade arrays of photovoltaic modules of arrays, and a power–voltage (P–V) output characteristic curve may exhibit patterns with multiple peaks [1]. If a conventional maximum power point tracker (MPPT) is used, the tracker might track the lower of the two peaks, causing energy loss in the output power of the photovoltaic module array. Therefore, the system must have a power conditioner for acceptable power generation performance. The power conditioner is composed of a DC-DC converter and an MPPT. The MPPT maximizes the output power of the photovoltaic module array, thus that the equivalent input load of the photovoltaic module array and the DC load terminal can reach an impedance match.
Two commonly used maximum power point tracking methods are the perturbation and observation (P&O) method [2] and the power feedback method [3]. The P&O method disturbs the module by increasing or decreasing the output voltage of the photovoltaic module in a fixed step manner. If the output power of the photovoltaic module increased after the perturbation, the next perturbation direction would be adopted as the previous one; otherwise, the reverse perturbation direction would be adopted. The advantage of this method is that it uses few parameters, and its architecture is simple. The disadvantage is that the tracking response is slow, and the operating point tends to oscillate near the maximum power point in its steady-state response, resulting in suboptimal power output. For the power feedback method, the positive and negative values of the slope of the output P–V curve of the photovoltaic module are used as references for tracking direction. Therefore, the algorithm is divided into two tracking judgement formulas. If dP/dV > 0, the output voltage of the photovoltaic module increases; otherwise, it decreases. If dP/dV of the judgement formula is 0, the system is at the maximum power point; however, in fact, the error of the sensor measurement makes it impossible to accurately track the maximum power point. If some modules are shaded, it would induce the patterns of multiple peaks in the output P–V curve. The multiple- peak pattern would cause the conventional tracking method to be trapped in a local maximum peak; the system would not trace the true global maximum power point.
Recently, numerous scholars have proposed smart maximum power point tracking approaches such as fuzzy sets [4], cerebellar model articulation controller (CMAC) [5], genetic algorithm (GA) [6], and ant colony algorithm (ACA) [7]. Although these four control methods are characterized by their fast convergence and can be used for multi-point tracking, the control processes of fuzzy sets and CMAC are complicated and computation-intensive; thus they are not easy to implement. The GA and ACA are limited to the maximum power point tracking of photovoltaic module arrays exhibiting single-peak characteristics [8].
When the MPPT controls the photovoltaic module array, the output power of the array tends to affect the DC load terminal voltage. If the system has no adequate control strategy, the DC load terminal voltage tends to be unstable and may damage the electric apparatus of the DC load terminal. Therefore, this study regulated the DC load terminal voltage by using a bidirectional converter to control battery charging and discharging. Over recent years, bidirectional DC-DC converters have been applied to a number of disciplines [9,10,11,12]. Taking a PV system as an instance, household appliances are solar powered in the daytime, and excessive amounts of solar energy is stored in a battery, while the appliances become battery powered at night. A controller is hence introduced to determine the role of the battery as either a current source or sink. For this sake, it is an issue of interest to design a converter for bilateral energy flow between a PV system and a battery. A major disadvantage of a conventional bidirectional DC-DC converter, as presented in references [13,14], is that the operation under a moderate duty cycle with low conversion ratio results in the lack of a high DC link voltage. In order to reach a high conversion ratio, a high duty cycle is required for long term operation of the main switches. Therefore, due to overheating, it causes damage to the switch, and hence deteriorates the converter’s stability and efficiency. For this sake, a high-boost/buck-ratio bidirectional converter, which features a simple configuration and provides high conversion efficiency is a very important research issue. The selected battery was a lead-acid battery in this paper, which was suitable for green energy systems because of its high electromotive force, wide operating temperature range, simple structure, mature technology, low price, and considerable cycle life [15].
To prevent the system from tracking the lower of the two peaks when the photovoltaic module is shaded, this study developed a smart MPPT that can escape from a local optimum and rapidly trace the global maximum peak value to minimize power loss. For regulation of DC load terminal voltage, the high-boost/buck-ratio bidirectional converter with a coupled inductor and the charge/discharge control strategy of the battery controlled the energy flow of the battery and the DC load terminal voltage. In addition, this study also developed an inverter to convert DC into alternating current (AC) to power AC loads; the proposed photovoltaic system could deliver high efficiency and high performance in a micro-grid system.

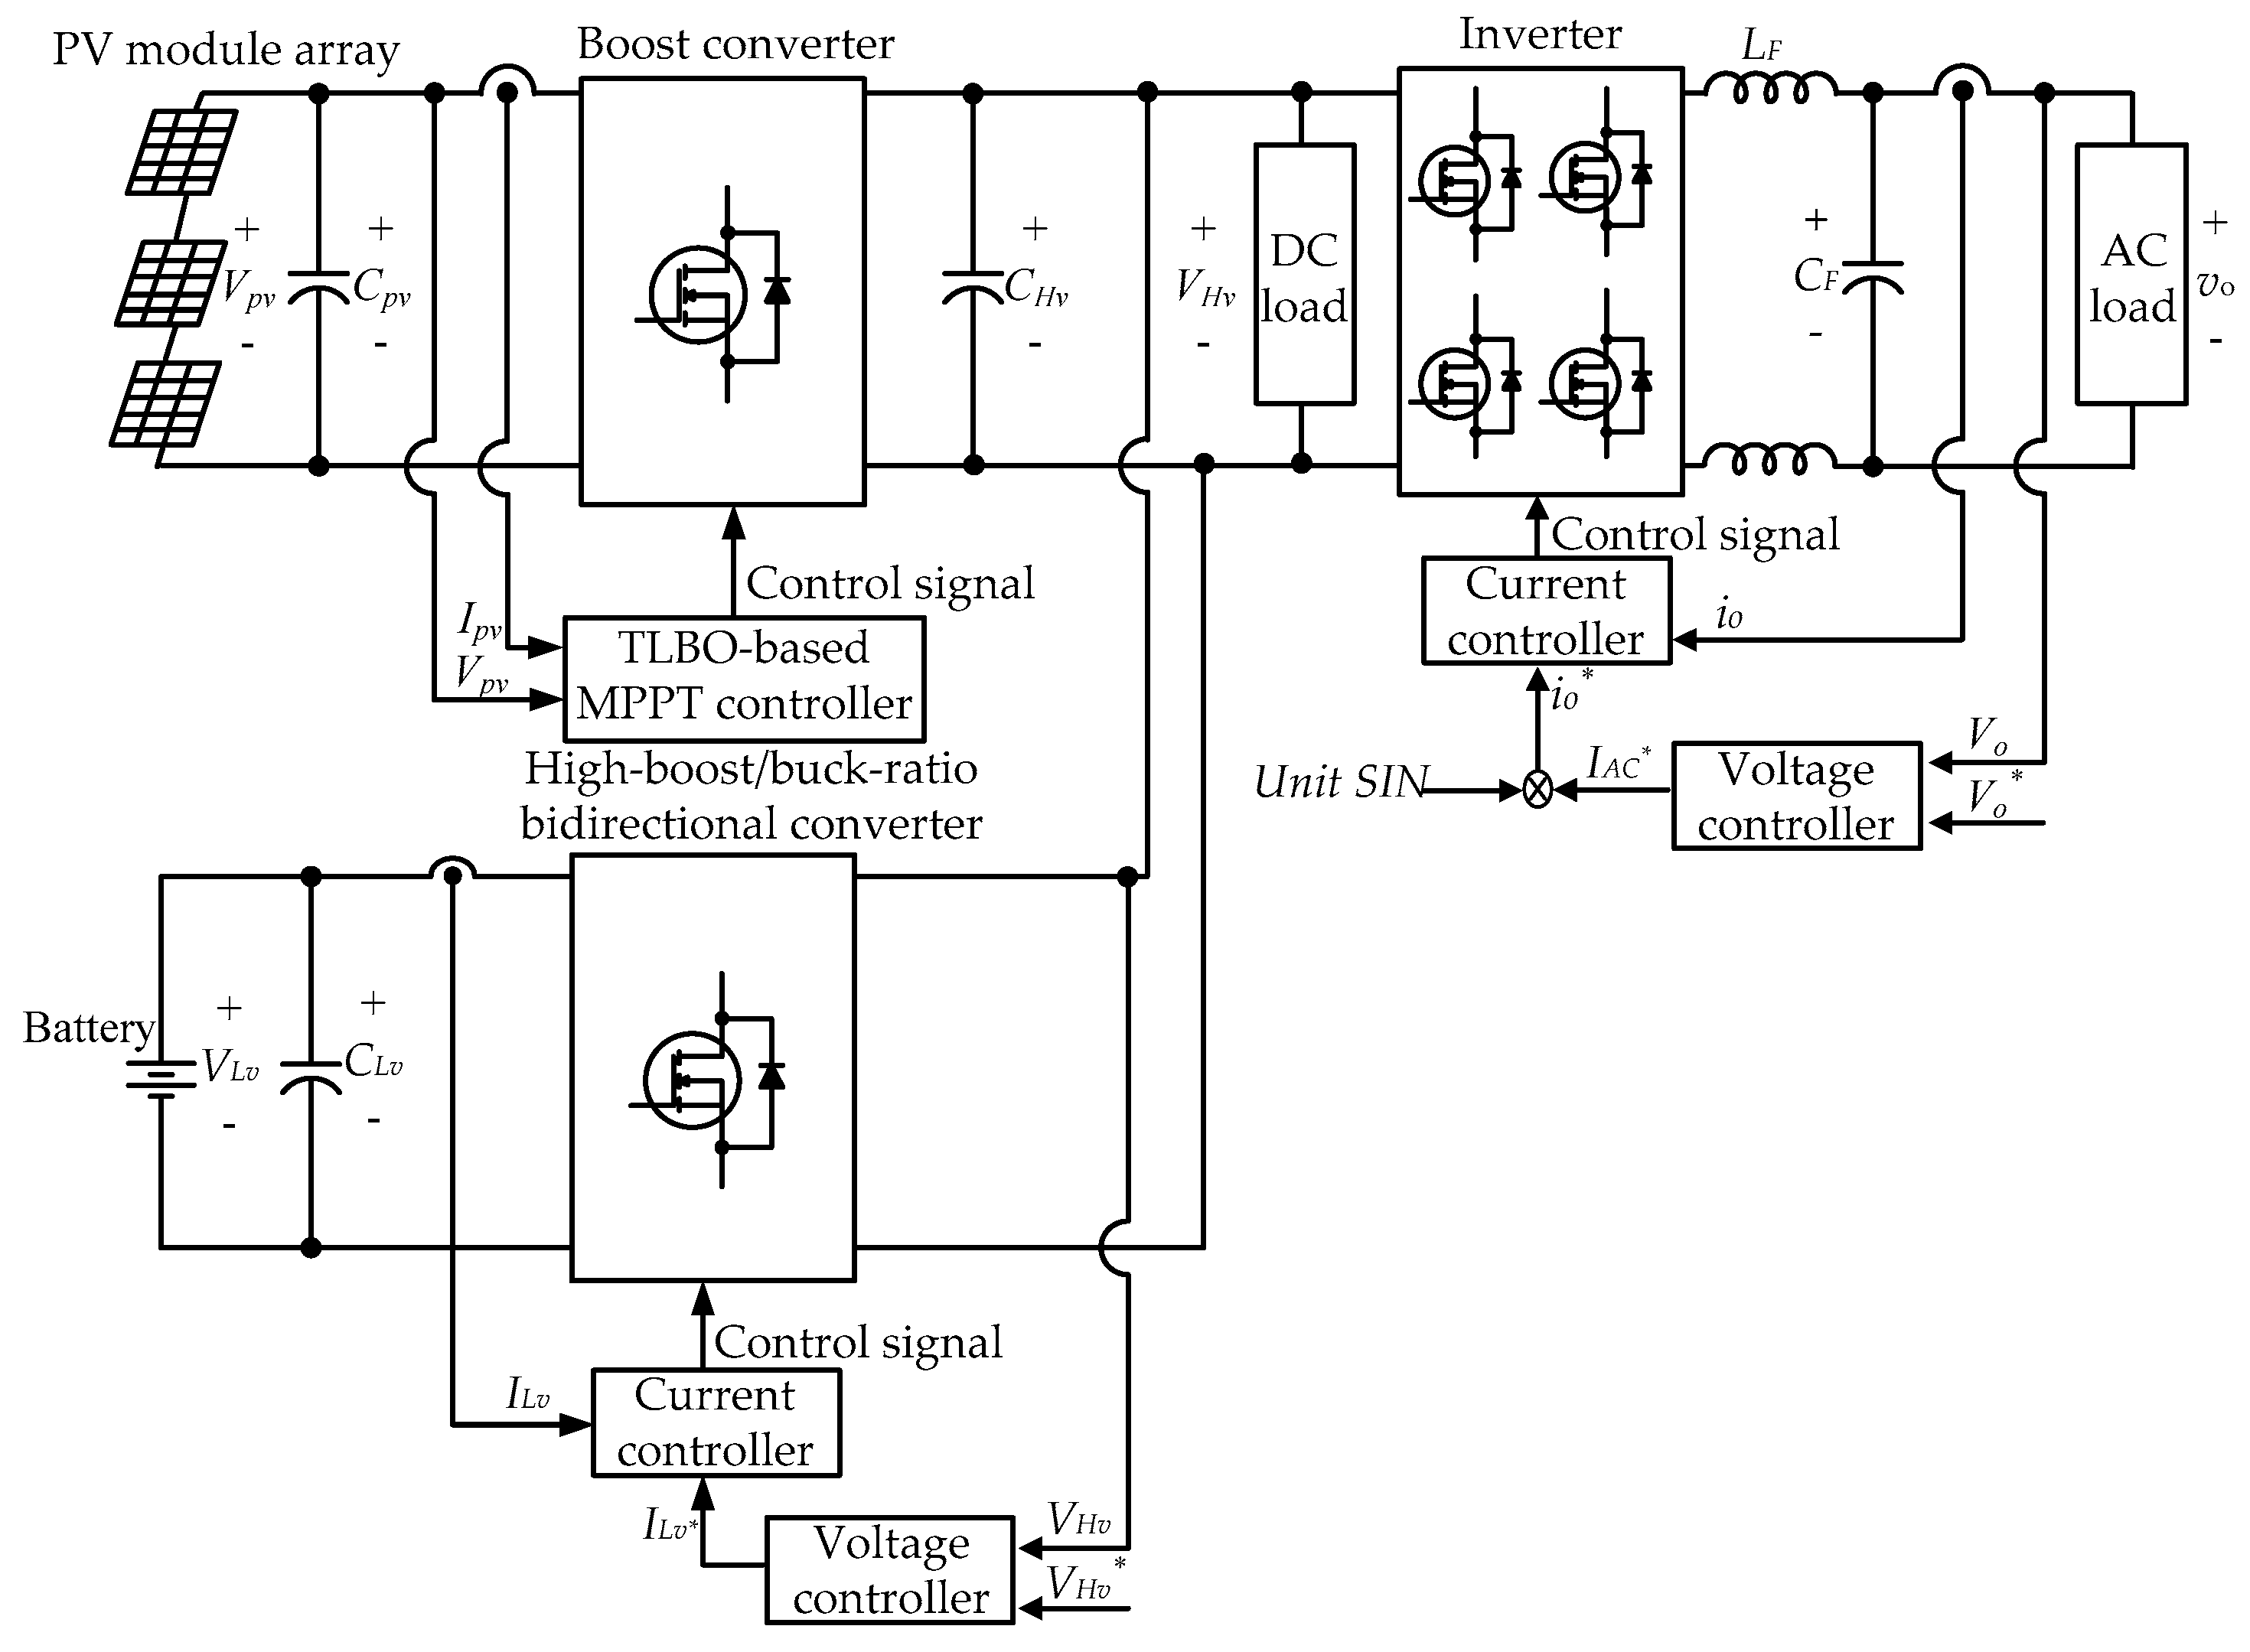
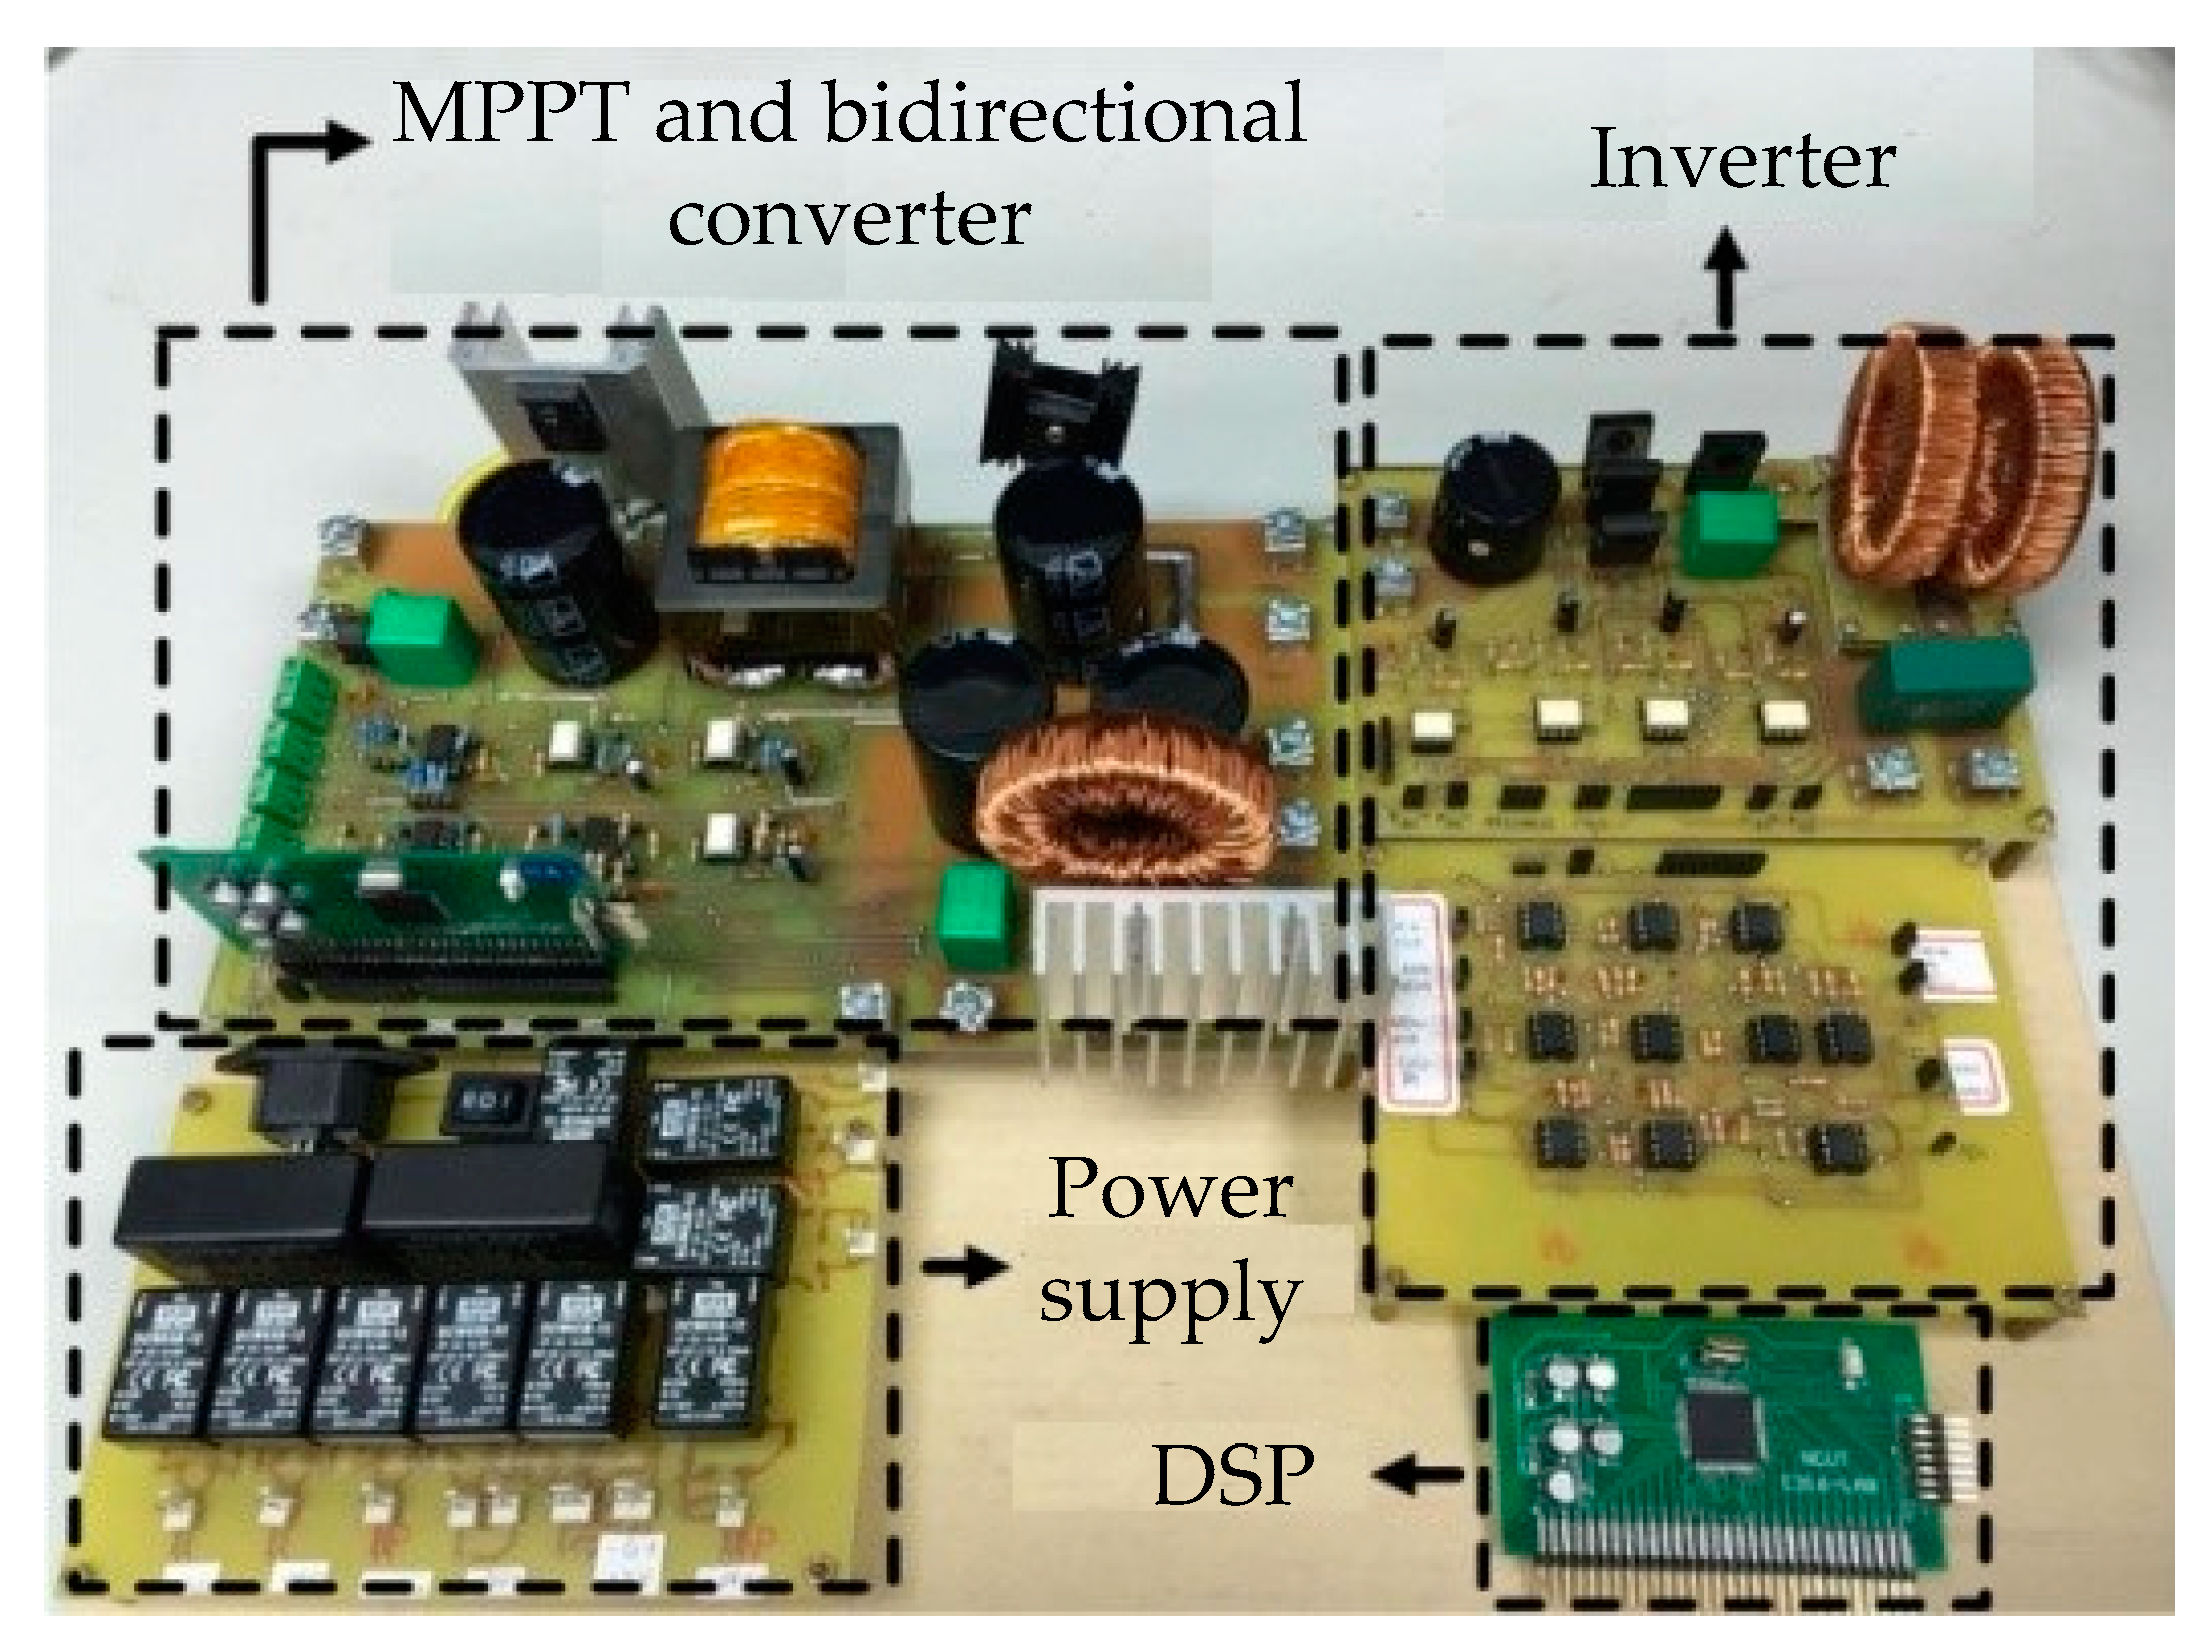
2. Photovoltaic System Architecture

Figure 1 shows the architecture of the proposed photovoltaic system for energy storage and release. The system consists of a photovoltaic module array, an MPPT, a high-boost/buck-ratio bidirectional converter, an inverter, and a lead-acid battery for energy storage and release. The following sections introduce the architecture of each part of the system.

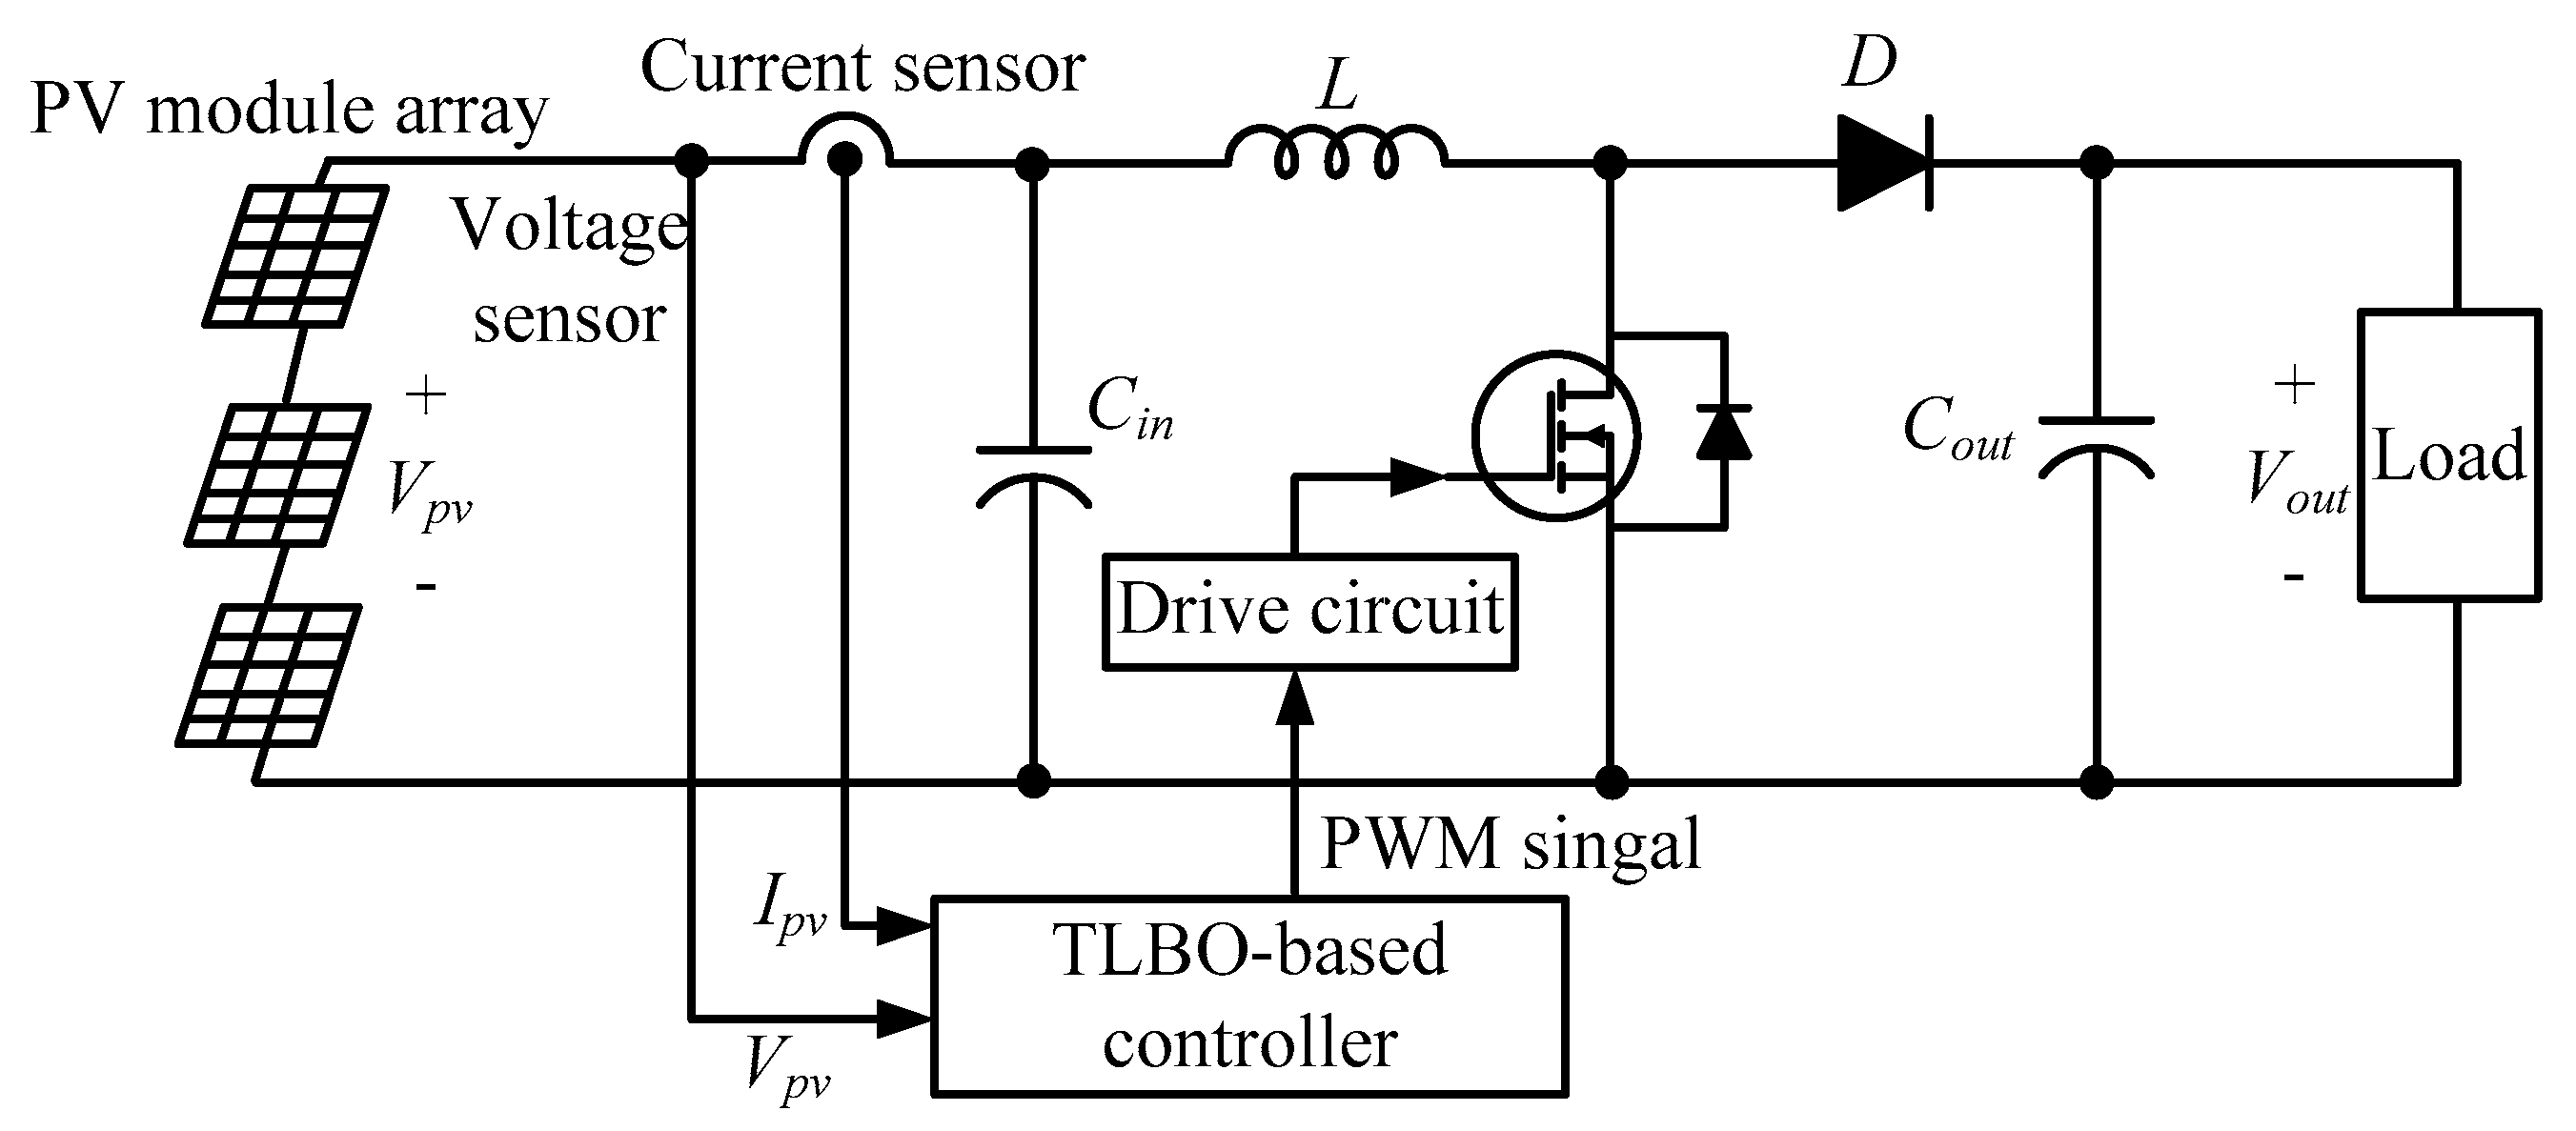
2.1. Maximum Power Point Tracker

Figure 2 displays the architecture of the proposed MPPT, which includes a DC/DC boost converter [16] and an MPPT control circuit. The MPPT returns the output voltage and current signals of the photovoltaic module array through a differential amplifier circuit. The teaching learning based optimization (TLBO) algorithm controls the disconnection and closure of the power switch of the boost converter to track the global maximum power point. The specifications of the proposed DC/DC boost converter are listed in Table 1. In this study, the switching frequency of the DC/DC boost converter was set to 25 kHz to reduce the storage inductor and filter capacitor value.

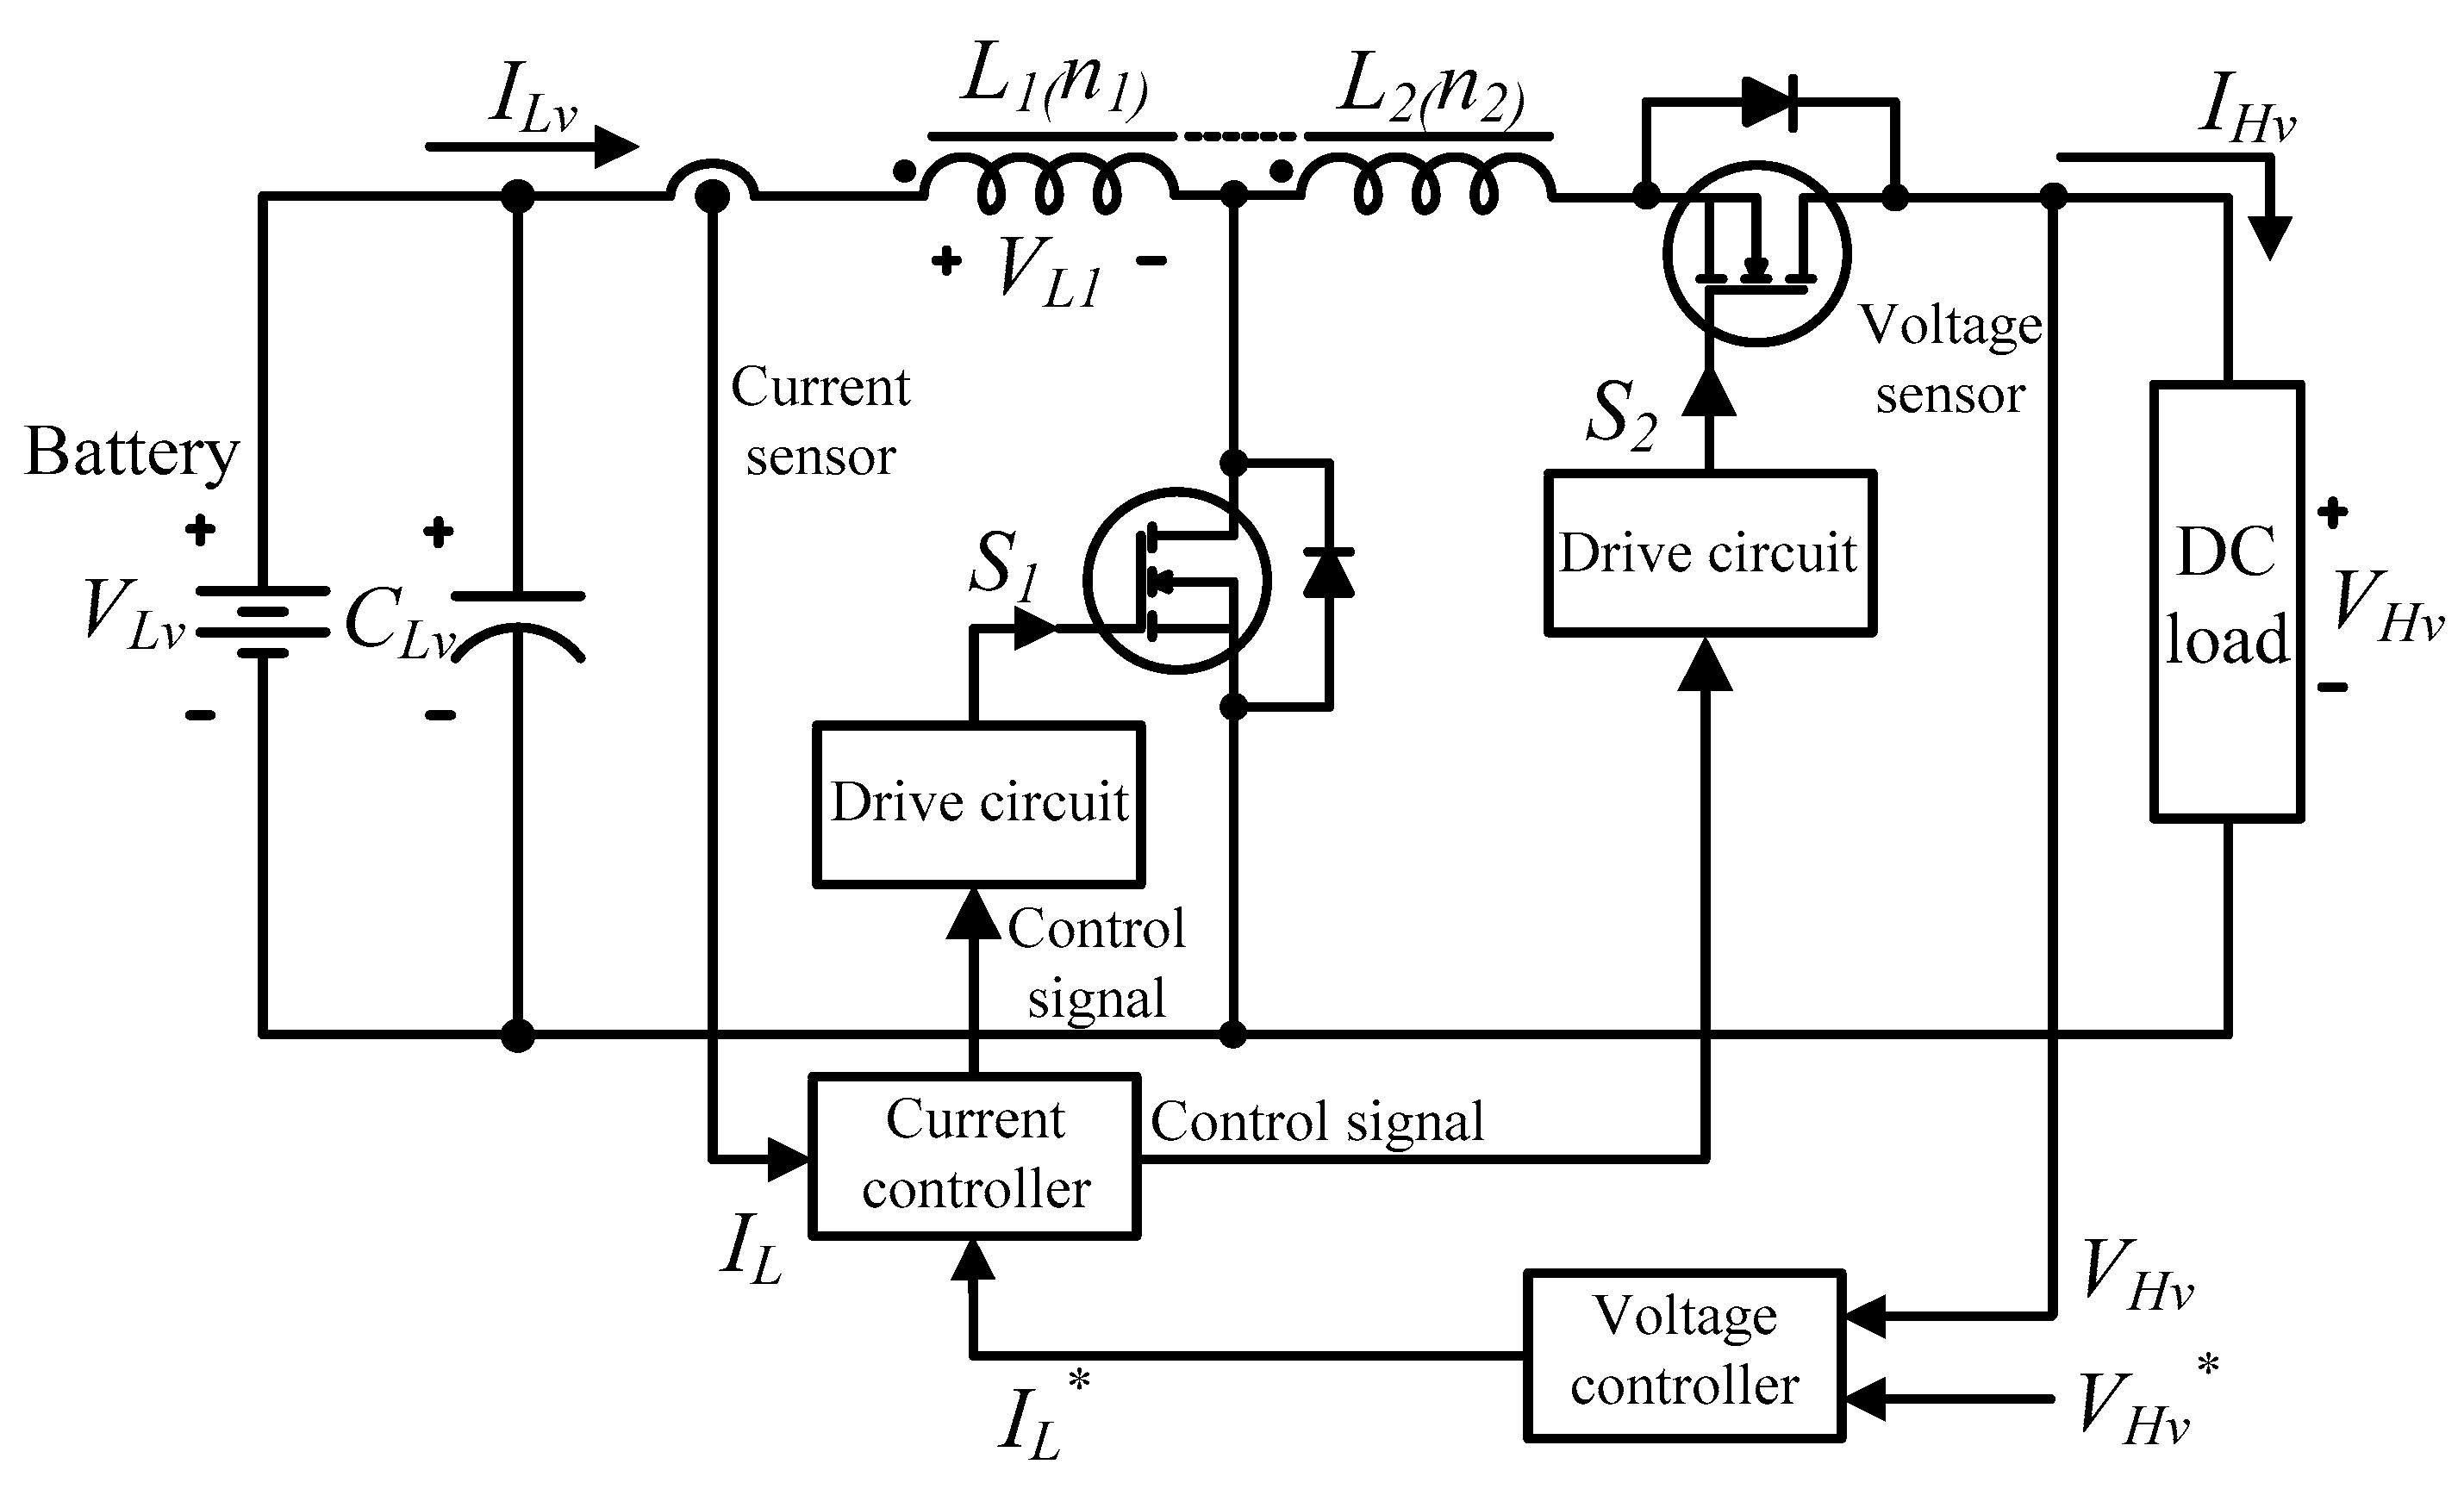
2.2. High-Boost/Buck-Ratio Bidirectional Converter

Figure 3 shows the circuit diagram of the high-boost/buck-ratio bidirectional converter [17]. In this study, the converter controlled the bidirectional energy flow; thus, the battery was connected to the low voltage side, and the high voltage side was connected to the DC load terminal. The digital signal processor (DSP) was incorporated in the power control strategy to manage the battery charging and discharging, thereby adjusting the energy on the DC link. In addition, a coupled inductor was used to replace the storage inductor, thus that the voltage conversion ratio could be adjusted by the turn ratio to perform the anticipated function of the high-boost/buck-ratio. The voltage conversion relationships of the low-voltage side and high-voltage side are shown in Equations (1) and (2).
G = V H v V L v = ( 1 + N D 1 ) ( 1 D 1 )
N n 2 n 1
where G in Equation (1) is the conversion ratio of the voltages of high and low voltage side. Specifically, the turn ratio of the coupled inductor is shown in Equation (2), where D1 is the duty cycle of the power switch S1. Because the control signals of the power switch are complementary, the duty cycle D2 of the power semiconductor switch S2 can be expressed as Equation (3).
D 2 = 1 D 1
Equations (1) to (3) can be integrated to obtain the voltage conversion ratio denoted by D2, as shown in Equation (4).
V L v V H v = D 2 [ 1 + N ( 1 D 2 ) ]
Equations (1) to (4) demonstrate that the converter can increase the voltage conversion ratio G by increasing the turn ratio N. The relationship between the turn ratio and the voltage that the switch must withstand when the switch is turned off is presented as Equations (5) and (6). In addition, the withstand current of the turned-on switch is presented as Equations (7) and (8), where IHv is the current at the DC load terminal, and ILv is the battery current.
V D S 1 = V L 1 + V H v = ( V H v + N V L v ) ( N + 1 )
V D S 2 = V L 2 + V H V = ( V H V + N V L V )
I D S 1 = I L v + N I H v
I D S 2 = I L v + N I H v ( 1 + N )
If the bidirectional DC/DC converter is operated in the continuous conduction mode, the designed inductance value must satisfy Equation (9).
L 1 min = V L v R H v ( V H v V L v ) ( 1 D ) T 2 V L v 2 ( N + 1 )
The specifications of the proposed high-boost/buck-ratio bidirectional converter components are listed in Table 2.

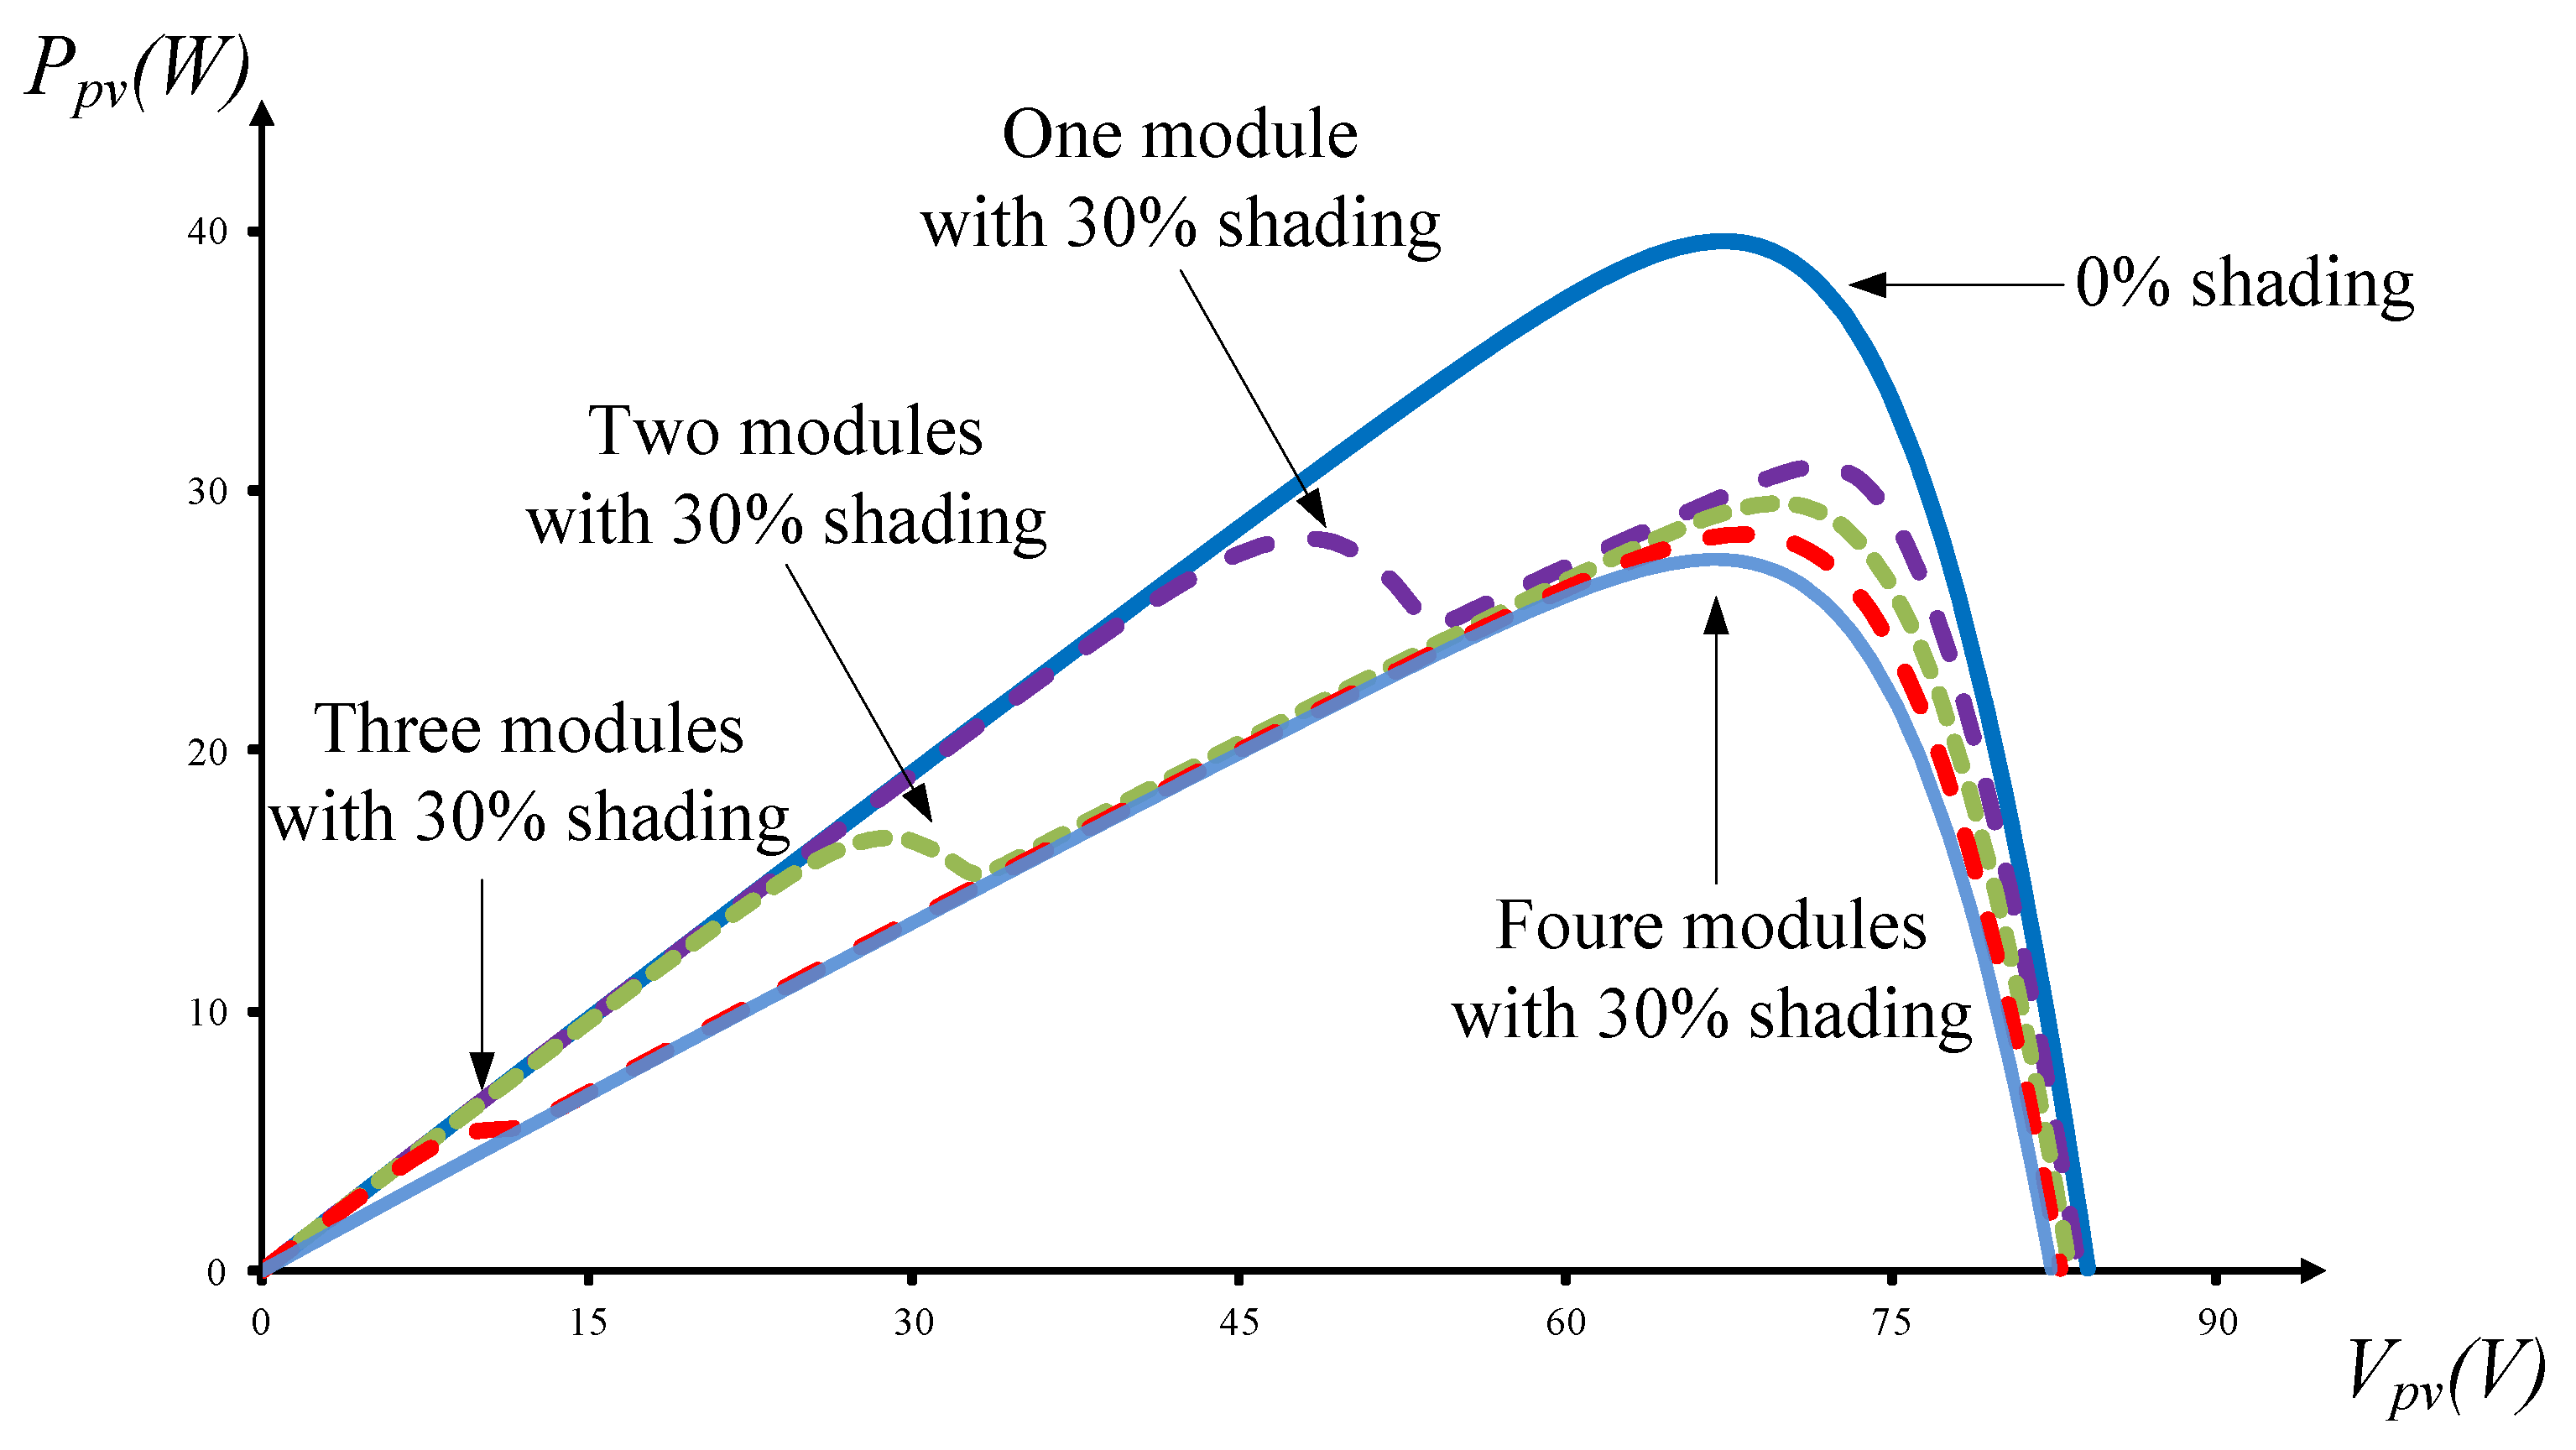
2.3. Characteristics of Photovoltaic Module Arrays with Partial Module Shade
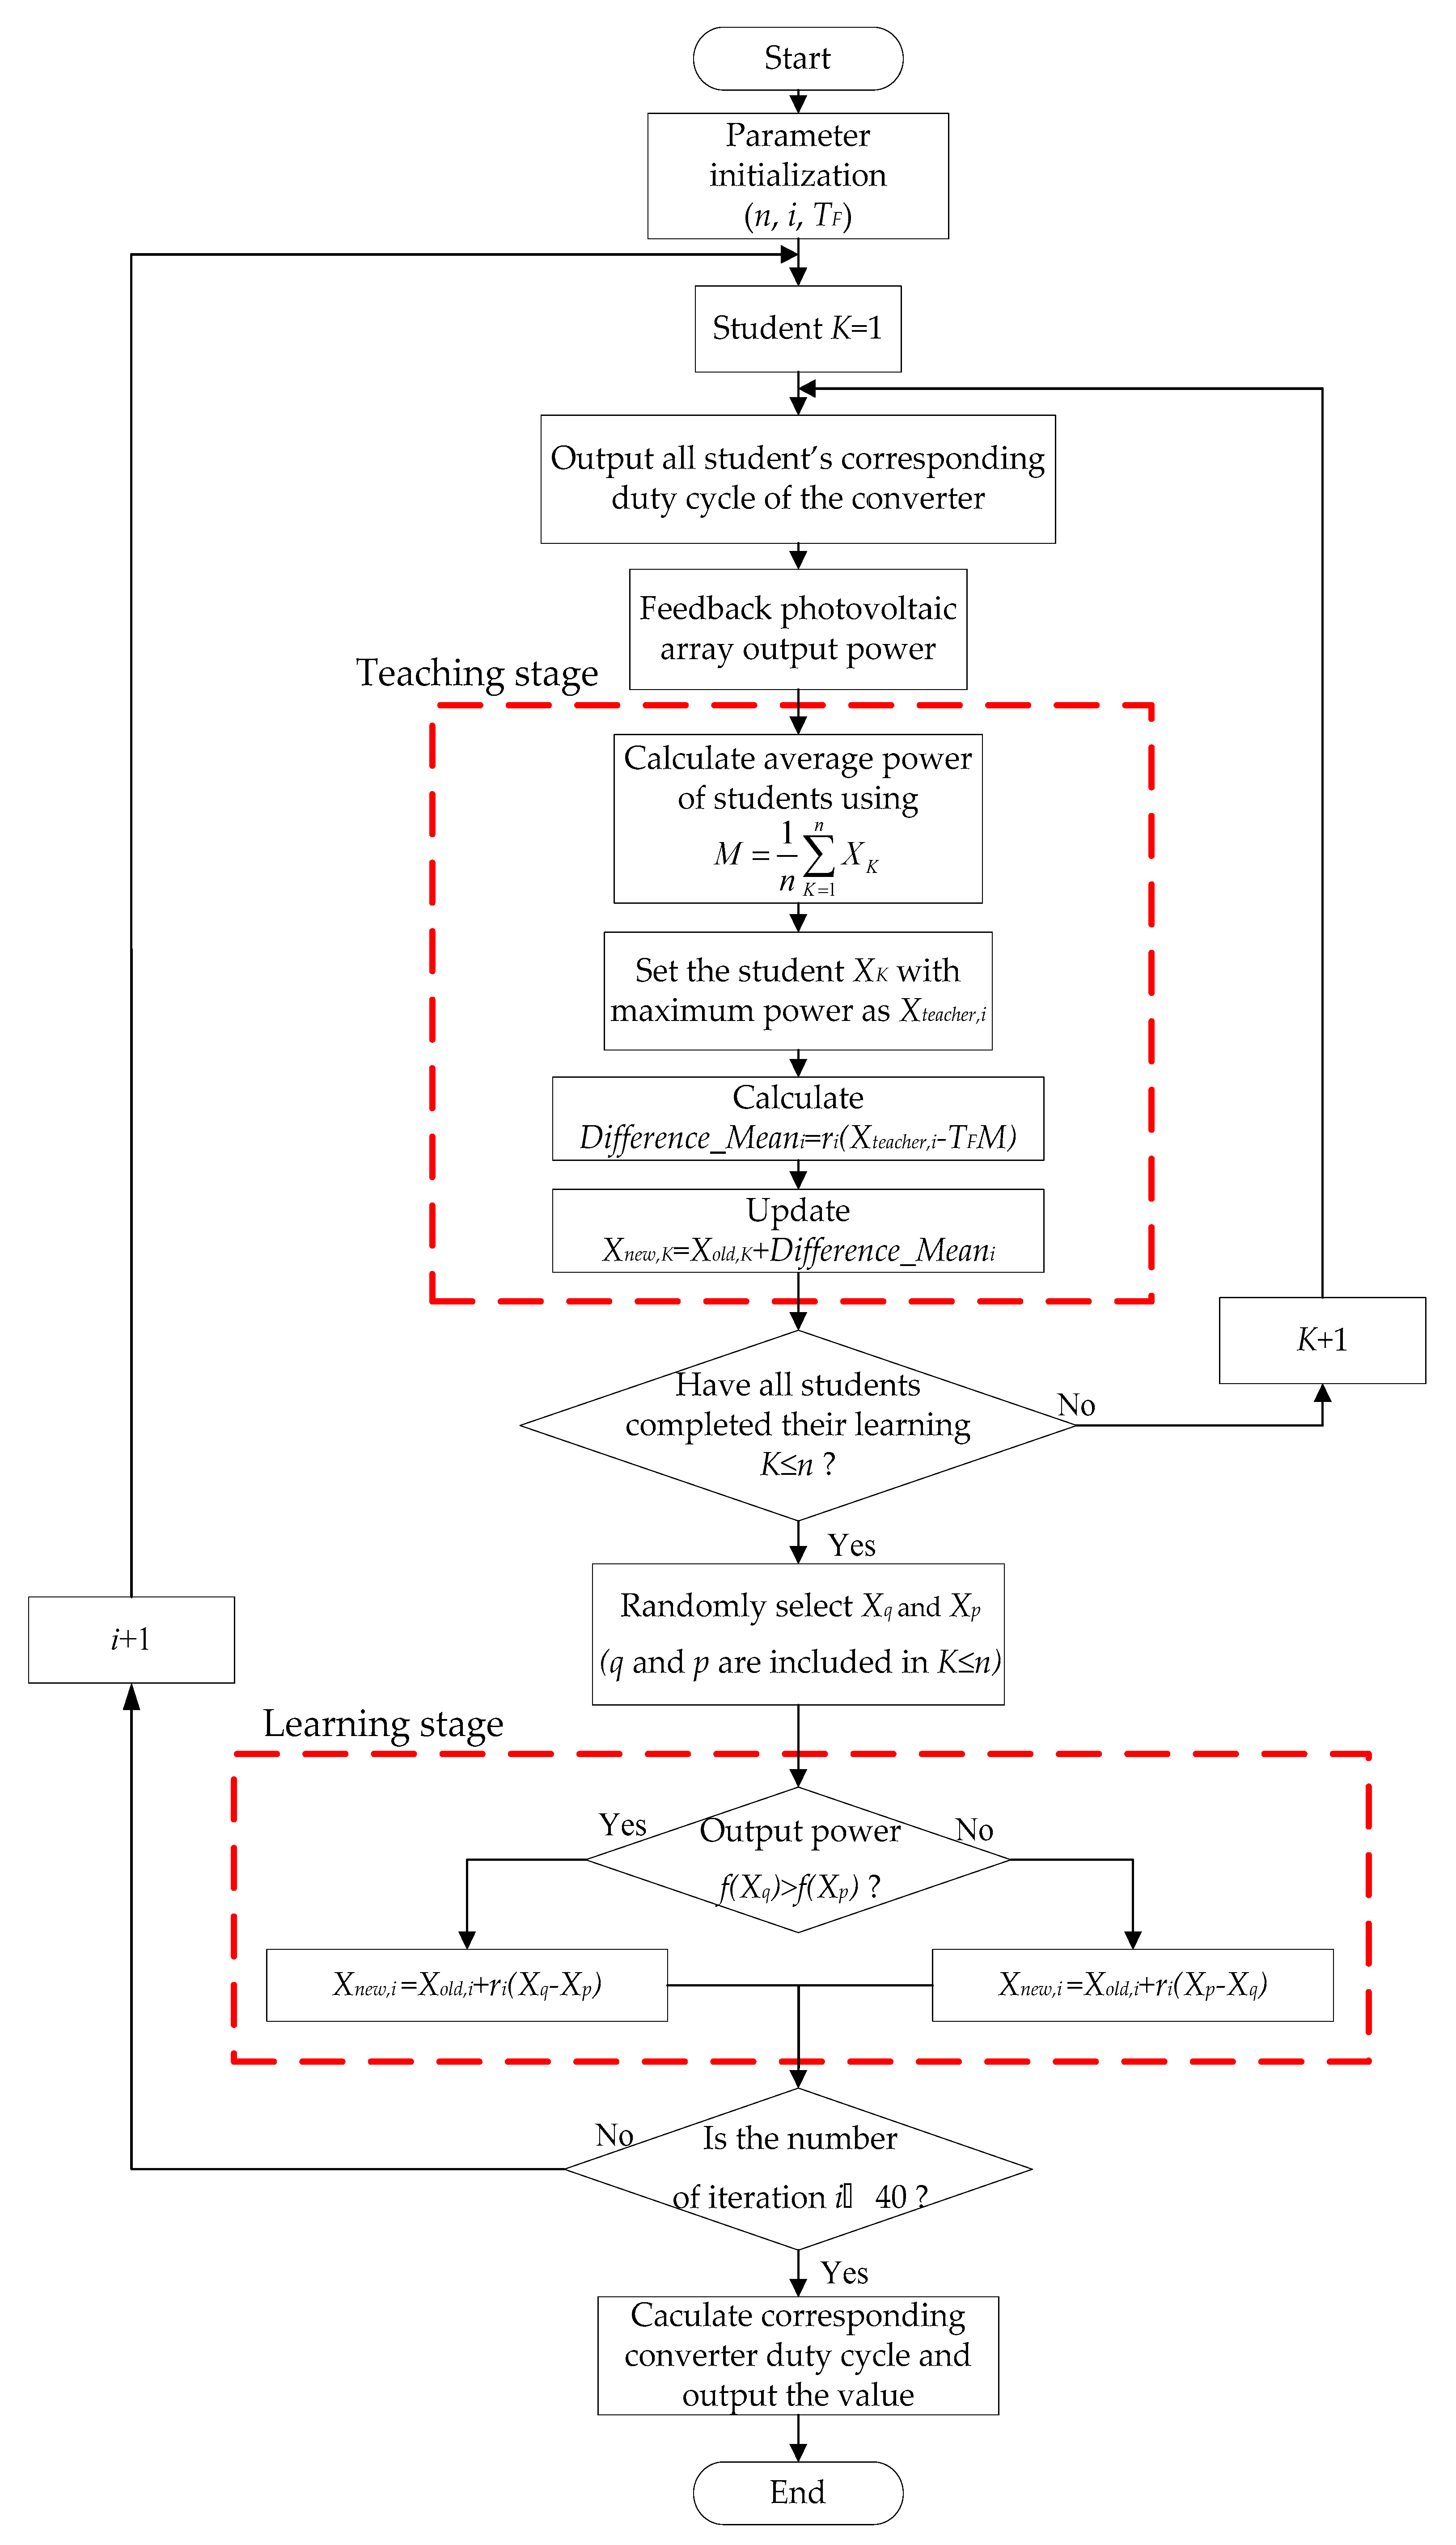
The voltage, current, and power of the photovoltaic module array vary according to sunlight intensity; that variation causes the output characteristic curves to change nonlinearly. If some modules were shaded, the P–V output characteristic curves would display patterns with multiple peaks. At this time, if a conventional MPPT were in use, it might trace a low peak, causing the photovoltaic module array to output suboptimal power. In general, the MPPT substantially affects system power generation performance, and numerous scholars have proposed related tracking technology [5,6,7,8].
This study used an SX-10 [18] photovoltaic module manufactured by The British Petroleum Company plc (BP) [18] to simulate the output characteristics of a partially shaded photovoltaic module array. Table 3 lists the relevant parameter values. First, photovoltaic simulation software Solar Pro [19] was used to simulate a photovoltaic module array composed of four parallel strings of ten panels each. In order for the shadows to cover 30% of the panel area, 1, 2, 3, and 4 panels were shaded to produce 30%-shaded characteristic curves. The simulation results are illustrated in Figure 4. Figure 4 indicates that if a panel in the photovoltaic module was 30% shaded, the output current and power of the photovoltaic module array would fall short of their optimal levels, and the P–V output curves would show a multiple-peak pattern.
This study used the teaching learning based optimization (TLBO) method [13] to achieve maximum power point tracking by using its characteristics of few parameters, high precision, and fast convergence. The method can improve on the conventional tracking method by fixing the problems of slow transient-state response and large steady-state error caused by fixed step tracking. If modules are partially shaded and a multiple-peak pattern occurs, the method can make the tracking rapidly escape from a locally optimal solution and track the global maximum peak.
The teaching learning based optimization algorithm is an optimization theory proposed by three scholars: Rao, Savsani, and Vakharia [20]. This algorithm resembles the teaching phenomena of a class; the algorithms runs a teacher phase to improve students’ performance and a learner phase to simulate students’ mutual learning. The two phases continue to improve students’ performance and the algorithm rapidly converges to globally optimal results. Table 4 lists the relevant parameter values.
The step-wise procedure of implementing the TLBO algorithm is as follows: Pbest
(1)
Define the number of students (n) and the number of iterations (i).
(2)
Initialize the class and randomly define the level of each student.
(3)
Substitute the levels of students into the objective function and evaluate the fitness function values of each student.
(4)
The fitness function value of each student is compared with the best grade of this class, and the students having favorable performance levels are selected as the Xteacher,i of the iteration.
(5)
The average value of the class is obtained from Equation (10), and then the average difference value of Xteacher,i in the iteration is calculated by Equation (11). The scores of other students are updated by Equation (12).
M = 1 n K = 1 n X K
D i f f e r e n c e _ M e a n i = r i ( X T E A C H E R T F M )
X n e w , K = X o l d , K + D i f f e r e n c e _ M e a n i
(6)
Two students in the class are selected to conduct mutual learning, thus that students having low grades can learn from students having favorable grades; the low-scoring students can improve their performance. The formula of iteration is shown as Equation (13).
X n e w , i = { X o l d , i + r i ( X q X p ) , f ( X q ) > f ( X p ) X o l d , i + r i ( X p X q ) , f ( X q ) < f ( X p )
(7)
If the condition is met, the iteration is ended; otherwise, step (4) is re-executed until the number of iterations is reached, or the optimal solution for the global domain has been found.
The TLBO-related parameters are as follows:
  • Student (XK): Kth learner, K = 1, 2, …, n.
  • Average value of the class (M): The average grade of the students in the class.
  • Teaching step (ri): Generated by random numbers, the number is limited in the range [0, 1].
  • Teaching factor (TF): 1 or 2.
  • Teacher (Xteacher,i): The ith iteration, the student who has the highest grade.
  • Average difference value (Difference_Meani): The difference between the highest score and the average value of the class.
The flow chart of the proposed TLBO method applied to the photovoltaic module array for maximum power point tracking is shown in Figure 5.

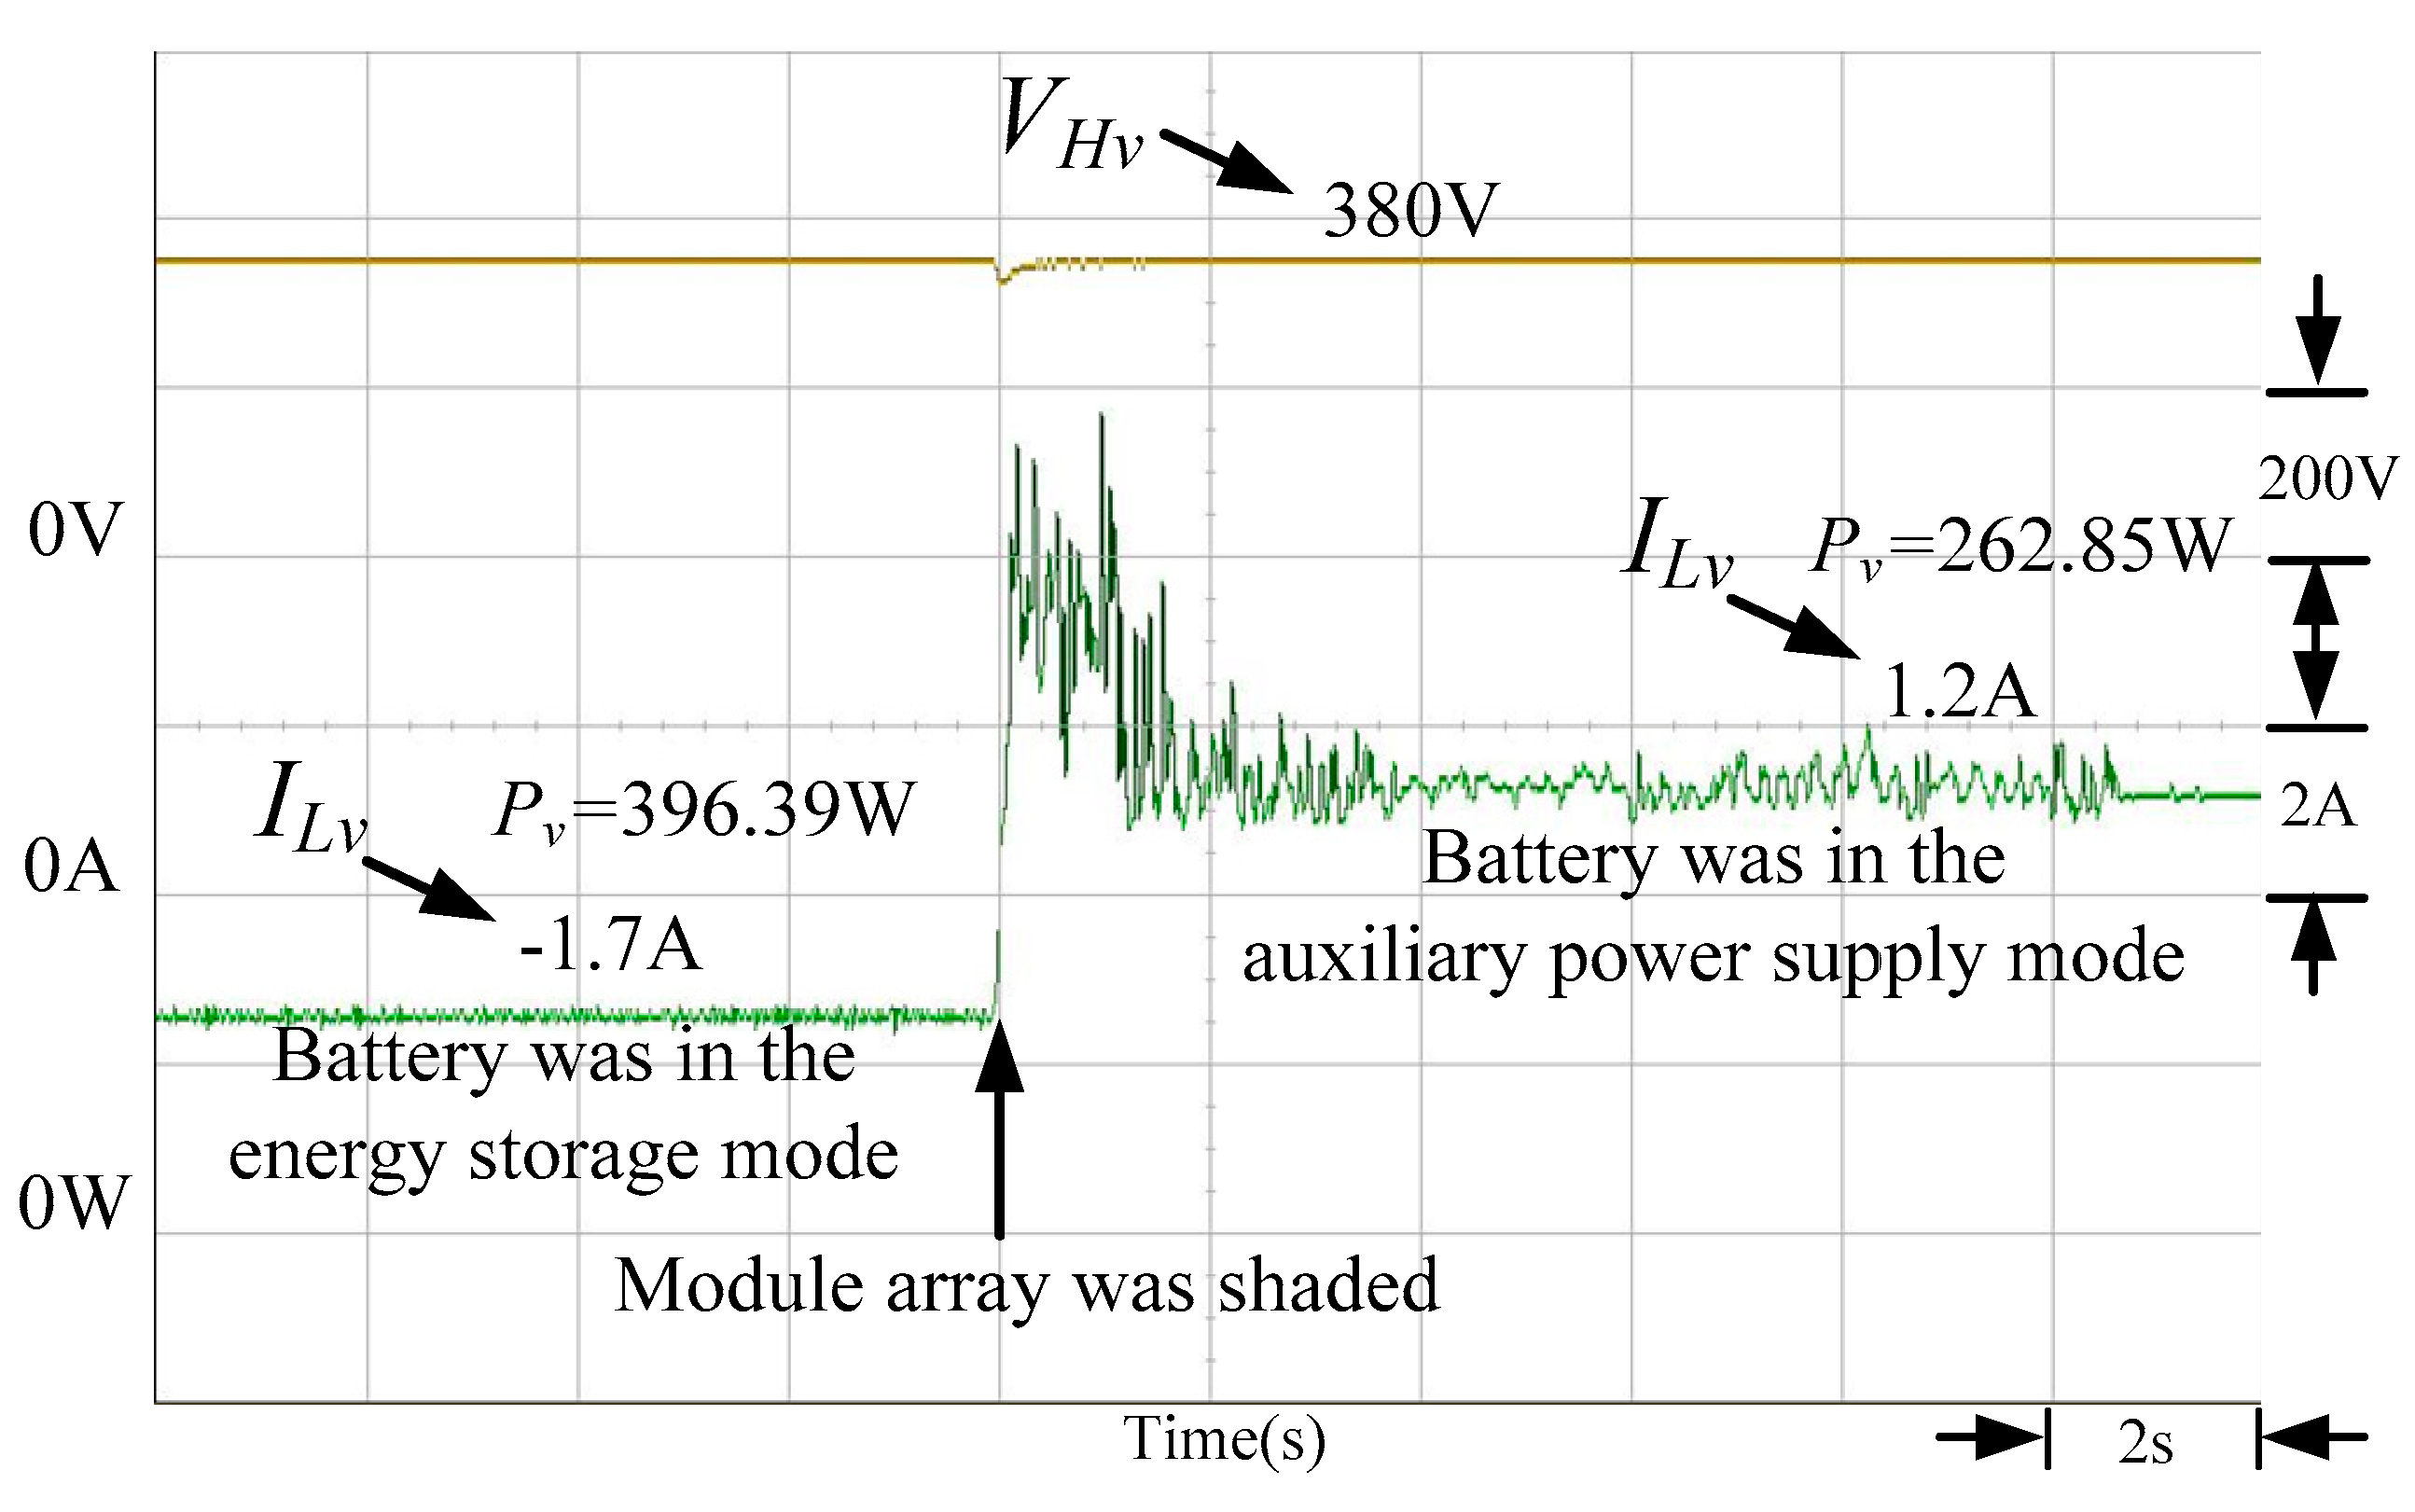
2.4. Energy Storage Control Strategy

The MPPT tracks and controls the output power of the photovoltaic module array. Therefore, during the tracking process, the DC load terminal voltage would vary with the shading condition, the amount of sunshine, and the tracking process. If the voltage provided to the DC load terminal is not controlled by fine control strategies, particular electrical components within the system may be damaged. Therefore, this study proposed an energy storage control strategy as shown in Figure 3 to control the energy accumulation and release of the battery with a high-boost/buck-ratio bidirectional converter, thus that voltage of the DC load terminal was controlled at 380 V. The control method used the error values of the DC load terminal (VHv) and the DC load terminal voltage command value (VHv*) to obtain the charge and discharge current command value (ILv*) of the battery from the calculation results of voltage controller. Subsequently, the calculation function of the current controller enabled the discharge current (ILv) to follow the command value (ILv*) to adjust the DC load terminal voltage. The controllers in this study were all proportional-plus-integral controllers, and the voltage and current controller parameters were KPv = 0.5, KIv = 0.008 and KPi = 0.2, KIi = 0.002.

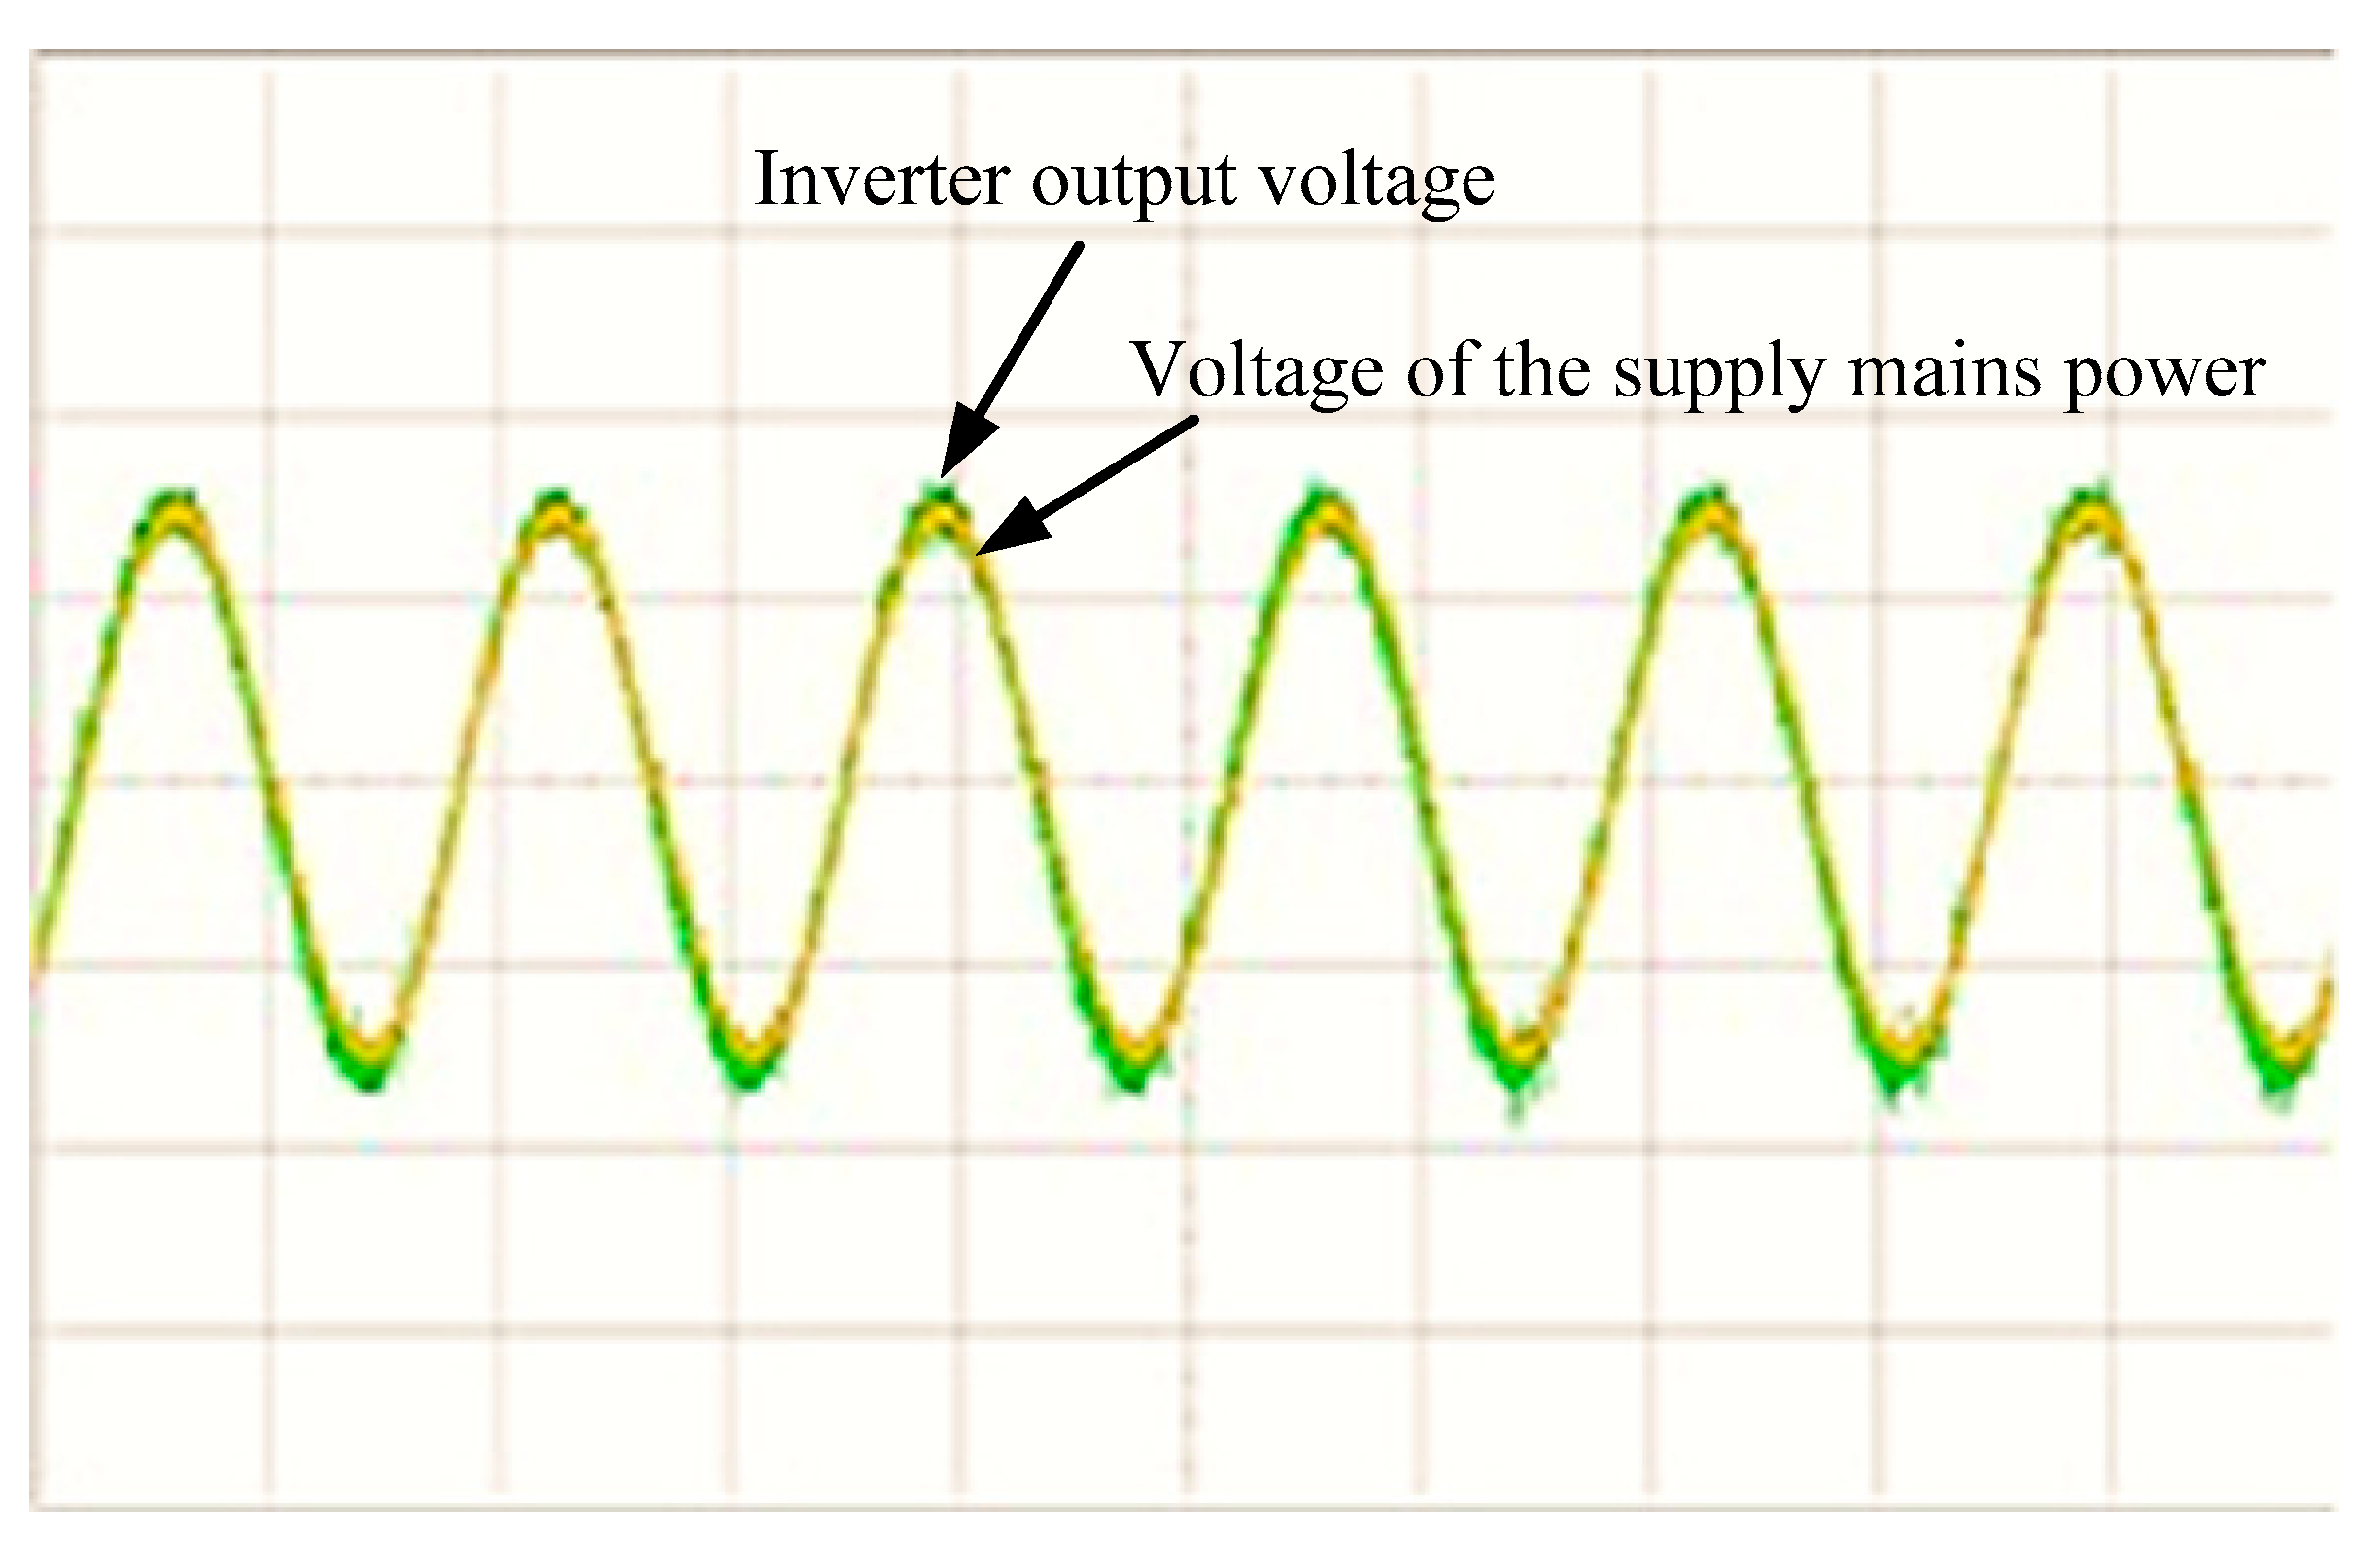
2.5. Development of the Inverter

The zero-crossing detection circuit was used to obtain the square wave signal of the identical phase of the supply mains. Subsequently, 200 data points in the sine wave table were used to look up the sine wave table by adopting the interrupt control frequency of 12 kHz. Therefore, the operation was interrupted every 83.3 μs, and the sinusoidal pulse width modulation (SPWM) method was adopted to switch the bridge circuit, thus that its frequency and phase were the same as those of the supply mains. The voltage amplitude was measured with an AC voltage detection circuit to compare and correct the error of the extracted amplitude of the supply mains inverter, ensuring that the output voltage was the same as that of the supply mains.

3. Test results

Figure 6 shows a photo of the proposed circuit. The primary hardware equipment included a 62050H-600S photovoltaic module array simulator, four 12V100Ah-HRC121000 lead-acid batteries, and an electronic load.

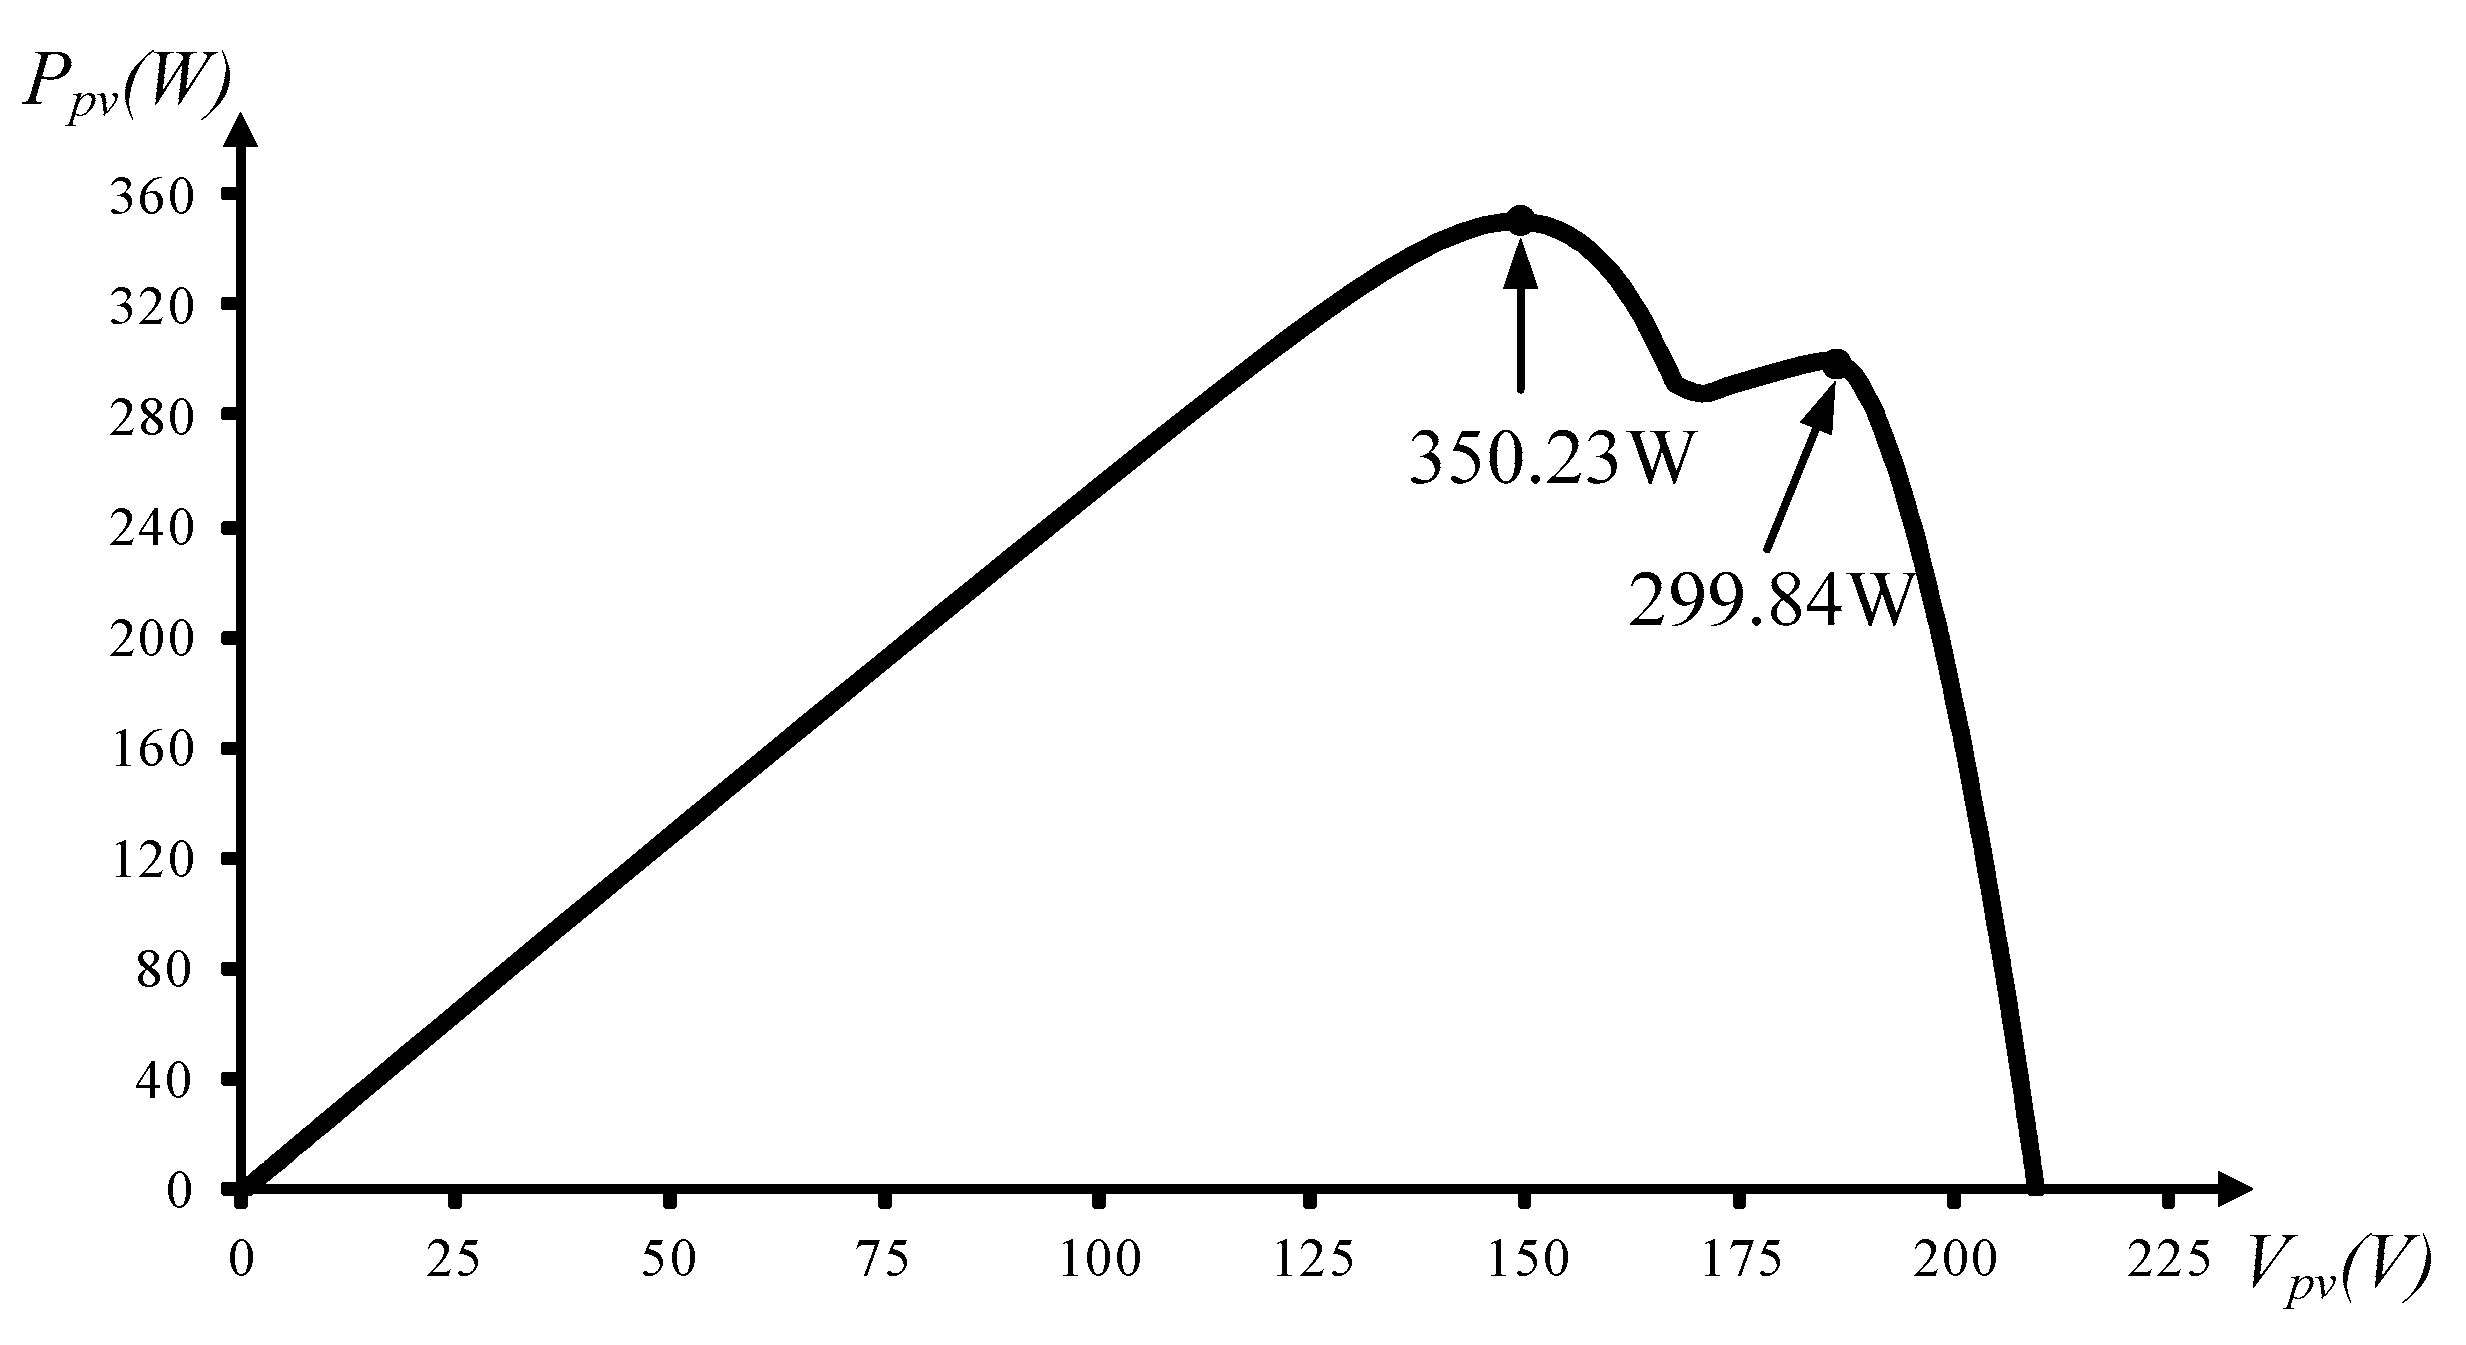
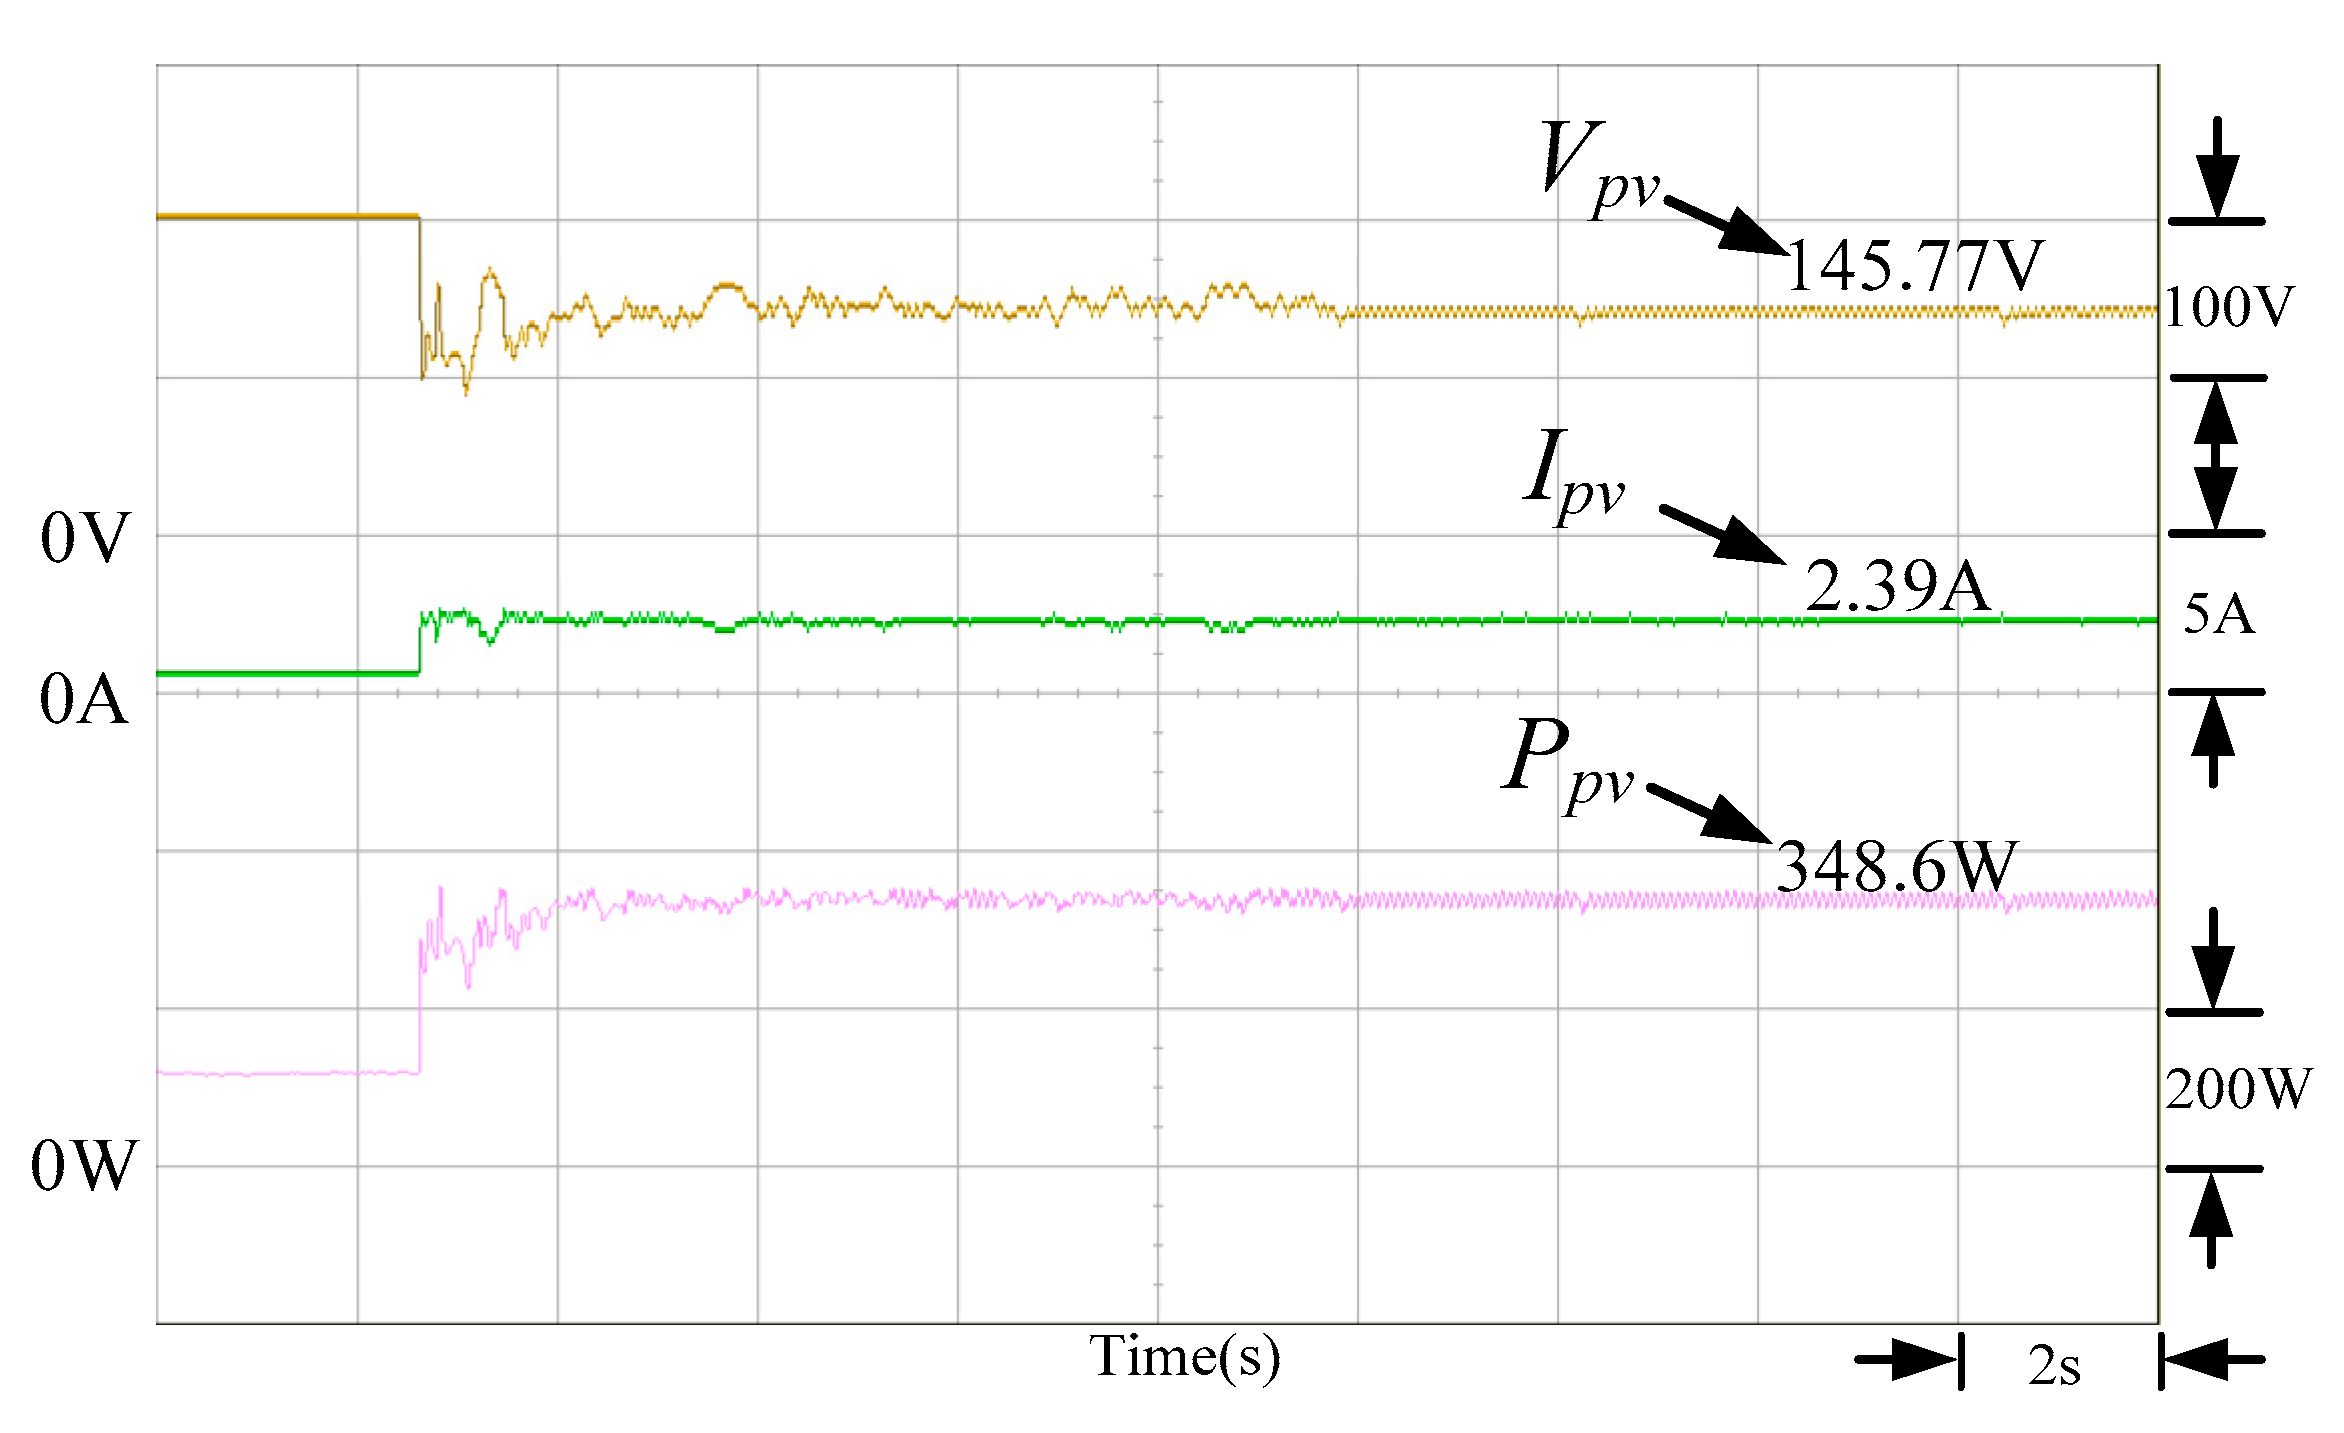
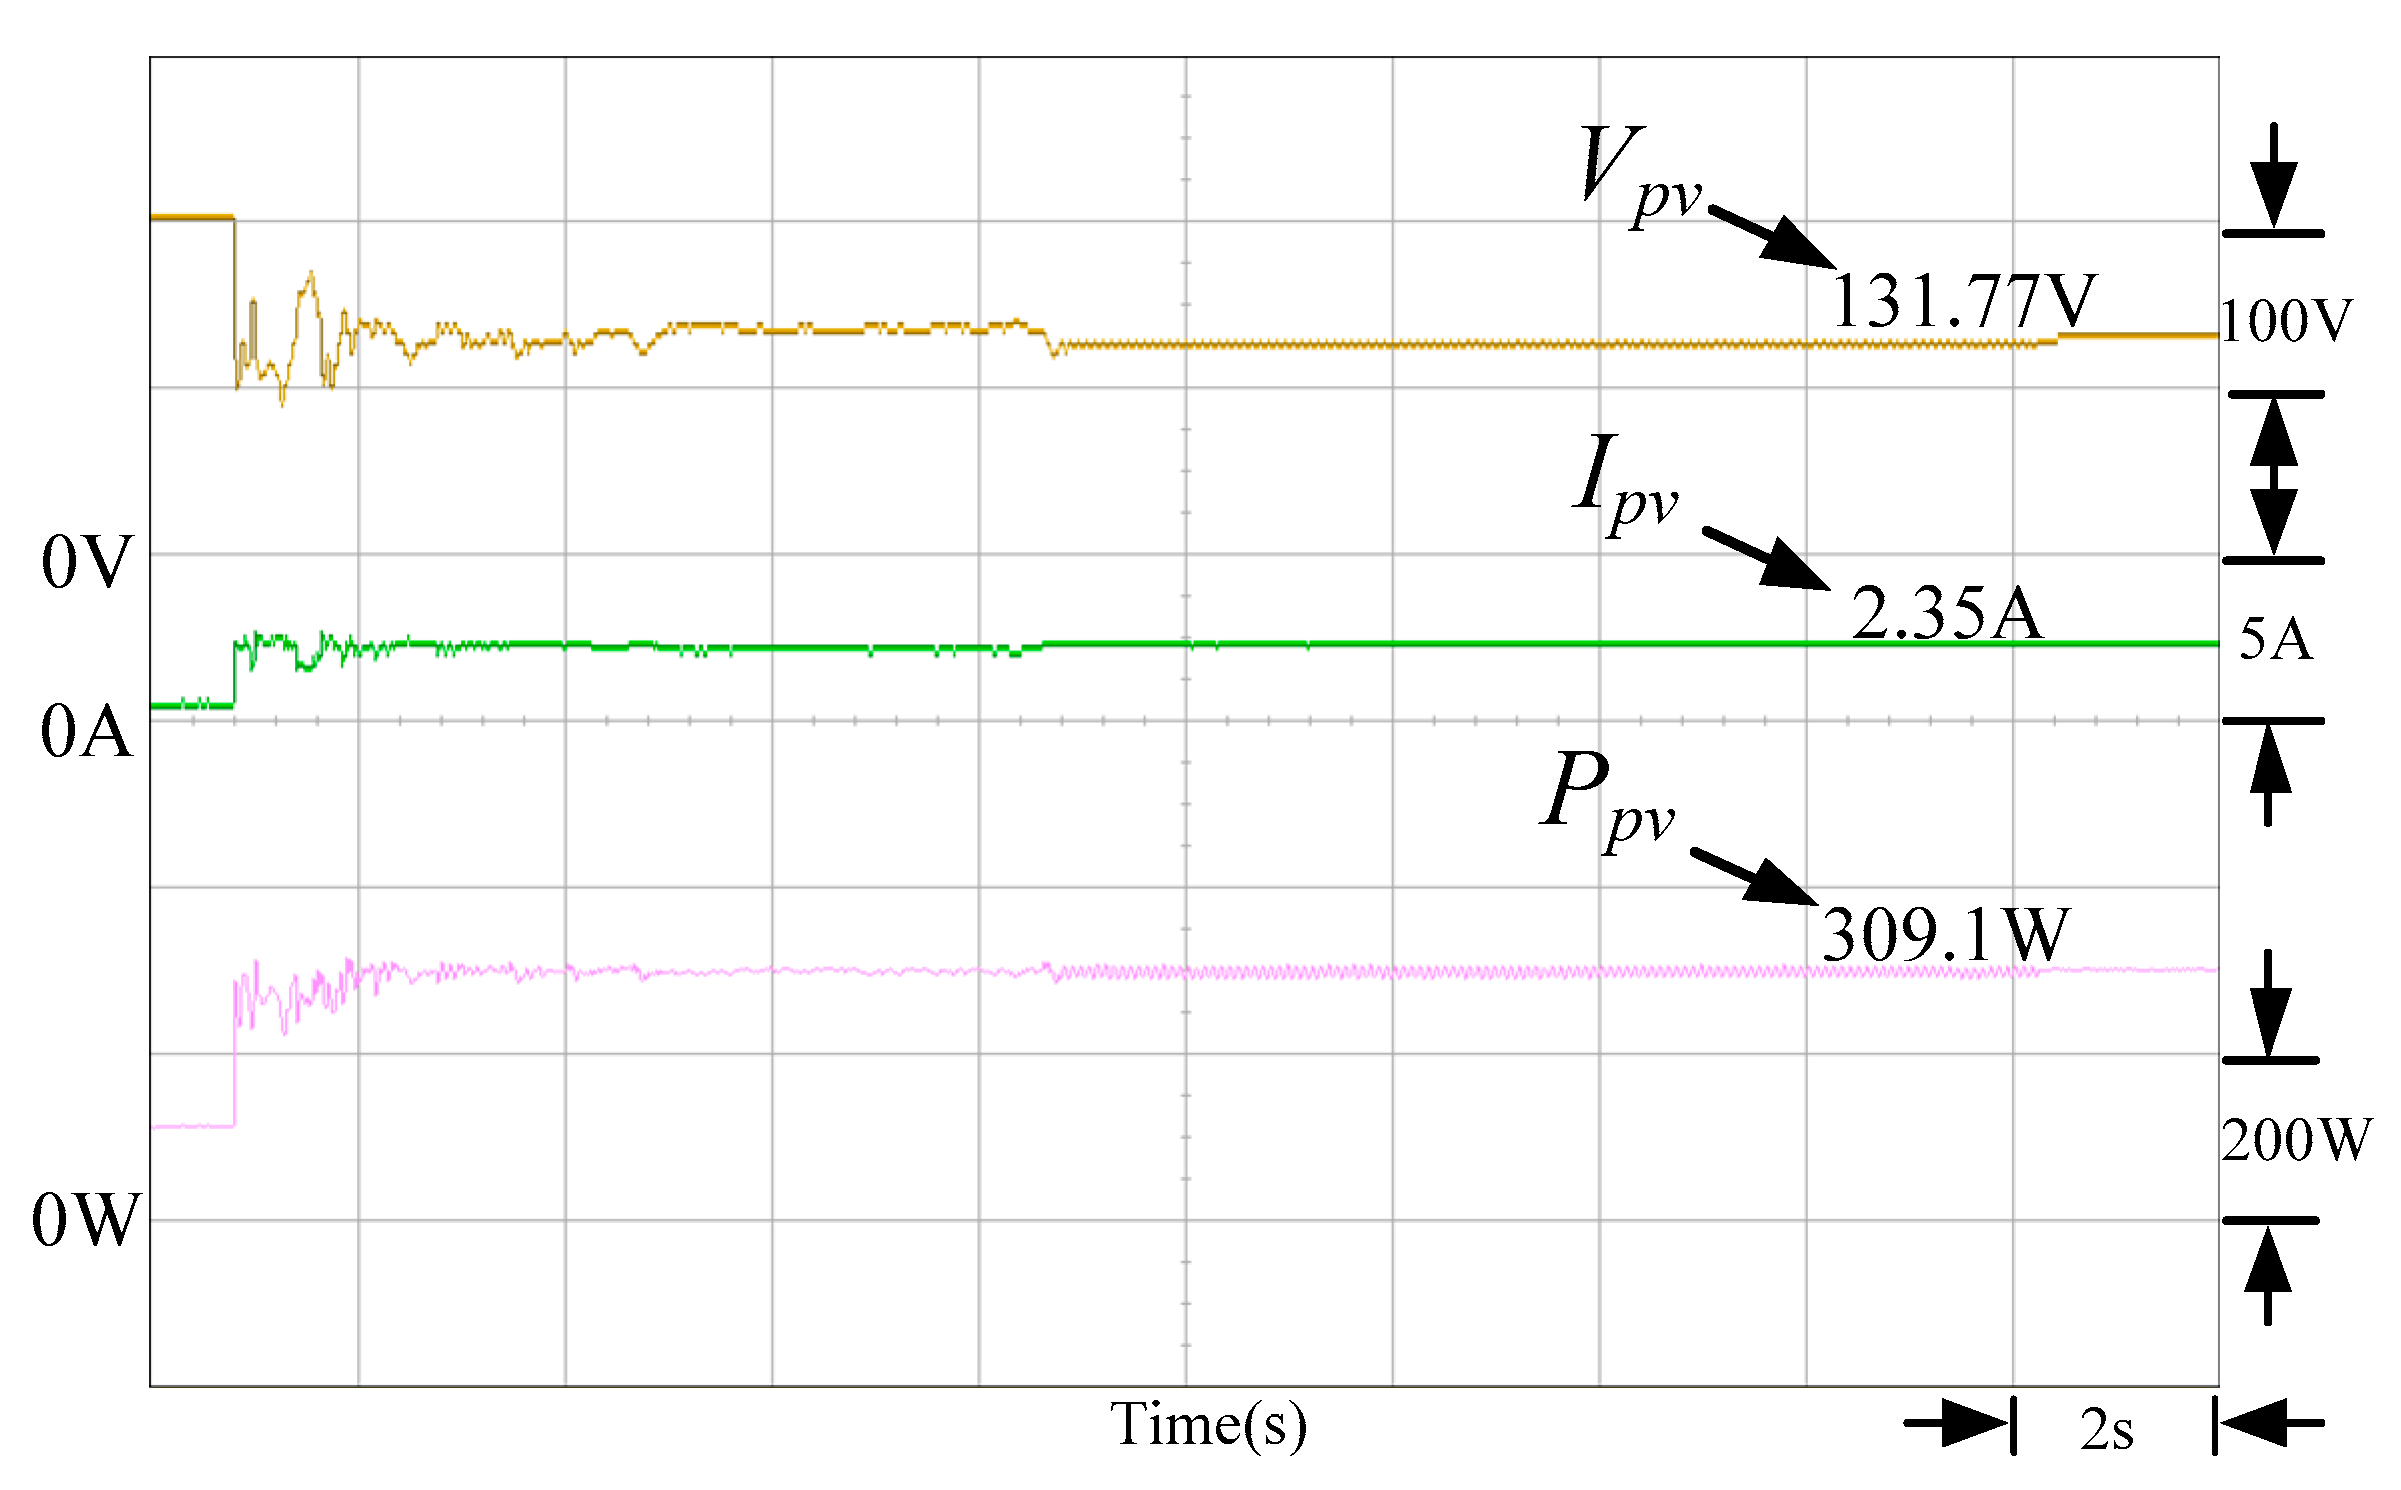
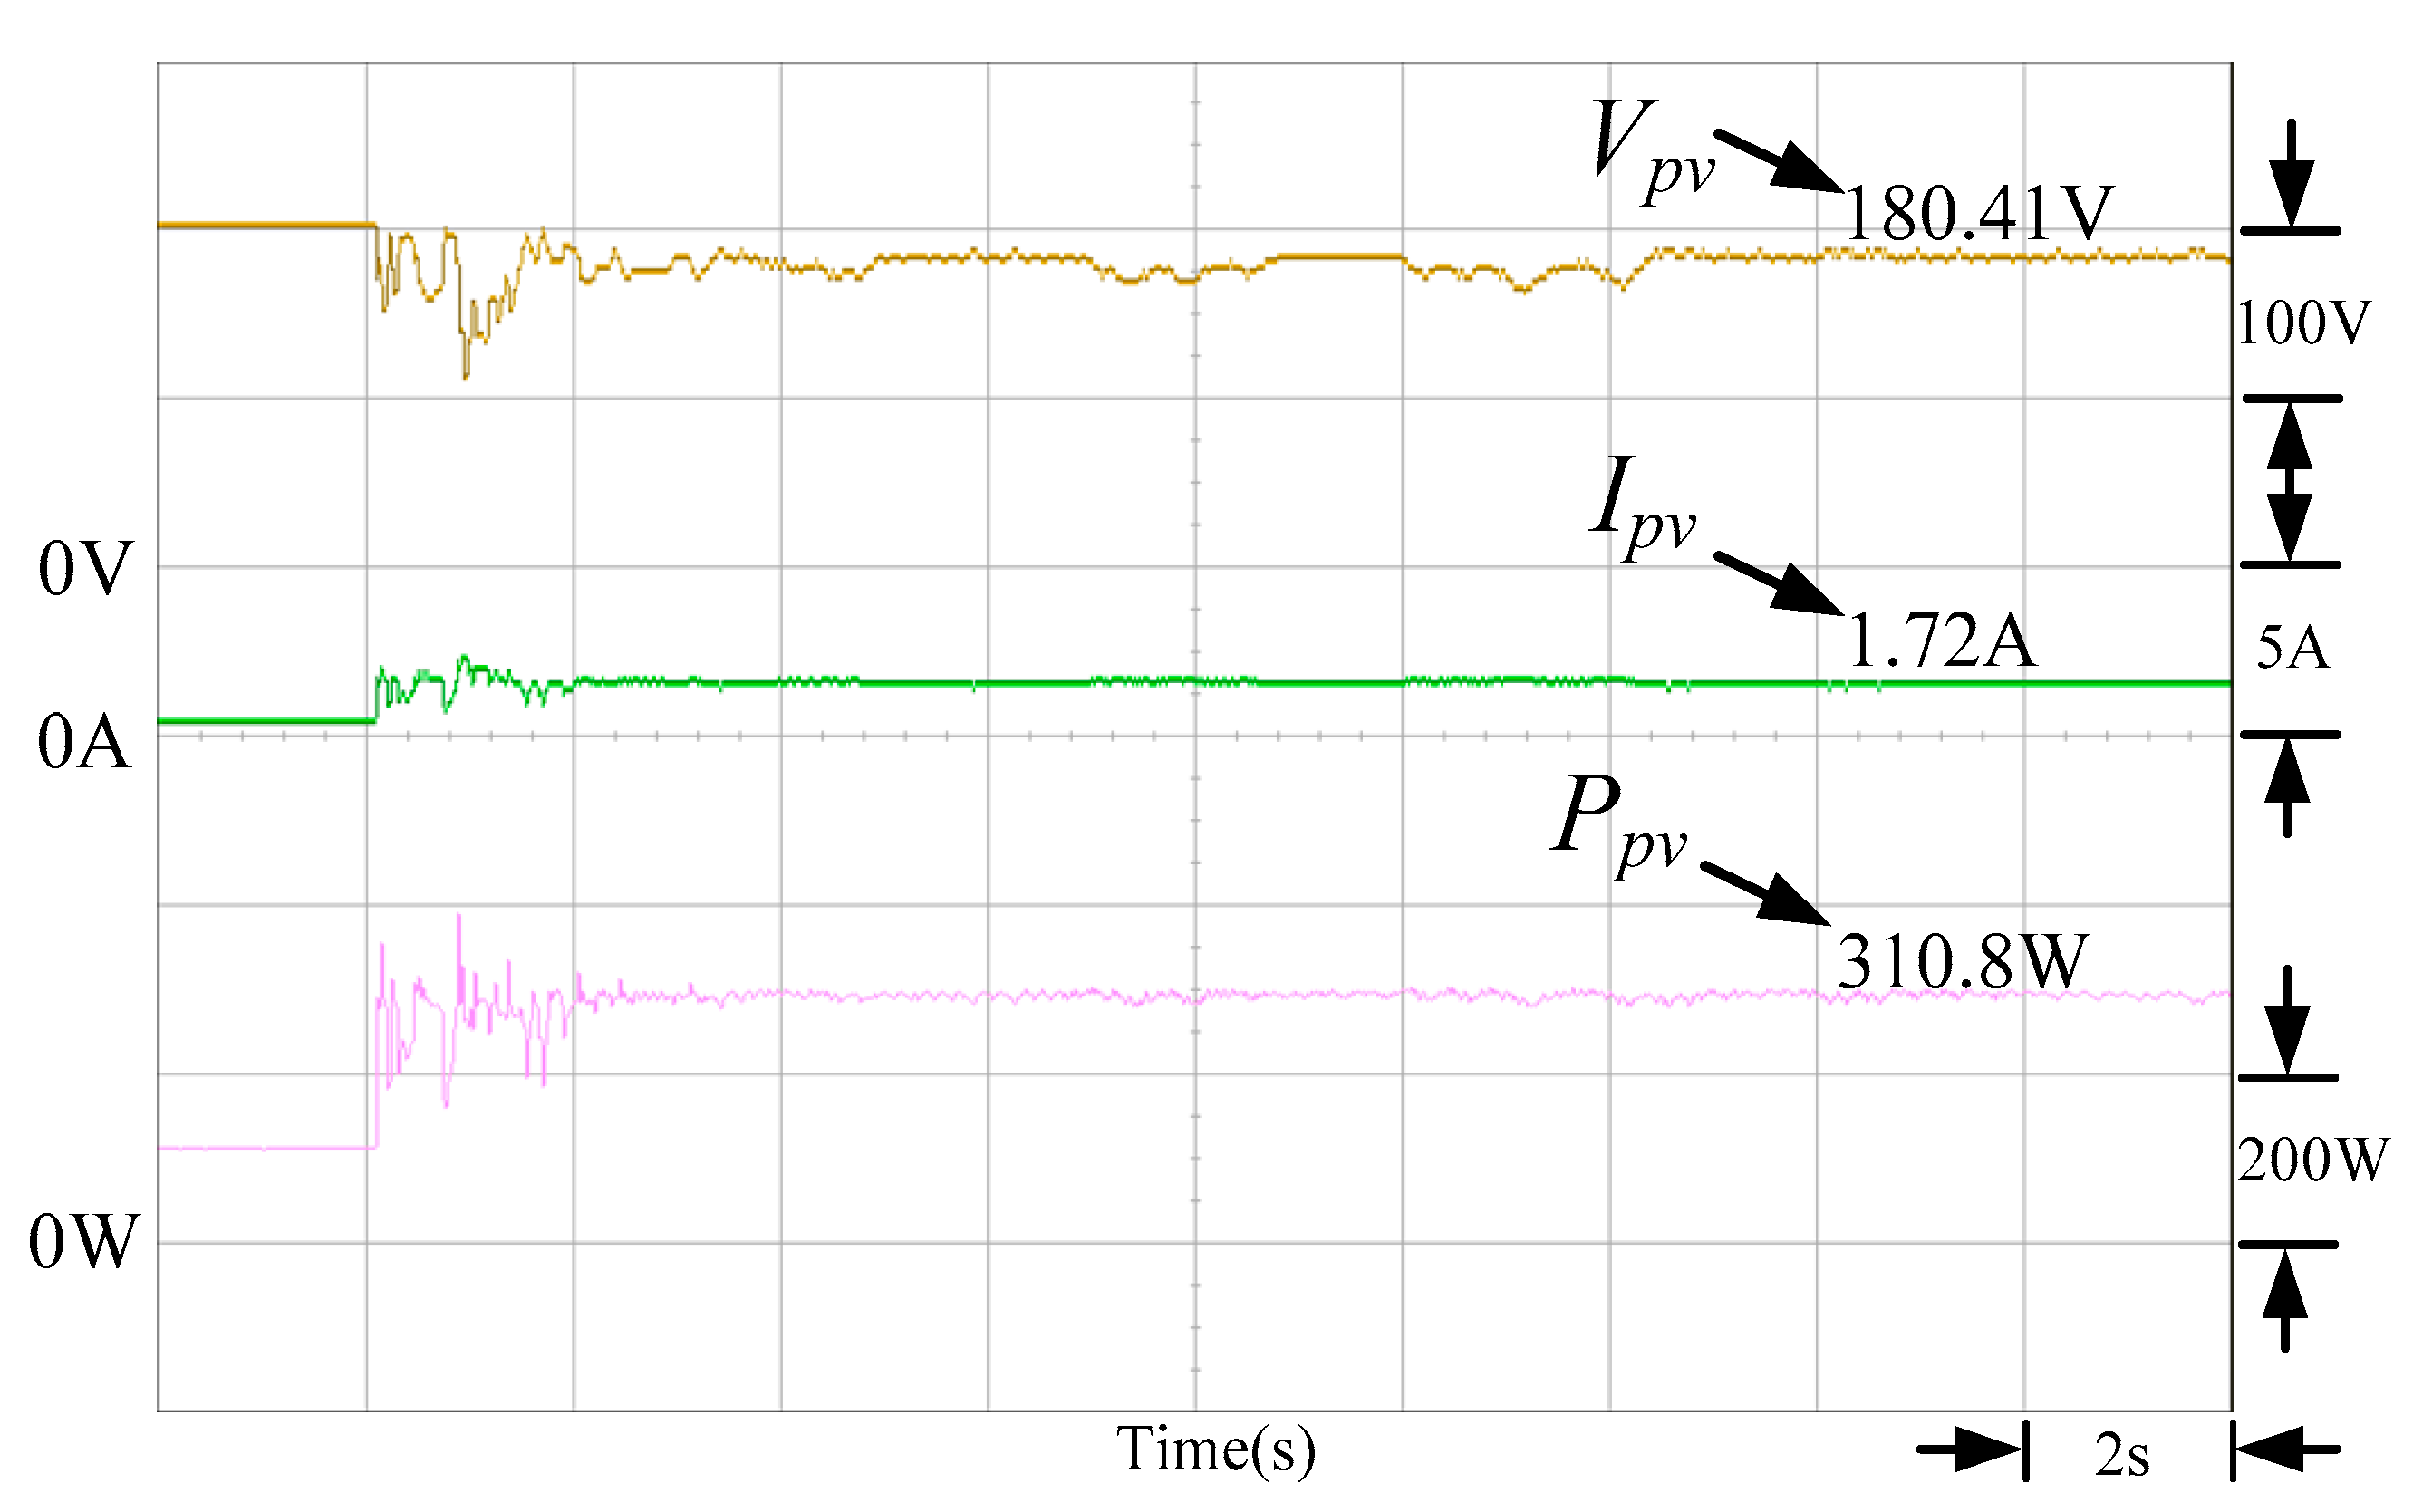
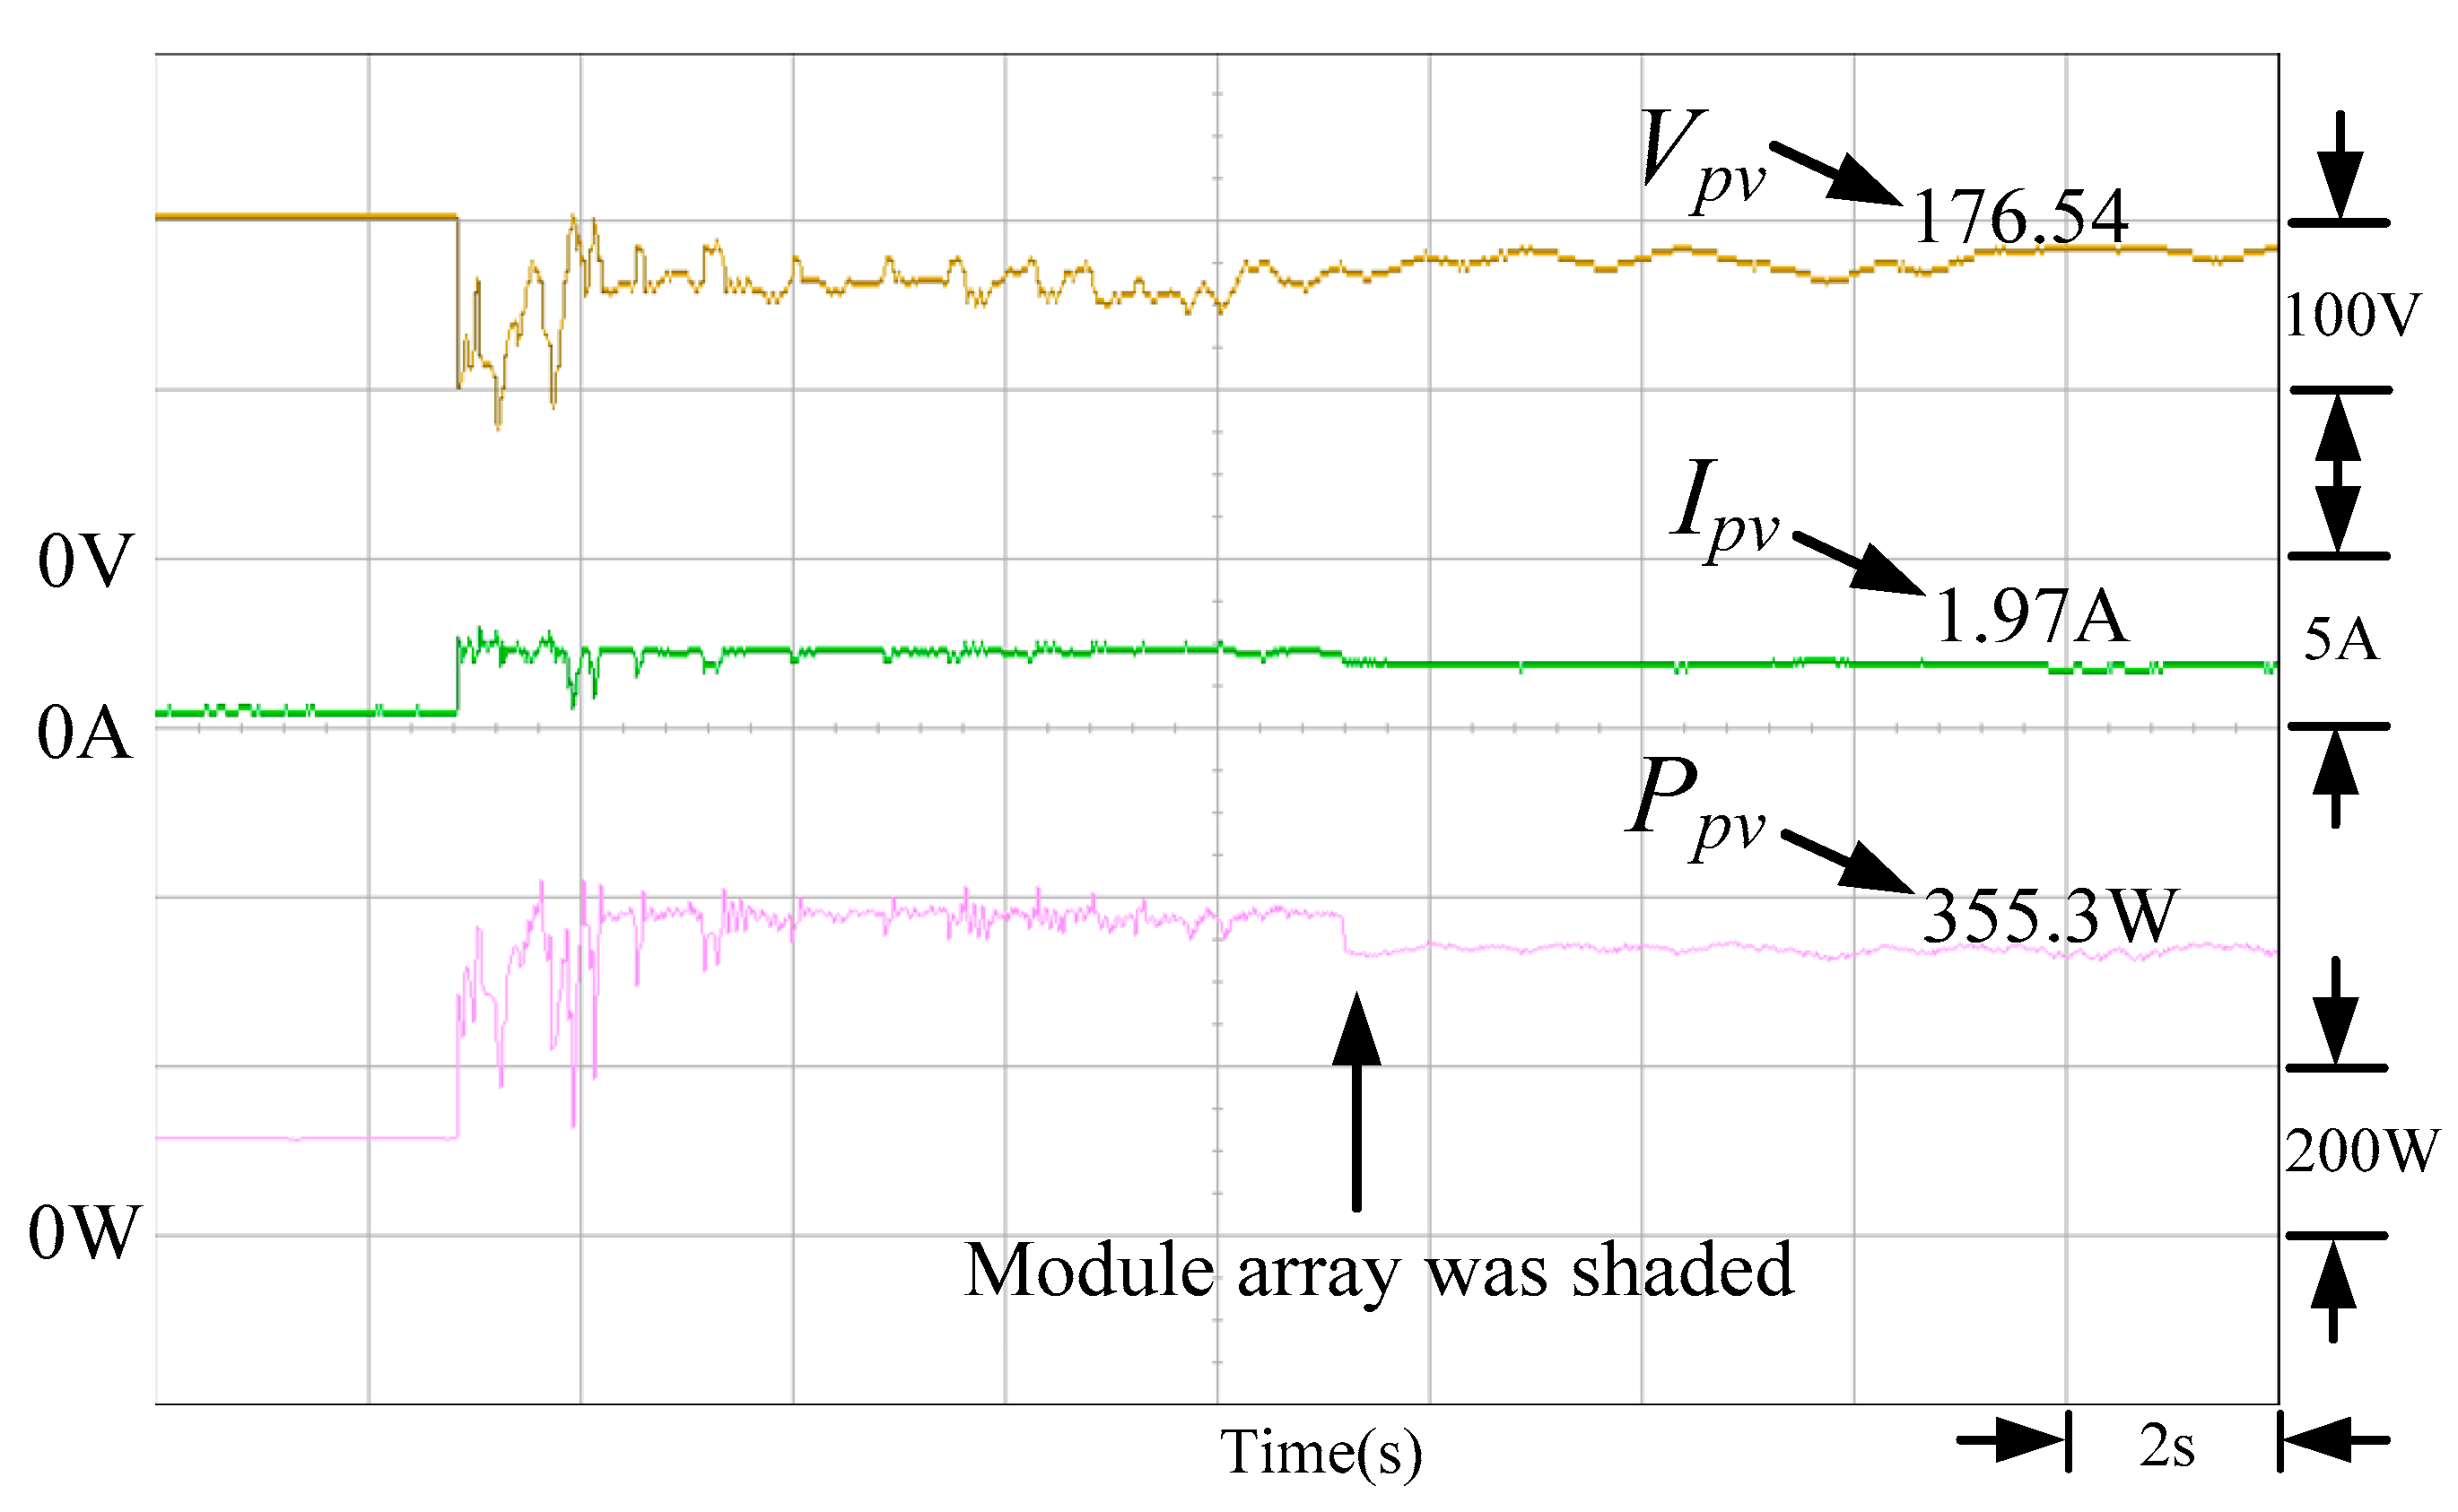
3.1. Maximum Power Point Tracking Results

This study first conducted the simulation by using an SX-10 module manufactured by BP [18] with Solar Pro simulation software. Table 5 lists four different partial shading conditions. The output P–V characteristic curves included 2, 3, and 4 peaks, and Case 4 was in a dynamic shading condition. The power levels of the four partial shading conditions (Table 5) were measured.
(1)
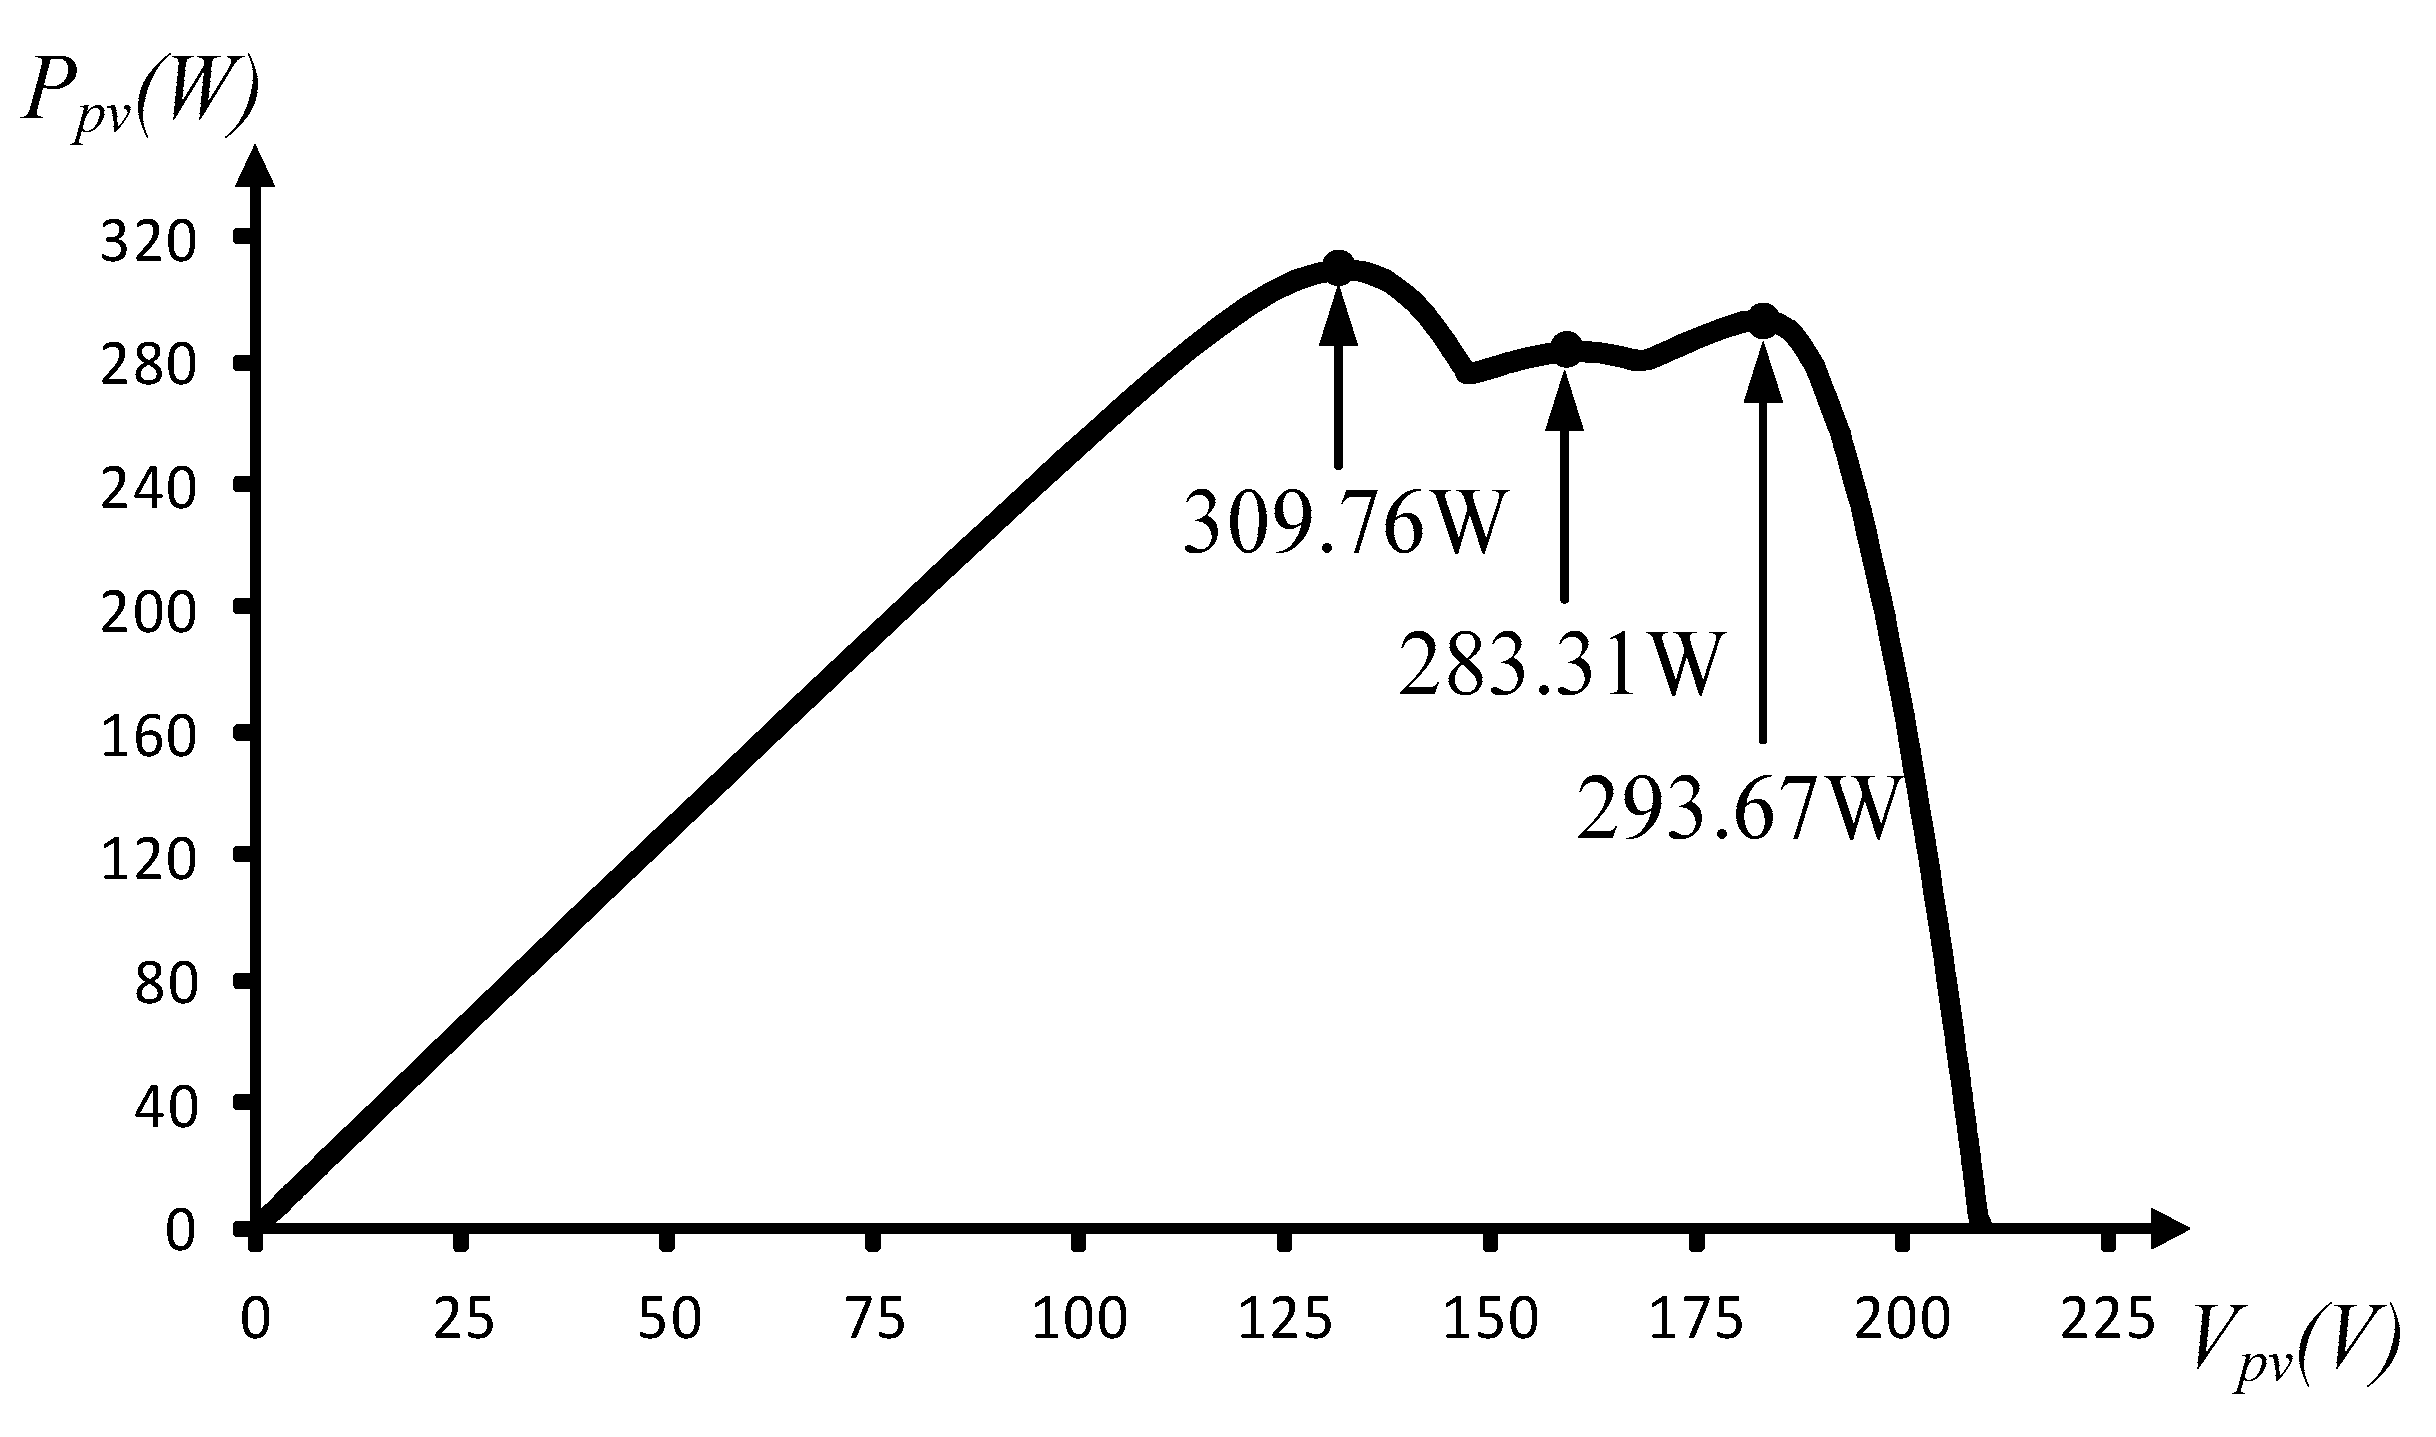
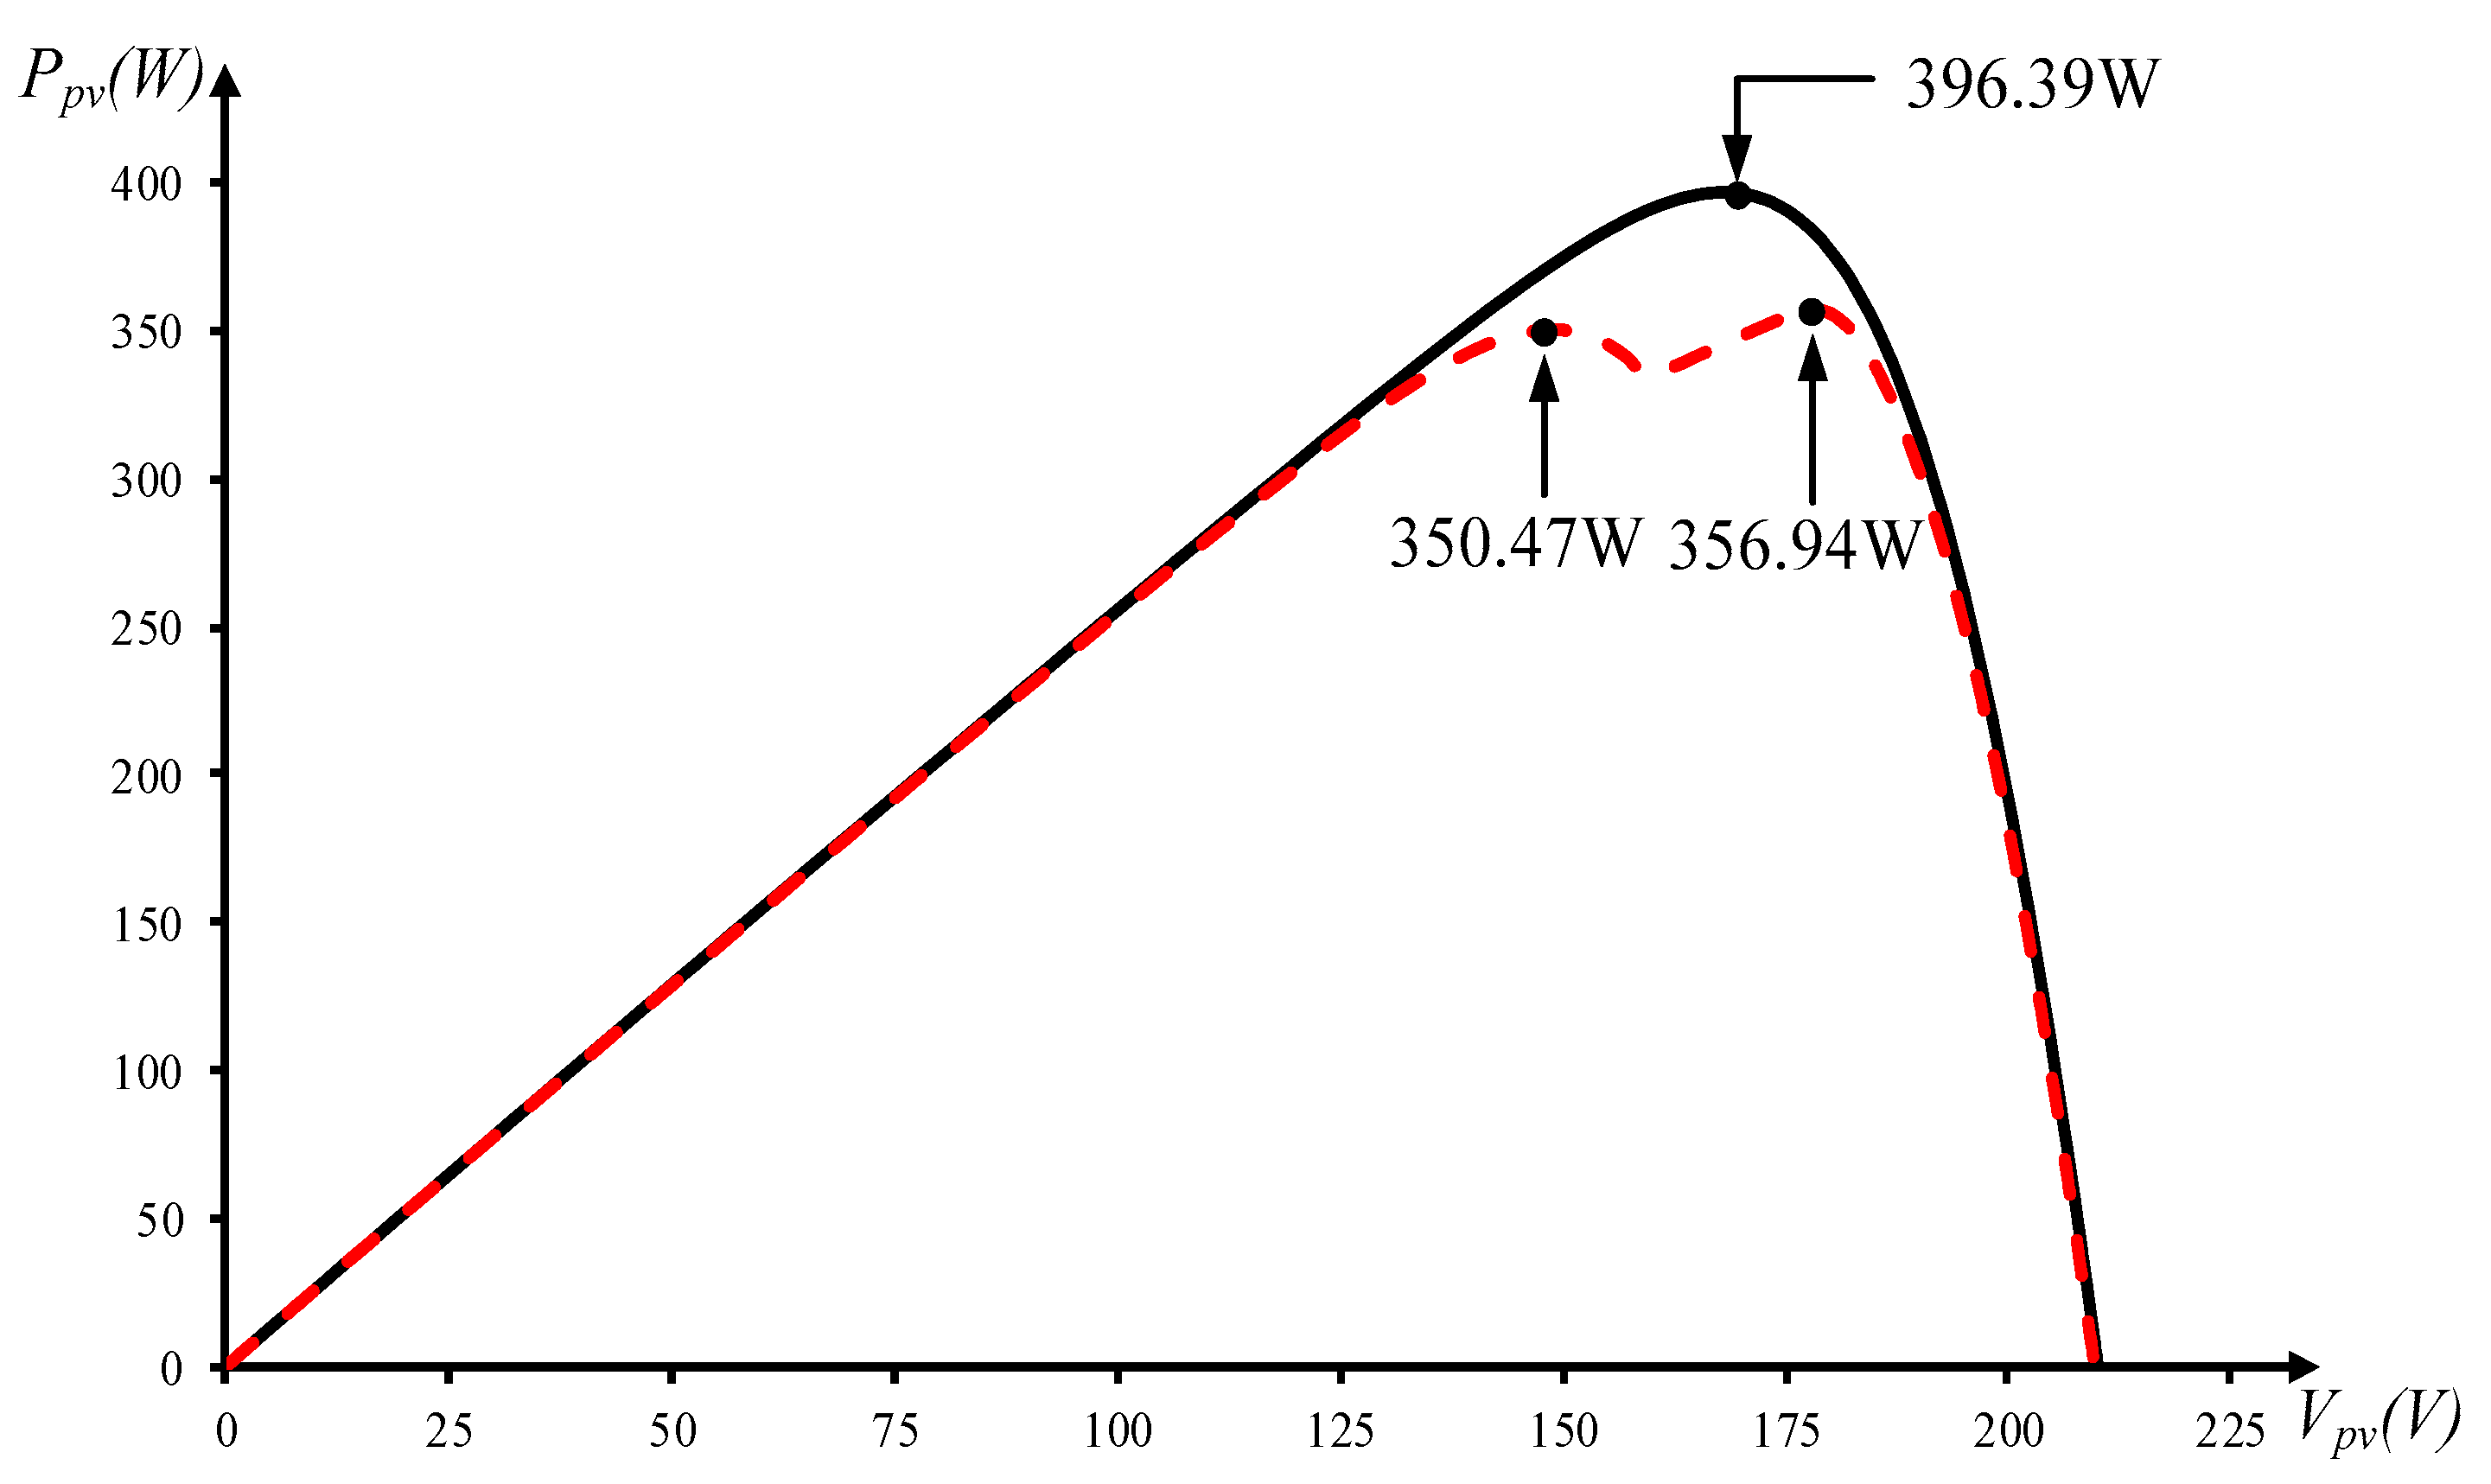
Case 1 (10 panels in each of 4 parallel string arrays): [1 panel, 35% shaded + 9 panels, 0% shaded] // [1 panel, 35% shaded + 9 panels, 0% shaded] // [1 panel, 35% shaded + 9 panels, 0% shaded] // [1 panel, 35% shaded + 9 panels, 0% shaded]
Figure 7 shows the simulated P–V characteristic curve of Case 1 by using the aforementioned 62050H-600S. The output P–V characteristic curve has 2 peaks, and the global maximum power point is 350.23 W on the left. Figure 8 shows the measured tracking results of the TLBO algorithm. The figure indicates that the proposed TLBO algorithm could rapidly escape the suboptimal region to reach the global maximum power point.
(2)
Case 2 (10 panels in each of 4 parallel string arrays): [1 panel, 30% shaded + 9 panels, 0% shaded] // [1 panel, 30% shaded + 9 panels, 0% shaded] // [2 panels, 30% shaded + 8 panels, 0% shaded] // [2 panels, 30% shaded + 8 panels, 0% shaded]
Figure 9 shows the P–V characteristic curve of Case 2. The output P–V characteristic curve has 3 peaks, and the global maximum power point is at 309.76 W on the left. Figure 10 demonstrates the measured tracking results of TLBO algorithm. The proposed TLBO algorithm can rapidly track the global maximum power point.
(3)
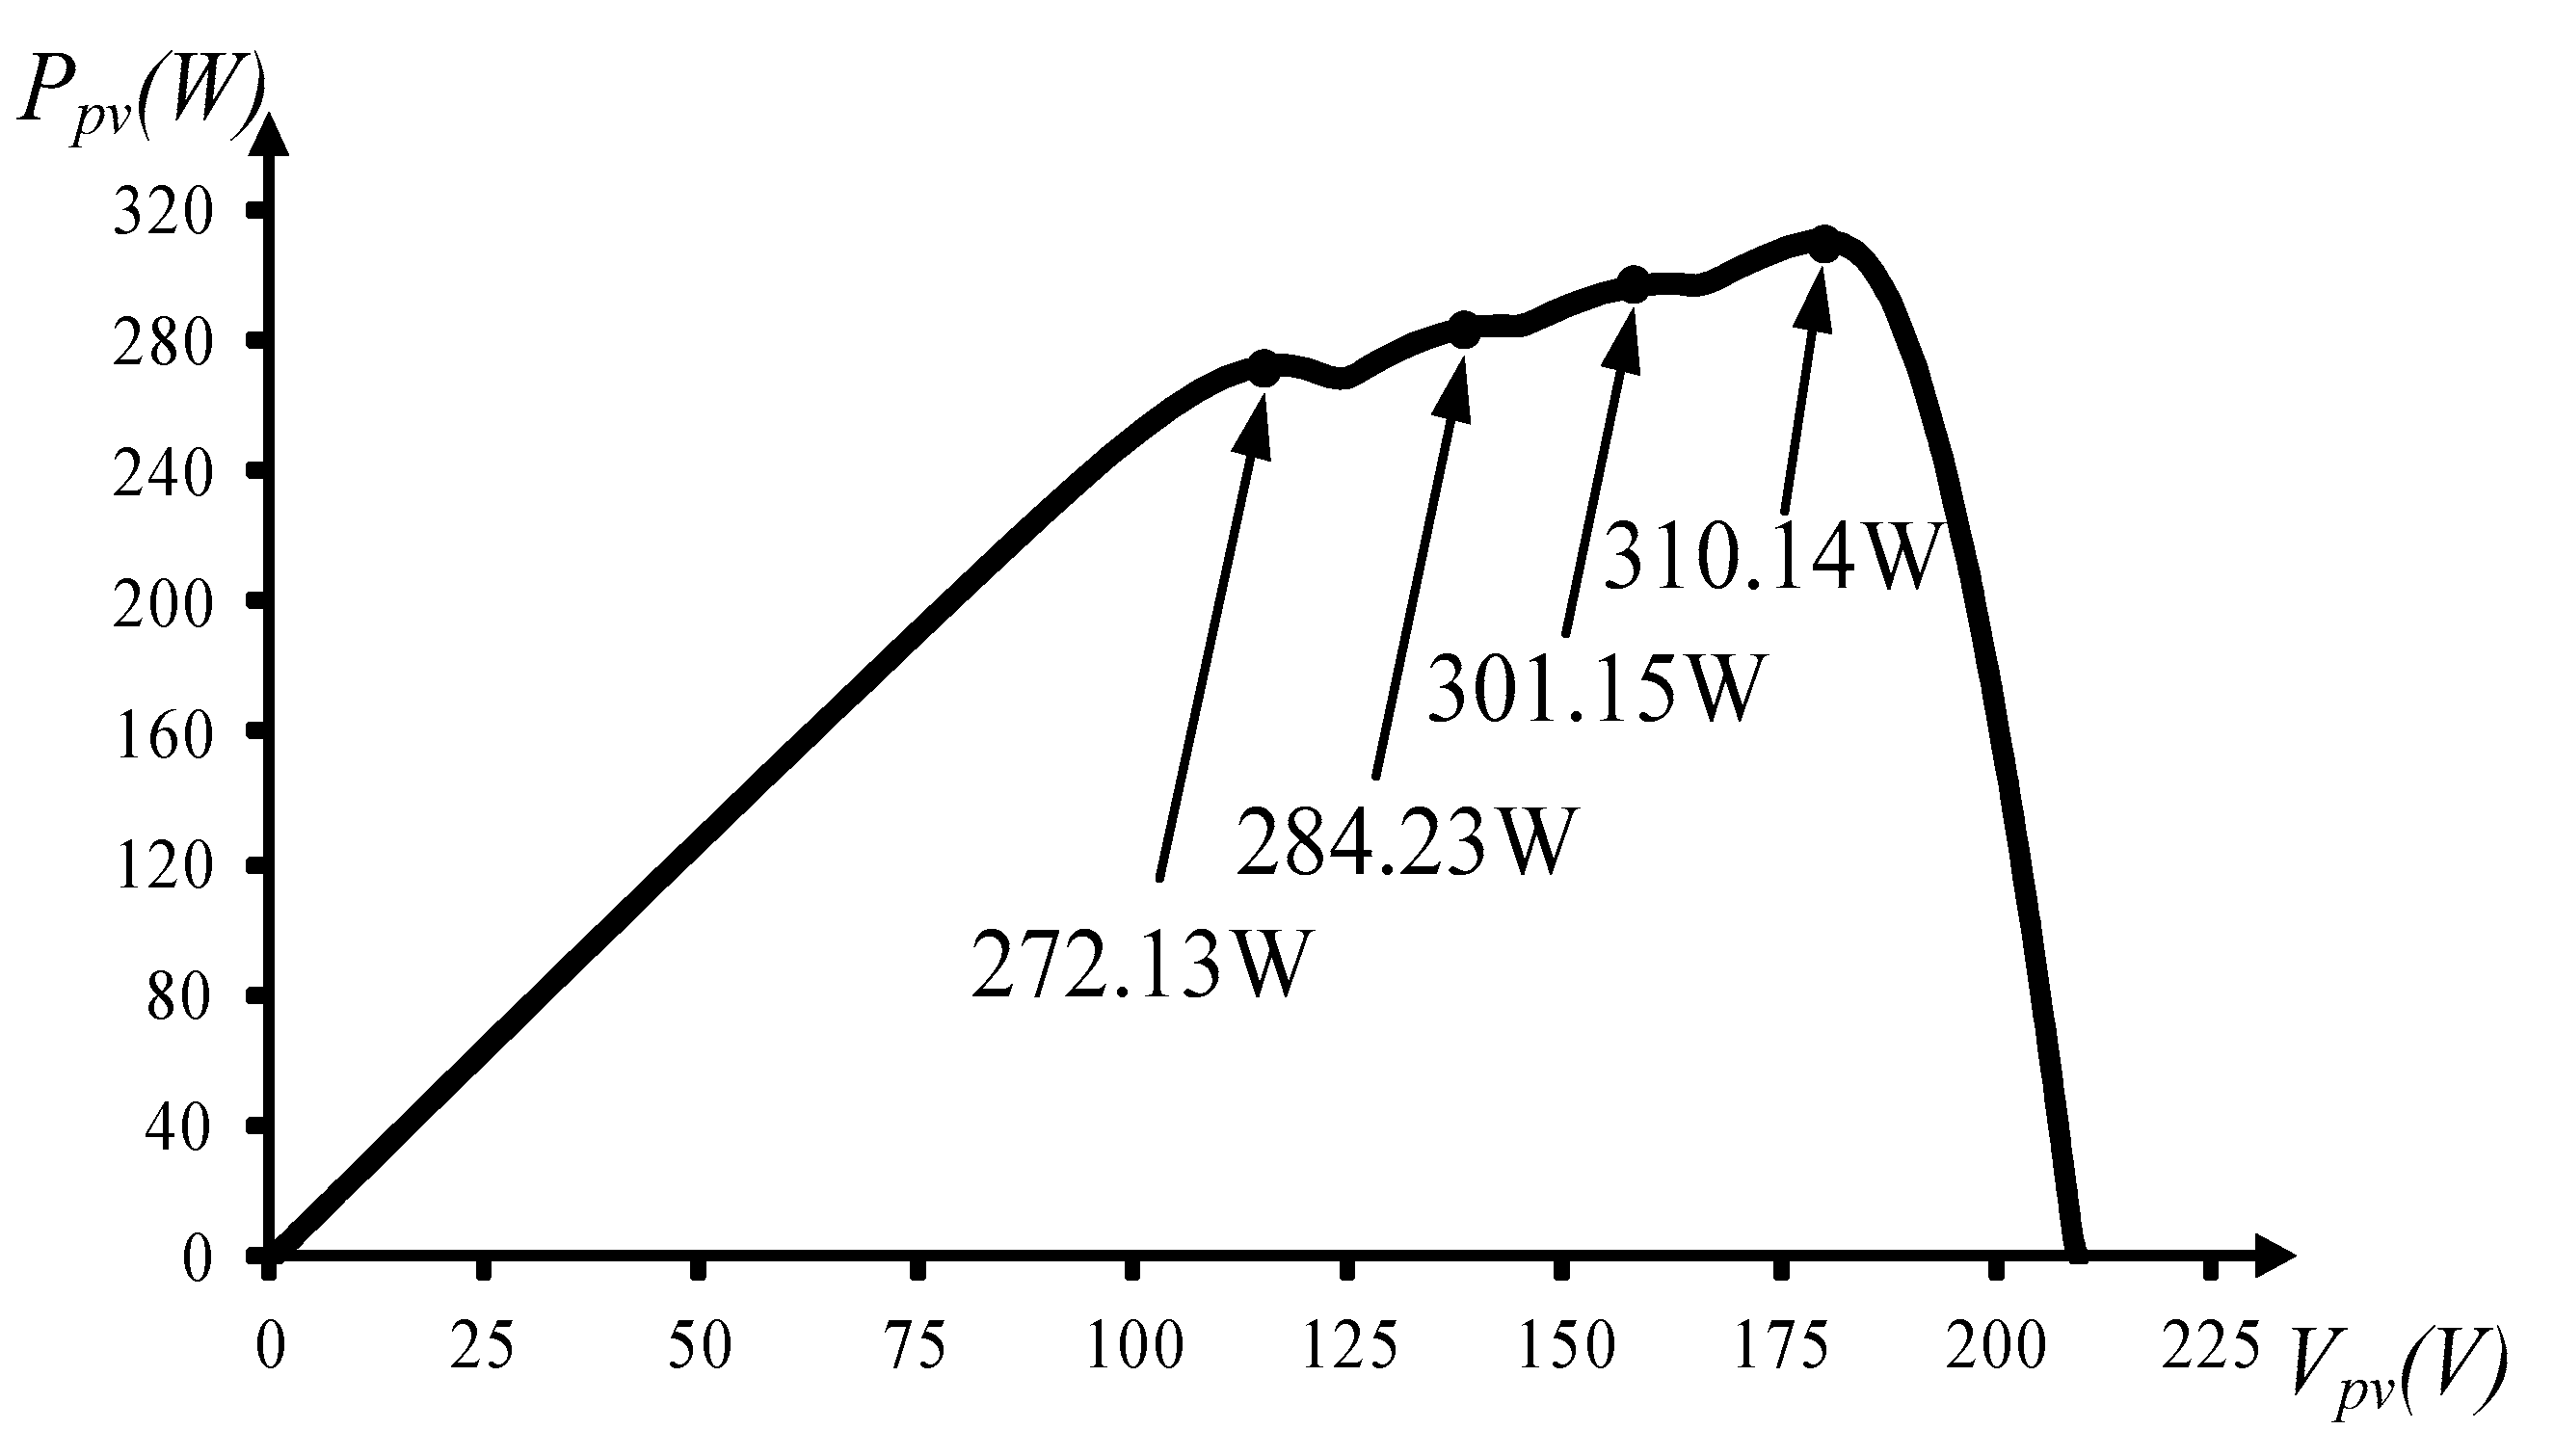
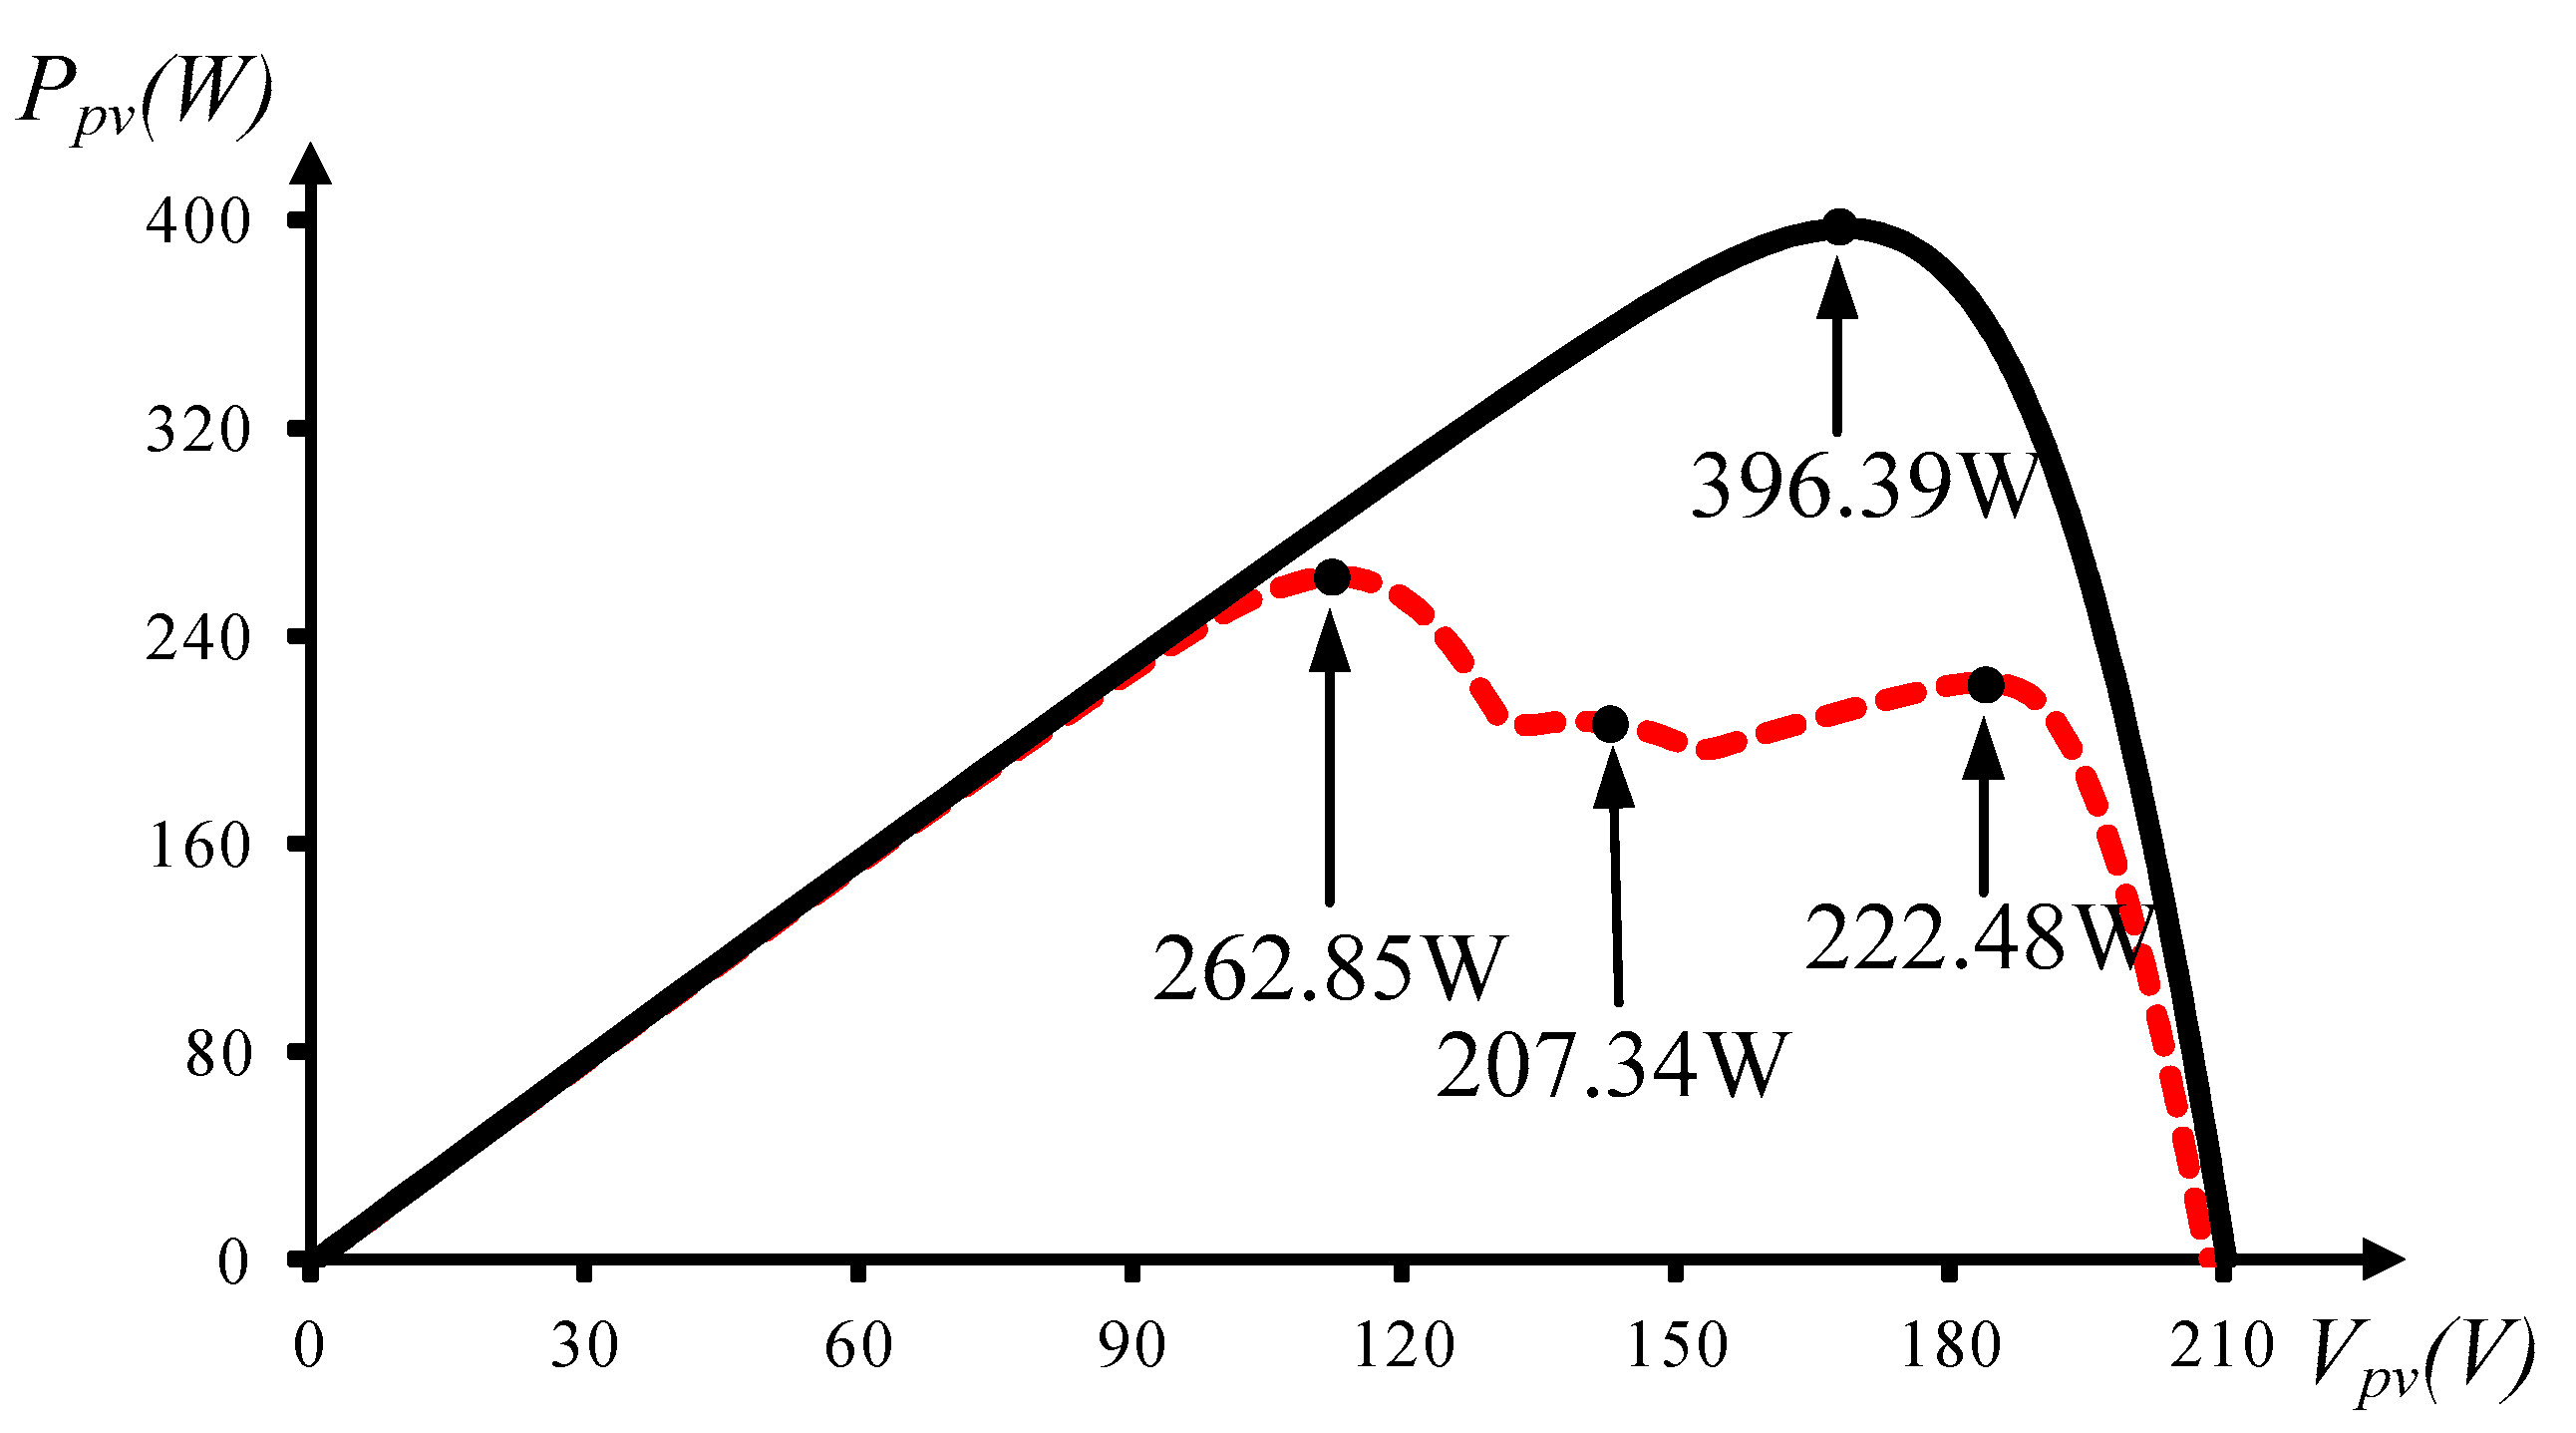
Case 3 (10 panels in each of 4 parallel string arrays): [1 panel, 30% shaded + 9 panels, 0% shaded] // [2 panels, 30% shaded + 8 panels, 0% shaded] // [3 panels, 30% shaded + 7 panels, 0% shaded] // [3 panels, 30% shaded + 7 panels, 0% shaded]
Figure 11 displays the P–V characteristic curve of Case 3. The P–V output characteristic curve has 4 peaks, and the global maximum power point is at 310.14 W on the right. Figure 12 shows the measured tracking results of TLBO algorithms. The proposed TLBO algorithm can still rapidly escape the local solution and accurately track the global maximum power point.
(4)
Case 4 (10 panels in 4 parallel string arrays): [1 panel, 20% shaded + 9 panels, 0% shaded] // [1 panel, 20% shaded + 9 panels, 0% shaded] // [1 panel, 20% shaded + 9 panels, 0% shaded] // [1 panel, 20% shaded + 9 panels, 0% shaded]
Figure 13 demonstrates the P–V characteristic curve of Case 4. Initially, the output P-V characteristic curve showed a single peak, and the maximum power point was at 396.39 W. After approximately 10 s, 2 peaks appeared on the output characteristic curve of the photovoltaic module, and the global maximum power point became 356.94 W on the right. Figure 13 demonstrates the measured tracking results of the TLBO algorithm. Figure 14 indicates that the proposed TLBO algorithm was not affected by the shading condition of the photovoltaic module array and could still track the global maximum power point rapidly and accurately.

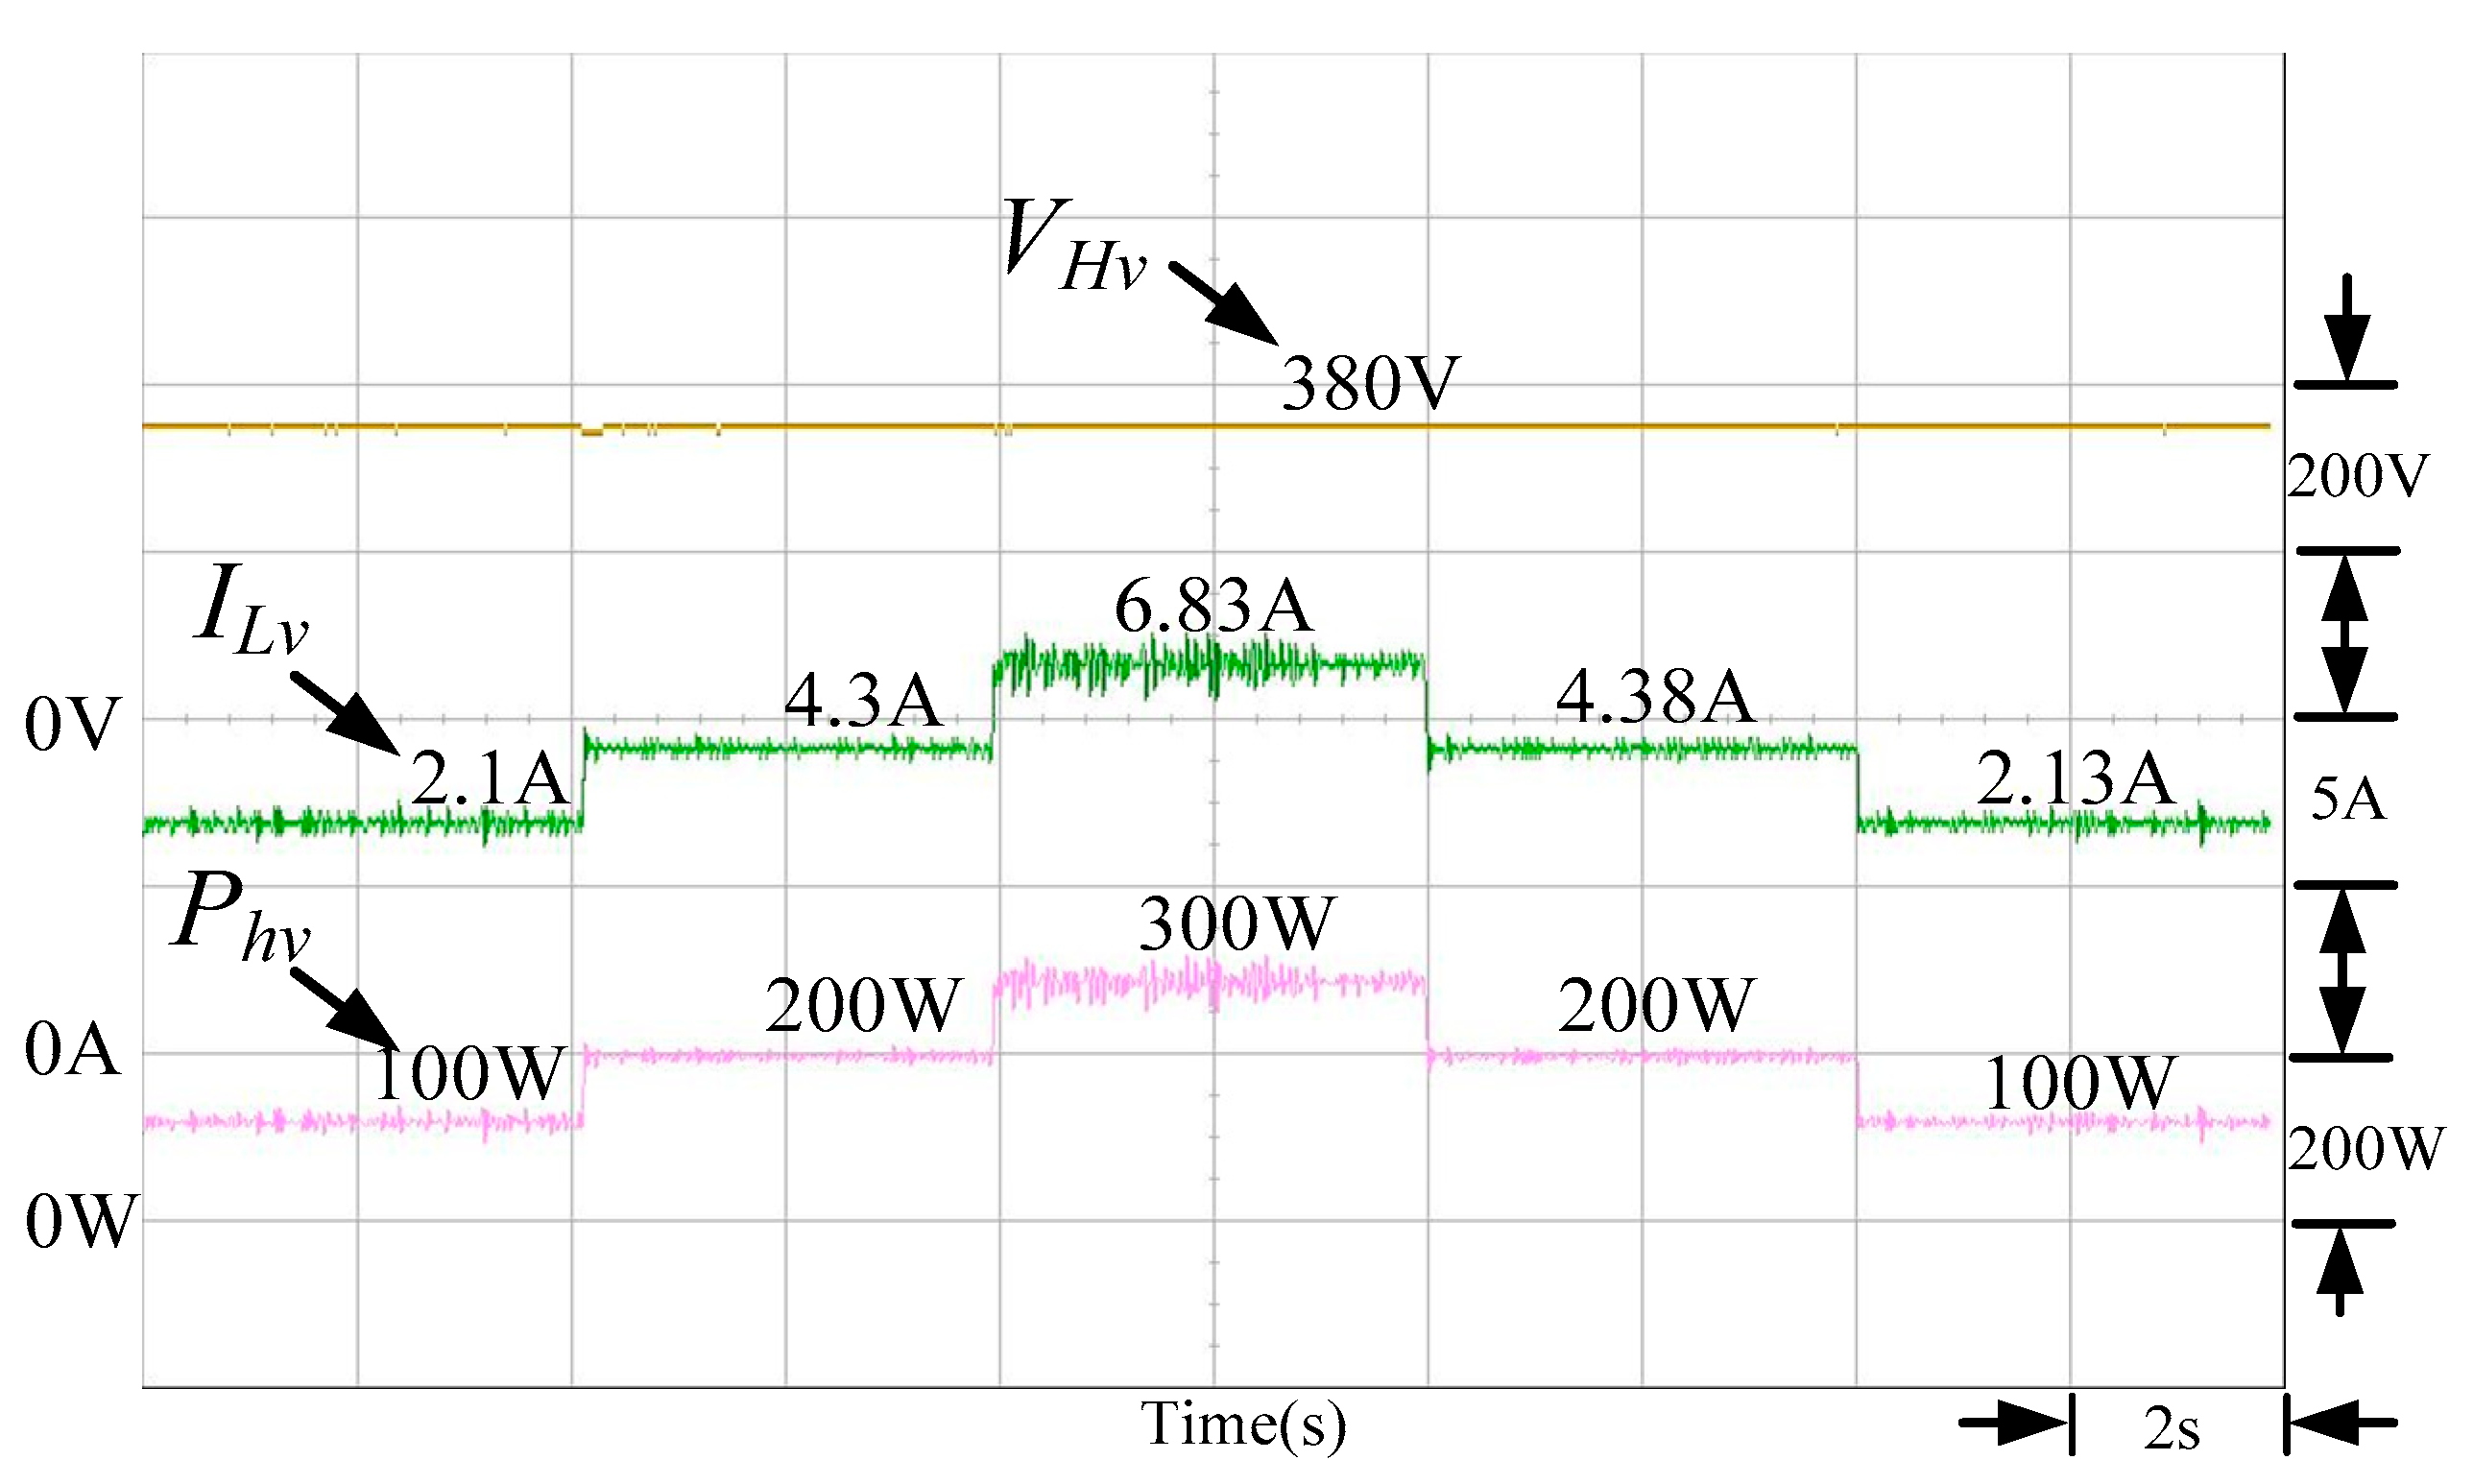
3.2. Measured Results of the Energy Storage Regulation of the High-Boost/Buck-Ratio Bidirectional Converter

To verify that the proposed high-boost/buck-ratio bidirectional converter had favorable regulation performance under various operating conditions, the DC load terminals were individually tested under different conditions of changing load. The high-voltage side of the converter was connected to the DC terminal load, and the low-voltage side was connected to the battery terminal. In addition, the DC link voltage was controlled at 380 V, and the battery discharged at an output voltage of 50 V. Figure 15 shows that the DC load power varied from 100 to 200 W and then changed to 300 W; it later changed to 200 W and 100 W. This indicated that the proposed DC load terminal voltage controller could regulate the DC load terminal by charging and discharging the battery to maintain the voltage at 380 V to verify the performance of the proposed high-boost/buck-ratio bidirectional converter.

3.3. Measured Results of the DC Load Terminal

The DC link voltage was affected by the maximum power point tracking; thus, the power quality was unstable. Therefore, to verify the reliability of applying the proposed energy storage regulation system to a DC micro-grid, the system was tested by changing output power of the photovoltaic module array and maintaining the power of the DC load terminal at 300 W. In addition, the positive battery current indicated that the battery was discharging; if the current was negative, the battery was charging. Figure 16 shows that if the photovoltaic module array was unshaded, the maximum power point was 396.39 W. If the photovoltaic module array was shaded, the maximum output power point was 262.85 W (on the left). Figure 17 demonstrates that if the output power of the photovoltaic module array was 396.39 W, the power generation was higher than power consumption; thus, the battery was in the energy accumulation mode. If the photovoltaic module array was shaded, the output power decreased to 262.85 W. The power generation was lower than the load power consumption; thus, the battery was in the auxiliary power supply mode.

3.4. Measured Results of the Inverter

To ensure that the system was available for AC load, this study used the DC link voltage of 380 V as the input terminal of the inverter. To equalize the output voltage of the inverter and the phase and frequency of the supply mains terminal voltage (220 V), an AC voltage detection circuit was used to compare and correct the errors of the extracted amplitude of the supply mains and the inverter. The zero-crossing detection circuit was used to extract the amplitude of supply mains phase. By using the extracted phase, the phase and amplitude of the inverter output and the supply mains terminal voltage were made identical, thus that the AC power could be supplied to the AC load. Figure 18 shows that the output voltage, phase, and frequency of the inverter were the same as those of the supply mains power.

4. Conclusions

This study proposed a photovoltaic system that stores energy for DC micro-grid systems. If the photovoltaic module array were shaded, the output characteristic curves of the photovoltaic module array would show the patterns with multiple peaks. Therefore, this study developed an MPPT based on the TLBO algorithm; the resulting system was able to escape local optima. The measured results verified the tracking speed, accuracy, and the performance of the system. In addition, a control strategy was proposed for the voltage variation of the DC load terminal. Because the proposed bidirectional converter controlled the energy charging and discharging of the battery, the energy flow direction on the DC bus bar was controlled and the voltage was stabilized. This study also verified the performance of the proposed high-boost/buck-ratio bidirectional converter and smart MPPT by measuring the system performance under various shading conditions and energy storage control settings. Finally, this study used the inverter to convert the DC load terminal voltage into an AC sine wave. The zero-crossing detection circuit and AC voltage detection circuit were adopted to ensure that the inverter output and the supply mains terminal voltage had the same phase and amplitude, thus that the system was able supply power to the AC loads to improve the performance of DC micro-grid systems; such micro-grids could supply power to users in remote areas.

Author Contributions

The conceptualization was proposed by K.-H.C., who also was responsible for writing—review and editing this paper. Y.-J.L. developed a smart maximum power point tracker based on a teaching learning based optimization algorithm. He also developed an inverter to convert direct current into alternating current for alternating current loads. W.-C.C. proposed an energy accumulation and release strategy that used a high-boost/buck-ratio bidirectional converter to control the battery charge and discharge for energy accumulation and release. He also carried out the data curation, software program and experimental validation. K.-H.C. was in charge of project administration.

Funding

This research was funded by the Ministry of Science and Technology, Taiwan, under the Grant Number MOST 106-2221-E-167-013-MY2.

Acknowledgments

The authors gratefully acknowledge the support of the Ministry of Science and Technology, Taiwan, under the Grant Number MOST 106-2221-E-167-013-MY2.

Conflicts of Interest

The authors of the manuscript declare that there is no conflict of interest with any of the commercial identities mentioned in the manuscript.

References

  1. Wang, Y.J.; Hsu, P.C. Analytical modeling of partial shading and different orientation of photovoltaic modules. IET Renew. Power Gener. 2010, 4, 272–282. [Google Scholar] [CrossRef]
  2. Fermia, N.; Lisi, G.; Petrone, G.; Spagnuolo, G.; Vitelli, M. Distributed maximum power point tracking of photovoltaic arrays: Novel approach and system analysis. IEEE Trans. Ind. Electron. 2008, 55, 2610–2621. [Google Scholar] [Green Version]
  3. Koutroulis, E.; Kalaitzakis, K.; Voulgaris, N.C. Development of a microcontroller-based photovoltaic maximum power point tracking control system. IEEE Trans. Power Electron. 2001, 16, 46–54. [Google Scholar] [CrossRef]
  4. Shih, Y.W. A Systematic Approach for Designing Control Rule of Fuzzy Controller. Master’s Thesis, China University of Science and Technology, Taipei, Taiwan, 2009. [Google Scholar]
  5. Hung, C.P.; Liuand, W.G.; Su, H.Z. Fault diagnosis of steam turbine-generator sets using CMAC neural network approach and portable diagnosis apparatus implementation. In Proceedings of the 5th International Conference on Intelligent Computing (ICIC), Ulsan, South Korea, 16–19 September 2009; pp. 724–734. [Google Scholar]
  6. Ramaprabha, R. Maximum power point tracking using GA-optimized artificial neural network for solar PV system. In Proceedings of the 1st International Conference on Electrical Energy Systems (ICEES), Newport Beach, CA, USA, 3–5 January 2011; pp. 264–268. [Google Scholar]
  7. Besheer, A.H. Ant colony system based PI maximum power point tracking for stand alone photovoltaic system. In Proceedings of the IEEE International Conference on Industrial Technology (ICIT), Athens, Greece, 19–21 March 2012; pp. 693–698. [Google Scholar]
  8. Chao, K.H.; Chiu, C.L. Design and implementation of an intelligent maximum power point tracking controller for photovoltaic systems. Int. Rev. Electr. Eng-I. 2012, 7, 3759–3768. [Google Scholar]
  9. Pellegrino, G.; Vagati, A.; Boazzo, B.; Guglielmi, P. Comparison of induction and PM synchronous motor drives for EV application including design examples. IEEE Trans. Ind. Appl. 2012, 48, 2322–2332. [Google Scholar] [CrossRef]
  10. Ortiz-Rivera, E.I. Understanding the history of fuel cells. In Proceedings of the IEEE Conference on the History of Electric Power, Newark, NJ, USA, 3–5 August 2007; pp. 117–122. [Google Scholar]
  11. Marongiu, A.; Damiano, A.; Heuer, M. Experimental analysis of lithium iron phosphate battery performances. In Proceedings of the IEEE International Symposium on Industrial Electronics (ISIE), Bari, Italy, 4–7 July 2010; pp. 3420–3424. [Google Scholar]
  12. Liu, W.P.; Lin, M.S. Research and application of high concentrating solar photovoltaic system. In Proceedings of the 2nd IEEE International Conference on Consumer Electronics, Communications and Networks (CECNet), Yichang, China, 21–23 April 2012; pp. 1187–1191. [Google Scholar]
  13. Lin, C.C.; Yang, L.S.; Wu, G.W. Study of a non-isolated bidirectional DC-DC converter. IET Power Electron. 2013, 6, 30–37. [Google Scholar] [CrossRef]
  14. Wang, Y.X.; Qin, F.F.; Kim, Y.B. Bidirectional DC-DC converter design and implementation for lithium-ion battery application. In Proceedings of the IEEE PES Asia-Pacific Power and Energy Engineering Conference (APPEEC), Hong Kong, China, 7–10 December 2014; pp. 1–5. [Google Scholar]
  15. Lee, M.C. The research of rapid charging technology use in lead-acid battery. Master’s Thesis, National Central University, Taoyuan, Taiwan, 2003. [Google Scholar]
  16. Hart, D.W. Introduction to Power Electronics; Prentice Hall: New York, NY, USA, 2003. [Google Scholar]
  17. Narasimharaju, B.L.; Dubey, S.P.; Singh, S.P. Design and analysis of coupled inductor bidirectional DC–DC convertor for high-voltage diversity applications. IET Power Electron. 2012, 5, 998–1007. [Google Scholar] [CrossRef]
  18. BP SX-10 Data Sheet. Available online: https://www.oeko-energie.de/downloads/bpsx10.pdf (accessed on 23 June 2018).
  19. Solar Pro Official Website. Available online: http://www.lapsys.co.jp/english/products/pro.html (accessed on 12 April 2019).
  20. Rao, R.V.; Savsani, V.J.; Vakharia, D.P. Teaching-learning-based optimization: A novel method for constrained mechanical design optimization problems. Comput. Aided Design 2011, 43, 303–315. [Google Scholar] [CrossRef]
Figure 1. System architecture of the proposed photovoltaic system.
Electronics 08 00567 g001
Figure 2. Architecture of the proposed maximum power point trackers (MPPT).
Electronics 08 00567 g002
Figure 3. Architecture of the proposed high-boost/buck-ratio bidirectional converter.
Electronics 08 00567 g003
Figure 4. Output power–voltage (P–V) characteristic curves of photovoltaic module array with different numbers of shaded panels.
Electronics 08 00567 g004
Figure 5. Flow chart of the proposed teaching learning based optimization (TLBO) method applied to the photovoltaic module array for maximum power point tracking.
Electronics 08 00567 g005
Figure 6. Photo of proposed circuit.
Electronics 08 00567 g006
Figure 7. Output P–V curve of Case 1 photovoltaic module array.
Electronics 08 00567 g007
Figure 8. Case 1 measured results of maximum power point tracking by using TLBO algorithm.
Electronics 08 00567 g008
Figure 9. Output P–V curve of Case 2 photovoltaic module array.
Electronics 08 00567 g009
Figure 10. Case 2 measured results of maximum power point tracking by using TLBO algorithm.
Electronics 08 00567 g010
Figure 11. Output P–V curve of Case 3 photovoltaic module array.
Electronics 08 00567 g011
Figure 12. Case 3 measured results of maximum power point tracking by using TLBO algorithm.
Electronics 08 00567 g012
Figure 13. Output P–V curve of Case 4 photovoltaic module array.
Electronics 08 00567 g013
Figure 14. Case 4 measured results of maximum power point tracking by using TLBO algorithm.
Electronics 08 00567 g014
Figure 15. Measured results of the load power changed from 100 to 300 W and then lowered to 100 W.
Electronics 08 00567 g015
Figure 16. Output P–V curves of the photovoltaic module array being unshaded and shaded.
Electronics 08 00567 g016
Figure 17. Measured results of the battery under energy storage mode and auxiliary power supply mode.
Electronics 08 00567 g017
Figure 18. Waveform of the alternating current (AC) power converted from the DC power.
Electronics 08 00567 g018
Table 1. Specifications of the primary components of the DC/DC boost converter.
ItemsSpecifications
Storage inductor (L)1.8 mH, withstand current = 10 A
Filter capacitor (C)470 μF, withstand voltage = 450 V
Fast diode (D)
IQBD30E60A1
VRRM withstand current = 600 V
IFAV withstand current = 30 A
Power switch
IXGH48N60C3D1
VDSS withstand voltage = 600 V
ID withstand current = 30 A
Table 2. Specifications of the components of high-boost/buck-ratio bidirectional converter.
ItemsSpecifications
Coupled inductor (L1)0.3 mH
Coupled inductor (L2)1.2 mH
Filter capacitor (CL)470 μF, withstand voltage = 450 V
Turns ratio (N)2
Power switch
IXGH48N60C3D1
VDSS withstand voltage = 600 V
ID withstand current = 30 A
Table 3. Parameter values of BP SX-10 [18].
Parameter NameParameter Value
Maximum power Pmax10 W
Warranted power Pwar9 W
Voltage at Pmax16.8 V
Current at Pmax0.59 A
Short circuit current ISC0.65 A
Open circuit voltage VOC21 V
Table 4. Parameter values of teaching learning based optimization algorithm.
Parameter Name Parameter Value
Number of student (n)4
Number of iteration (i)40
Teaching step (ri)Radom number in the range [0, 1]
Teaching factor (TF)1 or 2
Table 5. Output characteristics of the proposed photovoltaic module array under the four partial shading conditions.
CasePartial Shading ConditionPeak Number of
P-V Output Curve
110 panels in 4 parallel string arrays:
[1 panel, 35% shaded + 9 panels, 0% shaded]//
[1 panel, 35% shaded + 9 panels, 0% shaded]//
[1 panel, 35% shaded + 9 panels, 0% shaded]//
[1 panel, 35% shaded + 9 panels, 0% shaded]
Two peaks
210 panels in 4 parallel string arrays:
[1 panel, 30% shaded + 9 panels, 0% shaded]//
[2 panels, 30% shaded + 8 panels, 0% shaded]//
[2 panels, 30% shaded + 8 panels, 0% shaded]//
[2 panels, 30% shaded + 8 panels, 0% shaded]
Three peaks
310 panels in 4 parallel string arrays:
[1 panel, 30% shaded + 9 panels, 0% shaded]//
[2 panels, 30% shaded + 8 panels, 0% shaded]//
[3 panels, 30% shaded + 7 panels, 0% shaded]//
[3 panels, 30% shaded + 7 panels, 0% shaded]
Four peaks
410 panels in 4 parallel string arrays:
No shading →
[1 panel, 20% shaded + 9 panels, 0% shaded]//
[1 panel, 20% shaded + 9 panels, 0% shaded]//
[1 panel, 20% shaded + 9 panels, 0% shaded]//
[1 panel, 20% shaded + 9 panels, 0% shaded]
One peak → two peaks
Note: “+” represents connection in series, “//” indicates connection in parallel, “→” represents the sudden change in the output characteristics of the photovoltaic module array.

