Predictive Energy Control Strategy for Peak Shaving and Shifting Using BESS and PV Generation Applied to the Retail Sector


Abstract
:1. Introduction
2. Methodology
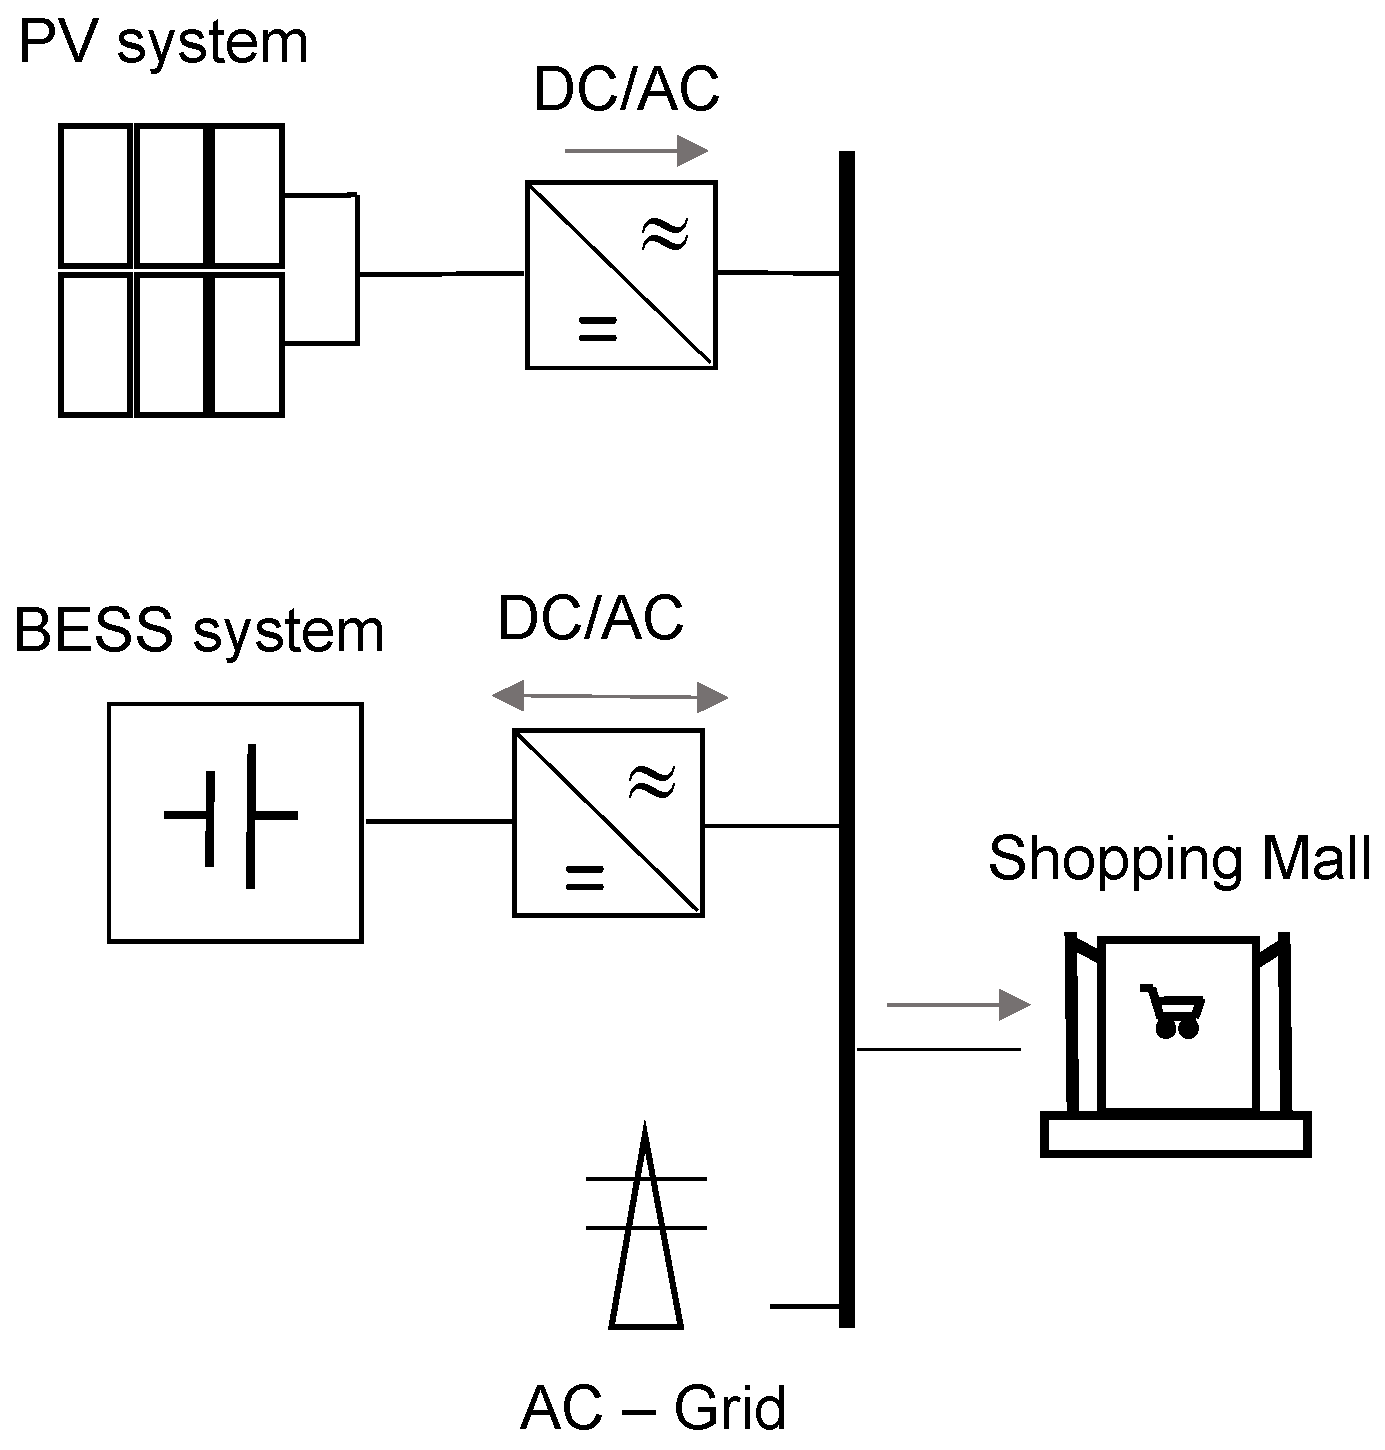
2.1. System Model
2.2. PV Generation Model
- A decomposition model to retrieve the direct normal irradiance (DNI) and the diffuse irradiance (DHI) from the GHI data. In this case, the direct insolation simulation code (DISC) model has been applied [20,21,22]. DISC is very simple model that provides the DNI using only the global horizontal and the extraterrestrial direct normal irradiance [23]. The DHI is then simply computed from the GHI and the estimated DNI.
- A transposition model to retrieve the global irradiance on the plane of array, i.e., the tilted irradiance (GTI). Here, the isotropic model developed by Liu–Jordan is used [24]. This is one of the most common method when only DNI, DHI, and albedo are available.
- Last step is given by a power estimation model to convert the incident irradiance into PV generation. For this purpose, the Sandia array performance model (SAPM) developed in [25] has been chosen. This is one of the most accurate models to estimate the PV power because it takes into account all the main performance losses that affect the PV performance in real operating conditions.
2.3. PV and Electrical Demand Forecasting
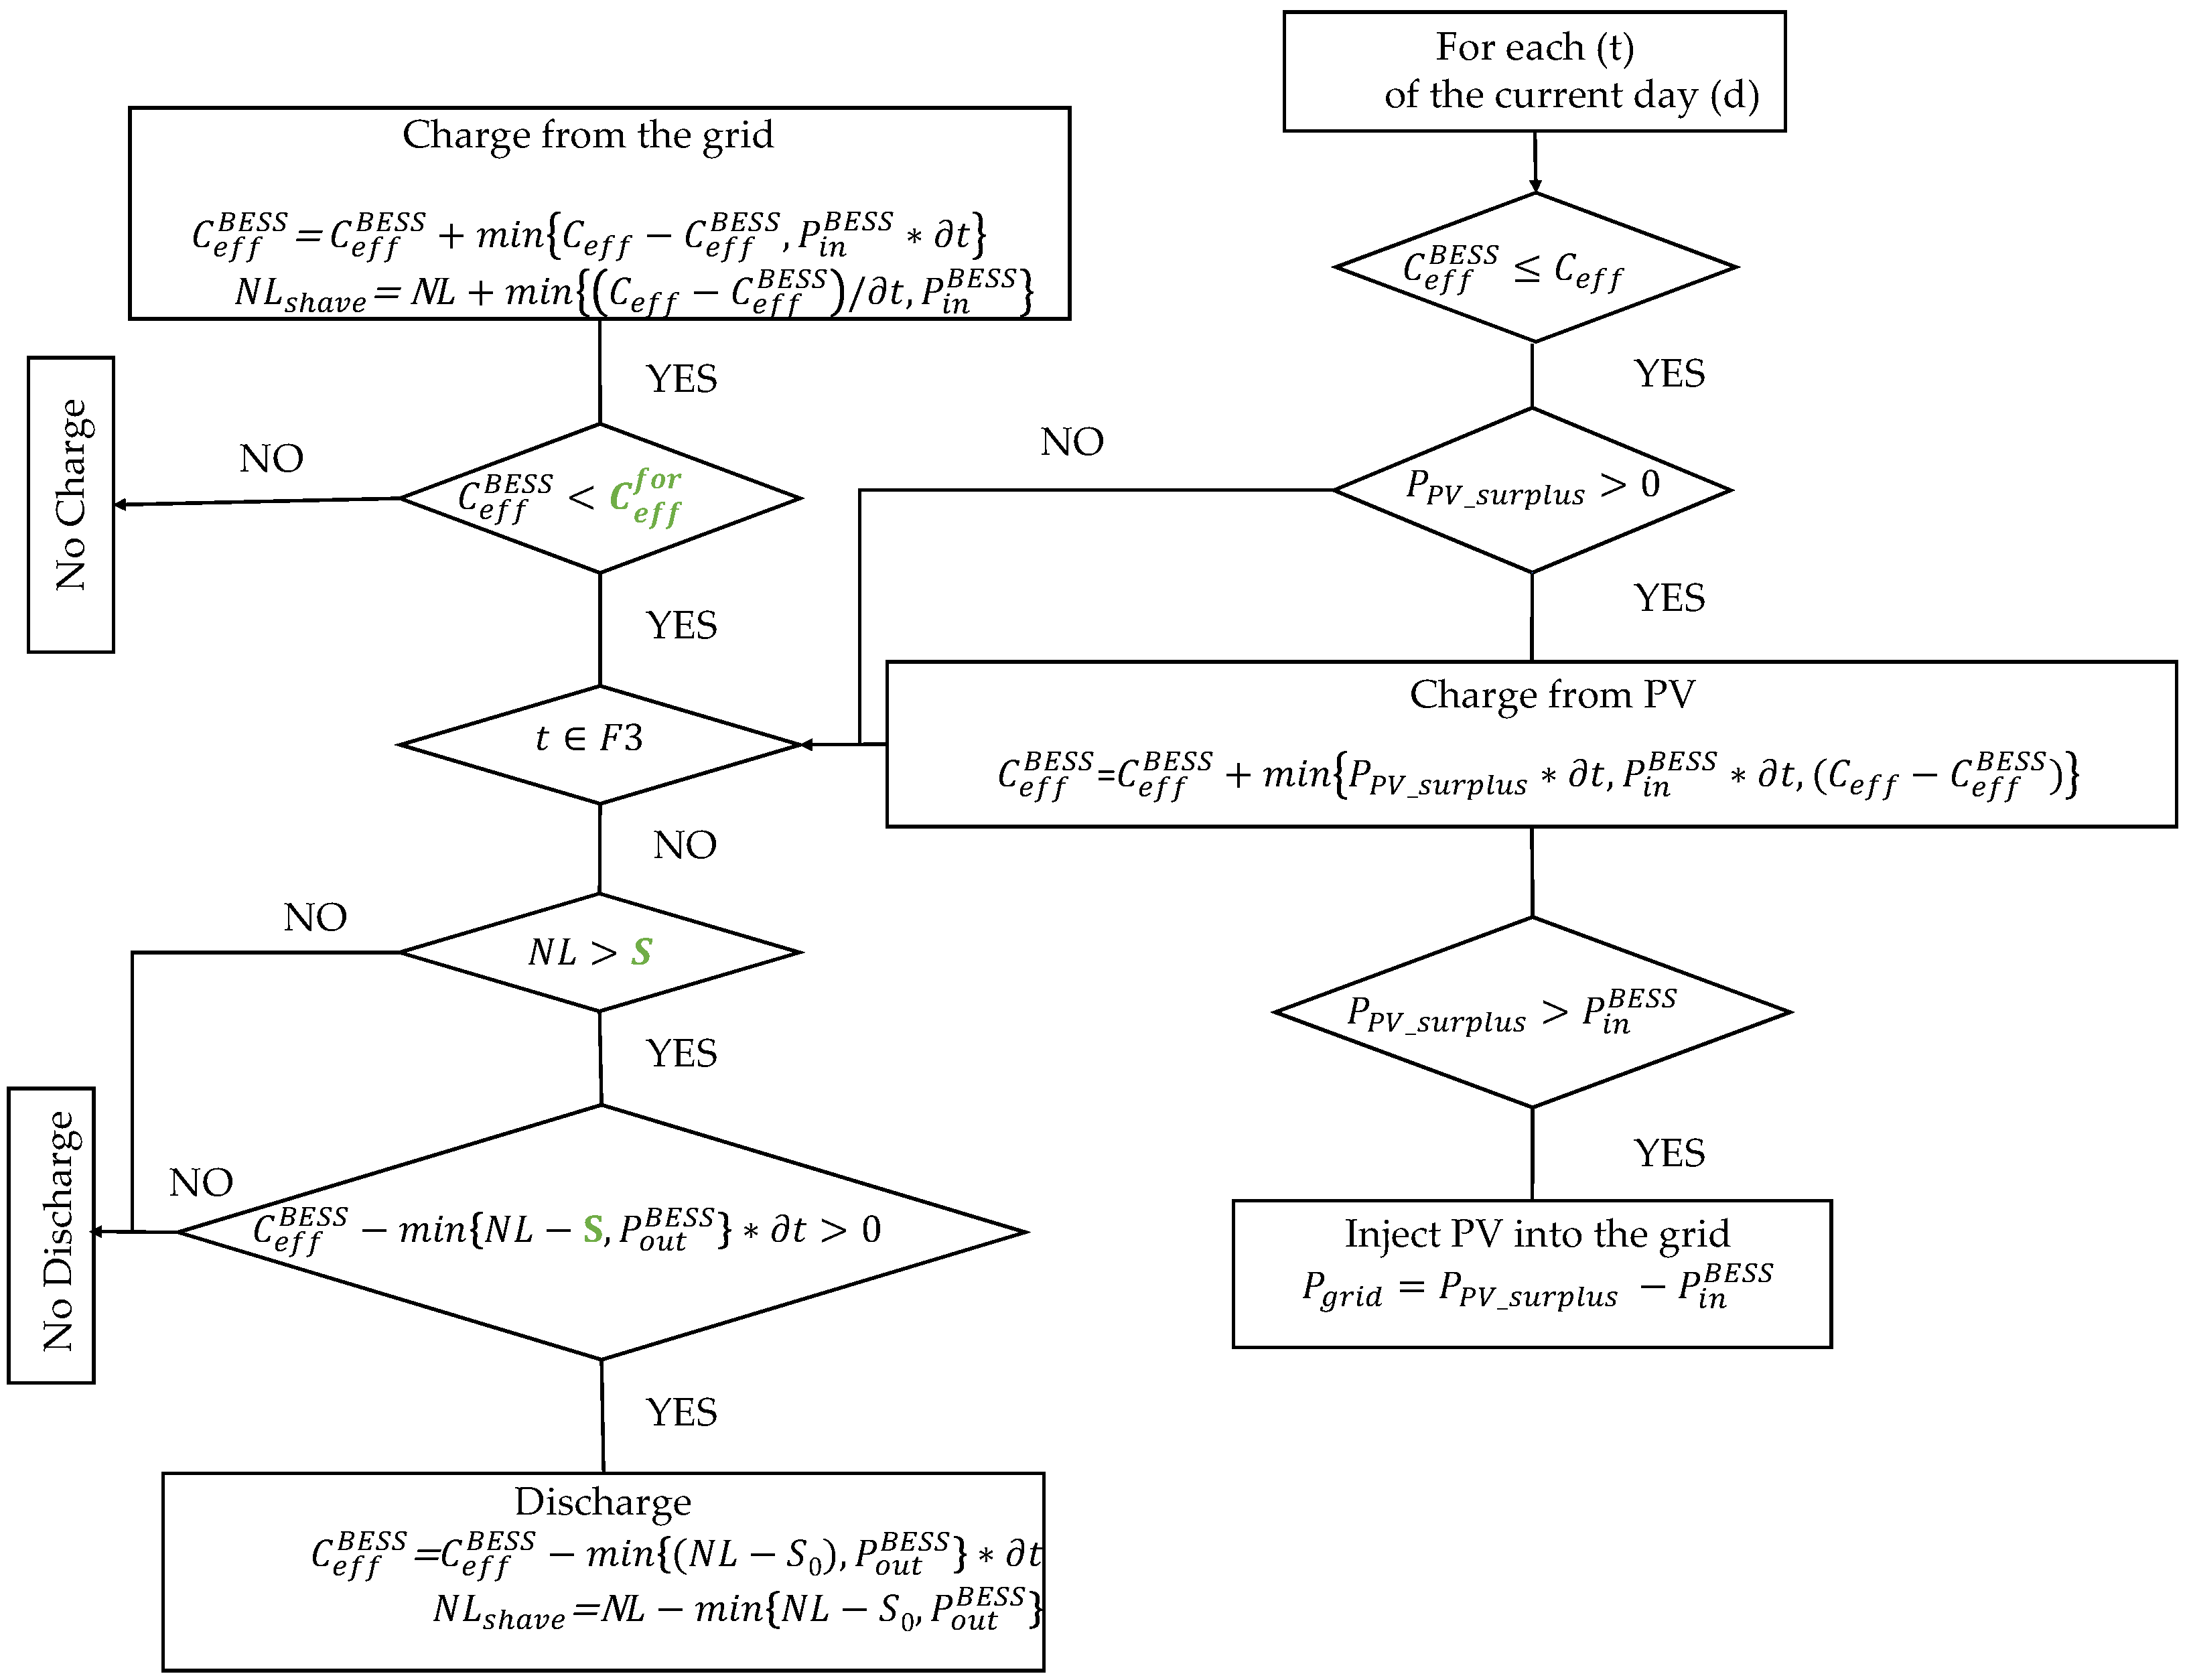
2.4. Predictive Energy Control Strategy
- electrical system characteristics (e.g., maximum and minimum state of charge, maximum and minimum power from/to BESS, converter and battery efficiency);
- accurate availability of PV production and electricity demand forecast;
- dependency between daily hours and cost of the energy drawn from the grid. In particular, currently in Italy there are three time of use tariffs indicated as F1, F2 and F3. The first two tariffs cover the morning and afternoon of working days and are more expensive, while the third one is cheaper, and it is applied for evening and holidays.
3. Simulation Parameters And Metrics
3.1. Consumption and Weather Data
3.2. Key Performance Indicators
4. Results
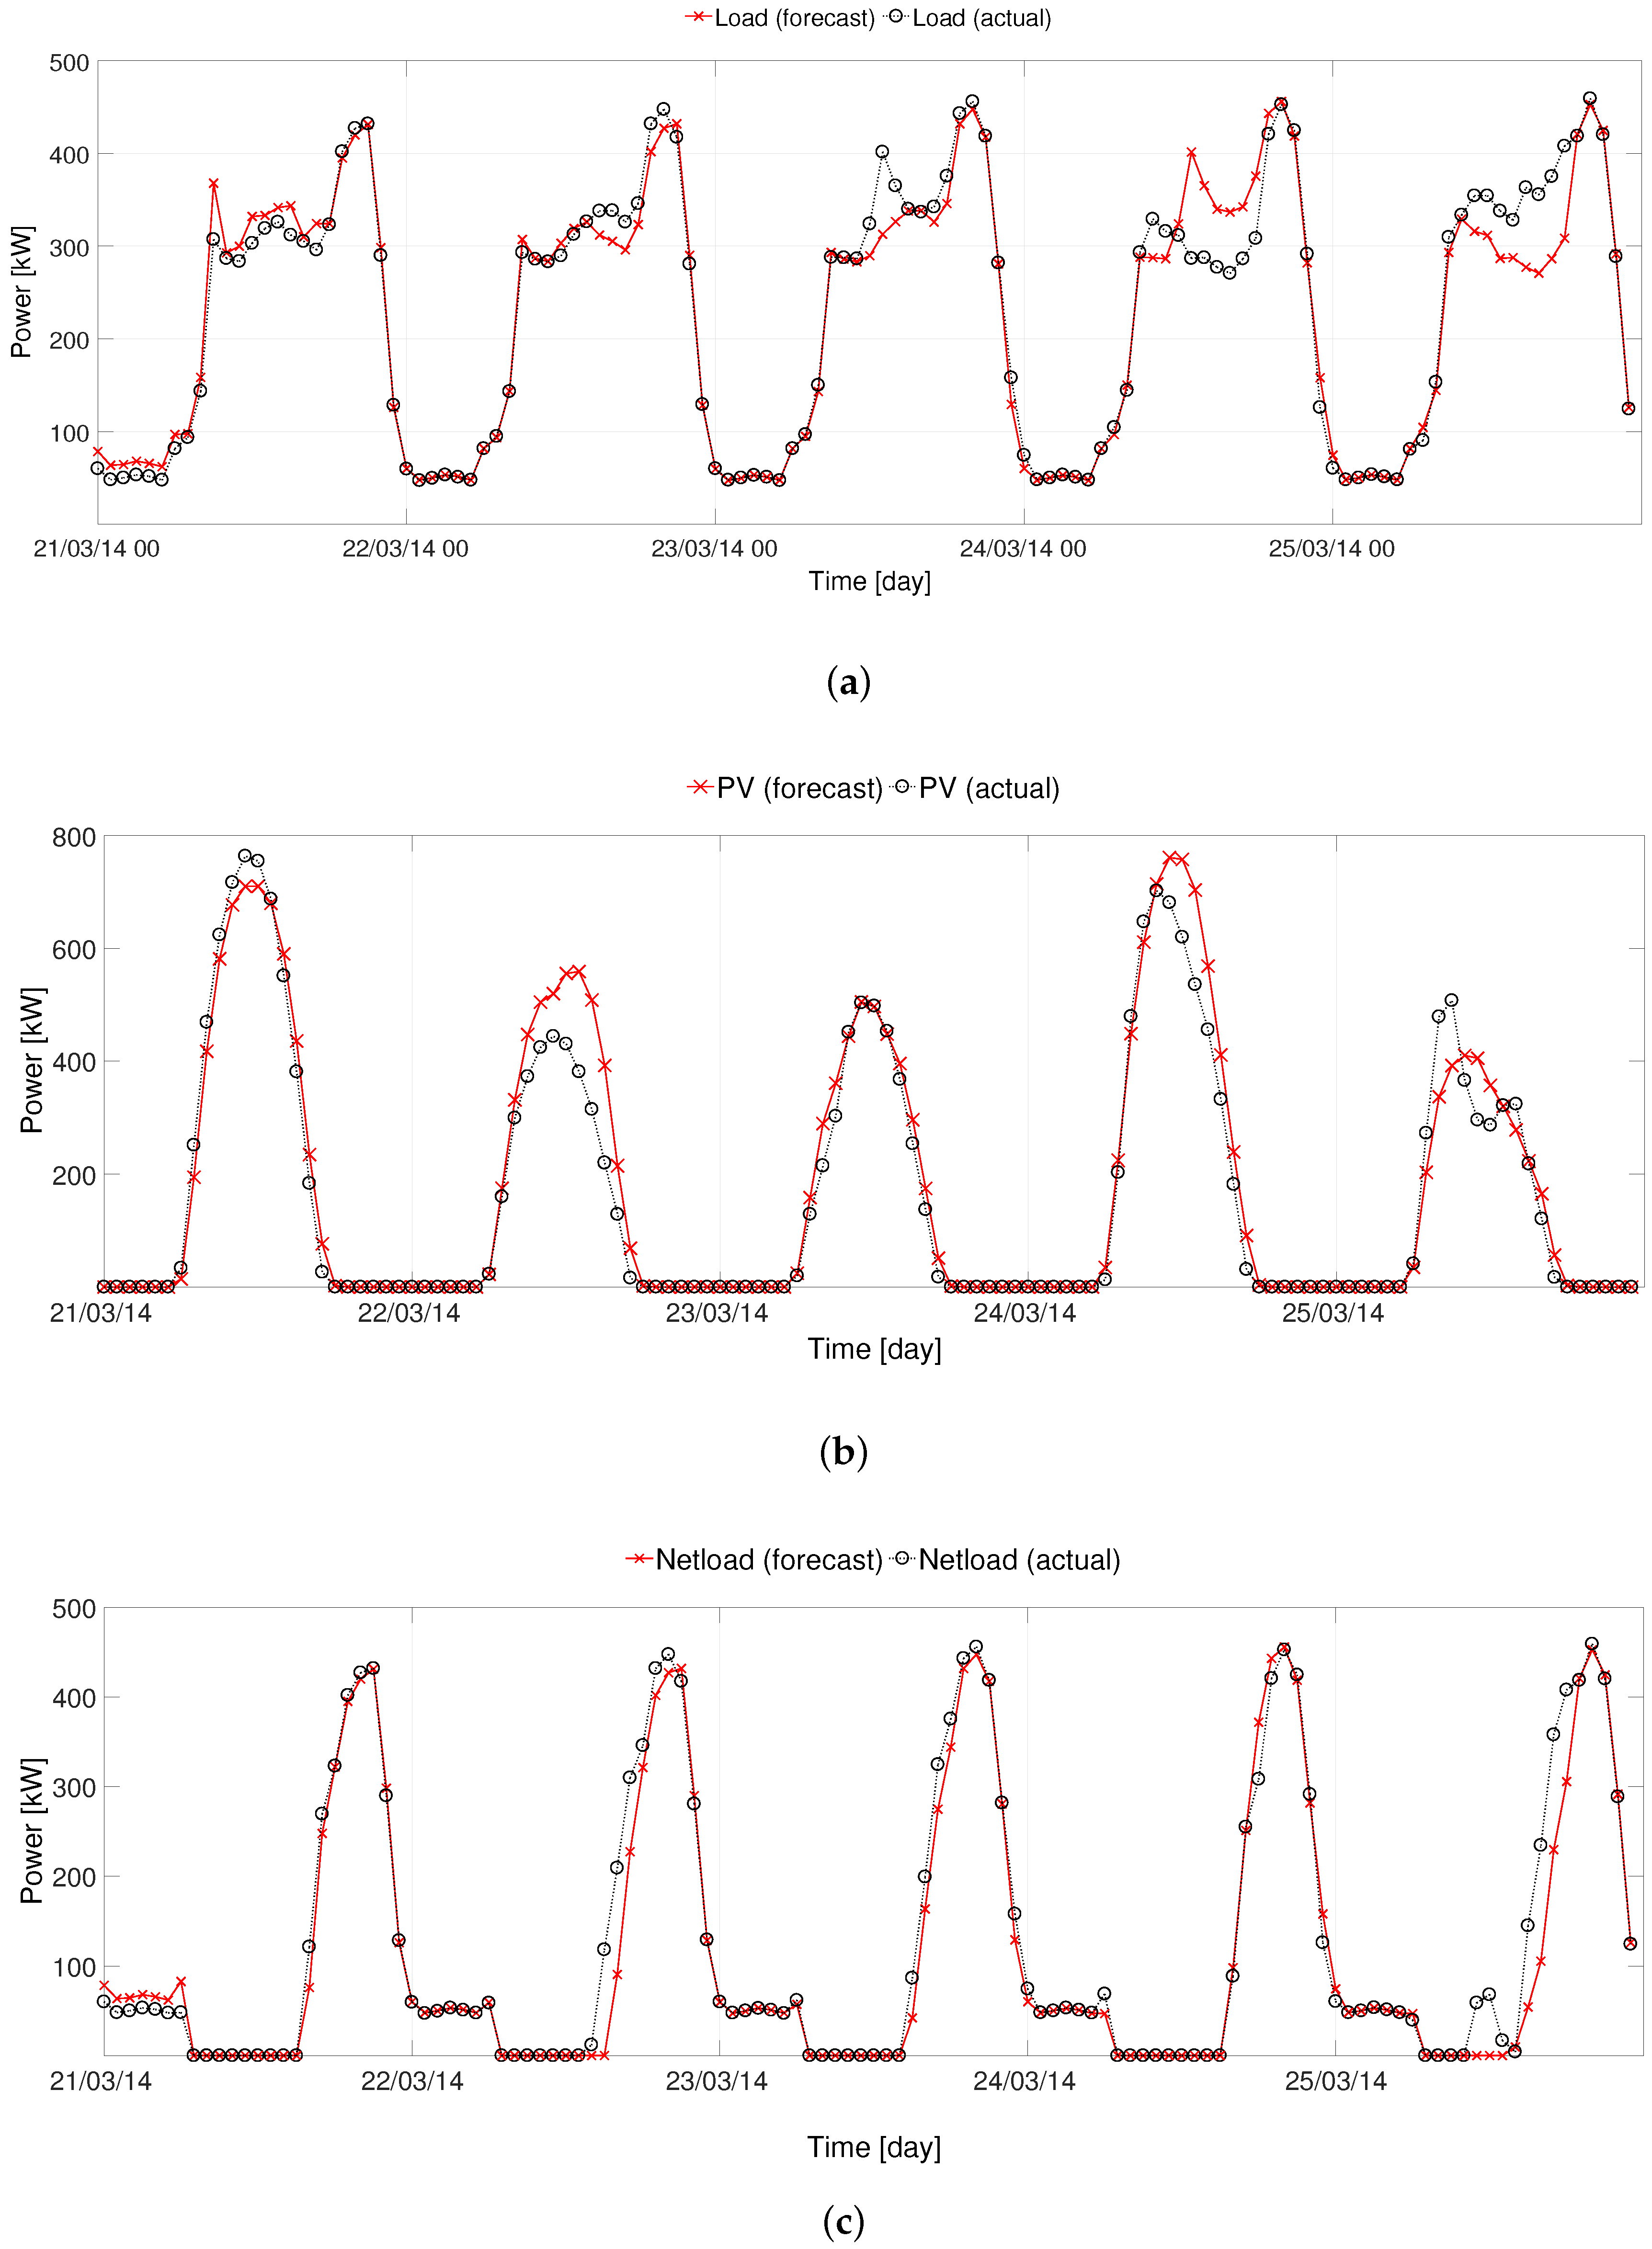
4.1. PV and Electrical Demand Forecasting Accuracy
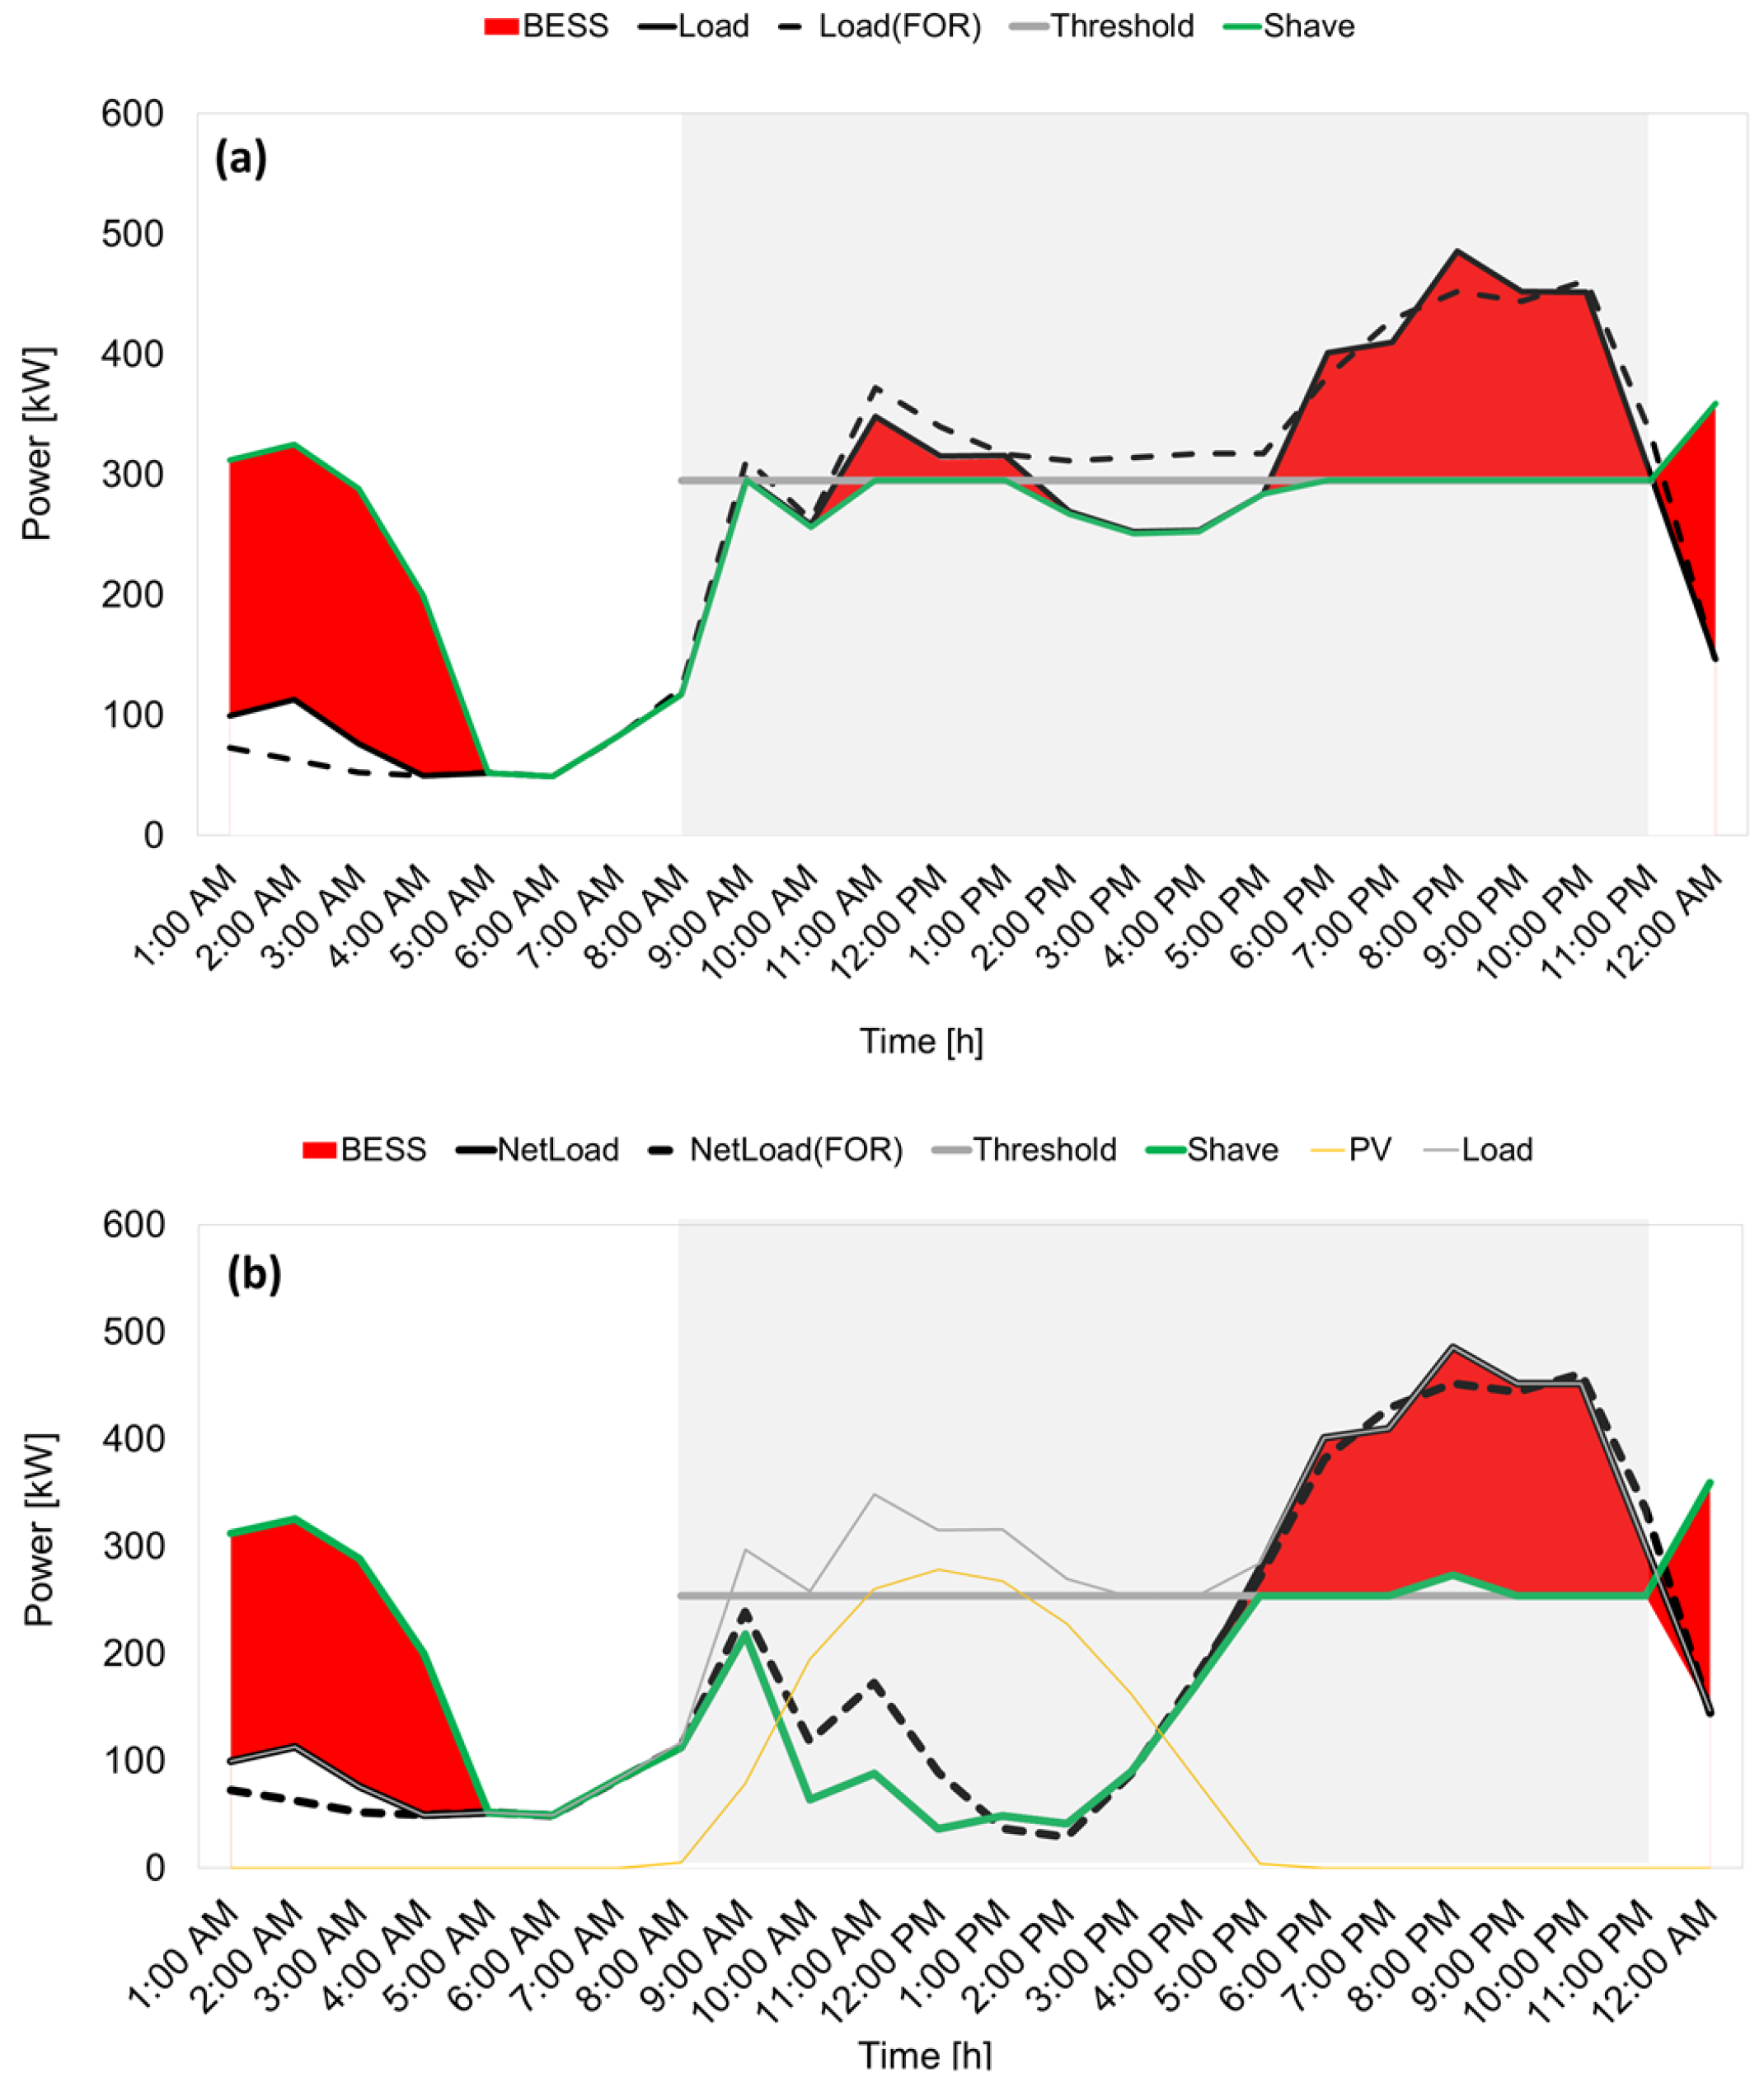
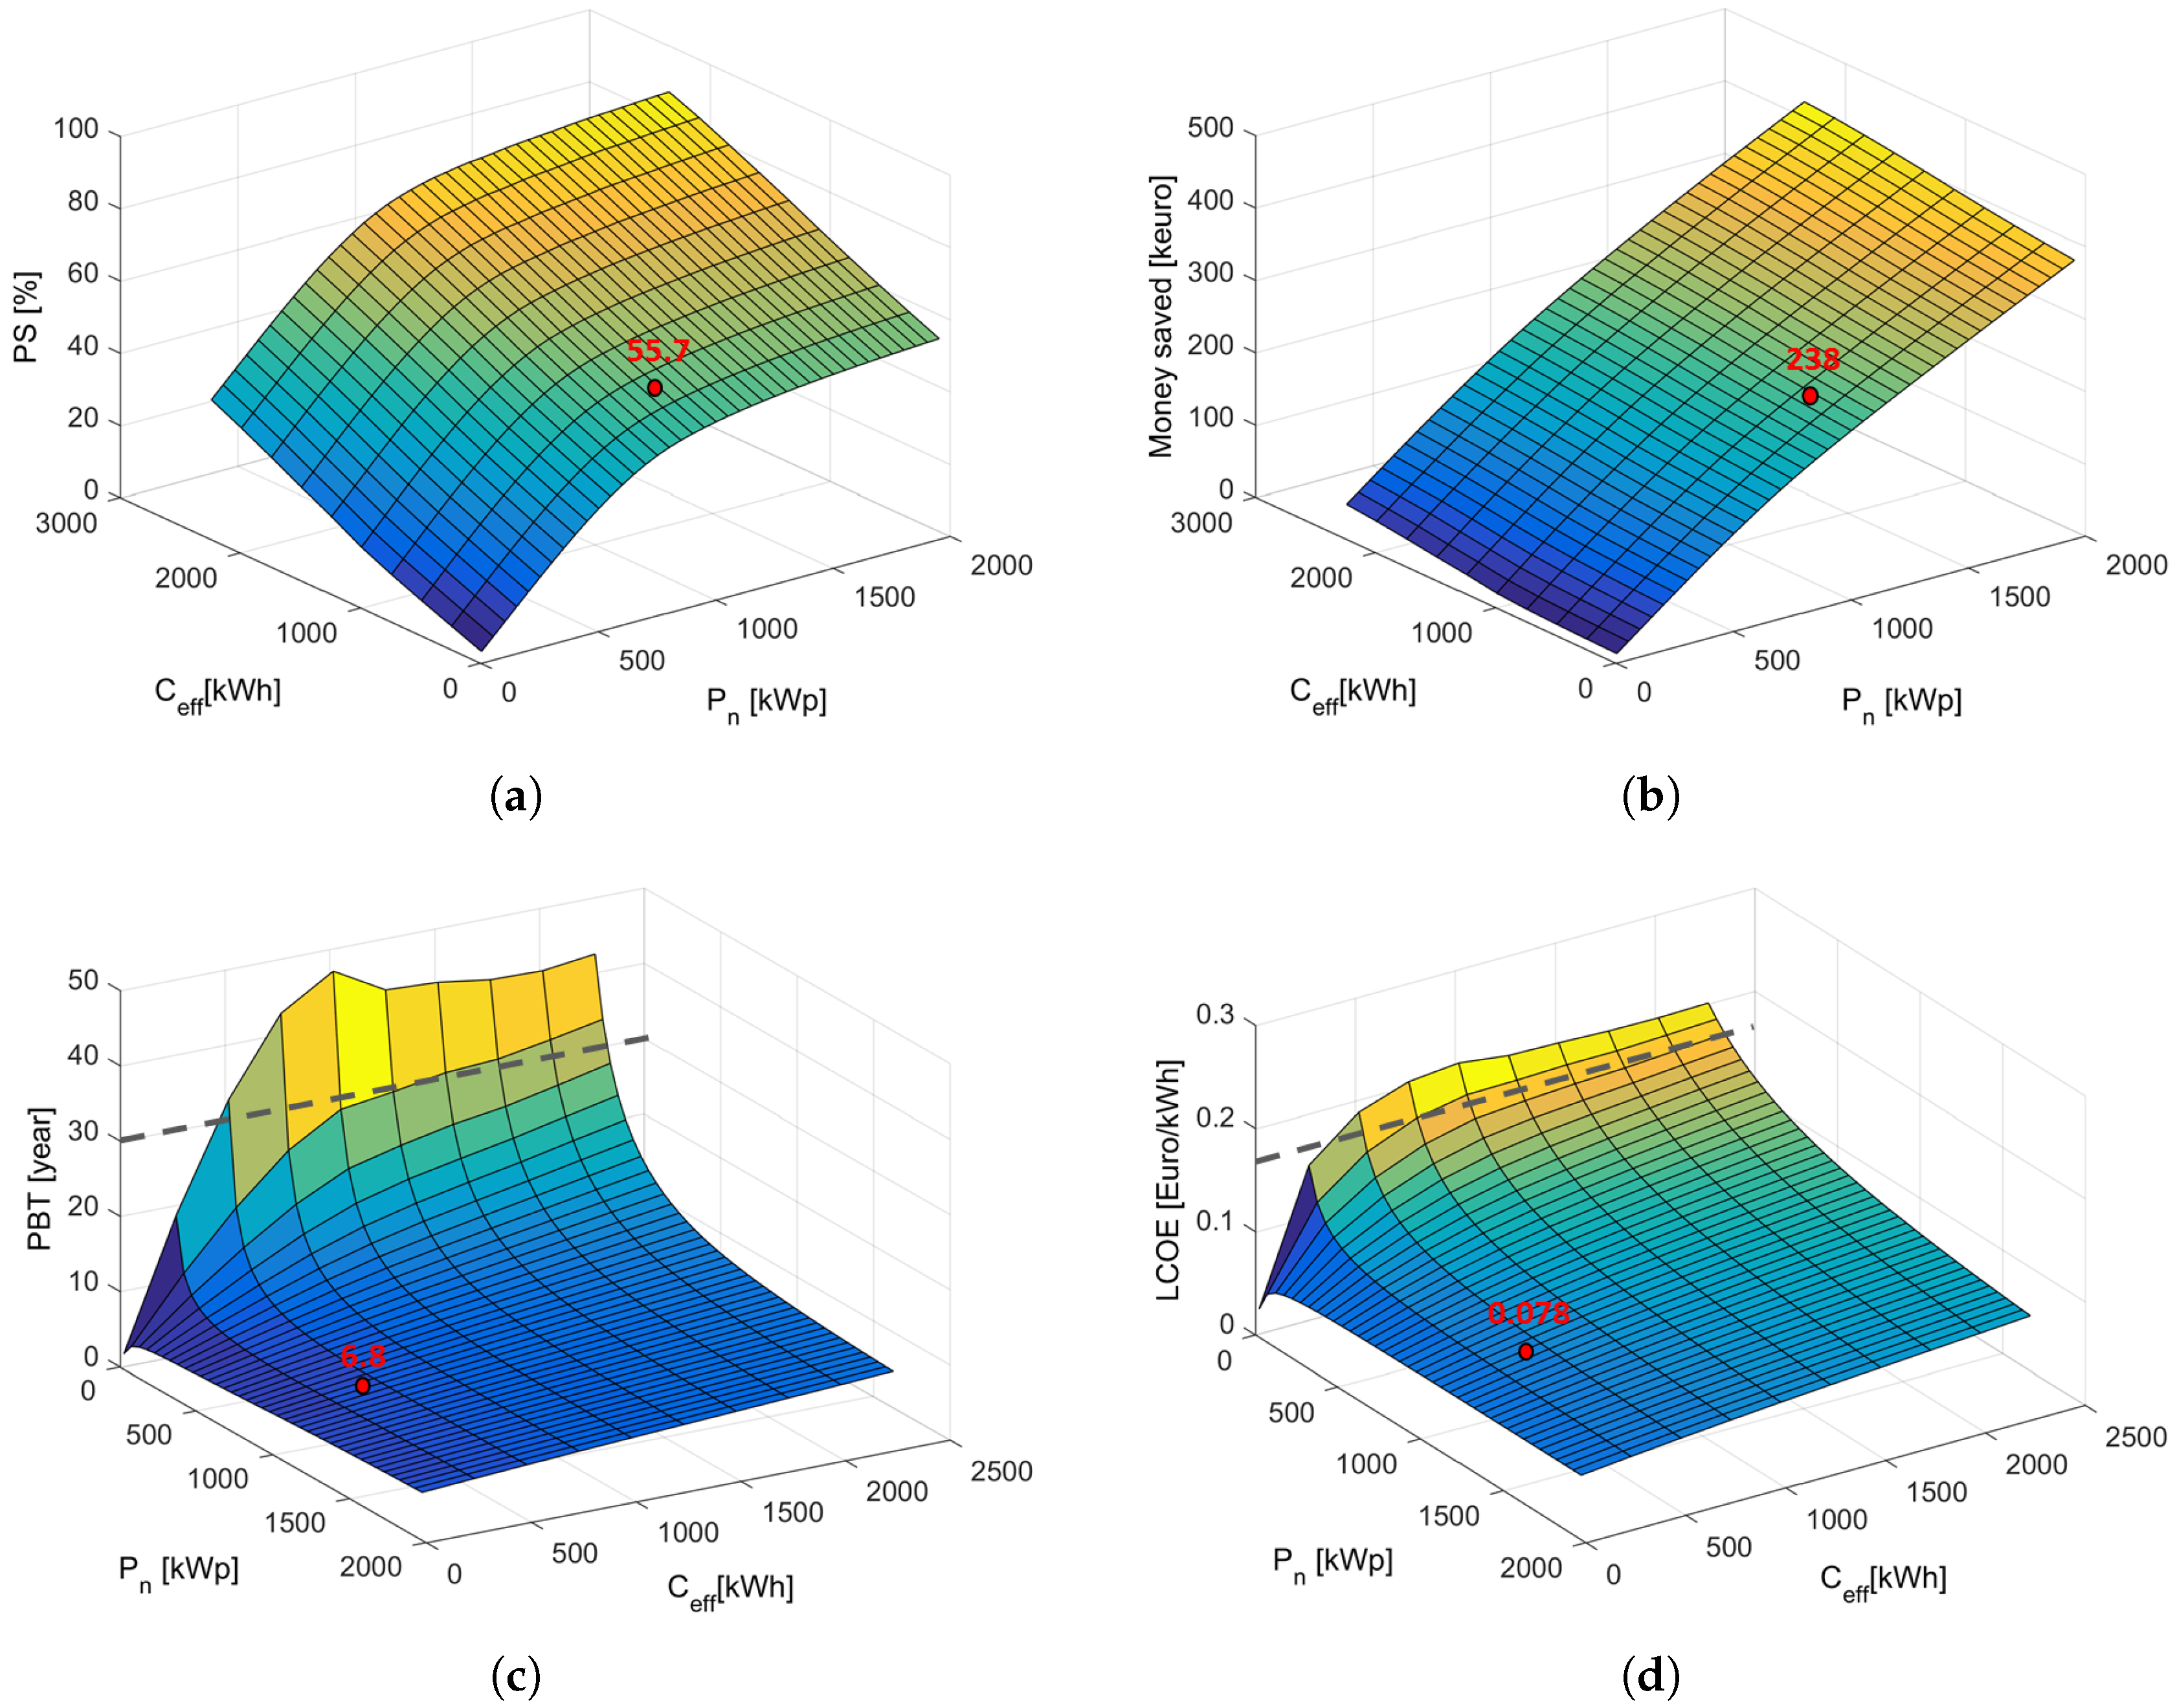
4.2. Parametric Simulation Results
4.3. Comparison of PEC Strategy with a Reference Algorithm
5. Conclusions
Author Contributions
Funding
Acknowledgments
Conflicts of Interest
References
- IEA. Energy Technology Perspective, towards Suistanale Urban Energy System; IEA: Paris, France, 2016. [Google Scholar]
- Merei, G.; Moshövel, J.; Magnor, D.; Sauer, D.U. Optimization of self-consumption and techno-economic analysis of PV-battery systems in commercial applications. Appl. Energy 2016, 168, 171–178. [Google Scholar] [CrossRef]
- González-Briones, A.; De La Prieta, F.; Mohamad, M.S.; Omatu, S.; Corchado, J.M. Multi-Agent Systems Applications in Energy Optimization Problems: A State-of-the-Art Review. Energies 2018, 11, 1928. [Google Scholar] [CrossRef]
- González-Briones, A.; Prieto, J.; De La Prieta, F.; Herrera-Viedma, E.; Corchado, J.M. Energy Optimization Using a Case-Based Reasoning Strategy. Sensors 2018, 18, 865. [Google Scholar] [CrossRef]
- Kim, N.K.; Shim, M.H.; Won, D. Building Energy Management Strategy Using an HVAC System and Energy Storage System. Energies 2018, 11, 2690. [Google Scholar] [CrossRef]
- Hassan, A.S.; Cipcigan, L.; Jenkins, N. Optimal battery storage operation for PV systems with tariff incentives. Appl. Energy 2017, 203, 422–441. [Google Scholar] [CrossRef]
- Barchi, G.; Moser, D.; Lollini, R. 2.7-Renewable Malls: Transforming Shopping Centres Into Flexible, Decarbonized Urban Energy Assets. In Urban Energy Transition, 2nd ed.; Droege, P., Ed.; Elsevier: Amsterdam, The Netherlands, 2018; pp. 293–311. [Google Scholar]
- Luthander, R.; Widén, J.; Nilsson, D.; Palm, J. Photovoltaic self-consumption in buildings: A review. Appl. Energy 2015, 142, 80–94. [Google Scholar] [CrossRef]
- Lovati, M.; Salvalai, G.; Fratus, G.; Maturi, L.; Albatici, R.; Moser, D. New method for the early design of BIPV with electric storage: A case study in northern Italy. Sustain. Cities Soc. 2018. [Google Scholar] [CrossRef]
- Leadbetter, J.; Swan, L. Battery storage system for residential electricity peak demand shaving. Energy Build. 2012, 55, 685–692. [Google Scholar] [CrossRef]
- Aslam, S.; Iqbal, Z.; Javaid, N.; Khan, Z.A.; Aurangzeb, K.; Haider, S.I. Towards Efficient Energy Management of Smart Buildings Exploiting Heuristic Optimization with Real Time and Critical Peak Pricing Schemes. Energies 2017, 10, 2065. [Google Scholar] [CrossRef]
- Chua, K.H.; Lim, Y.S.; Morris, S. Peak reduction for commercial buildings using energy storage. IOP Conf. Ser. Earth Environ. Sci. 2017, 93, 012008. [Google Scholar] [CrossRef]
- Hanna, R.; Kleissl, J.; Nottrott, A.; Ferry, M. Energy dispatch schedule optimization for demand charge reduction using a photovoltaic-battery storage system with solar forecasting. Sol. Energy 2014, 103, 269–287. [Google Scholar] [CrossRef]
- Samarawickrama, N.G.I.S.; Hemapala, K.T.M.U.; Jayasekara, A.G.B.P. Support Vector Machine Regression for forecasting electricity demand for large commercial buildings by using kernel parameter and storage effect. In Proceedings of the 2016 Moratuwa Engineering Research Conference (MERCon), Moratuwa, Sri Lanka, 5–6 April 2016; pp. 162–167. [Google Scholar] [CrossRef]
- Ahmad, A.; Hassan, M.; Abdullah, M.; Rahman, H.; Hussin, F.; Abdullah, H.; Saidur, R. A review on applications of ANN and SVM for building electrical energy consumption forecasting. Renew. Sustain. Energy Rev. 2014, 33, 102–109. [Google Scholar] [CrossRef]
- Lazos, D.; Sproul, A.B.; Kay, M. Optimisation of energy management in commercial buildings with weather forecasting inputs: A review. Renew. Sustain. Energy Rev. 2014, 39, 587–603. [Google Scholar] [CrossRef]
- Litjens, G.; Worrell, E.; van Sark, W. Assessment of forecasting methods on performance of photovoltaic-battery systems. Appl. Energy 2018, 221, 358–373. [Google Scholar] [CrossRef]
- CommONEnergy Project, Funded under the EU FP7 Program. Available online: http://www.commonenergyproject.eu/ (accessed on 1 March 2019).
- Pierro, M.; Bucci, F.; Felice, M.D.; Maggioni, E.; Perotto, A.; Spada, F.; Moser, D.; Cornaro, C. Deterministic and Stochastic Approaches for Day-Ahead Solar Power Forecasting. ASME J. Sol. Energy Eng. 2016, 139, 021010. [Google Scholar] [CrossRef]
- Ineichen, P.; Perez, R.R.; Seal, R.D.; Maxwell, E.L.; Zalenka, A. Dynamic global-to-direct irradiance conversion models. ASHRAE Trans. 1992, 98, 354–369. [Google Scholar]
- Perez, R.; Seals, R.; Zelenka, A.; Ineichen, P. Climatic evaluation of models that predict hourly direct irradiance from hourly global irradiance: Prospects for performance improvements. Sol. Energy 1990, 44, 99–108. [Google Scholar] [CrossRef]
- Marion, B. A model for deriving the direct normal and diffuse horizontal irradiance from the global tilted irradiance. Sol. Energy 2015, 122, 1037–1046. [Google Scholar] [CrossRef]
- Maxwell, E.L. A Quasi-Physical Model for Converting Hourly Global Horizontal to Direct Normal Insolation, 1987.
- Liu, B.; Jordan, R. Daily insolation on surfaces tilted towards equator. ASHRAE J. 1961, 10, 526–541. [Google Scholar]
- King, D.L.; Kratochvil, J.A.; Boyson, W.E. Photovoltaic Array Performance Model; Technical report; Sandia National Laboratories: Albuquerque, NM, USA, 2004. [Google Scholar]
- JRC Photovoltaic Geographical Information System (PVGIS)—European Commission. Available online: http://re.jrc.ec.europa.eu/pvg_tools/en/tools.html (accessed on 1 March 2019).
- Skamarock, W.C.; Klemp, J.B.; Dudhia, J.; Gill, D.O.; Barker, M.; Duda, K.G.; Huang, X.Y.; Wang, W.; Powers, J.G. A Description of the Advanced Research WRF Version 3; Technical report; National Center for Atmospheric Research: Boulder, CO, USA, 2008. [Google Scholar]
- Barchi, G.; Lollini, R.; Moser, D. Photovoltaic and battery energy storage systems in shopping malls: Energy and cost analysis of an Italian case study. In Proceedings of the 2016 European PV Solar Energy Conference and Exhibition (EUPVSEC), Munich, Germany, 20–24 June 2016. [Google Scholar]
- Zakeri, B.; Syri, S. Electrical energy storage systems: A comparative life cycle cost analysis. Renew. Sustain. Energy Rev. 2015, 42, 569–596. [Google Scholar] [CrossRef]
- Vartiainen, E.; Masson, G.; Breyer, C.; Moser, D. Improving Competitiveness of Solar PV with Electricity Storage. In Proceedings of the 33rd European Photovoltaic Solar Energy Conference and Exhibition, Amsterdam, The Netherlands, 25–29 September 2017; pp. 2783–2789. [Google Scholar] [CrossRef]
- Vartiainen, E.; Masson, G.B.C. The True Competitivness fo Solar PV: A European Case Study. Technical report, ETIP-PV. Available online: https://etip-pv.eu/publications/etip-pv-publications/ (accessed on 1 March 2019).
- Perez, R.; Burtis, L.; Hoff, T.; Swanson, S.; Herig, C. Quantifying residential PV economics in the US––Payback vs. cash flow determination of fair energy value. Sol. Energy 2004, 77, 363–366. [Google Scholar] [CrossRef]
- Mercato Elettrico Nazionale—“Prezzo Unico Nazionale”. Available online: http://www.mercatoelettrico.org/It/ (accessed on 1 March 2019).


| Name | Value | Reference |
|---|---|---|
| Cost electricity—F1 | 0.168 €/kWh | [33] |
| Cost electricity—F2 | 0.166 €/kWh | [33] |
| Cost electricity—F3 | 0.125 €/kWh | [33] |
| Net-billing | 0.100 €/kWh | - |
| Surplus | 0.05 €/kWh | - |
| Photovoltaic (PV) system | 1200 €/kWp | [31] |
| Battery energy storage systems (BESS) | 570 €/kWh | [29] |
| 19 €/kWp | [31] | |
| 4.63 €/kWp | [29] |
| Corr. | Mean [kWh] | RMSE [kWh] | |
|---|---|---|---|
| Load | 0.98 | 284.54 | 39.61 |
| PV | 0.92 | 363.98 | 90.13 |
| NetLoad | 0.96 | 218.52 | 51.69 |
| Energy Fee | Load [MWh/year] | Shave Load [MWh/year] | Energy Shaved [MWh/year] | Saving [k/year] |
|---|---|---|---|---|
| F1 | 1552 | 459 | −1093 (−70%) | 183.6 |
| F2 | 691 | 535 | −156 (−23%) | 25.8 |
| F3 | 216 | 242 | 26 (12%) | −3.25 |
| Surplus | 0 | 0 | −317 | 31.7 |
| Total | 2459 | 1236 | −1540 | 237.85 |
| Parameters | Values |
|---|---|
| CAPEX BESS: | 430 k€ |
| CAPEX PV: | 1200 k€ |
| Investment: | 1630 k€ |
| Pay-back time (PBT): | 6.8 years |
| Replacement cost: | 22.3 €k/year |
| OPEX BESS: | 3.5 €k/year |
| OPEX PV: | 19 €k/year |
| Levelized cost of energy (LCOE): | 79.2 €/MWh |
© 2019 by the authors. Licensee MDPI, Basel, Switzerland. This article is an open access article distributed under the terms and conditions of the Creative Commons Attribution (CC BY) license (http://creativecommons.org/licenses/by/4.0/).
Share and Cite
Barchi, G.; Pierro, M.; Moser, D. Predictive Energy Control Strategy for Peak Shaving and Shifting Using BESS and PV Generation Applied to the Retail Sector. Electronics 2019, 8, 526. https://doi.org/10.3390/electronics8050526
Barchi G, Pierro M, Moser D. Predictive Energy Control Strategy for Peak Shaving and Shifting Using BESS and PV Generation Applied to the Retail Sector. Electronics. 2019; 8(5):526. https://doi.org/10.3390/electronics8050526
Chicago/Turabian StyleBarchi, Grazia, Marco Pierro, and David Moser. 2019. "Predictive Energy Control Strategy for Peak Shaving and Shifting Using BESS and PV Generation Applied to the Retail Sector" Electronics 8, no. 5: 526. https://doi.org/10.3390/electronics8050526
APA StyleBarchi, G., Pierro, M., & Moser, D. (2019). Predictive Energy Control Strategy for Peak Shaving and Shifting Using BESS and PV Generation Applied to the Retail Sector. Electronics, 8(5), 526. https://doi.org/10.3390/electronics8050526