Automatic Scene Recognition through Acoustic Classification for Behavioral Robotics

 , , , ,
Abstract
:1. Introduction
- An extended feature descriptor is proposed which takes advantage of modified 1-D LTP in combination with MFCC.
- A feature fusion methodology is opted, which exploits the complementary strengths of both MFCC and modified 1-D features to generate a serial vector.
- To provide a better insight, a set of classifiers are tested on two standard benchmark datasets. This action supports researchers in selecting the best classifiers for this application.
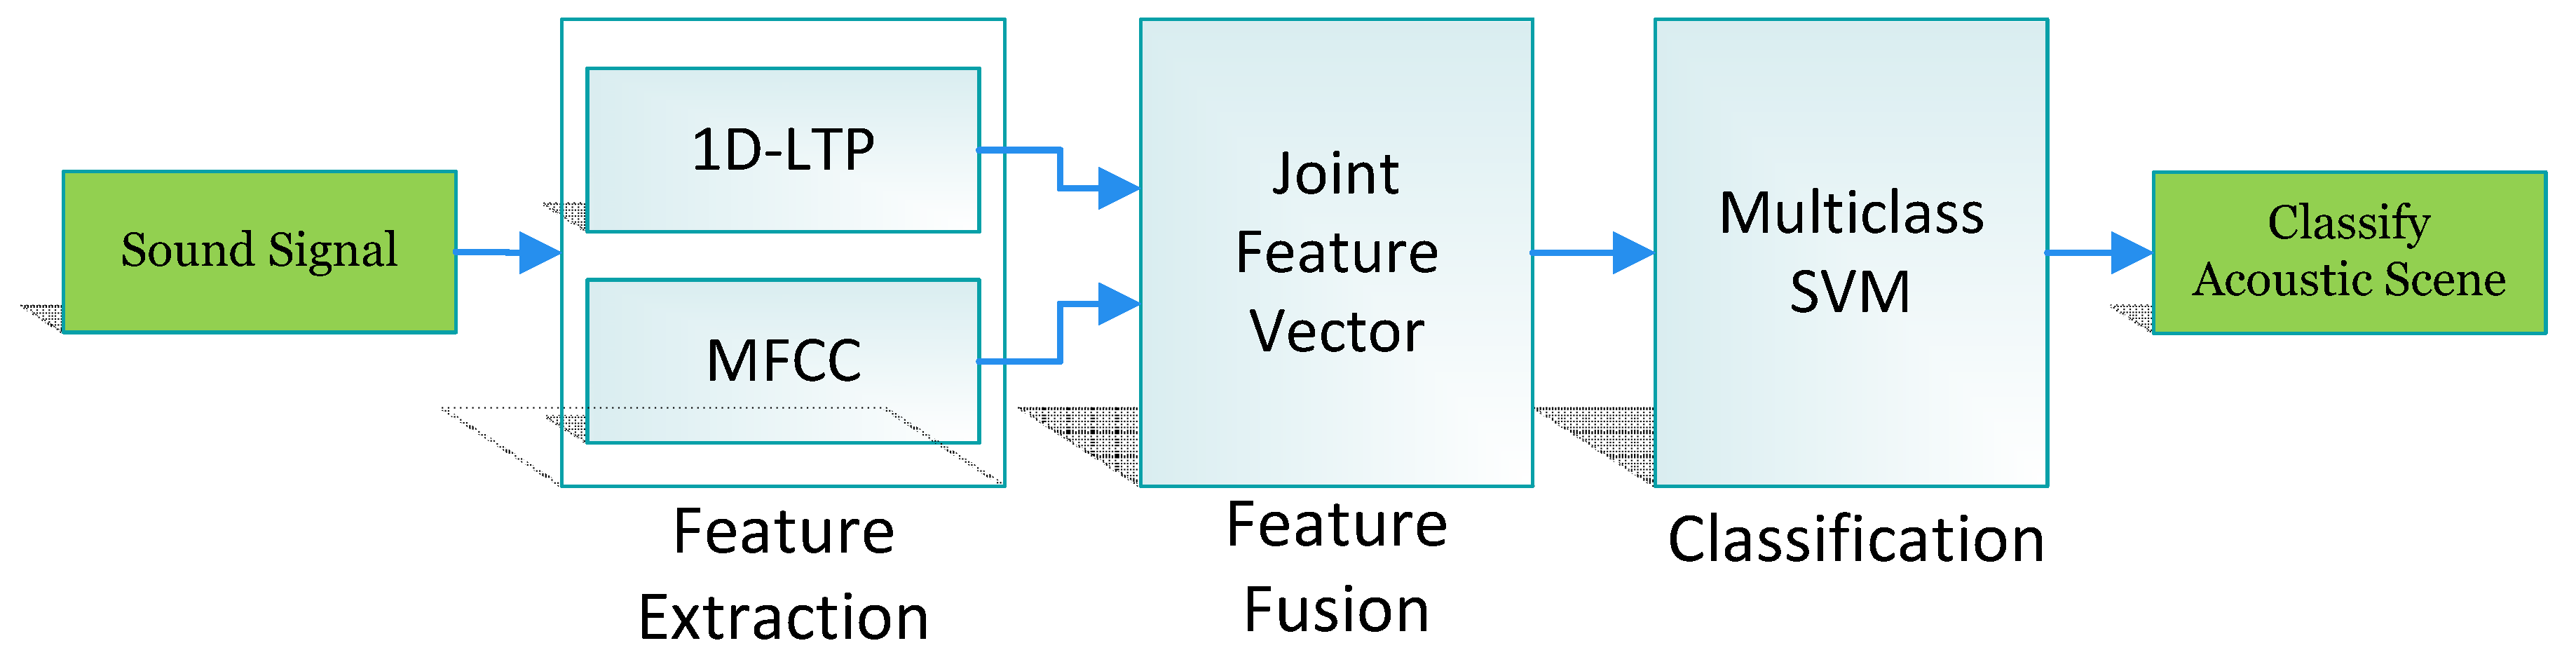
2. Proposed Method
2.1. System Overview
2.2. Feature Extraction
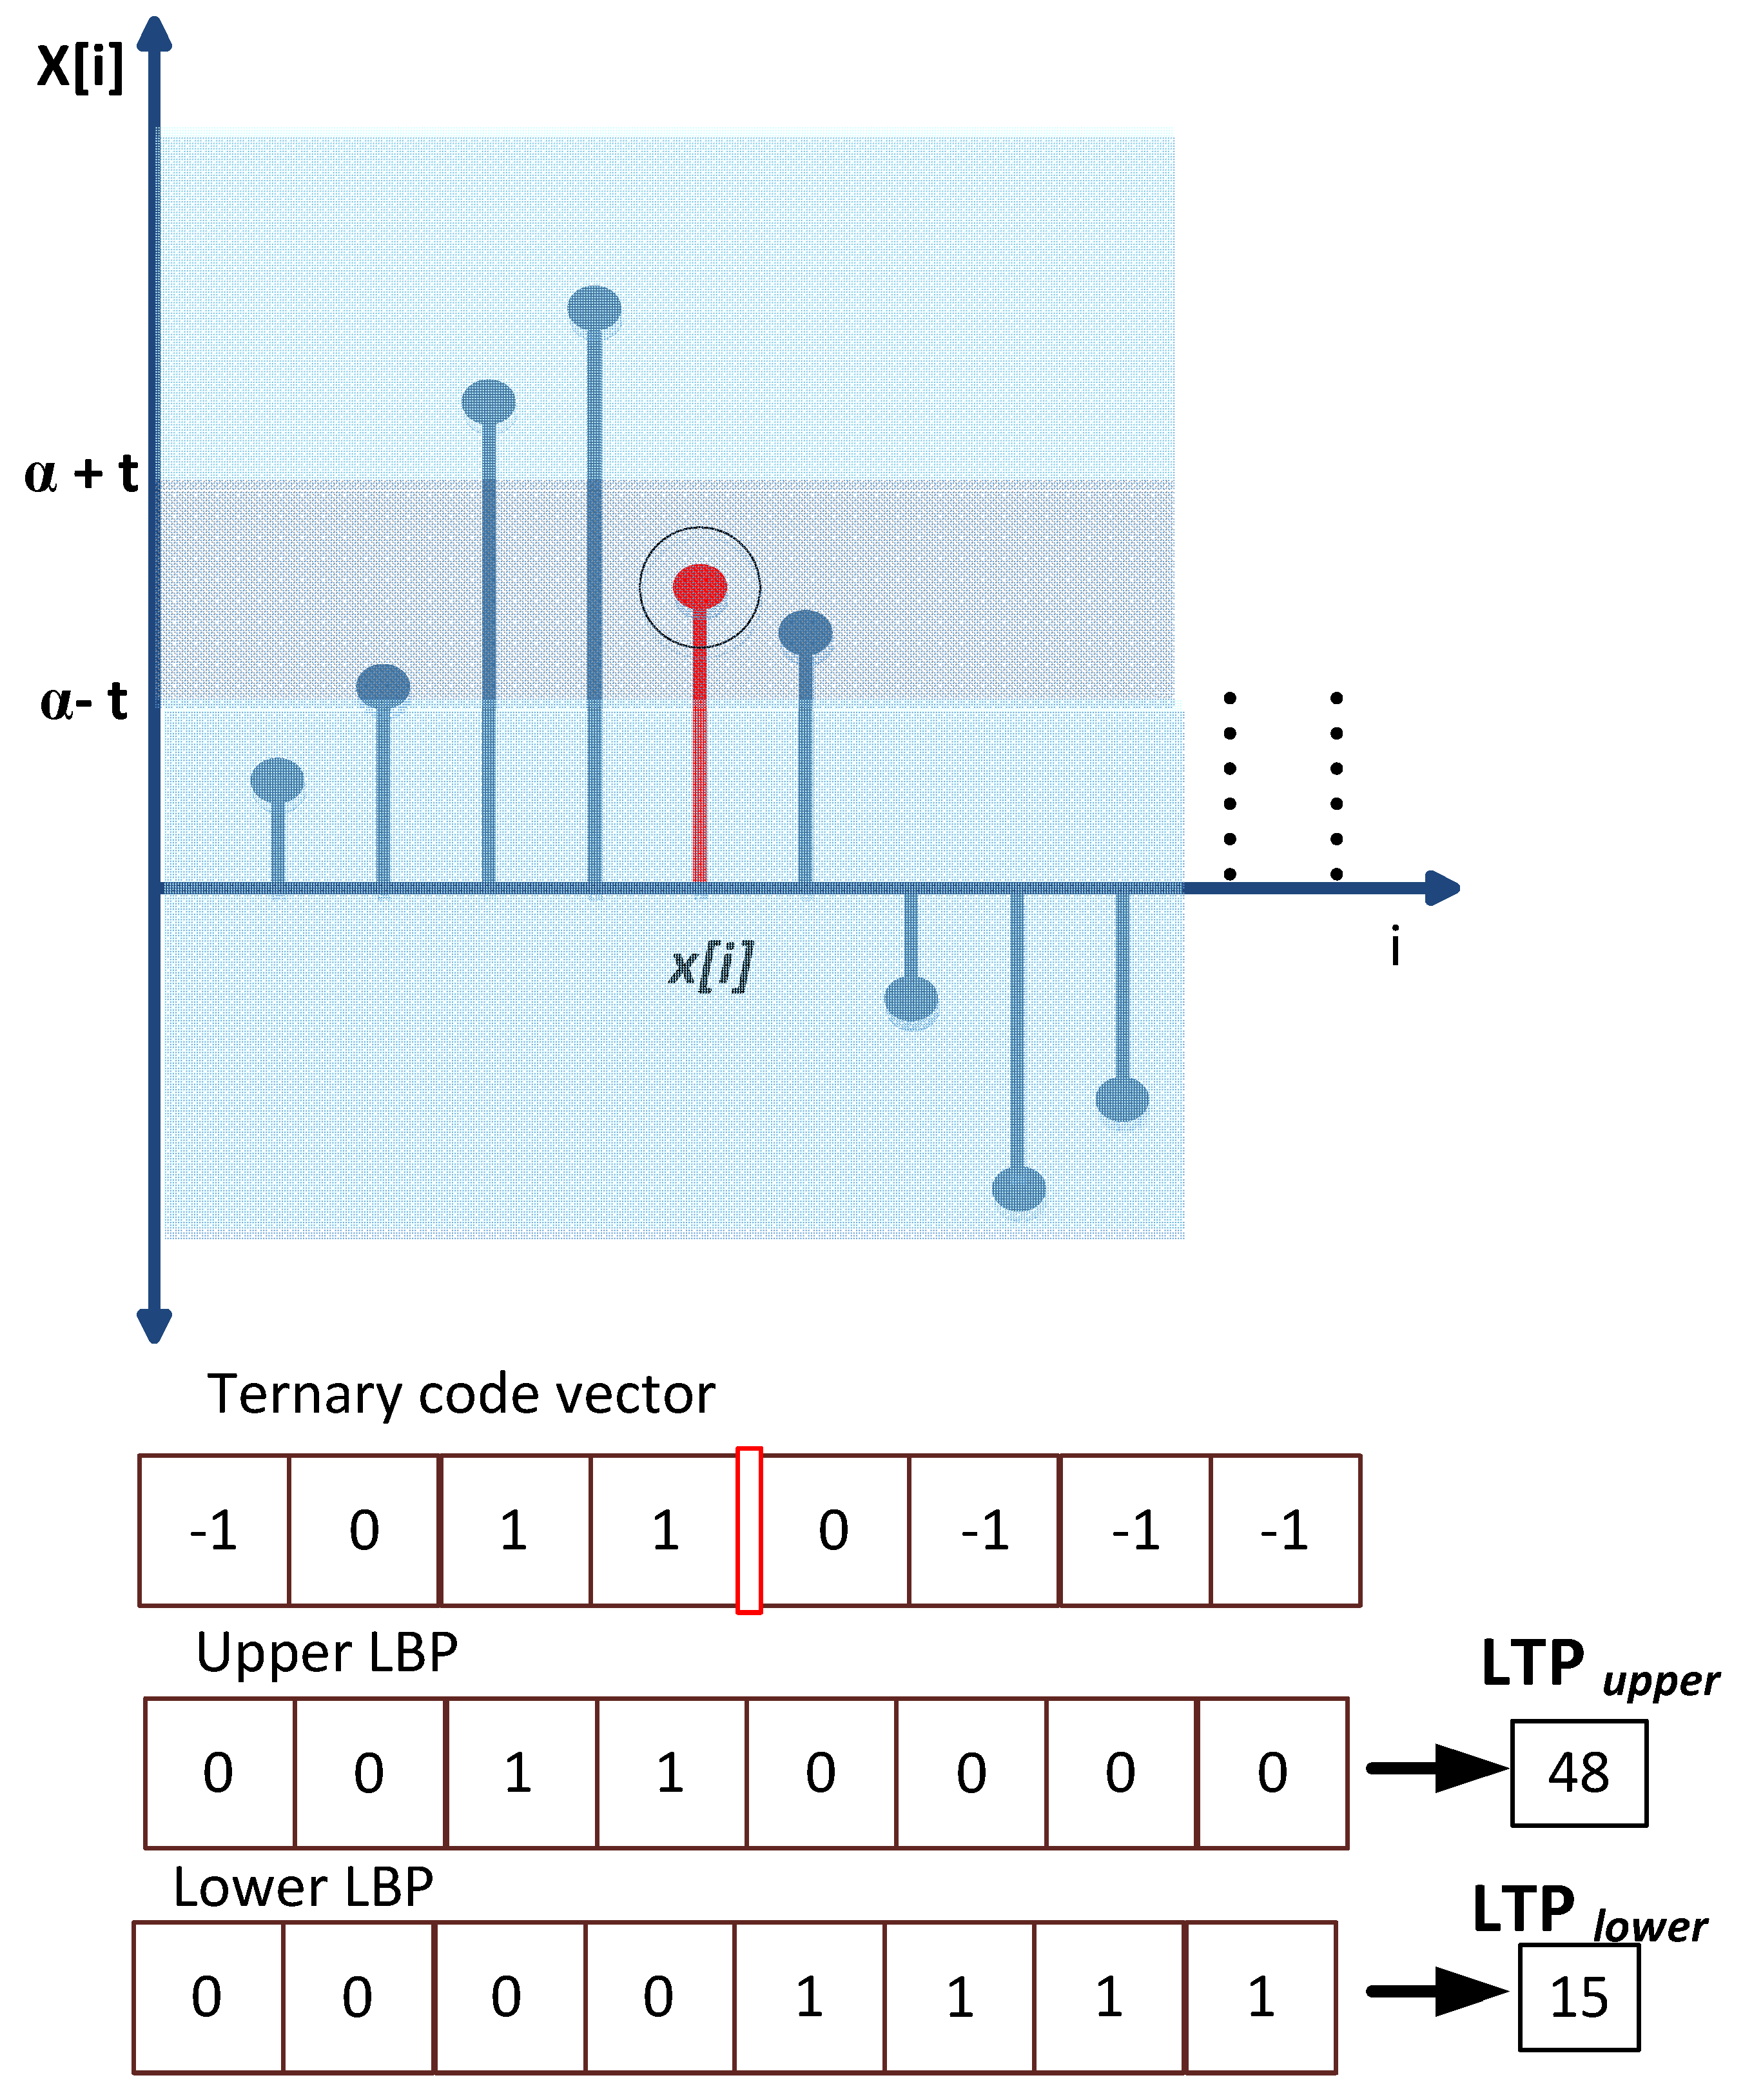
2.2.1. 1-D Local Ternary Patterns
2.2.2. Mel-Frequency Cepstral Coefficients (MFCC)
2.3. Feature Fusion
2.4. Classification
3. Experiments
3.1. Setup
3.2. Datasets
4. Results and Discussion
5. Conclusions
6. Materials
Author Contributions
Funding
Acknowledgments
Conflicts of Interest
Abbreviations
| LBP | Local Binary Patterns |
| LTP | Local Ternary Patterns |
| MFCC | Mel Frequency Cepstral Coefficients |
| SVM | Support Vector Machine |
| PCLA | Probabilistic Component Latent Analysis |
| KFDA | Kernel Fisher Discriminant Analysis |
| HOG | Histogram of Gradients |
| DNN | Deep Neural Networks |
| DFT | Discrete Fourier Transform |
| FFT | Fast Fourier Transform |
| FIR | Finite Impulse Response |
| GMM | Gaussian Mixture Model |
| KNN | K-Nearest Neighbour |
| SVM-C | SVM with Cubic kernel |
| SVM-Q | SVM with Quadratic kernel |
| SVM-G | SVM with mean Gaussian kernel |
| KNN-M | K Nearest Neighbors-Medium |
| KNN-W | K Nearest Neighbors-Weighted |
| KNN-C | K Nearest Neighbors-Cubic |
| OAO | One Against One |
| OAA | One Against All |
References
- Kobayashi, T.; Ye, J. Acoustic feature extraction by statistics based local binary pattern for environmental sound classification. In Proceedings of the 2014 IEEE International Conference on Acoustics, Speech and Signal Processing (ICASSP), Florence, Italy, 4–9 May 2014; pp. 3052–3056. [Google Scholar]
- Ye, J.; Kobayashi, T.; Murakawa, M.; Higuchi, T. Robust acoustic feature extraction for sound classification based on noise reduction. In Proceedings of the 2014 IEEE International Conference on Acoustics, Speech and Signal Processing (ICASSP), Florence, Italy, 4–9 May 2014; pp. 5944–5948. [Google Scholar]
- Geiger, J.T.; Schuller, B.; Rigoll, G. Large-scale audio feature extraction and SVM for acoustic scene classification. In Proceedings of the 2013 IEEE Workshop on Applications of Signal Processing to Audio and Acoustics, New Paltz, NY, USA, 20–23 October 2013; pp. 1–4. [Google Scholar]
- Ren, J.; Jiang, X.; Yuan, J.; Magnenat-Thalmann, N. Sound-Event Classification Using Robust Texture Features for Robot Hearing. IEEE Trans. Multimed. 2017, 19, 447–458. [Google Scholar] [CrossRef]
- Chu, S.; Narayanan, S.; Kuo, C.J. Environmental Sound Recognition With Time-Frequency Audio Features. IEEE Trans. Audio Speech Lang. Process. 2009, 17, 1142–1158. [Google Scholar] [CrossRef]
- Saltali, I.; Sariel, S.; Ince, G. Scene Analysis Through Auditory Event Monitoring. In Proceedings of the International Workshop on Social Learning and Multimodal Interaction for Designing Artificial Agents, Tokyo, Japan, 16 November 2016; pp. 5:1–5:6. [Google Scholar]
- Park, S.; Rho, J.; Shin, M.; Han, D.K.; Ko, H. Acoustic feature extraction for robust event recognition on cleaning robot platform. In Proceedings of the 2014 IEEE International Conference on Consumer Electronics (ICCE), Las Vegas, NV, USA, 10–13 January 2014; pp. 145–146. [Google Scholar]
- Rakotomamonjy, A.; Gasso, G. Histogram of Gradients of Time–Frequency Representations for Audio Scene Classification. IEEE-ACM Trans. Audio Speech Lang. Process. 2015, 23, 142–153. [Google Scholar]
- Nguyen, Q.; Choi, J. Matching pursuit based robust acoustic event classification for surveillance systems. Comput. Electr. Eng. 2017, 57, 43–54. [Google Scholar] [CrossRef]
- Sehili, M.A.; Lecouteux, B.; Vacher, M.; Portet, F.; Istrate, D.; Dorizzi, B.; Boudy, J. Sound Environment Analysis in Smart Home. In Ambient Intelligence; Springer: Berlin/Heidelberg, Germany, 2012; pp. 208–223. [Google Scholar]
- Wang, J.; Lin, C.; Chen, B.; Tsai, M. Gabor-Based Nonuniform Scale-Frequency Map for Environmental Sound Classification in Home Automation. IEEE Trans. Autom. Sci. Eng. 2014, 11, 607–613. [Google Scholar] [CrossRef]
- Mun, S.; Shon, S.; Kim, W.; Han, D.K.; Ko, H. Deep Neural Network based learning and transferring mid-level audio features for acoustic scene classification. In Proceedings of the 2017 IEEE International Conference on Acoustics, Speech and Signal Processing (ICASSP), New Orleans, LA, USA, 5–9 March 2017; pp. 796–800. [Google Scholar]
- Chen, Y.; Guo, Q.; Liang, X.; Wang, J.; Qian, Y. Environmental sound classification with dilated convolutions. Appl. Acoust. 2019, 148, 123–132. [Google Scholar] [CrossRef]
- Saki, F.; Kehtarnavaz, N. Real-time hierarchical classification of sound signals for hearing improvement devices. Appl. Acoust. 2018, 132, 26–32. [Google Scholar] [CrossRef]
- Yağanoğlu, M.; Köse, C. Real-Time Detection of Important Sounds with a Wearable Vibration Based Device for Hearing-Impaired People. Electronics 2018, 7, 50. [Google Scholar] [CrossRef]
- Seo, Y.S.; Huh, J.H. Automatic Emotion-Based Music Classification for Supporting Intelligent IoT Applications. Electronics 2019, 8, 164. [Google Scholar] [CrossRef]
- Sasaki, Y.; Kaneyoshi, M.; Kagami, S.; Mizoguchi, H.; Enomoto, T. Daily sound recognition using Pitch-Cluster-Maps for mobile robot audition. In Proceedings of the 2009 IEEE/RSJ International Conference on Intelligent Robots and Systems, St. Louis, MO, USA, 10–15 October 2009; pp. 2724–2729. [Google Scholar]
- Irtaza, A.; Adnan, S.M.; Aziz, S.; Javed, A.; Ullah, M.O.; Mahmood, M.T. A framework for fall detection of elderly people by analyzing environmental sounds through acoustic local ternary patterns. In Proceedings of the 2017 IEEE International Conference on Systems, Man, and Cybernetics (SMC), Banff, AB, Canada, 5–8 October 2017; pp. 1558–1563. [Google Scholar]
- Adnan, S.M.; Irtaza, A.; Aziz, S.; Ullah, M.O.; Javed, A.; Mahmood, M.T. Fall detection through acoustic Local Ternary Patterns. Appl. Acoust. 2018, 140, 296–300. [Google Scholar] [CrossRef]
- Hershey, S.; Chaudhuri, S.; Ellis, D.P.W.; Gemmeke, J.F.; Jansen, A.; Moore, R.C.; Plakal, M.; Platt, D.; Saurous, R.A.; Seybold, B.; et al. CNN architectures for large-scale audio classification. In Proceedings of the 2017 IEEE International Conference on Acoustics, Speech and Signal Processing (ICASSP), New Orleans, LA, USA, 5–9 March 2017; pp. 131–135. [Google Scholar]
- Karen, S.; Andrew, Z. Very Deep Convolutional Networks for Large-Scale Image Recognition. arXiv 2014, arXiv:1409.1556. [Google Scholar]
- Krizhevsky, A.; Sutskever, I.; Hinton, G.E. ImageNet Classification with Deep Convolutional Neural Networks. In Proceedings of the 26th Annual Conference on Neural Information Processing Systems (NIPS), Lake Tahoe, NV, USA, 3–8 December 2012. [Google Scholar]
- Szegedy, C.; Vanhoucke, V.; Ioffe, S.; Shlens, J.; Wojna, Z. Rethinking the Inception Architecture for Computer Vision. In Proceedings of the 2016 IEEE Conference on Computer Vision and Pattern Recognition (CVPR), Las Vegas, NV, USA, 27–30 June 2016; pp. 2818–2826. [Google Scholar]
- He, K.; Zhang, X.; Ren, S.; Sun, J. Deep Residual Learning for Image Recognition. In Proceedings of the 2016 IEEE Conference on Computer Vision and Pattern Recognition (CVPR), Las Vegas, NV, USA, 27–30 June 2016; pp. 770–778. [Google Scholar]
- Ojala, T.; Pietikainen, M.; Harwood, D. A comparative study of texture measures with classification based on feature distributions. Pattern Recognit. 1996, 29, 51–59. [Google Scholar] [CrossRef]
- Zhang, B.; Gao, Y.; Zhao, S.; Liu, J. Local derivative pattern versus local binary pattern: face recognition with high-order local pattern descriptor. IEEE Trans. Image Process. 2010, 19, 533–544. [Google Scholar] [CrossRef] [PubMed]
- Liu, L.; Fieguth, P.; Guo, Y.; Wang, X.; Pietikäinen, M. Local binary features for texture classification: Taxonomy and experimental study. Pattern Recognit. 2017, 62, 135–160. [Google Scholar] [CrossRef]
- Thwe, K.Z. Sound event classification using bidirectional local binary pattern. In Proceedings of the 2017 International Conference on Signal Processing and Communication (ICSPC), Tamil Nadu, India, 28–29 July 2017; pp. 501–504. [Google Scholar] [CrossRef]
- Costa, Y.M.; Oliveira, L.; Koerich, A.L.; Gouyon, F.; Martins, J. Music genre classification using LBP textural features. Signal Process. 2012, 92, 2723–2737. [Google Scholar] [CrossRef]
- Tan, X.; Triggs, W. Enhanced local texture feature sets for face recognition under difficult lighting conditions. IEEE Trans. Image Process. 2010, 19, 1635–1650. [Google Scholar] [PubMed]
- Raja, M.; Sadasivam, V. Optimized local ternary patterns: A new texture model with set of optimal patterns for texture analysis. J. Comput. Sci. 2013, 9, 1–15. [Google Scholar] [CrossRef]
- Wu, S.; Yang, L.; Xu, W.; Zheng, J.; Li, Z.; Fang, Z. A mutual local-ternary-pattern based method for aligning differently exposed images. Comput. Vis. Image Underst. 2016, 152, 67–78. [Google Scholar] [CrossRef]
- Zhang, Y.; Li, S.; Wang, S.; Shi, Y.Q. Revealing the traces of median filtering using high-order local ternary patterns. IEEE Signal Process. Lett. 2014, 21, 275–279. [Google Scholar] [CrossRef]
- Han, W.; Chan, C.F.; Choy, C.S.; Pun, K.P. An efficient MFCC extraction method in speech recognition. In Proceedings of the 2006 IEEE International Symposium on Circuits and Systems, Island of Kos, Greece, 21–24 May 2006. [Google Scholar]
- Ittichaichareon, C.; Suksri, S. Speech Recognition using MFCC. In Proceedings of the International Conference on Computer Graphics, Simulation and Modeling (ICGSM’2012), Pattaya, Thailand, 28–29 July 2012; pp. 28–29. [Google Scholar]
- Mesaros, A.; Heittola, T.; Virtanen, T. TUT database for acoustic scene classification and sound event detection. In Proceedings of the 2016 24th European Signal Processing Conference (EUSIPCO), Budapest, Hungary, 29 August–2 September 2016; pp. 1128–1132. [Google Scholar]
- Shaukat, A.; Ahsan, M.; Hassan, A.; Riaz, F. Daily sound recognition for elderly people using ensemble methods. In Proceedings of the 2014 11th International Conference on Fuzzy Systems and Knowledge Discovery (FSKD), Xiamen, China, 19–21 August 2014; pp. 418–423. [Google Scholar]
- Amarappa, S.; Sathyanarayana, S. Data classification using Support vector Machine (SVM), a simplified approach. Int. J. Electron. Comput. Sci. Eng. 2014, 3, 435–445. [Google Scholar]
- Faziludeen, S.; Sabiq, P.V. ECG beat classification using wavelets and SVM. In Proceedings of the 2013 IEEE Conference on Information Communication Technologies, Thuckalay, India, 11–12 April 2013; pp. 815–818. [Google Scholar]
- Jonathan, M.; Mohamed, C.; Robert, S. “One Against One” or “One Against All”: Which One is Better for Handwriting Recognition with SVMs? In Proceedings of the Tenth International Workshop on Frontiers in Handwriting Recognition, La Baule, France, 23–26 October 2006. [Google Scholar]
- Lee, S.W.; Verri, A. (Eds.) Pattern Recognition with Support Vector Machines; Springer: Berlin, Germany, 2002. [Google Scholar]
- Nakamura, S.; Hiyane, K.; Asano, F.; Nishiura, T.; Yamada, T. Acoustical Sound Database in Real Environments for Sound Scene Understanding and Hands-Free Speech Recognition. In Proceedings of the 2nd International Conference on Language Resources and Evaluation, Athens, Greece, 31 May–2 June 2000. [Google Scholar]
- Giannoulis, D.; Stowell, D.; Benetos, E.; Rossignol, M.; Lagrange, M.; Plumbley, M.D. A database and challenge for acoustic scene classification and event detection. In Proceedings of the 21st European Signal Processing Conference (EUSIPCO 2013), Marrakech, Morocco, 9–13 September 2013; pp. 1–5. [Google Scholar]
- Rascon, C.; Meza, I. Localization of sound sources in robotics: A review. Robot. Auton. Syst. 2017, 96, 184–210. [Google Scholar] [CrossRef]
- Toyoda, Y.; Huang, J.; Ding, S.; Liu, Y. Environmental sound recognition by multilayered neural networks. In Proceedings of the Fourth International Conference on Computer and Information Technology, Wuhan, China, 16 September 2004; pp. 123–127. [Google Scholar] [CrossRef]
- Yamakawa, N.; Takahashi, T.; Kitahara, T.; Ogata, T.; Okuno, H.G. Environmental sound recognition for robot audition using matching-pursuit. In Proceedings of the International Conference on Industrial, Engineering and Other Applications of Applied Intelligent Systems, Syracuse, NY, USA, 29 June–1 July 2011; pp. 1–10. [Google Scholar]


| Work | Features | Classifier | Dataset | Accuracy |
|---|---|---|---|---|
| [1] | ID-LBP | Linear SVM | RWCP | |
| [2] | PLCA, temporal–spectral patterns of sound spectrogram | FDA | RWCP | |
| [3] | MFCC, Spectral and energy features | SVM | DCASE | |
| [4] | Multichannel LBP | SVM | RWCP, NTU-SEC | , |
| [5] | Matching Pursuit and MFCC | GMM | BBC sound effects | |
| [6] | Thresholds based pre-processing, FFT | SVM | Self collected 250 recordings of dropping and hitting sounds | |
| [7] | LFCC | GMM | self collected dataset using a microphone set up on cleaning robot platform | |
| [8] | HOG | pooling | DCASE-challenge, Litis Rauin, EA | |
| [9] | MP decomposition using Gabor function with time frequency histogram | Random Forest | Combination of self collected sounds, Sound Idea database [10], Free sound project [11] | |
| [12] | Deep neural network based transfer learning | Softmax | DCASE | |
| [13] | MFCC | CNN | UrbanSoundK | |
| [14] | Multiple | Hierarchical | Self collected | |
| [15] | MFCC, ZC, LAR etc. | KNN | Self Collected | 99% |
| [16] | average peak, height & width, no. of half-wavelengths of music wave | Regression analysis | self collected | 77% |
| (a) RWCP Dataset | |
| Class | No. of Samples |
| Aircap | 100 |
| Bells | 400 |
| Bottle | 200 |
| Buzzer | 100 |
| Case | 300 |
| Clap | 400 |
| Drum | 100 |
| Phone | 200 |
| Pump | 100 |
| Saw | 200 |
| Spray | 100 |
| Stapler | 100 |
| Tear | 100 |
| Toy | 200 |
| Whistle | 300 |
| Wood | 300 |
| Total | |
| (b) DCASE Dataset | |
| Class | No. of Samples |
| Beach | 78 |
| Bus | 78 |
| Cafe | 78 |
| Car | 78 |
| City Center | 78 |
| Forest | 78 |
| Grocery Store | 78 |
| Home | 78 |
| Library | 78 |
| Metro Station | 78 |
| Office | 78 |
| Park | 78 |
| Residential area | 78 |
| Train | 78 |
| Tram | 78 |
| Total | |
| Feature Descriptor | Accuracy | Time (s) | |
|---|---|---|---|
| DCASE Dataset | RWCP Sound Dataset | ||
| MFCC | 1.2 | ||
| ID-LBP | 0.75 | ||
| LPCC | 0.92 | ||
| ID-LTP + MFCC | 0.81 | ||
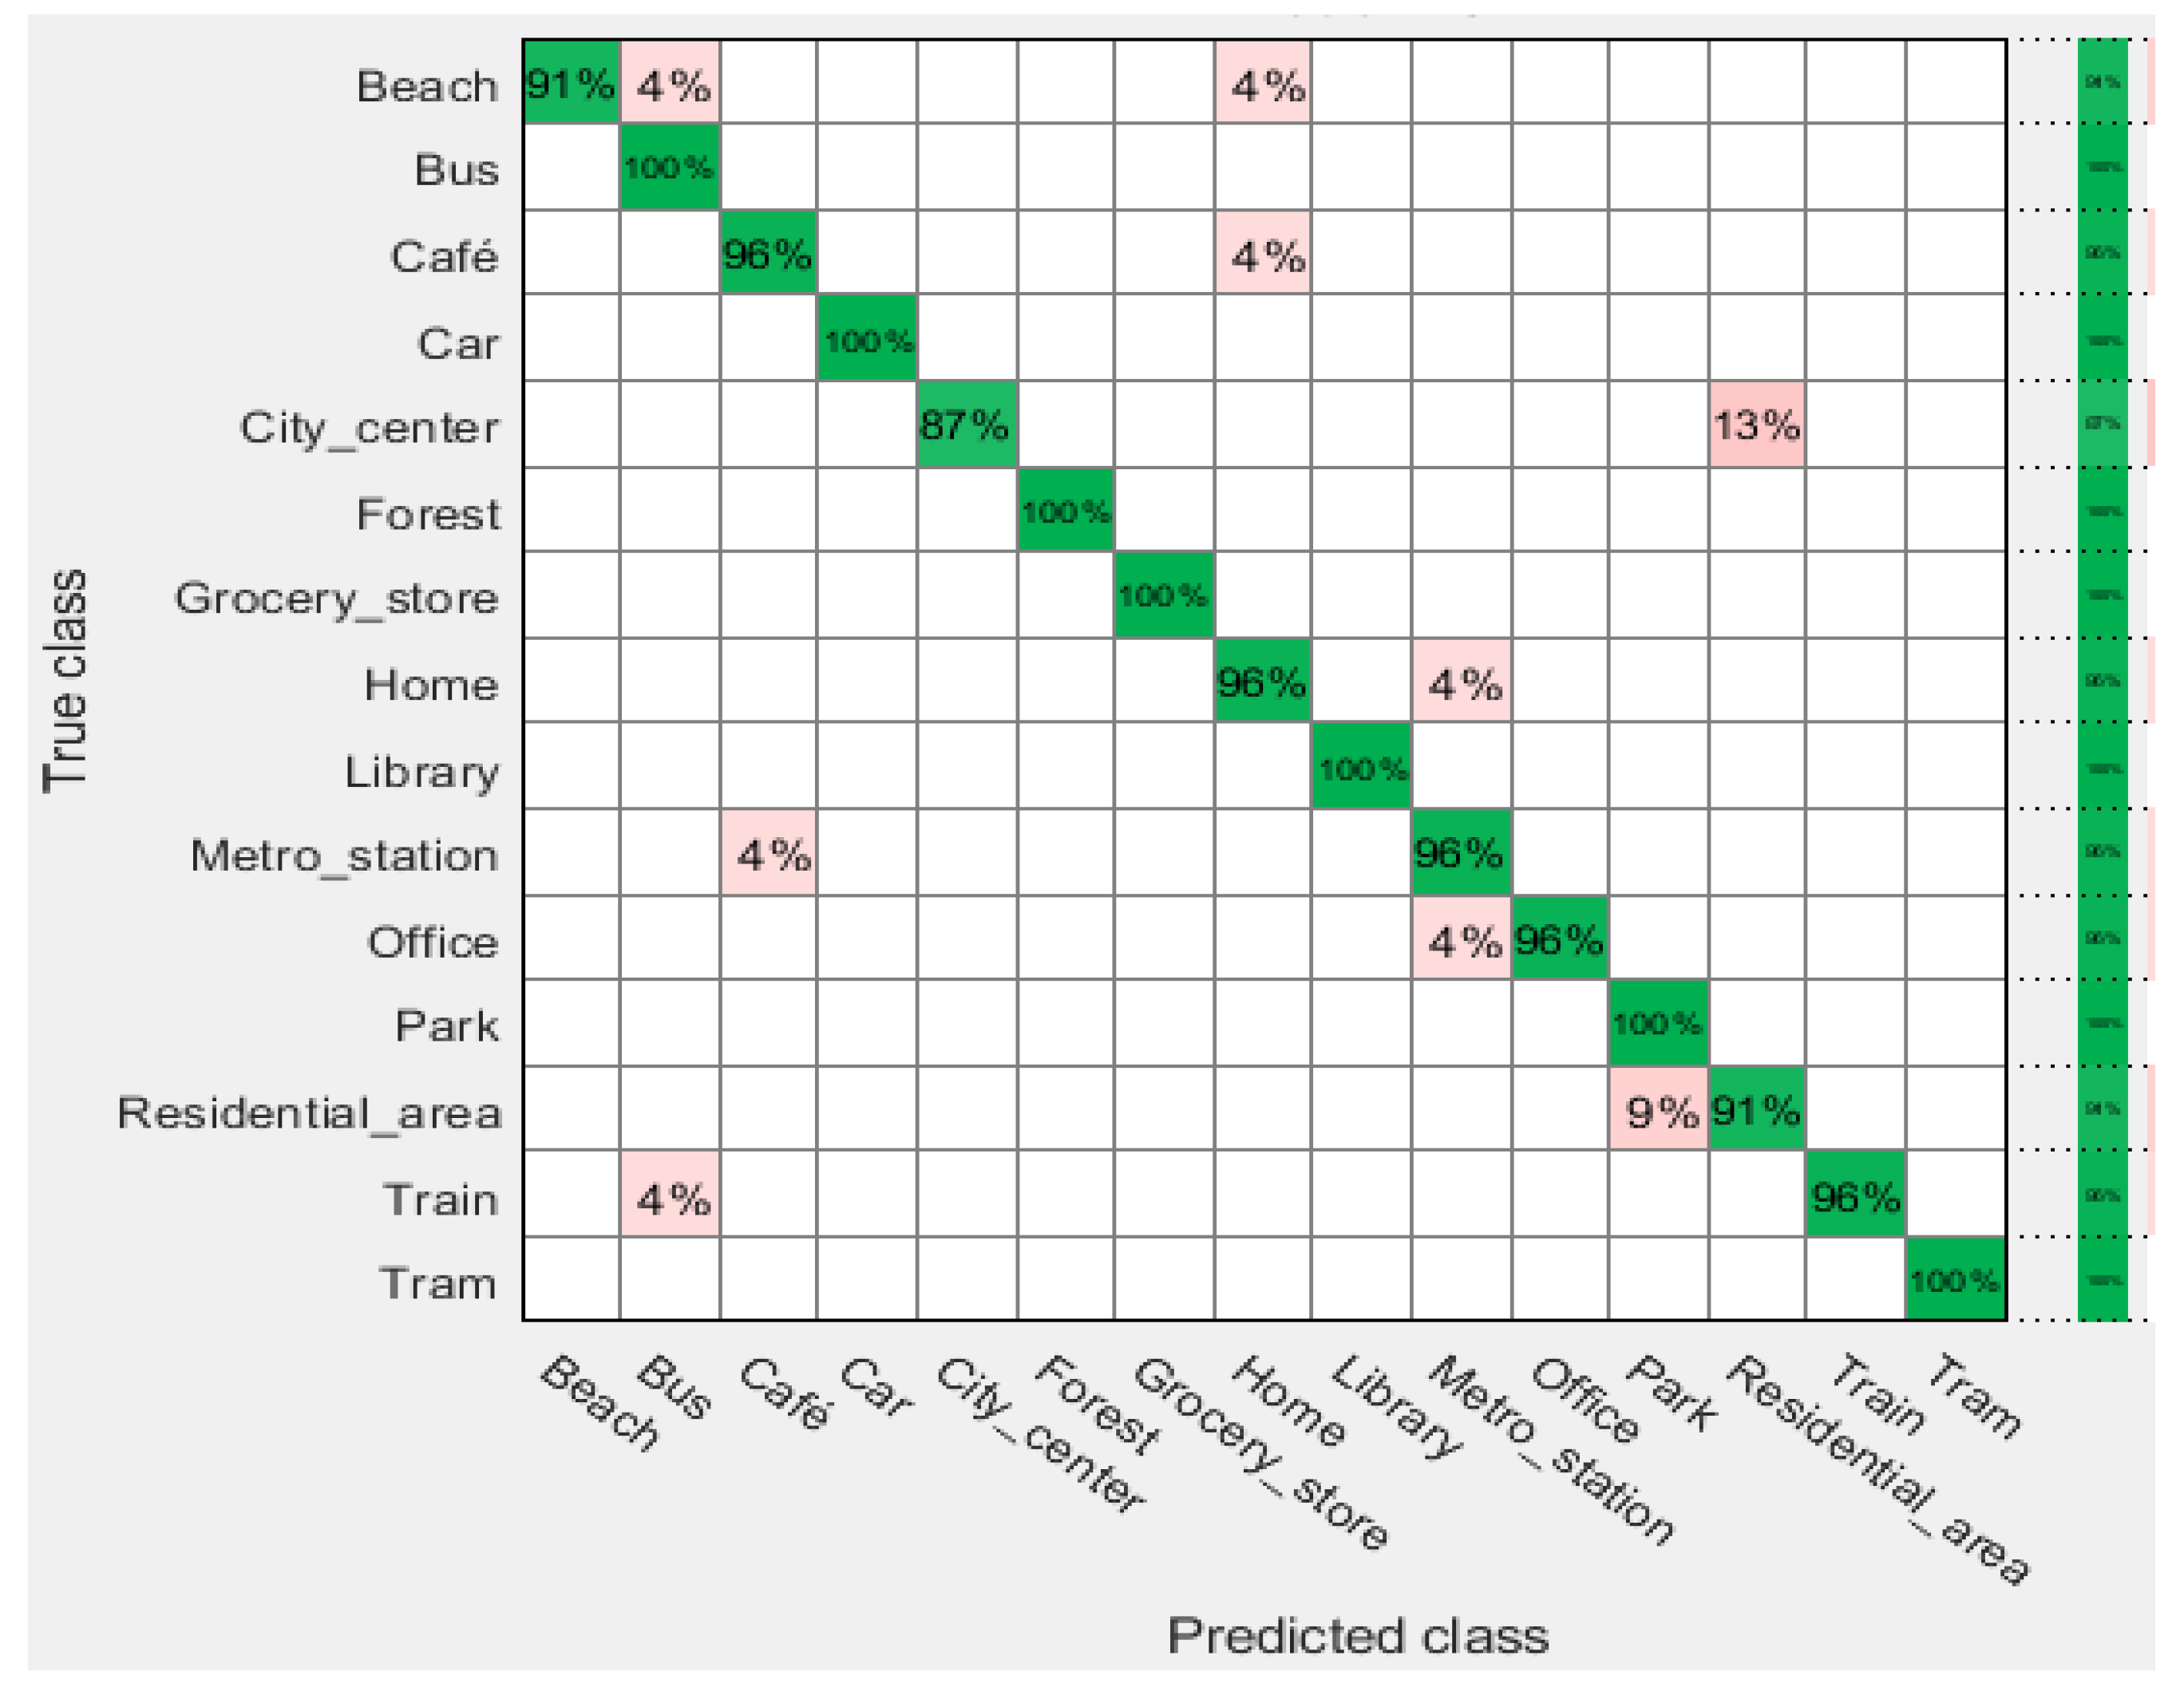
| DCASE Dataset | ||||
|---|---|---|---|---|
| Classifier | Performance | |||
| Accuracy (%) | Sensitivity (%) | Specificity (%) | Error Rate | |
| SVM-L | 89.49 | 83.33 | 99.54 | 0.1051 |
| SVM-Q | 94.10 | 91.03 | 99.91 | 0.0590 |
| SVM-C | 93.85 | 93.59 | 99.91 | 0.0615 |
| SVM-G | 93.16 | 92.31 | 99.82 | 0.0684 |
| KNN-M | 85.04 | 92.31 | 98.81 | 0.1496 |
| KNN-W | 90.26 | 93.59 | 99.36 | 0.0974 |
| KNN-C | 82.56 | 84.62 | 98.35 | 0.1744 |
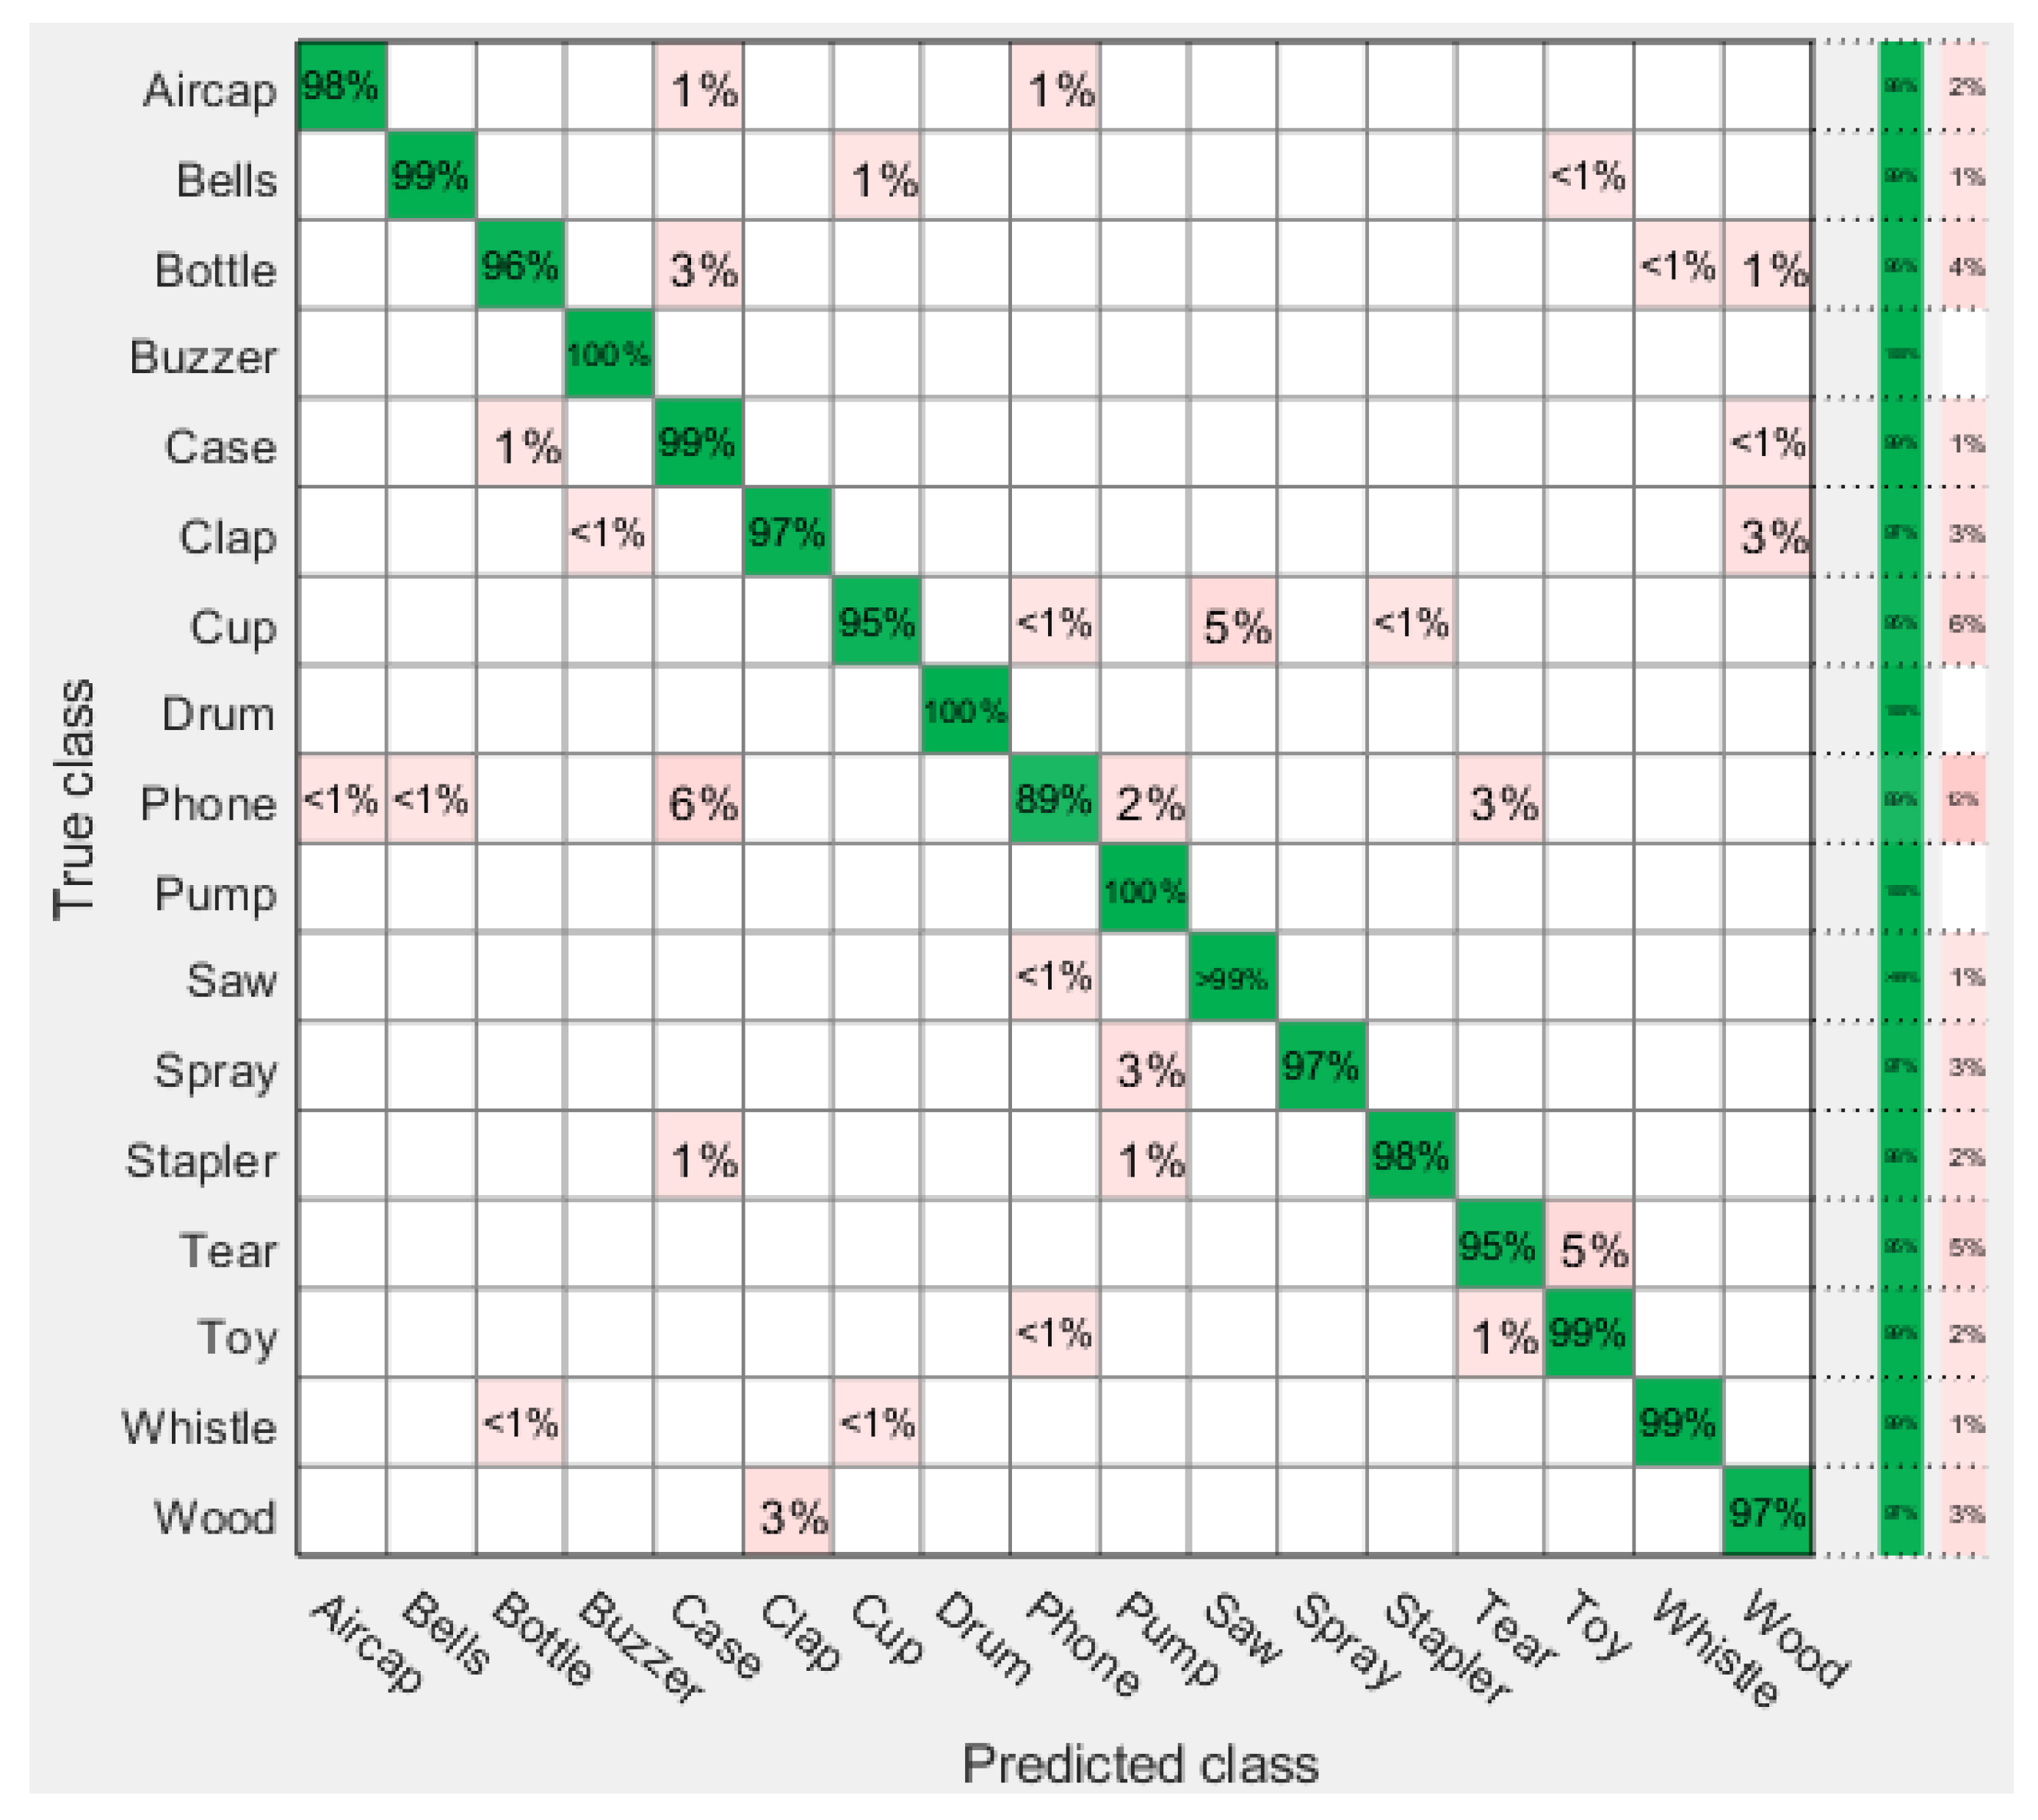
| RWCP Dataset | ||||
|---|---|---|---|---|
| Classifier | Performance | |||
| Accuracy (%) | Sensitivity (%) | Specificity (%) | Error Rate | |
| SVM-L | 93.97 | 98.50 | 99.93 | 0.0603 |
| SVM-Q | 97.38 | 99.0 | 99.83 | 0.0262 |
| SVM-C | 97.26 | 99.25 | 99.97 | 0.0274 |
| SVM-G | 94.44 | 98.75 | 99.57 | 0.0556 |
| KNN-M | 97.26 | 99.50 | 99.83 | 0.0274 |
| KNN-W | 96.85 | 99.00 | 99.80 | 0.0315 |
| KNN-C | 96.35 | 99.25 | 99.80 | 0.0365 |
© 2019 by the authors. Licensee MDPI, Basel, Switzerland. This article is an open access article distributed under the terms and conditions of the Creative Commons Attribution (CC BY) license (http://creativecommons.org/licenses/by/4.0/).
Share and Cite
Aziz, S.; Awais, M.; Akram, T.; Khan, U.; Alhussein, M.; Aurangzeb, K. Automatic Scene Recognition through Acoustic Classification for Behavioral Robotics. Electronics 2019, 8, 483. https://doi.org/10.3390/electronics8050483
Aziz S, Awais M, Akram T, Khan U, Alhussein M, Aurangzeb K. Automatic Scene Recognition through Acoustic Classification for Behavioral Robotics. Electronics. 2019; 8(5):483. https://doi.org/10.3390/electronics8050483
Chicago/Turabian StyleAziz, Sumair, Muhammad Awais, Tallha Akram, Umar Khan, Musaed Alhussein, and Khursheed Aurangzeb. 2019. "Automatic Scene Recognition through Acoustic Classification for Behavioral Robotics" Electronics 8, no. 5: 483. https://doi.org/10.3390/electronics8050483
APA StyleAziz, S., Awais, M., Akram, T., Khan, U., Alhussein, M., & Aurangzeb, K. (2019). Automatic Scene Recognition through Acoustic Classification for Behavioral Robotics. Electronics, 8(5), 483. https://doi.org/10.3390/electronics8050483