Power Control Technique Using Error Distribution Analysis for Ultrasound Imaging Displays


Abstract
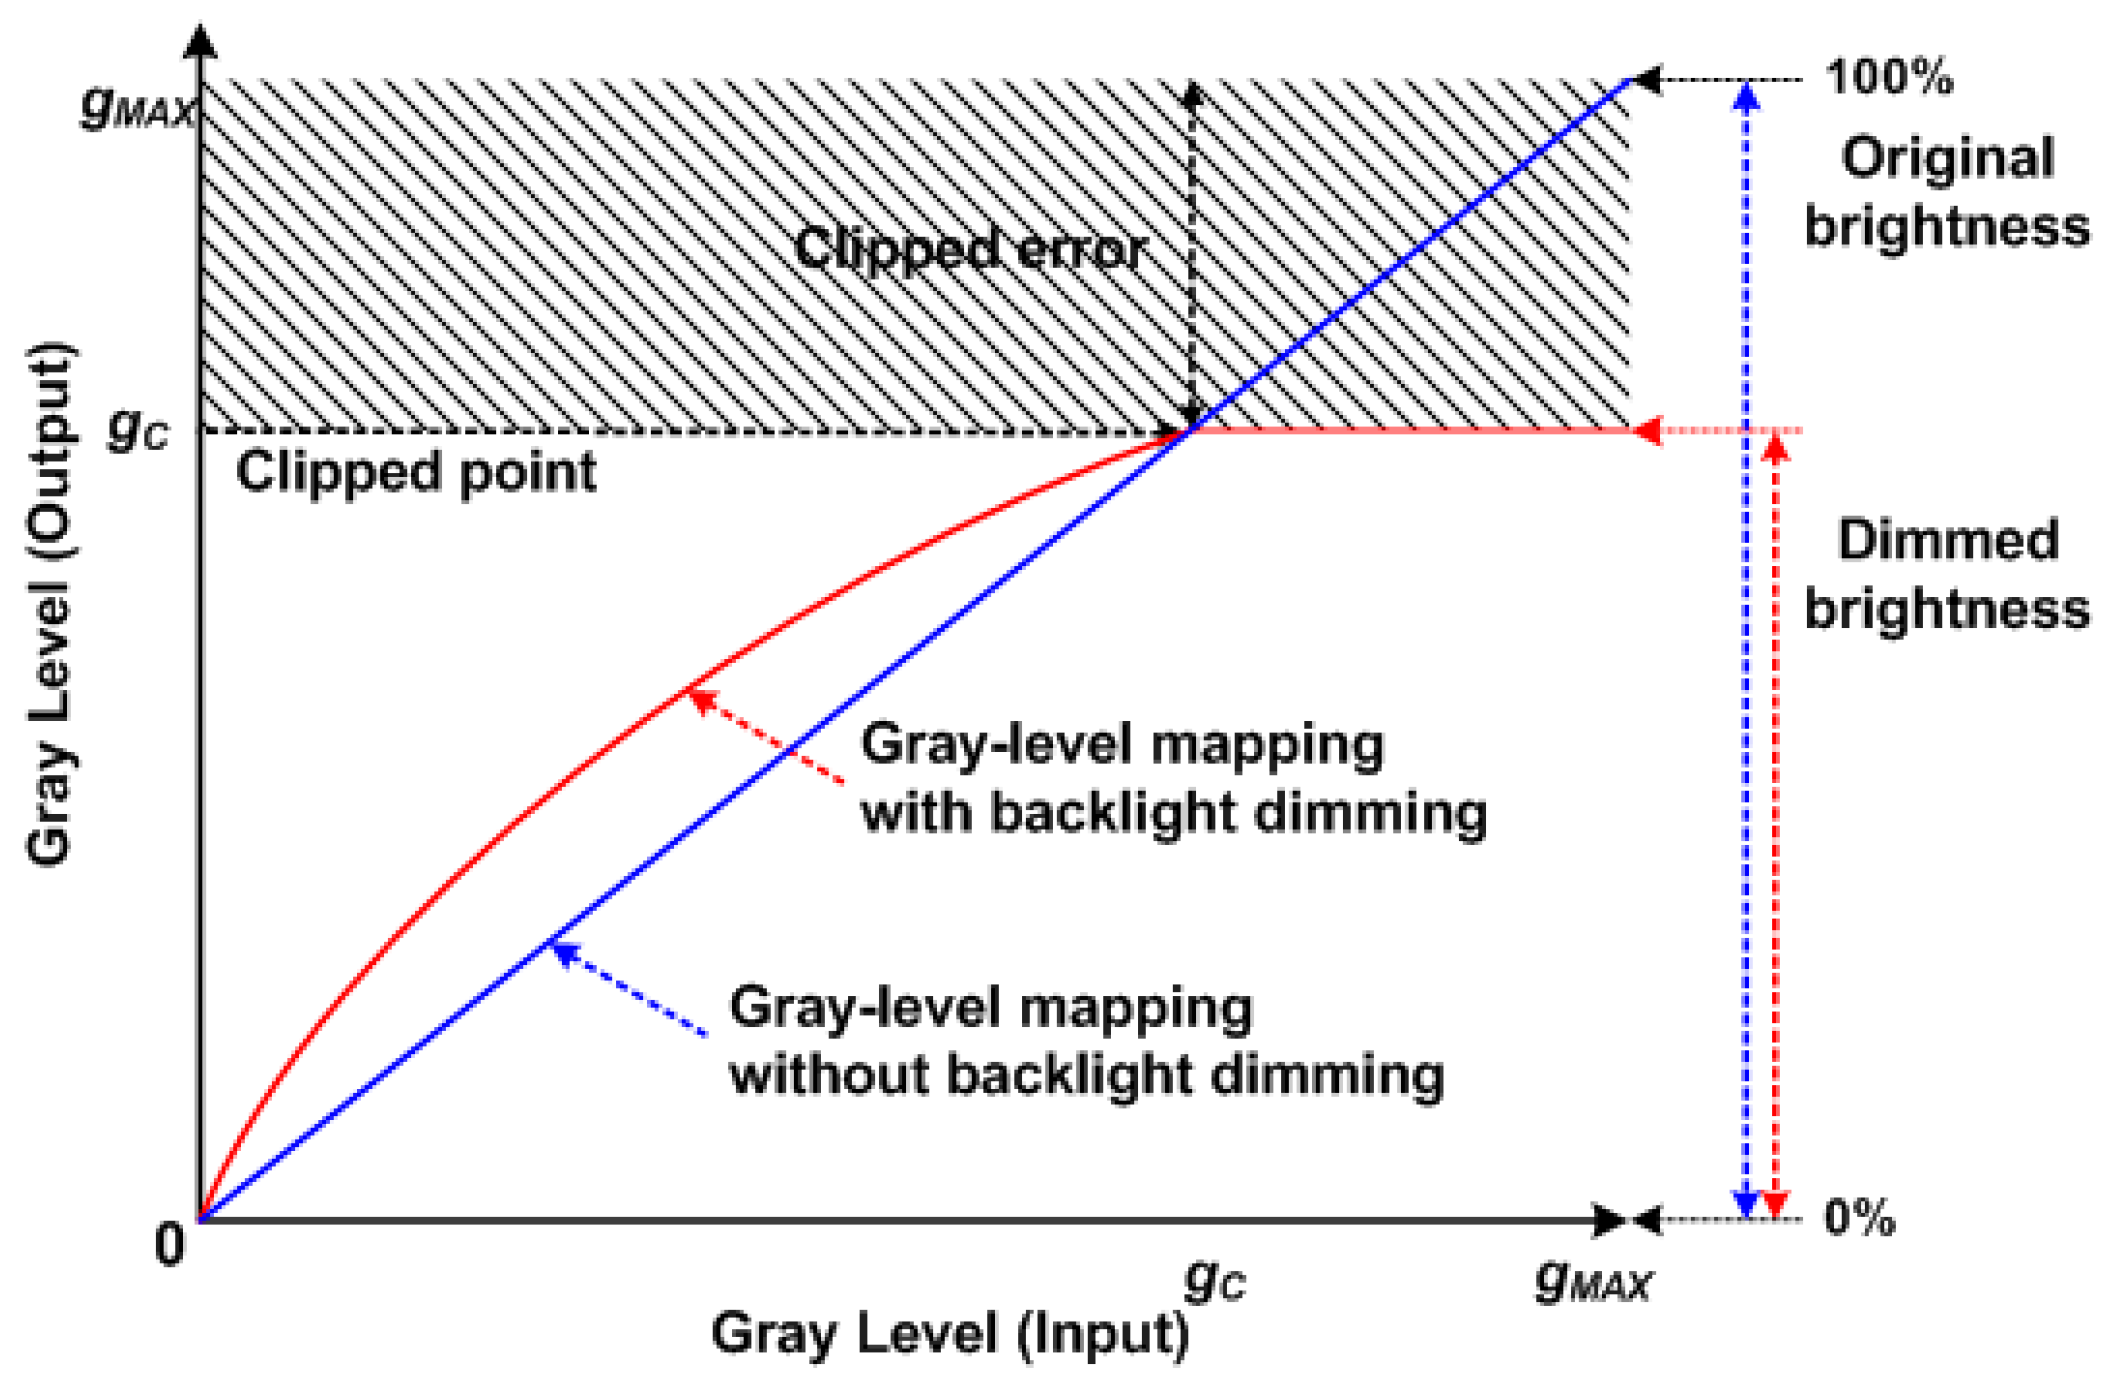
1. Introduction
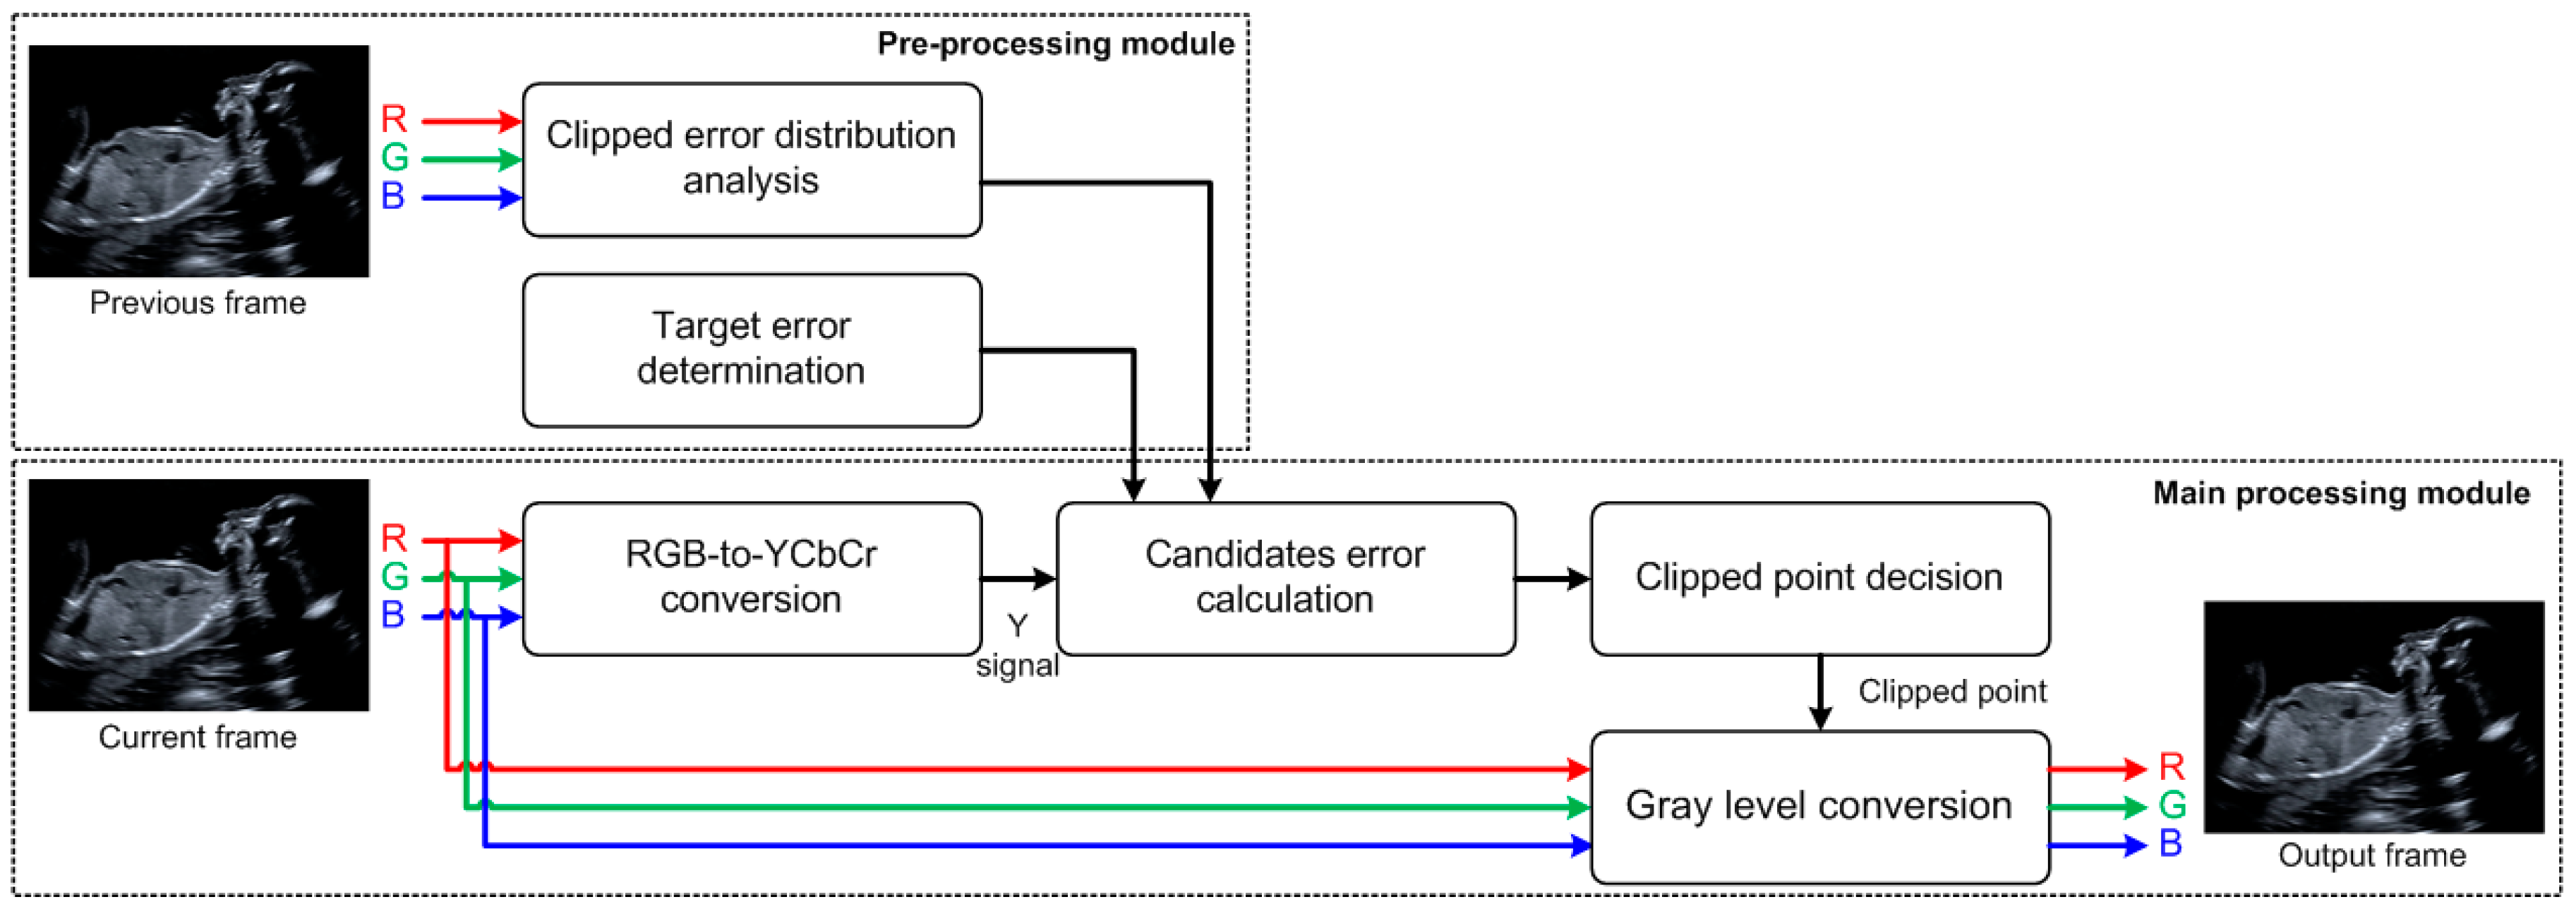
2. Proposed Method
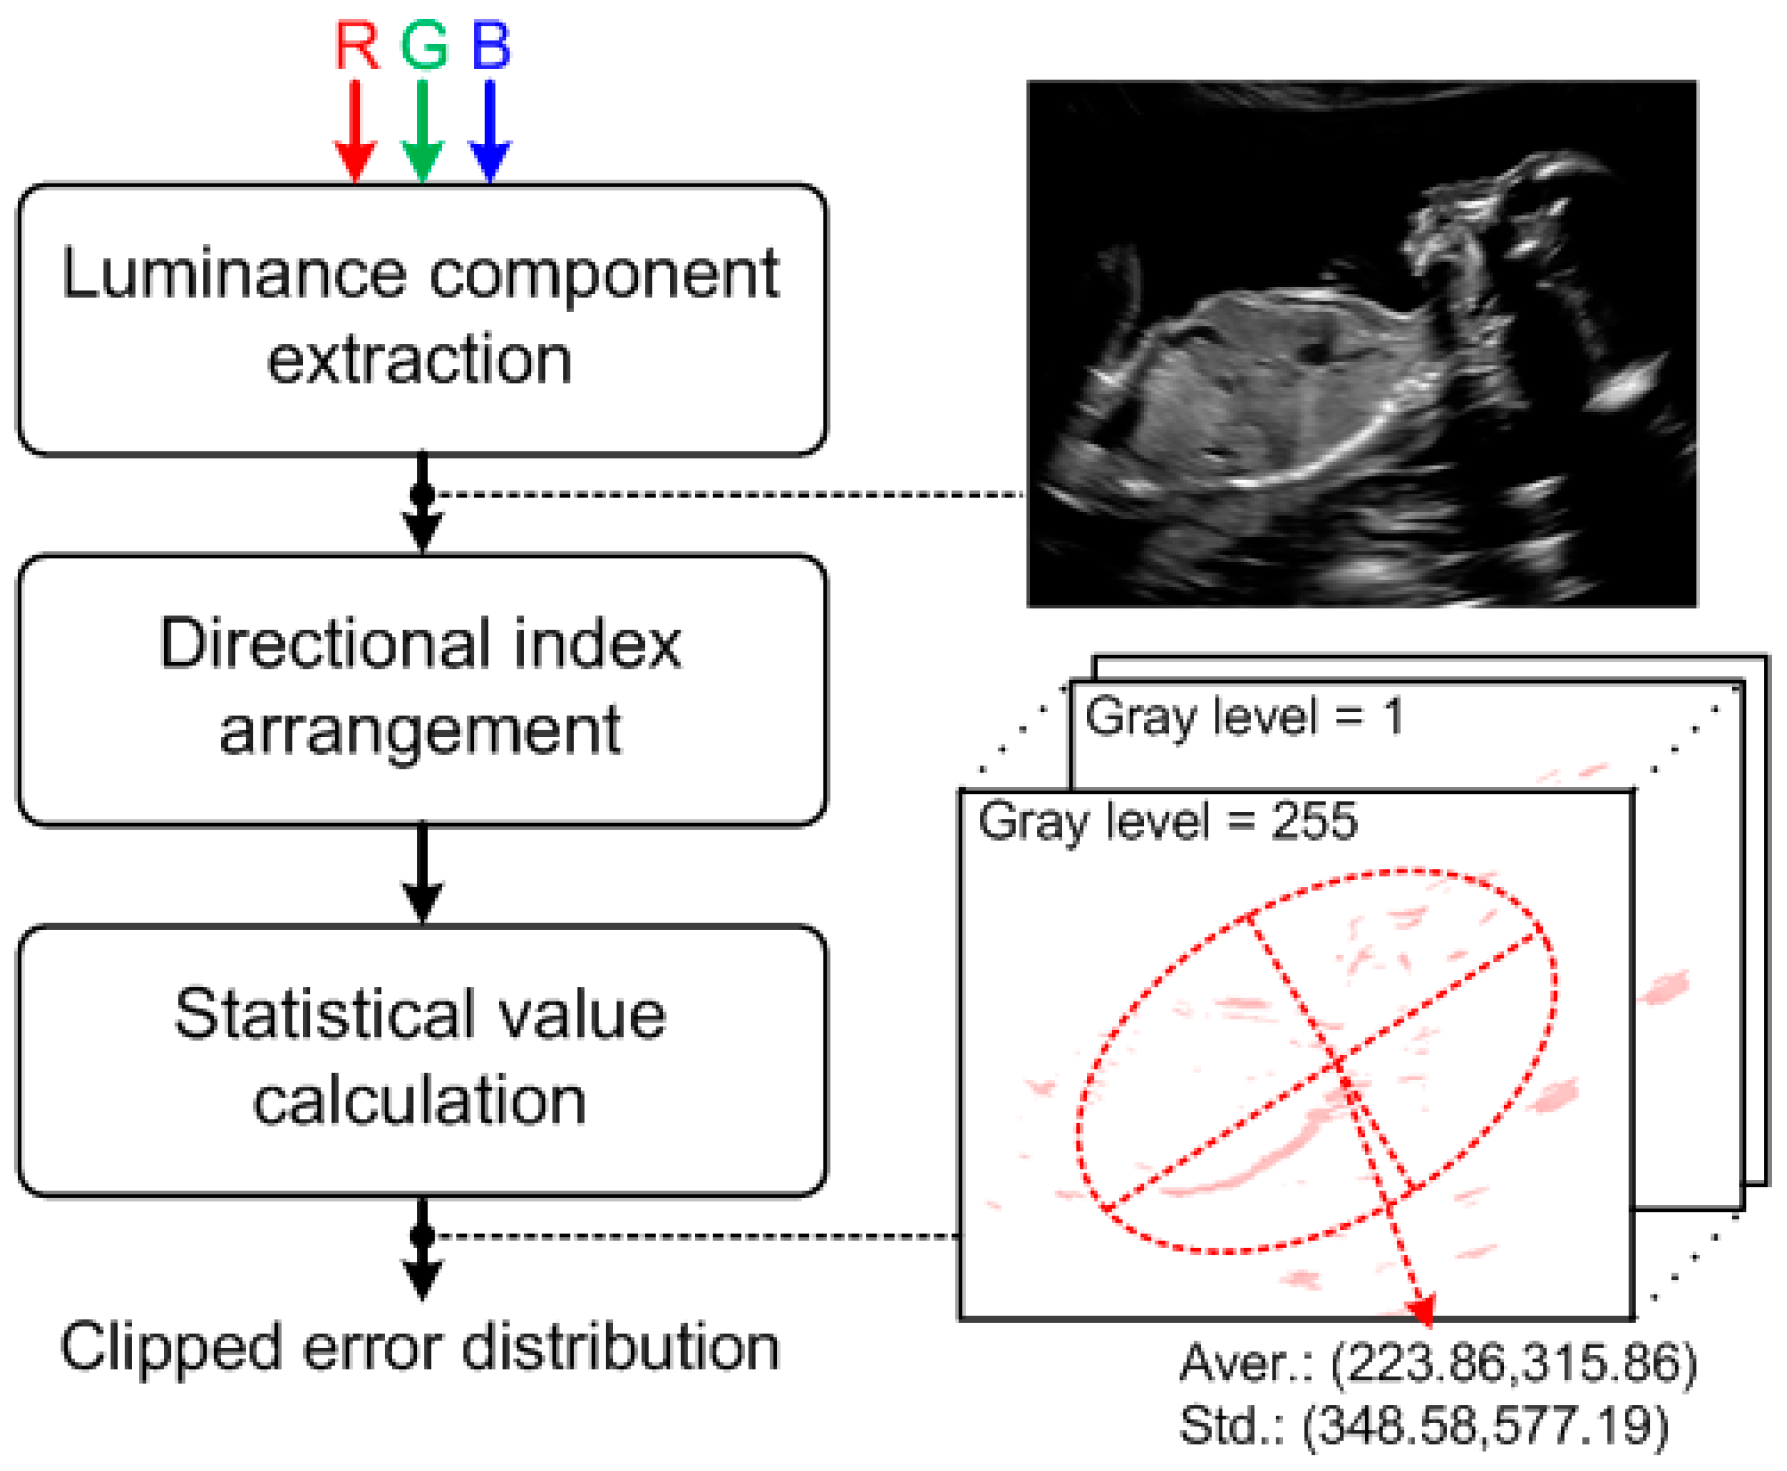
2.1. Pre-processing Module
2.2. Main Processing Module
2.2.1. Candidate Error Calculation
2.2.2. Clipped Point Decision
3. Simulation Results
3.1. Simulation Environments
3.2. Evaluations
4. Conclusions and Discussion
Author Contributions
Funding
Acknowledgments
Conflicts of Interest
References
- Szabo, T.S. Diagnostic Ultrasound Imaging: Inside Out; Szabo, T.S., Ed.; Elsevier Academic Press: Burlington, MA, USA, 2004. [Google Scholar]
- Stergiopoulos, S. Advanced Signal Processing Handbook: Theory and Implementation for Radar, Sonar, and Medical Imaging Real Time Systems; Stergiopoulos, S., Ed.; CRC Press: Boca Raton, FL, USA, 2000. [Google Scholar]
- Karaman, M.; Li, P.C.; O’Donnell, M. Synthetic Aperture Imaging for Small Scale Systems. IEEE Trans. Ultrason. Ferroelectr. Freq. Control. 1995, 42, 429–442. [Google Scholar] [CrossRef]
- Chang, N.; Choi, I.; Shim, H. DLS: Dynamic Backlight Luminance Scaling of Liquid Crystal Display. IEEE Trans. Very Large Scale Integr. VLSI Syst. 2004, 12, 837–846. [Google Scholar] [CrossRef]
- Lai, C.C.; Tsai, C.C. Backlight power reduction and image contrast enhancement using adaptive dimming for global backlight applications. IEEE Trans. IEEE Trans. Consum. Electron. 2008, 54, 669–674. [Google Scholar] [CrossRef]
- Iranli, A.; Fatemi, H.; Pedram, M. HEBS: Histogram Equalization for Backlight Scaling. In Proceedings of the conference on Design, Automation and Test in Europe, Munich, Germany, 7–11 March 2005; IEEE Computer Society: Washington, DC, USA, 2005; pp. 346–351. [Google Scholar] [CrossRef]
- Kang, S.J.; Kim, Y.H. Image Integrity-based gray-level error control for low power liquid crystal displays. IEEE Trans. Consum. Electron. 2009, 55, 2401–2406. [Google Scholar] [CrossRef]
- Kang, S.J. SSIM Preservation-based Backlight Dimming. IEEE/OSA J. Disp. Technol. 2014, 10, 247–250. [Google Scholar] [CrossRef]
- Kang, S.J.; Kim, Y.H. Segmentation-based Clipped Error Control Algorithm for Global Backlight Dimming. IEEE/OSA J. Disp. Technol. 2014, 10, 568–573. [Google Scholar] [CrossRef]
- Kang, S.J.; Bae, S. Fast Segmentation-Based Backlight Dimming. IEEE/OSA J. Disp. Technol. 2015, 11, 399–402. [Google Scholar] [CrossRef]
- Ahn, Y.D.; Kang, S.J. Backlight Dimming based on Saliency Map acquired by Visual Attention Analysis. Displays 2017, 50, 70–77. [Google Scholar] [CrossRef]
- Kang, S.J. OLED Power Control Algorithm Using Optimal Mapping Curve Determination. IEEE/OSA J. Disp. Technol. 2016, 12, 1278–1282. [Google Scholar] [CrossRef]
- Kang, S.J. Perceptual Quality-aware Power Reduction Technique for Organic Light Emitting Diodes. IEEE/OSA J. Disp. Technol. 2016, 12, 519–525. [Google Scholar] [CrossRef]
- Kang, S.J. Processor-based Backlight Dimming Using Computation Reduction Technique. IEEE/OSA J. Disp. Technol. 2013, 9, 819–824. [Google Scholar] [CrossRef]
- Taubman, D.S.; Marcellin, M.W. JPEG2000 Image Compression Fundamentals, Standards and Practice; Taubman, D.S., Marcellin, M.W., Eds.; Kluwer Academic Publishers: Boston, NY, USA, 2002. [Google Scholar]
- LP064V1 Liquid Crystal Display. LG Display. May 2001. Available online: https://www.digchip.com/datasheets/parts/datasheet/1019/LP064V1.php (accessed on 9 April 2019).


| Test Sequence (Number of Frames) | I2GEC | Proposed 2 | Proposed 4 | Proposed 9 | ||||||||
|---|---|---|---|---|---|---|---|---|---|---|---|---|
| Avg. PSNR (dB) | Min. PSNR (dB) | Std. Dev. (dB) | Avg. PSNR (dB) | Min. PSNR (dB) | Std. Dev. (dB) | Avg. PSNR (dB) | Min. PSNR (dB) | Std. Dev. (dB) | Avg. PSNR (dB) | Min. PSNR (dB) | Std. Dev. (dB) | |
| Test sequence 1 (186) | 30.064 | 30.007 | 0.034 | 36.775 | 36.383 | 0.207 | 36.820 | 36.515 | 0.197 | 36.588 | 36.209 | 0.235 |
| Test sequence 2 (238) | 30.068 | 30.000 | 0.037 | 36.743 | 36.266 | 0.191 | 36.929 | 36.469 | 0.181 | 37.131 | 36.716 | 0.168 |
| Test sequence 3 (43) | 30.062 | 30.006 | 0.039 | 36.632 | 36.434 | 0.104 | 36.783 | 36.501 | 0.117 | 36.977 | 36.666 | 0.158 |
| Test Sequence (Number of Frames) | I2GEC | Proposed 2 | Proposed 4 | Proposed 9 | ||||||||
|---|---|---|---|---|---|---|---|---|---|---|---|---|
| Avg. Power (W) | Power rd. rate (%) | Std. Dev. (W) | Avg. Power (W) | Power rd. rate (%) | Std. Dev. (W) | Avg. Power (W) | Power rd. rate (%) | Std. Dev. (W) | Avg. Power (W) | Power rd. rate (%) | Std. Dev. (W) | |
| Test sequence 1 (186) | 0.799 | 69.488 | 0.028 | 1.158 | 55.813 | 0.160 | 1.160 | 55.733 | 0.016 | 1.149 | 56.148 | 0.017 |
| Test sequence 2 (238) | 0.940 | 64.105 | 0.024 | 1.269 | 51.573 | 0.009 | 1.276 | 51.295 | 0.010 | 1.284 | 51.001 | 0.012 |
| Test sequence 3 (43) | 0.929 | 64.557 | 0.007 | 1.253 | 52.160 | 0.003 | 1.259 | 51.928 | 0.003 | 1.267 | 51.635 | 0.004 |
| Test Sequence (Number of Frames) | I2GEC | Proposed 2 | Proposed 4 | Proposed 9 | ||||||||
|---|---|---|---|---|---|---|---|---|---|---|---|---|
| Avg. time (μs) | Min. time (μs) | Std. Dev. (μs) | Avg. time (μs) | Min. time (μs) | Std. Dev. (μs) | Avg. time (μs) | Min. time (μs) | Std. Dev. (μs) | Avg. time (μs) | Min. time (μs) | Std. Dev. (μs) | |
| Test sequence 1 (186) | 2.623 | 2.618 | 0.008 | 2.924 | 2.906 | 0.009 | 2.334 | 2.319 | 0.010 | 2.173 | 2.161 | 0.009 |
| Test sequence 2 (238) | 2.555 | 2.551 | 0.007 | 2.920 | 2.901 | 0.014 | 2.319 | 2.306 | 0.008 | 2.180 | 2.166 | 0.008 |
| Test sequence 3 (43) | 2.623 | 2.618 | 0.012 | 2.924 | 2.906 | 0.015 | 2.334 | 2.319 | 0.012 | 2.173 | 2.161 | 0.011 |
| Operation | I2GEC | Proposed |
|---|---|---|
| ADD | 7NrowNcol + 62Nbit | (4 + 16/δ2)NrowNcol + 72Nbit |
| MUL | 62Nbit | 42Nbit |
© 2019 by the authors. Licensee MDPI, Basel, Switzerland. This article is an open access article distributed under the terms and conditions of the Creative Commons Attribution (CC BY) license (http://creativecommons.org/licenses/by/4.0/).
Share and Cite
Cho, S.I.; Kang, S.-J. Power Control Technique Using Error Distribution Analysis for Ultrasound Imaging Displays. Electronics 2019, 8, 471. https://doi.org/10.3390/electronics8050471
Cho SI, Kang S-J. Power Control Technique Using Error Distribution Analysis for Ultrasound Imaging Displays. Electronics. 2019; 8(5):471. https://doi.org/10.3390/electronics8050471
Chicago/Turabian StyleCho, Sung In, and Suk-Ju Kang. 2019. "Power Control Technique Using Error Distribution Analysis for Ultrasound Imaging Displays" Electronics 8, no. 5: 471. https://doi.org/10.3390/electronics8050471
APA StyleCho, S. I., & Kang, S.-J. (2019). Power Control Technique Using Error Distribution Analysis for Ultrasound Imaging Displays. Electronics, 8(5), 471. https://doi.org/10.3390/electronics8050471