Article

Pano-RSOD: A Dataset and Benchmark for Panoramic Road Scene Object Detection

1
College of Information Science and Engineering, Northeastern University, Shenyang 110819, China
2
School of Land Science and Technology, China University of Geosciences, Beijing 100083, China
3
The State Key Laboratory of Remote Sensing Science, Beijing Normal University, Beijing 100875, China
*
Authors to whom correspondence should be addressed.
The authors share the same contributions.
Electronics 2019, 8(3), 329; https://doi.org/10.3390/electronics8030329
Submission received: 18 February 2019 / Revised: 4 March 2019 / Accepted: 11 March 2019 / Published: 18 March 2019

Abstract

:
Panoramic images have a wide range of applications in many fields with their ability to perceive all-round information. Object detection based on panoramic images has certain advantages in terms of environment perception due to the characteristics of panoramic images, e.g., lager perspective. In recent years, deep learning methods have achieved remarkable results in image classification and object detection. Their performance depends on the large amount of training data. Therefore, a good training dataset is a prerequisite for the methods to achieve better recognition results. Then, we construct a benchmark named Pano-RSOD for panoramic road scene object detection. Pano-RSOD contains vehicles, pedestrians, traffic signs and guiding arrows. The objects of Pano-RSOD are labelled by bounding boxes in the images. Different from traditional object detection datasets, Pano-RSOD contains more objects in a panoramic image, and the high-resolution images have 360-degree environmental perception, more annotations, more small objects and diverse road scenes. The state-of-the-art deep learning algorithms are trained on Pano-RSOD for object detection, which demonstrates that Pano-RSOD is a useful benchmark, and it provides a better panoramic image training dataset for object detection tasks, especially for small and deformed objects.

1. Introduction

Due to the wide availability of consumer-level panoramic video capturing and imaging devices, panoramic images are widely used in many fields [1,2,3,4,5,6]. For example, they are used in 360-degree object tracking [1,4], equirectangular super-resolution [3], privacy protection in Google Street View [5] and roadway inventory management about traffic signs [6]. Object detection based on panoramic images is one of the key technologies to make panoramic images widely applied. In intelligent transportation systems, the technology of object detection in panoramic images (with a wide field of view) can help autonomous driving assistance systems (ADAS) and autonomous navigation for unmanned aerial vehicles (UAV) detect the objects (e.g., vehicles, pedestrians) around the vehicle. From a map navigation perspective, panoramic maps, e.g., Baidu and Google among others, which are constructed by panoramic images, can express richer information such as location and scene. However, the information of pedestrians and vehicles in the panoramic map involves personal privacy and the speed of the private information removing or blurring based on manual methods is relatively slow. Efficient and automatic object detection methods can be realized by deep learning for panoramic image object detection. Reference [5] proposed a probabilistic search algorithm to boost the efficiency of face detection in Google Street View so as to protect personal privacy. In smart city management and virtual reality, some object information can be retrieved and located through panoramic object detection. It can be seen that the research on panoramic object detection has important practical significance.
All of the research of panoramic object detection relies on a large-scale, high-quality training dataset. Although a variety of public datasets, e.g., PASCAL VOC [7], ImageNet [8] and COCO [9] are available for the identification and segmentation of multiple objects, they aim at generic object detection, not specific for panoramic object detection. Considering the difference between traditional images and panoramic images, the models pre-trained on the generic datasets are unsatisfactory commonly when directly applied in panoramic object detection. In addition, although there are also some street-view object detection datasets (including KITTI [10], Caltech Pedestrian Dataset [11] and UA-DETRAC Dataset [12]), these datasets mainly used for vehicle or pedestrian detection, street-view semantic and instance segmentation (including Mapillary Vistas [13], Cityscapes [14] and Apoloscape [15]). The publication of these datasets undoubtedly promotes the development of object detection. However, the public datasets specific to panoramic road scene object detection are still unavailable.
Moreover, to the best of our knowledge, there is no special object detection algorithm for panoramic images at present. The previous methods mainly use traditional hand-craft features, e.g., the histogram of oriented gradient (HOG), scale-invariant feature transform (SIFT), or the existing object detection methods based on transfer learning (e.g., pre-training in ImageNet [8] or COCO [9]). For example, Reference [16] adopted the detectors based on HOG algorithm to detect traffic signs from street-level panoramic images. Reference [17] used Faster Region-based CNN (RCNN) to detect object from indoor-level panoramic images.
Though much exciting progress on the object detection of road scenes has been extensively reported in recent years, there are two major issues that seriously limit the development of object detection in panoramic road scene images:
  • A lack of panoramic object detection datasets for deep learning. A panoramic image usually contains more objects and some distorted objects due to its special imaging mechanism, which is different from the ordinary. Therefore, an object detection task for panoramic images needs a new panoramic dataset to train and test for the purpose of adapting the differences.
  • Although the existing object detection methods of common images can be transferred to the panoramic object detection, there is a lack of model, evaluation statistics and benchmarks specifically for the panoramic object detection.
Aiming at the above problems, we construct a panoramic road scene object detection dataset (Pano-RSOD) and carry out experiments based on the state-of-the-art algorithms for object detection to construct a benchmark. The Pano-RSOD contains 9402 images and four categories objects, i.e., vehicles, pedestrians, traffic signs and guiding arrows. The constructed dataset is quantitatively and qualitatively compared with other datasets in several aspects, e.g., the number of object samples, the number of images, number of categories, resolution of images, the type of images and etc. Besides, we train five state-of-the-art detectors: faster RCNN (VGG-16) [18], faster RCNN (ResNet-101) [19], region-based fully convolutional networks (R-FCN) [20], YOLOv3 [21], and single shot multibox detector (SSD) [22,23]. The transfer learning method is adopted for the five detectors designed in this paper with the pre-trained models of ImageNet [8] and COCO [9]. Furthermore, the benchmark of Pano-RSOD is constructed.
In summary, the major contributions of this paper are as follows:
  • We present a novel and promising topic for panoramic road scene object detection, which will have potential applications in ADAS, UAV and panoramic mapping. Compared with the normal view, a panoramic view can cover a larger perspective and contain more objects in one single image. It could be possible to cover some complicated situations which are not covering in the most existing datasets. And the object detection on the online panoramic map is challenging. Thus, a panoramic road scene dataset is needed and important. In order to provide more research foundation for solving the object detection in panoramic image problems, related object detection methods and datasets are compressively overviewed (Section 2).
  • We construct a high-resolution, panoramic road scene object detection dataset (Pano-RSOD) with more annotations and small object diversity. The data set is, to the best of our knowledge, the first high-resolution panoramic road scene dataset and the images are with high intraclass diversity. The dataset can provide a better experimental dataset for the object detection algorithm based on the panoramic image. Besides, the dataset can also evaluate the advantages and disadvantages of object detection algorithms, which aimed at small and deformed objects (Section 3).
  • We introduce the baseline methods of the object detection (Section 4), and compare several state-of-the-art object detection algorithms, i.e., faster RCNN [18,19], R-FCN [20], YOLOv3 [21], SSD [22,23] trained with Pano-RSOD. These can serve as the baseline results for the future work (Section 5).

2. Related Works

This section mainly discusses the object detection datasets of road scene and networks for object detection. Thus, we summarized the related works from these two aspects.

2.1. Existing Object Detection Dataset of Road Scene

Usually, vehicles, pedestrians, traffic signs, etc. are the most common objects in road scenes. The detection of these objects has very broad applications. The most common datasets including the above objects are as follows:
  • Pascal VOC Dataset [7]: This dataset is used as a standardized dataset for image detection and classification. There are two versions of voc2007 and voc2012. voc2007 has a total of 9963 images, and voc2012 has a total of 17,125 images. They include 20 categories to be detected, e.g., cars, pedestrians and etc. The image size in the dataset is different, and the horizontal image size is about 500 × 375 pixels, and the vertical image size is about 375 × 500 pixels. Each image corresponds to an xml format label file, which records the image size, ground-truth of object coordinates and other information. This dataset is widely used as an evaluation criterion in various object detection algorithms [18,20,21,22,24,25].
  • Object Detection Evaluation 2012 [10]: This is a dataset for 2D object detection and azimuth estimation in the KITTI database. It consists of 7481 training images and 7518 test images. A total of 80,256 objects are marked, covering the car, pedestrian and cyclist. Among them, the precision-recall (PR) curve is used for object detection evaluation. The dataset has a wide range of applications in vehicle detection and pedestrian detection due to a large number of car and pedestrian samples in the dataset.
  • Pedestrian Detection Dataset: Pedestrian detection is one of the important tasks in the fields of video surveillance and automatic driving. Therefore, the pedestrian detection dataset also plays an important role in evaluating various object detection algorithms. The INRIA person dataset [26] was created by Daal, where the training set contains 614 positive samples (including 2416 pedestrians) and 1218 negative samples, and the test set contains 288 positive samples (including 1126 pedestrians) and 453 negative samples. The dataset is currently used widely in static pedestrian detection. The NICTA Pedestrian Dataset [27] is a larger static pedestrian detection dataset at present. There are 25,551 images containing single pedestrian, 5207 high-resolution images containing non-pedestrian. The training set and test set have been divided to facilitate the comparison of different classifiers in the database. The Caltech pedestrian dataset [11] is currently a large pedestrian database, which is captured by a car camera in the urban traffic environment. The dataset is a video about 10 h, and the resolution is 640 × 480, 30 frames per second. The dataset labels about 250,000 bounding boxes (including 350,000 rectangles and 2300 pedestrians). In addition, there are other pedestrian detection datasets, such as ETH [28] and CVC [29].
  • Vehicle Detection Dataset: Vehicle detection is a key step in vehicle analysis, and it is the basis for subsequent vehicle identification and vehicle feature recognition. Earlier, there is CBCL Car Database [30] created by MIT, which contains 516 images in ppm format with a resolution of 128 × 128, mainly using for vehicle detection. The UA-DETRAC dataset [12] is a larger vehicle detection and tracking dataset. It contains 10 h of video taken at different locations in Beijing and Tianjin, China. The resolution of video is 960 × 540, and the frame ratio is 25 frames per second. The dataset labels 8250 vehicles and 1.21 million object bounding boxes. BIT-Vehicle Dataset [31] covers 9850 images of bus, microbus, minivan, sedan, SUV, and truck, which can be used to evaluate the performance of multi-class vehicle detection algorithms.
However, public datasets specific for panoramic image detection remain unavailable. Therefore, the need for panoramic image detection dataset has become more urgent.

2.2. Object Detection Methods

The field of image classification by deep learning has great breakthroughs, and it also promotes the field of object detection to make great progress. Especially the convolutional neural network (CNN) plays a very important role in feature extraction [32]. Girshick et al. proposed regions with CNN features (RCNN) [33] in 2014, which applied CNN to object detection. Its extensions, fast RCNN [34] and faster RCNN [18] further improved the detection speed. After that, R-FCN [20], PVAnet [24], feature pyramid networks (FPN) [35], and mask R-CNN [36] have been improved and optimized on the basis of Faster RCNN, which improves the detection speed and accuracy. In addition, in order to meet the real-time requirements of some scenes, Redmon et al. proposed a regression-based one-stage method YOLO [37] based on OverFeat [38] in 2015. Then they proposed its extensions YOLOv2 [39] and the latest YOLOv3 [21]. Another branch of the one-stage methods implements the approach with multiple feature layers to predict, such as SSD [22], Raindow SSD (R-SSD) [40], and Deconvolutional Single Shot Detector (DSSD) [25].
At present, the object detection methods using deep learning can be mainly divided into two major categories: two-stage detection framework and one stage detection framework [41]. The former firstly generates the proposals in the proposal stage, and then use CNN to classify these proposals. The latter has no proposal stage, and directly converts the problem of object positioning into regression problem. The comparison results of typical object detection algorithms based on deep learning are shown in Table 1.
A. two-stage detection framework.
RCNN is the basis of most current two-stage detection framework. It firstly uses the selective search [42] algorithm to generate candidate bounding boxes of interest. Then each proposal is sent to the CNN network for feature extraction to generate feature vectors. Finally, support vector machine (SVM) is used for classification. Its extension fast RCNN optimizes the runtime of the algorithm.
Faster RCNN further reduces the running time of the algorithm, and it designs the region of proposal (RPN) [18], which directly generates proposals without increasing the computation cost. This way end-to-end object detection can be achieved, and computational cost is reduced. Besides, the problem of algorithm accuracy reduction caused by excessive proposals can be avoided.
In addition, many two-stage methods have been improved based on Faster RCNN. For example, PVANet [24] optimizes the feature extraction network and proposes a lightweight network. Besides, R-FCN [8] introduces position-sensitive score maps on the basis of Faster R-CNN, and the feature sharing can be realized on the whole image and the detection speed is improved.
B. one-stage detection framework
Like YOLO [37], its upgraded version of YOLOv3 [21], SSD [22], DSSD [25] and other one stage detection frameworks have no obvious proposal stage. YOLO directly performs feature extraction, candidate bounding boxes regression and classification in the same convolution network. This method performs poorly for detection of small and multiple objects appearing in the same grid cell. Then, its extension YOLOv3 proposes the Darknet53 [39] and implements a multi-scale prediction method according to FPN [35] so as to obtain better predictions under the premise of speed increase.
SSD sets discretized and multi-scale default boxes on feature maps with different resolutions (SSD512 uses 7 layers). Meanwhile, small convolution kernels are added to each feature map as the final prediction layer to complete classification and the bounding box regression. DSSD changes the feature extraction network from VGG-16 [43] to ResNet-101 [19] to enhance the network feature extraction capability. At the same time, deconvolution is used to extract contextual semantic information so as to improve the detection accuracy of small objects.

3. Panoramic Road Scene Object Detection Dataset

3.1. New Dataset for Object Detection of Road Scene (Pano-RSOD)

Currently, there are many public datasets used for object detection, but most of them are not panoramic images. Besides, there are relatively few datasets of large traffic scene images. In recent years, with the development of panoramic imaging technology, panoramic images have had obvious advantages over traditional images in terms of overall scene perception. Then, panoramic image can be more widely used in digital cities, intelligent transportation and automatic driving. Therefore, we construct a panoramic road scene object detection dataset, namely, Pano-RSOD (Dataset link: https://pan.baidu.com/s/1H9RsXfXCCfBgpF2bY2LGeA).
The Pano-RSOD is captured from the streetscape of downtown Zhongshan City, Guangdong Province, China. It contains a total of 9402 images. The size of each image is 2048 × 1024 pixels. The labels are produced in PASCAL VOC format, including vehicles (50,255 bounding boxes), pedestrians (11,227), traffic signs (8622) and guiding arrows (17,438). Each image averagely contains about nine objects. For an easier representation of our dataset, we use a car, person, sign and line to represent vehicles, pedestrians, traffic signs and guiding arrows in the remaining of the paper.
In general, the Pano-RSOD is a multi-scale panoramic object detection dataset in road scenes, and there are more objects in a single panoramic image. Besides, the panoramic image contains a large number of small objects. It is also important to point out that objects in panoramic images are often accompanied by distortion. Therefore, the Pano-RSOD provides data sources for training, test and evaluation of object detection algorithms aimed at panoramic image, objects with distortion or small objects in road scenes. Some example images of Pano-RSOD are shown in Figure 1.

3.2. Dataset Construction

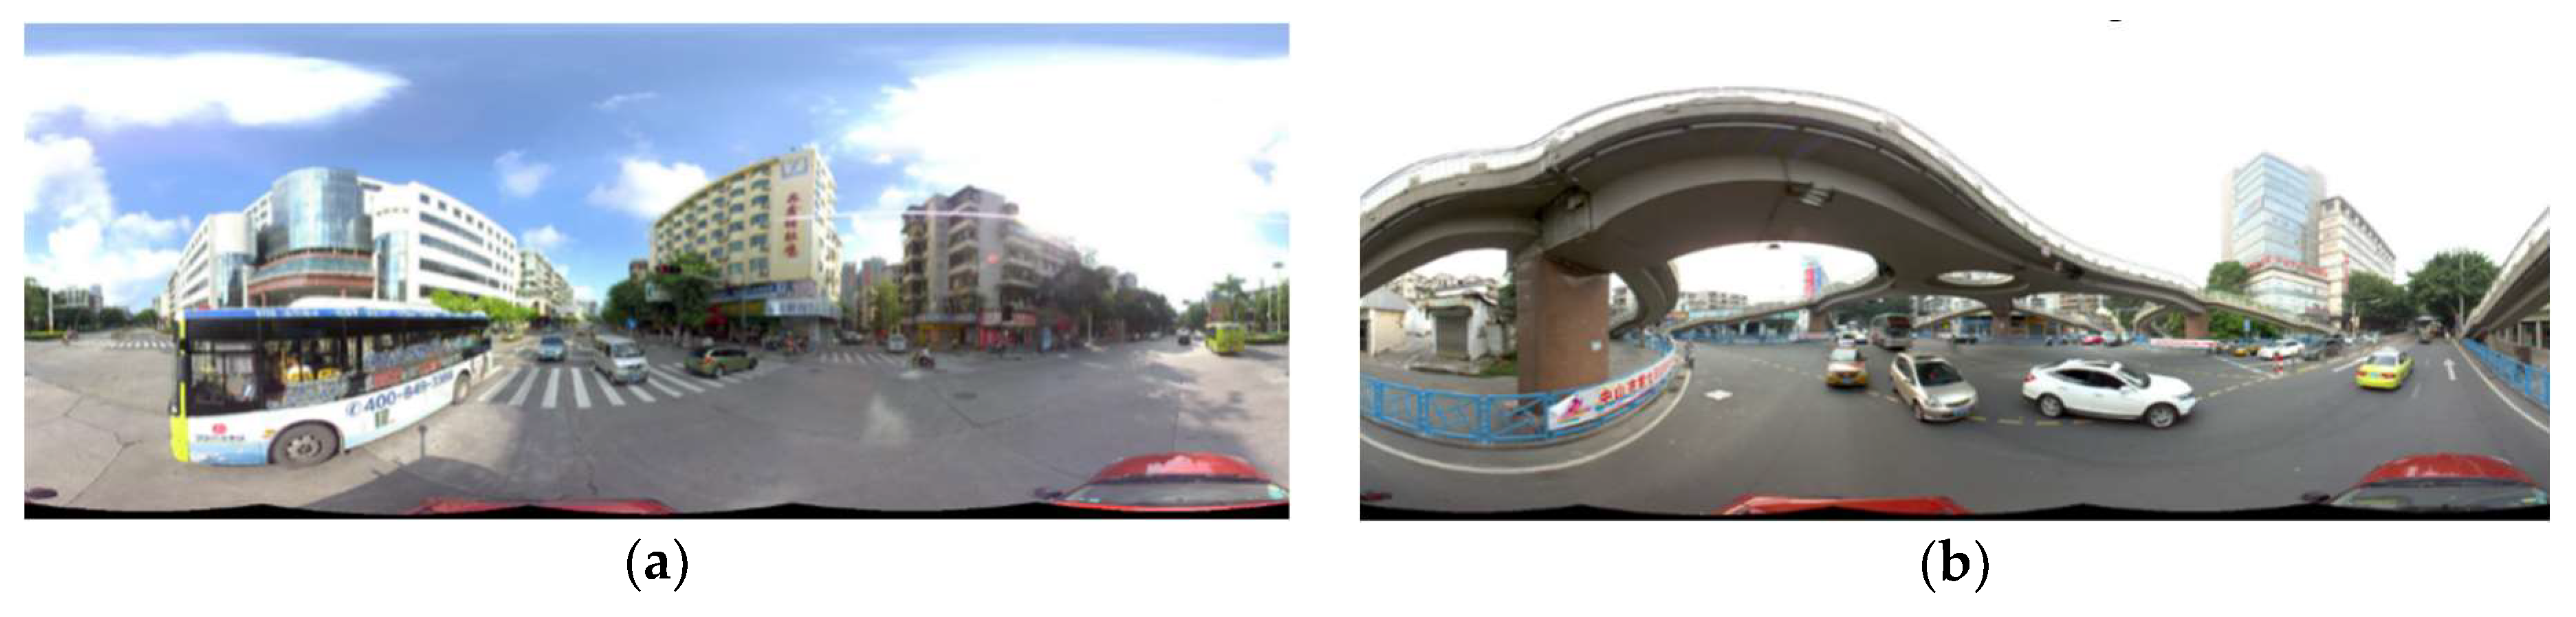
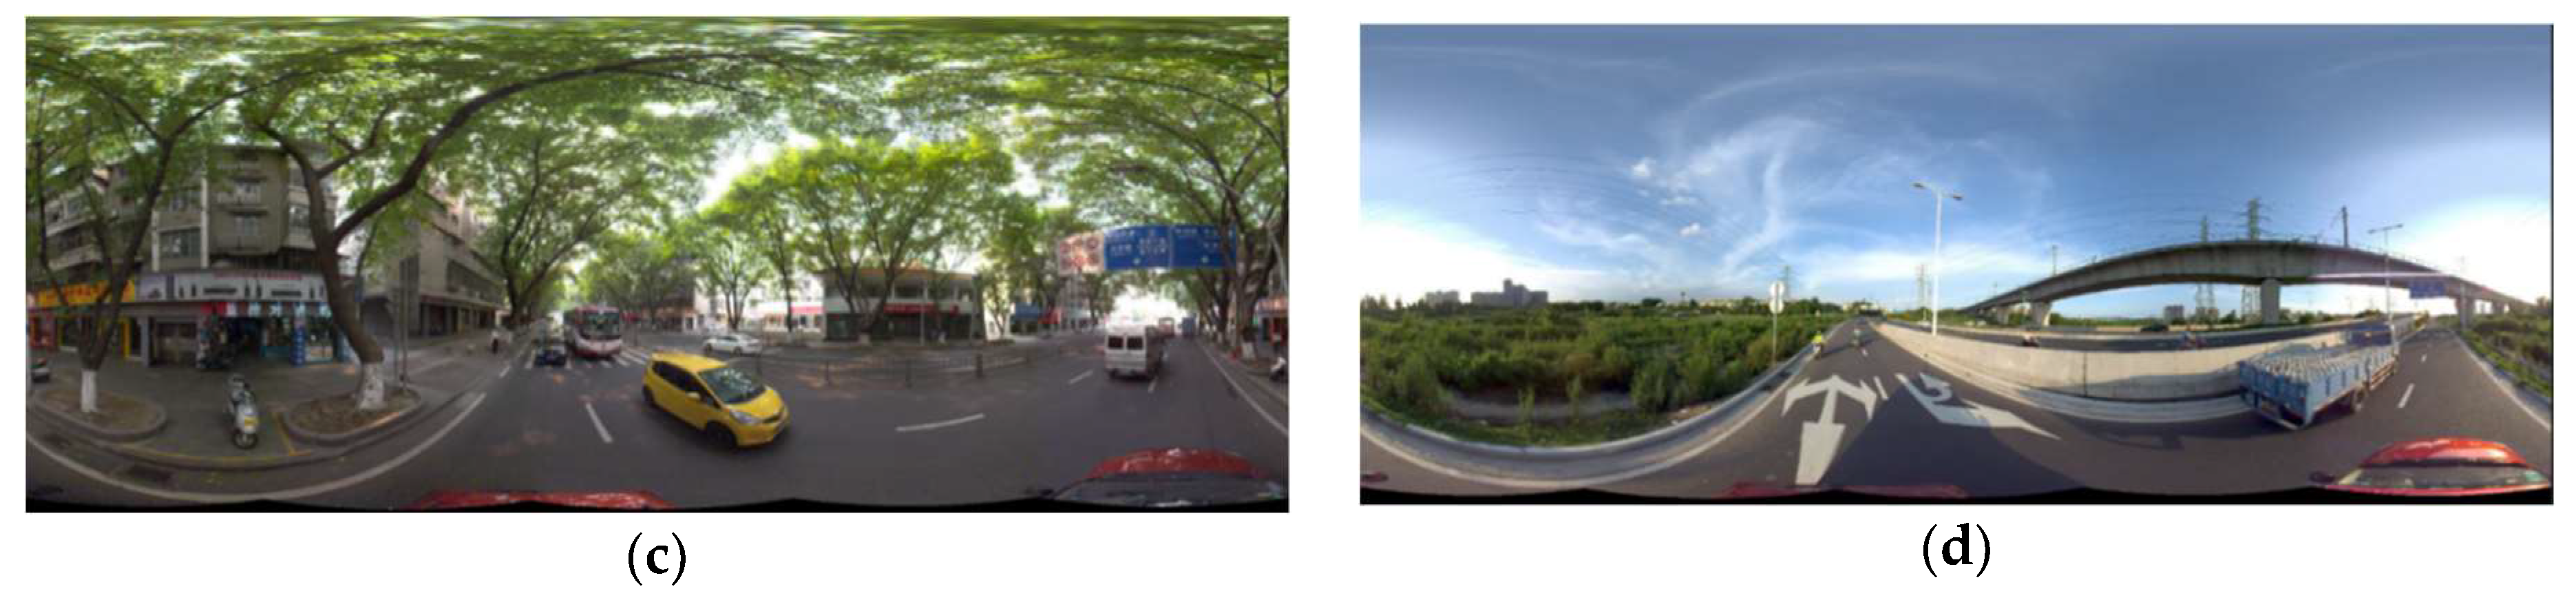
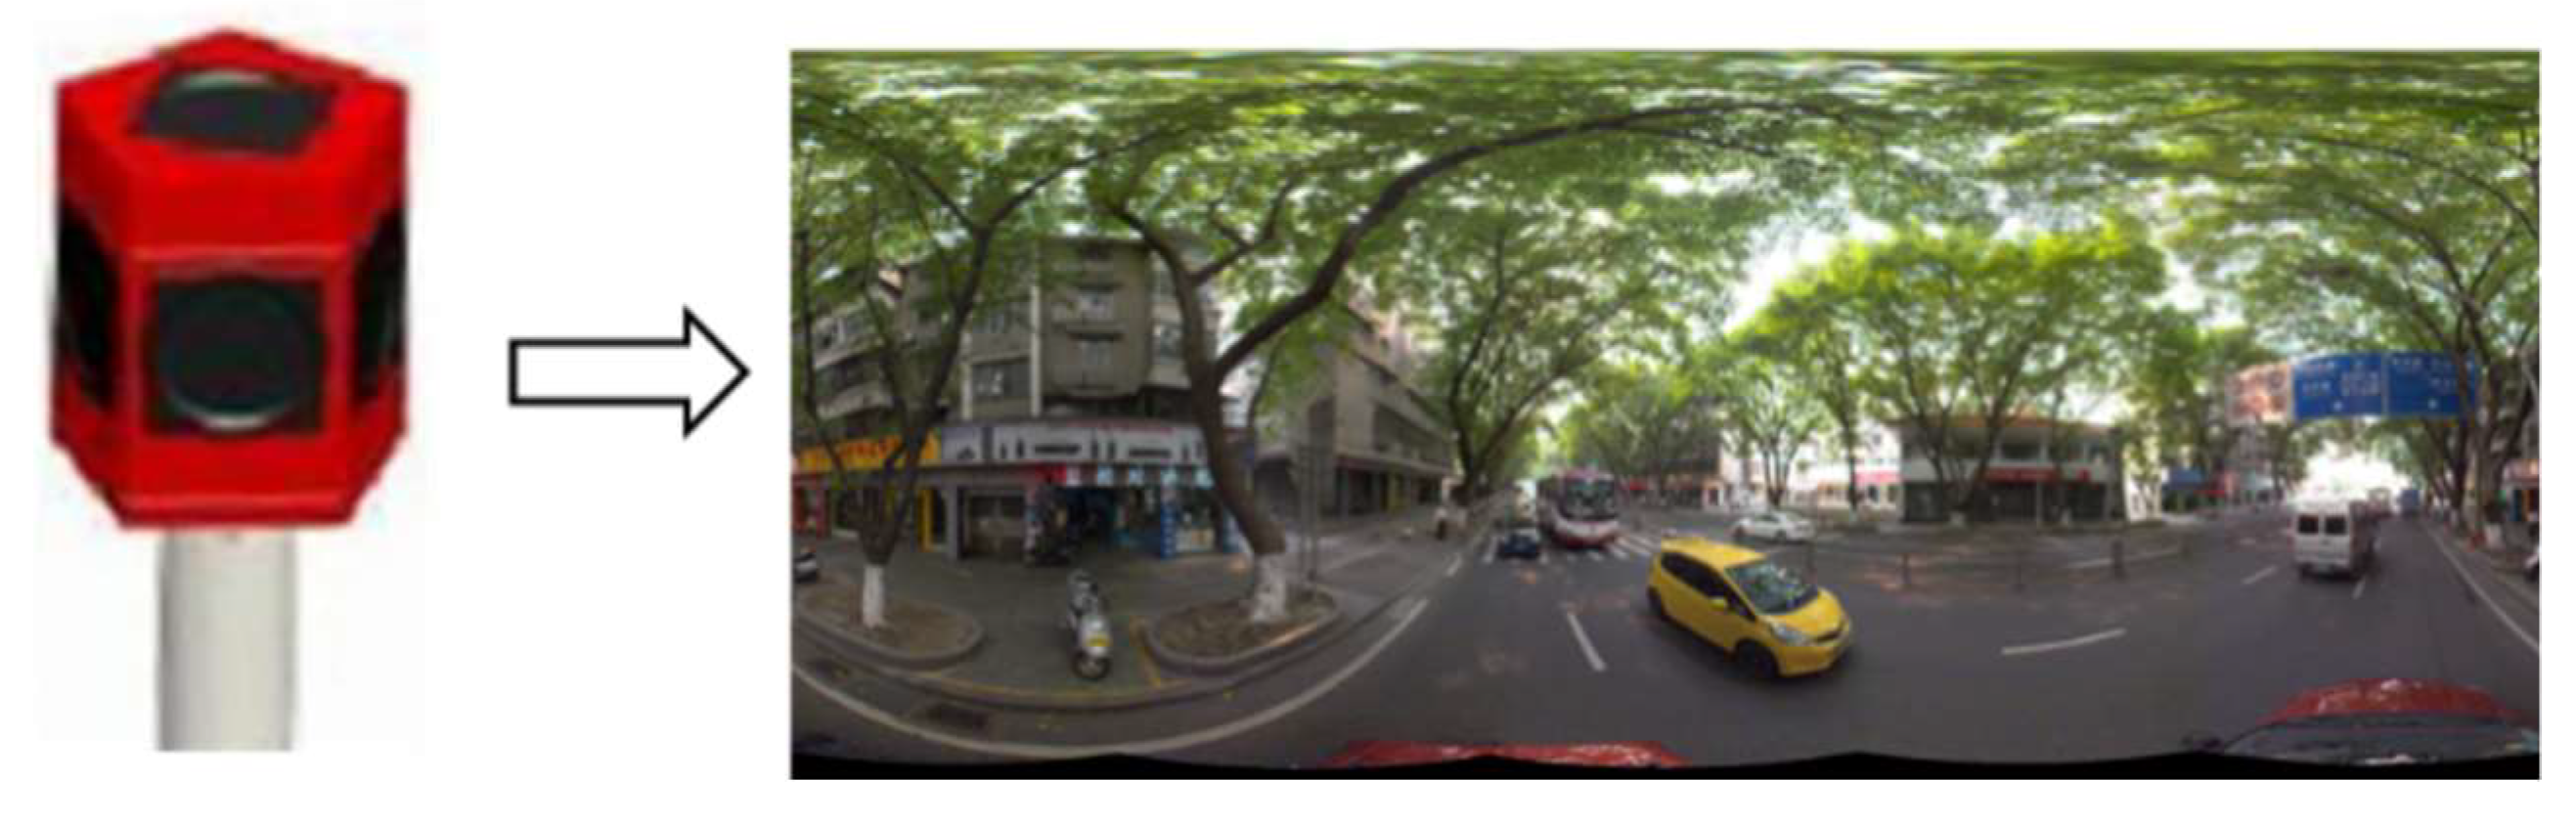
3.2.1. Panoramic Image Acquisition

In order to construct a road scene panoramic image dataset, a panoramic image acquisition system is constructed. The system is composed of a multi-camera panoramic vision system (i.e., Ladybug5) and a vehicle. The images are collected through the system by driving the vehicle in different road scenes. The panoramic image acquisition vehicle is shown in Figure 2.
The multi-camera panoramic vision system uses multiple sub-cameras distributed in different orientations to acquire image information that can be perceived by the current viewpoint. The panoramic image of the Ladybug5 satisfies the spherical camera theory, which can establish the projection relationship between each sub-image and panoramic image. As shown in Figure 3, the right panoramic image can be acquired by the left multi-camera panoramic vision system. The multi-camera panoramic vision system provides high-resolution, dead-band panoramic images with the synchronization and fast speed of data acquisition.
In the process of panoramic image acquisition, we record the location of image collection, i.e., the name of the road. The images of the training set, the validation set and the test set of the Pano-RSOD all come from different roads of the city to avoid the repetition. In addition, in order to avoid images having large similarities in the same set, every 15 frames of the image sequences are firstly adopted for dataset construction, and we manually remove images with large similarities.

3.2.2. Dataset Labeling

Making dataset labels is an important part of image classification, object detection and segmentation results. The quality of label making is directly related to the final accuracy of the training model. In this paper, we use an open source image annotation tool on GitHub, namely, LabelImg (https://github.com/tzutalin/labelImg). The output is the xml file, which is the same as PASCAL VOC [7].
In the field of intelligent transportation and panorama mapping, the detection of vehicles, pedestrians, traffic signs and guiding arrows often plays an important role. Thus, this paper selects those four most common objects in traffic road scenes to label. When labeling, we try to completely cover the object with the rectangular bounding box. Besides, car class only labels vehicles with four wheels, person class contains any people, e.g., walking, standing, sitting or riding people, sign class includes any traffic sign in the traffic scene, line class only labels all kinds of guiding arrows on the roads.
In order to build high quality datasets, we set strict control over the data labeling process. Ten researchers who study the object detection are asked to process the data. These ten researchers are divided into two groups on average. For each image, five researchers (the first group) are arranged to manually annotate the images, including the object category label and the coordinates of the rectangular box. After all the images have been labelled, we asked the other five researchers (the second group) to check the labelled data. Then, the voting method determines whether to pass the verification. If more than three persons pass the vote, the image is verified to pass. Otherwise it is relabeled until the checking passes. In the end, we have labeled 4 categories with a total of 87,542 object bounding boxes.

3.2.3. Dataset Statistics and Analysis

Our road scene panoramic image dataset contains a large number of labeled samples. Each class has sufficient samples (the minimum number of samples for a category is more than 8500). The sample information of the vehicle is the most abundant, and the minimum number of traffic signs is more than 8500. Moreover, each type of sample is acquired from different road traffic scenarios, such as a city intersection, suburban road, and urban road, which can provide rich foreground and background feature information for CNN feature extraction. In addition, the dataset contains a large number of small objects and objects with occlusion and overlap. This can increase the difficulties of the object detection task, which can also help us evaluate the advantages and disadvantages of the object detection algorithms. Figure 4a counts the number of objects for each type of dataset. Figure 4b counts the number of objects at different scales. Specifically: approximately 37% of objects are small (scale ≤ 32), 56% are medium (32 < scale ≤ 128), and 7% are large (scale > 128).
The Pascal VOC dataset has a relatively small image size and few object types. Besides, there are relatively few traffic scenarios and traffic objects. Compared with UA-DETRAC Dataset [12] and BIT-Vehicle Dataset [31], the Pano-RSOD includes richer background information, and it covers different traffic road scenes such as urban road, crossroad, overpass, and suburban road, which can maximize the diversity of the background. In addition, most of the pedestrian and vehicle datasets are only for a single type of object, and the number of objects in the scene is relatively small, which is not suitable for object detection in complex traffic scenarios.
Compared with Pascal VOC Dataset which contains relatively few traffic scenarios and traffic objects, the panoramic images in the Pano-RSOD are high-resolution, and the average number of objects per image is up to 9, so that the object detection is not needed to use more images to train. Compared with 10,053 labeled vehicles in BIT-Vehicle Dataset, Pano-RSOD contains up to 50,255 labeled vehicles (with wider scale), which can be used for vehicle detection and other tasks. Compared with UA-DETRAC Dataset, the Pano-RSOD includes richer background information, and it covers different traffic road scenes such as urban road, crossroad, overpass, and suburban road, which can maximize the diversity of the background. In contrast with cityscapes dataset [13], mapillary vistas (Images with strong wide-angle view or 360-degree images were removed) [14] which are both used for semantic street-level understanding, the images in Pano-RSOD have a 360-degree angle of view instead of single view, so that they can contain more objects with various scales and perceive the whole road scene in single image. Of course, other datasets are not panoramic images that are essentially different from Pano-RSOD, and we just give roughly qualitative comparison. Table 2 lists the comparison results of the Pano-RSOD and the existing object detection datasets. Compared with other road scene object detection datasets, the dataset of this paper has the following characteristics:
  • Panorama: According to the information collected from the Internet, the current public object detection datasets are basically not panoramic images, but our road scene panoramic dataset can provide a good reference for the panoramic technology applied in the object detection. Besides, objects in panoramic image often have distortion which provides a challenge for object detection task.
  • Large-scale and high resolution: According to the comparison results in Table 2, the Pano-RSOD has more labeled sample sizes, especially with the most abundant vehicle information. Besides, the Pano-RSOD has higher image resolution.
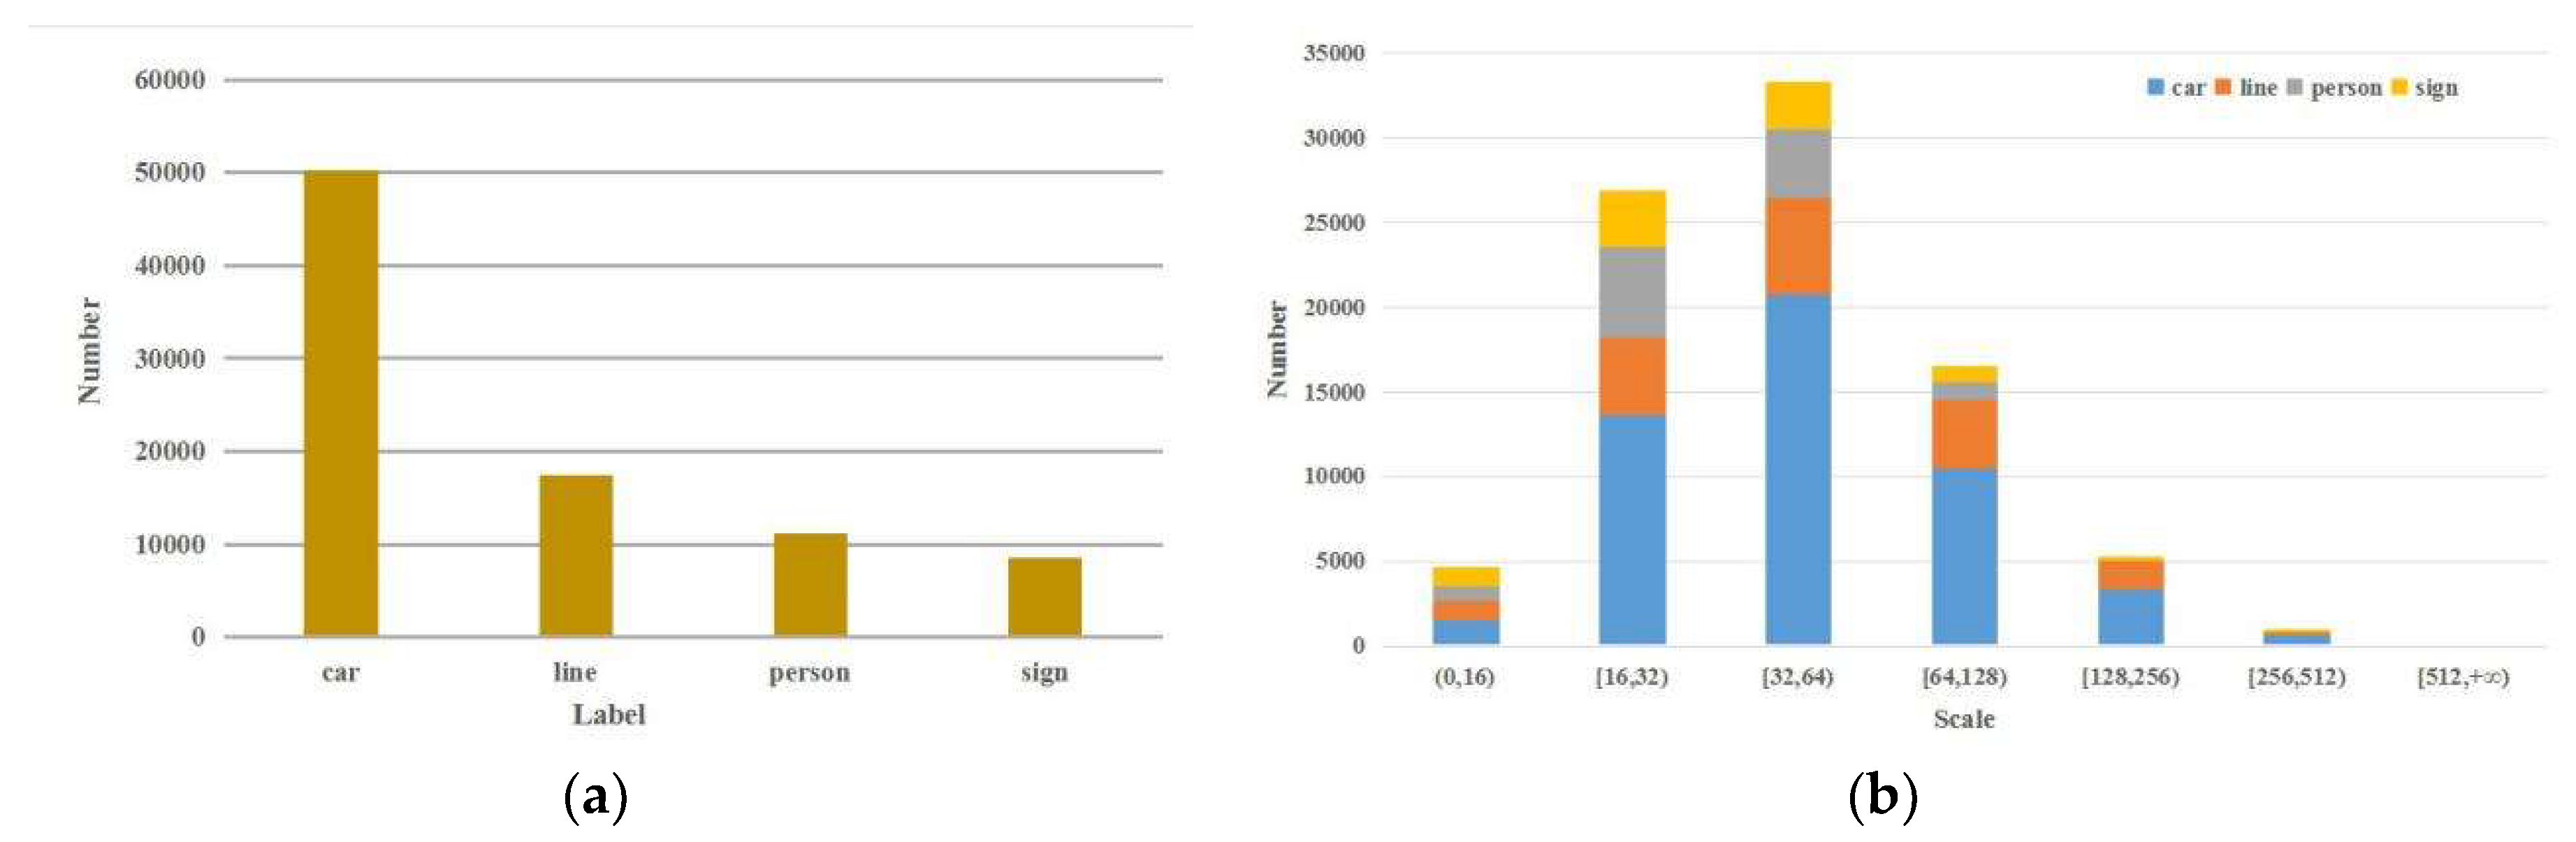
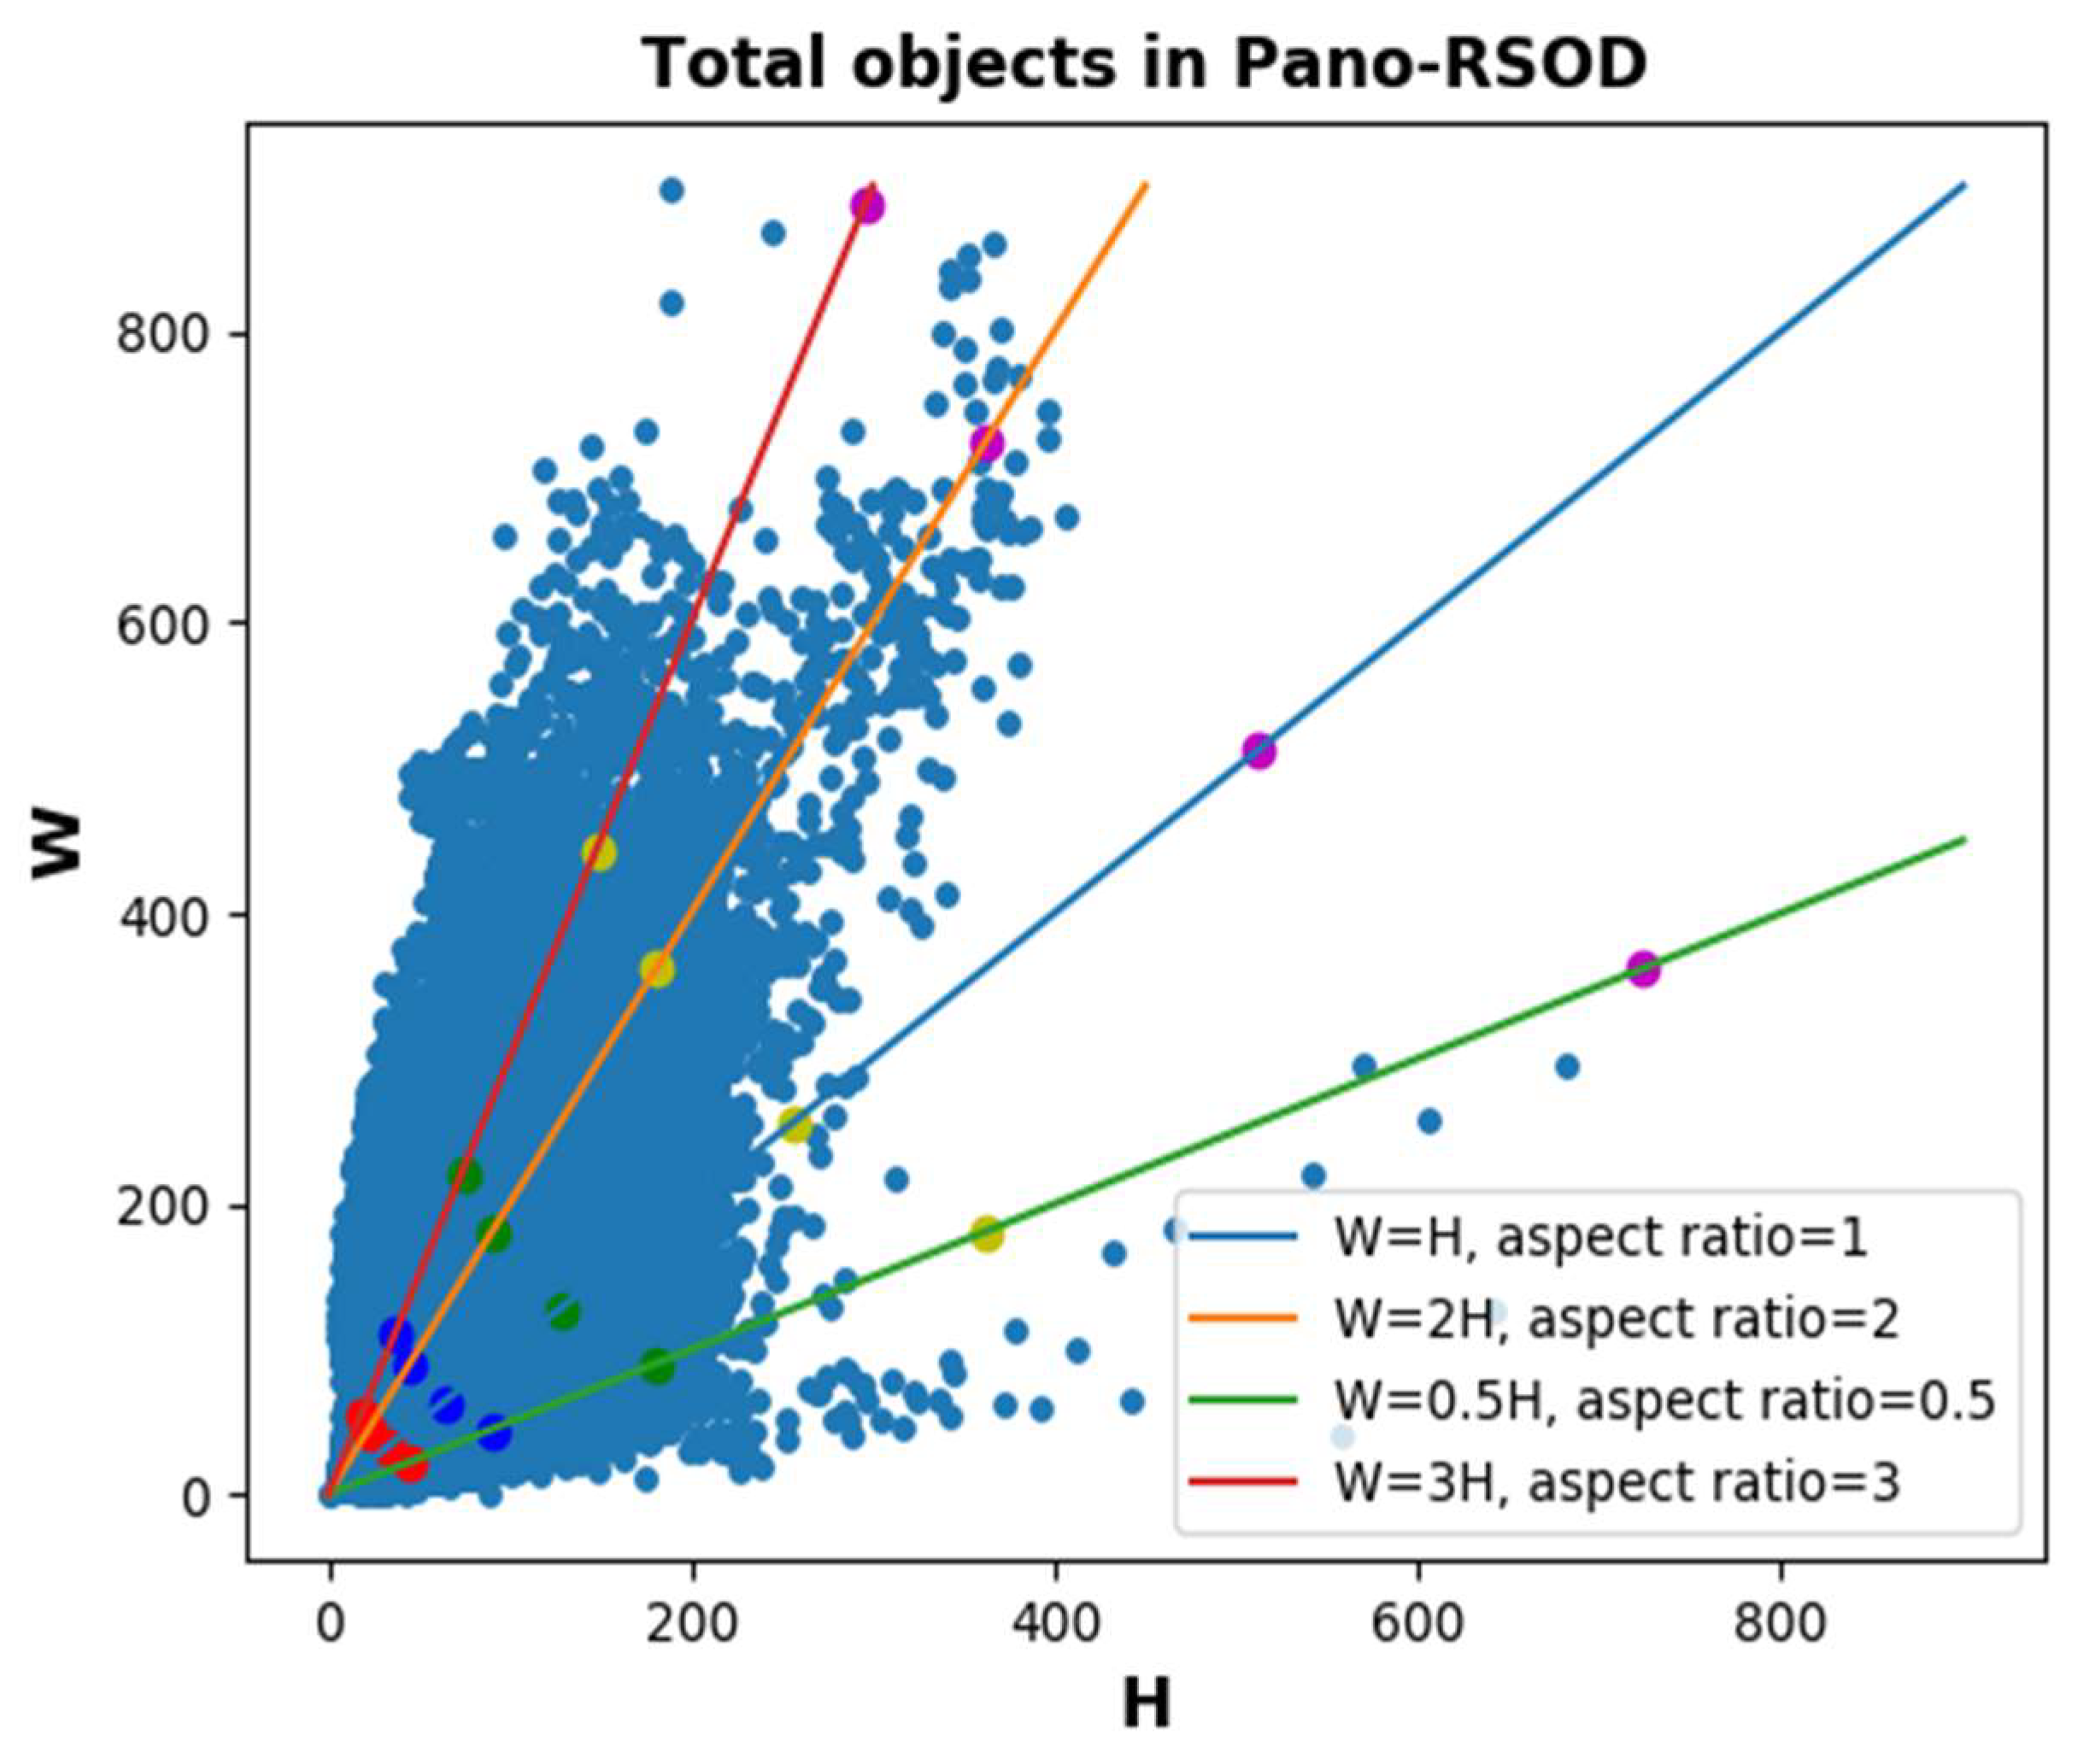
  • Multi-scales and more small objects: As can be seen from Figure 4b, the Pano-RSOD has a wide range of scales. Especially for small objects, it has as many as 31,579 samples with a scale less than 32.
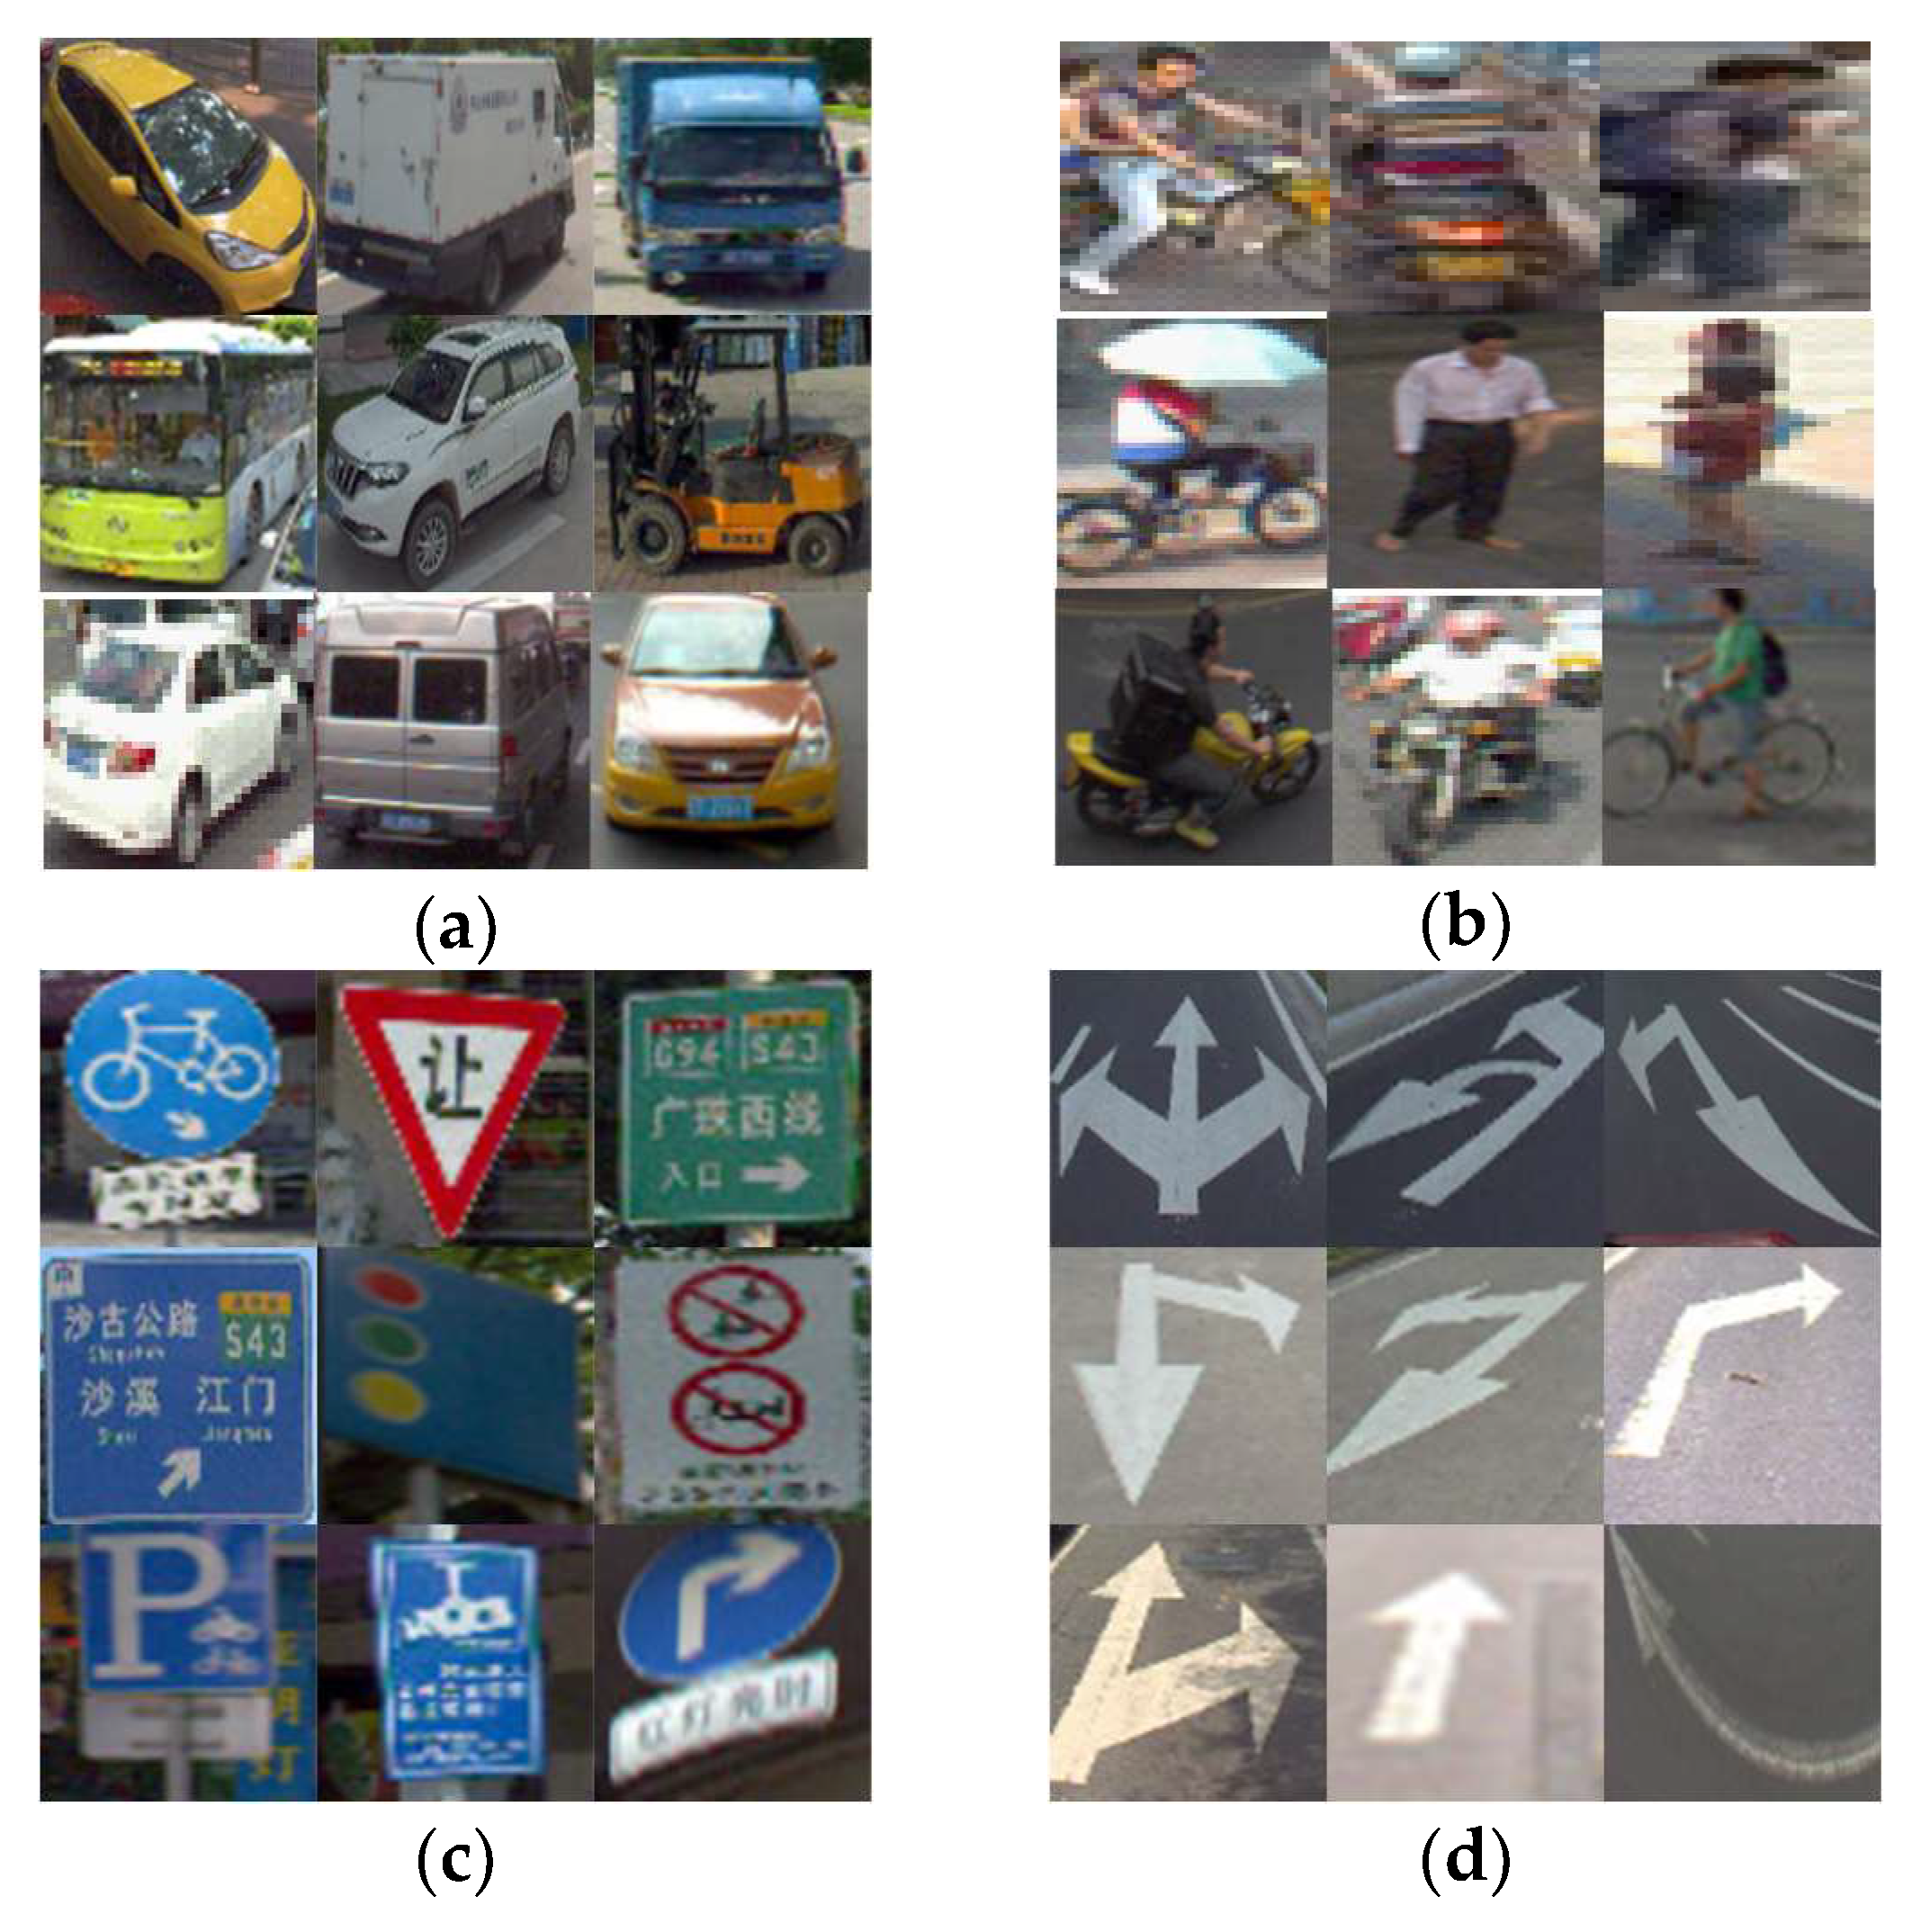
  • Diversity: Figure 5 lists the objects of different types of labels in the Pano-RSOD. As shown in Figure 5, the Pano-RSOD is rich in object types. For instance, vehicle samples cover different types (e.g., truck, sedan, bus, SUV, taxi, etc.), orientations and scales, person samples include cycling, walking, standing, crowded people, traffic sign samples contain different shapes, sizes, colors and contents, guide arrow samples have different shapes, colors, and directions of representation.

4. Baseline Methods

Since the top rank methods for object detection in the PASCAL VOC or KITTI dataset has recently adopted a convolutional neural network, we chose the baseline methods based on CNN. In this section, we evaluate different object detection algorithms based on one stage detection framework and a two-stage detection framework reviewed in Section 2.2. A simple algorithm flow diagram about two kinds of methods used in this paper is shown in Figure 6.
Anchor box settings. In the training and prediction stages, the five baseline detectors in this paper use the method of pre-setting anchor boxes, which provide the reference for final prediction (bounding boxes). If the anchors are not set properly, it will inevitably lead to more positional regression errors. Therefore, it is especially important to set the anchors with appropriate scales and aspect ratios. In this paper, the data distribution of Pano-RSOD is statistically analyzed. The scale distribution is shown in Figure 4b. The length and width of object are clustered by K-means algorithm, as illustrated in Table 3. Since the number of objects detected in this paper is mainly divided into four categories, the number of clusters is set to be 4.
Considering the scale distribution of object as shown in Figure 4b, the aspect ratio after clustering as shown in Table 3, and the hardware conditions of the experiment, the scale of anchors in Faster RCNN and R-FCN is {32, 64, 128, 256, 512} and the aspect ratio is {0.5, 1, 2, 3}. Figure 7 shows the distribution of anchors in the dataset. It can be seen that the anchors with scales and aspect ratios used can cover the entire samples to a great extent. For the SSD, an additional convolutional layer is added on the basic feature extraction network InceptionV2 [23]. It generates a total of six feature layers to predict. The scale and aspect ratio settings of the anchors are calculated using the method of Ref. [22], and each prediction layer sets anchors with multiple scales and aspect ratios. YOLOv3 performed k-means clustering on the object sizes of the training set (using the IoU value as the distance indicator) [21] to set up 9 different anchors. Table 4 shows the detailed parameters settings for anchors of the baseline methods in this paper.
Better feature extraction network. Designing better feature extraction network can provide more information for object detection task. Compared with VGG-16, ResNet-101 has characteristics of low complexity, deeper network and higher accuracy for classification. Thus, we also use ResNet-101 instead of VGG-16 in the feature extraction network of Faster-RCNN and R-FCN to improve the feature extraction ability.
Training strategy and model parameters. We use SGD as backpropagation algorithm for the five detectors and stepwise reduce the learning rate. Considering the depth of the network and other factors for each detector, the proper iteration steps and initial learning rates are set to ensure the convergence of the network. For the relatively deep network, we set the smaller initial learning rate to avoid gradient explosion. The iteration steps of Faster RCNN (VGG-16 based and ResNet-101 based) and R-FCN are both 100 k steps, and the initial learning rates are set to 1 × 10⁻², 1 × 10⁻³ and 1 × 10⁻³, respectively. And then the learning rates are reduced to one-tenth of the original at the 80 k steps. The iteration steps of SSD and YOLOv3 are both 150 k steps. Their initial learning rates are 4 × 10⁻³ and 1 × 10⁻³, respectively. Then the learning rates drop to one-tenth of the original at 80 k steps. The selected hyper-parameters for the five detectors are shown in Table 5.

5. Experiments and Benchmark Statistics

In order to test the dataset and build a benchmark for the Pano-RSOD, we train and test the state-of-the-art algorithms (Faster-RCNN, R-FCN, SSD and YOLOv3) on the Pano-RSOD. Among the 9402 images of the datasets, 7000 images are manually selected as training set, 1000 images selected as test set, and 1402 images are used as validation set to detect four classes of objects, i.e., car, person, sign and line. The images of training set, validation set and test set are collected from different roads of the city, and they all cover urban and suburban scenes. In the experiment, the transfer learning method is implemented, and the network is fine-tuning with the pre-training model [44]. Faster RCNN(VGG-16) and YOLOv3 used the pre-training model based on ImageNet [8], and the other three detectors use the pre-training model based on COCO [9]. Besides, the training and testing images are resized to the fixed size 1024 × 512 pixels for all the detectors.
All evaluations are done on Intel Core i7-3930 k (3.80 GHz) CPU (24 GB memory), a single TESLA P100 GPU (16 G memory). YOLOv3 is carried out experiment based on Darknet framework while the other detectors based on Tensorflow framework.

5.1. Evaluation Metrics

Currently, the values of average precision (AP) and mean average precision (mAP) are used to evaluate the performance of the object detection algorithms [33,34,35,36,37,38,39,40]. In order to compare performance of the state-of-the-art object detection algorithms on the Pano-RSOD, we use AP and mAP to evaluate the detection results of each category and all categories for every learned model, respectively.
If intersection-over-union (IoU) of the detection result and ground truth bounding box is larger than the given threshold, the object can be detected, namely, true positive (tp). If multiple detection results matching with ground truth, the one with largest IoU is the tp, and others are false positives (fp). After matching all the detection results, all the ground-truth without detection results matched are false negatives (fn). All the detection results without ground-truth matched are false positives (fp). The equation of the AP calculation is as follow:
AP = 1 11 r { 0 , 0.1 , , 1 } m a x R ( c ) : R ( c ) r P ( R ( c ) )
where the recall R(c) = tp(c)/(tp(c) + fn(c)), P(R(c)) = tp(c)/(tp(c) + fp(c)), both for a given confidence threshold c, i.e., IoU.
mAP is calculated according to the AP of each category, and the calculation equation is as follows:
mAP = 1 n i = 1 n AP ( i )
where n is the number of object classes.
We use two metrics in the next evaluation, i.e., [email protected](PASCAL VOC’s metric [7]) and [email protected]:0.95 (COCO’s metric [9]). While the former is computed at a single IoU of 0.5, the latter are averaged over multiple IoU values, i.e., ten IoU thresholds from 0.5 to 0.95 with equal difference 0.5. All the abbreviated forms of AP and mAP refer to [email protected] and the mean of each [email protected] in the remaining of the paper.

5.2. Benchmark Statistics

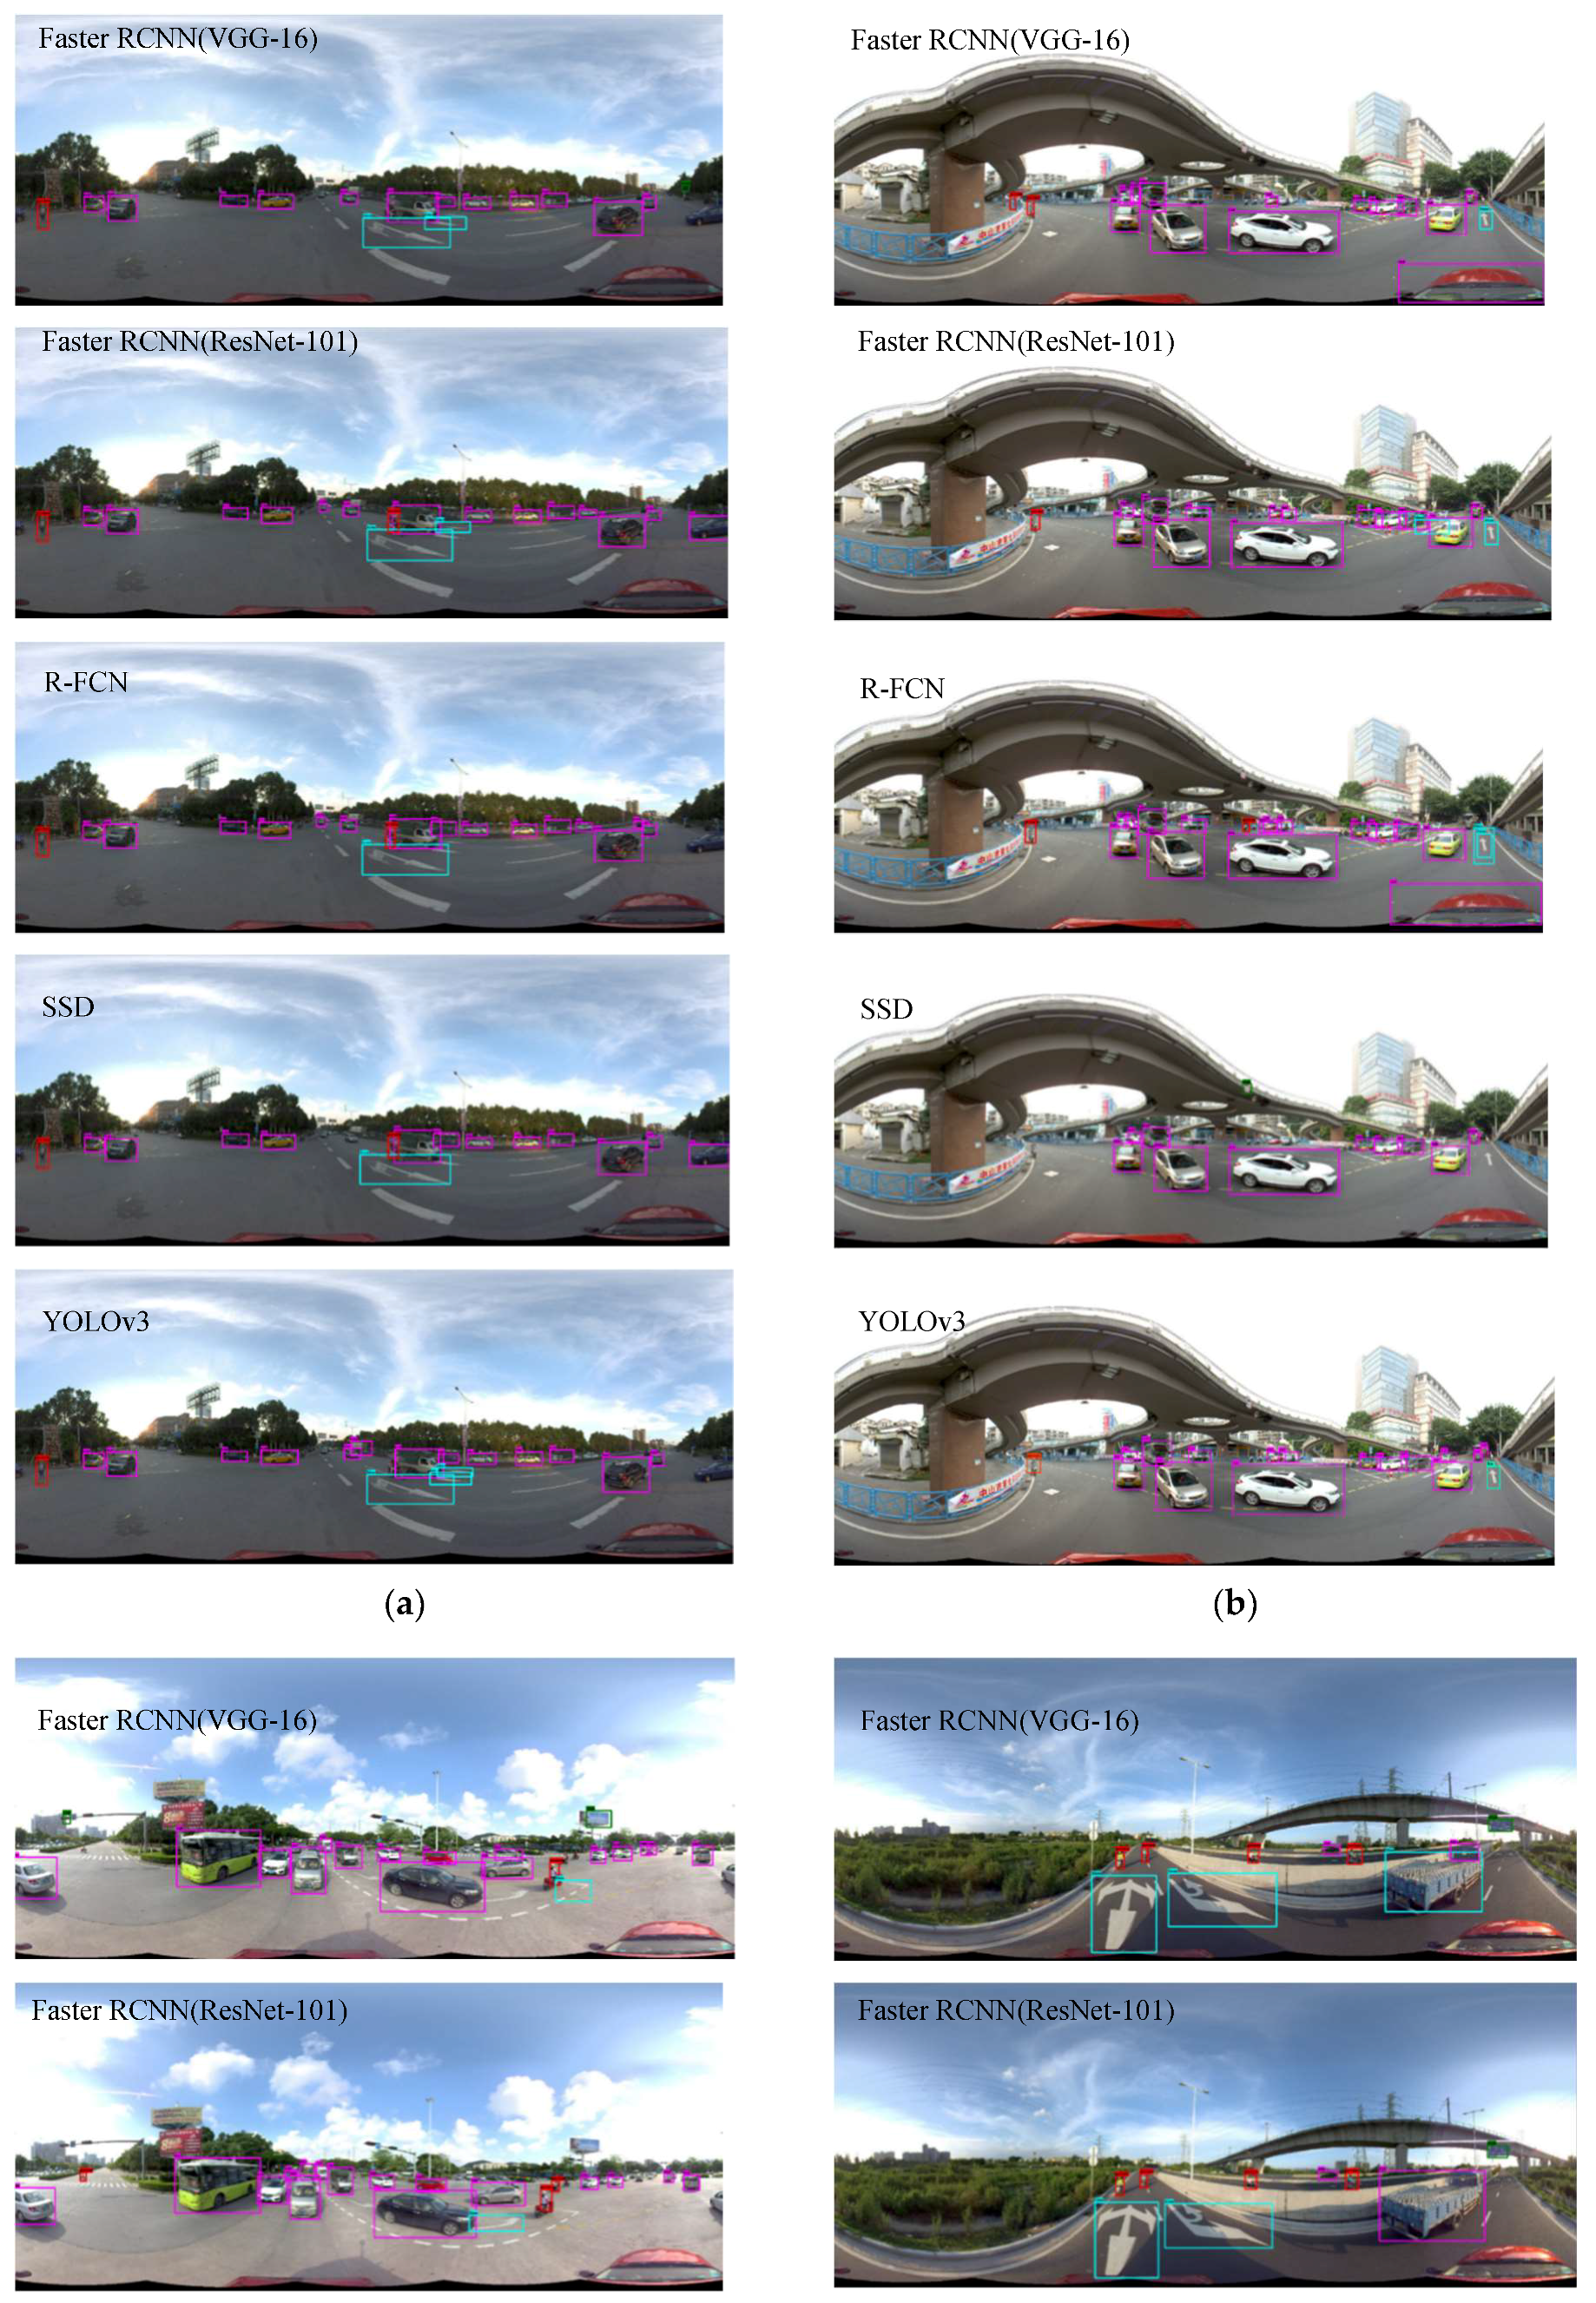
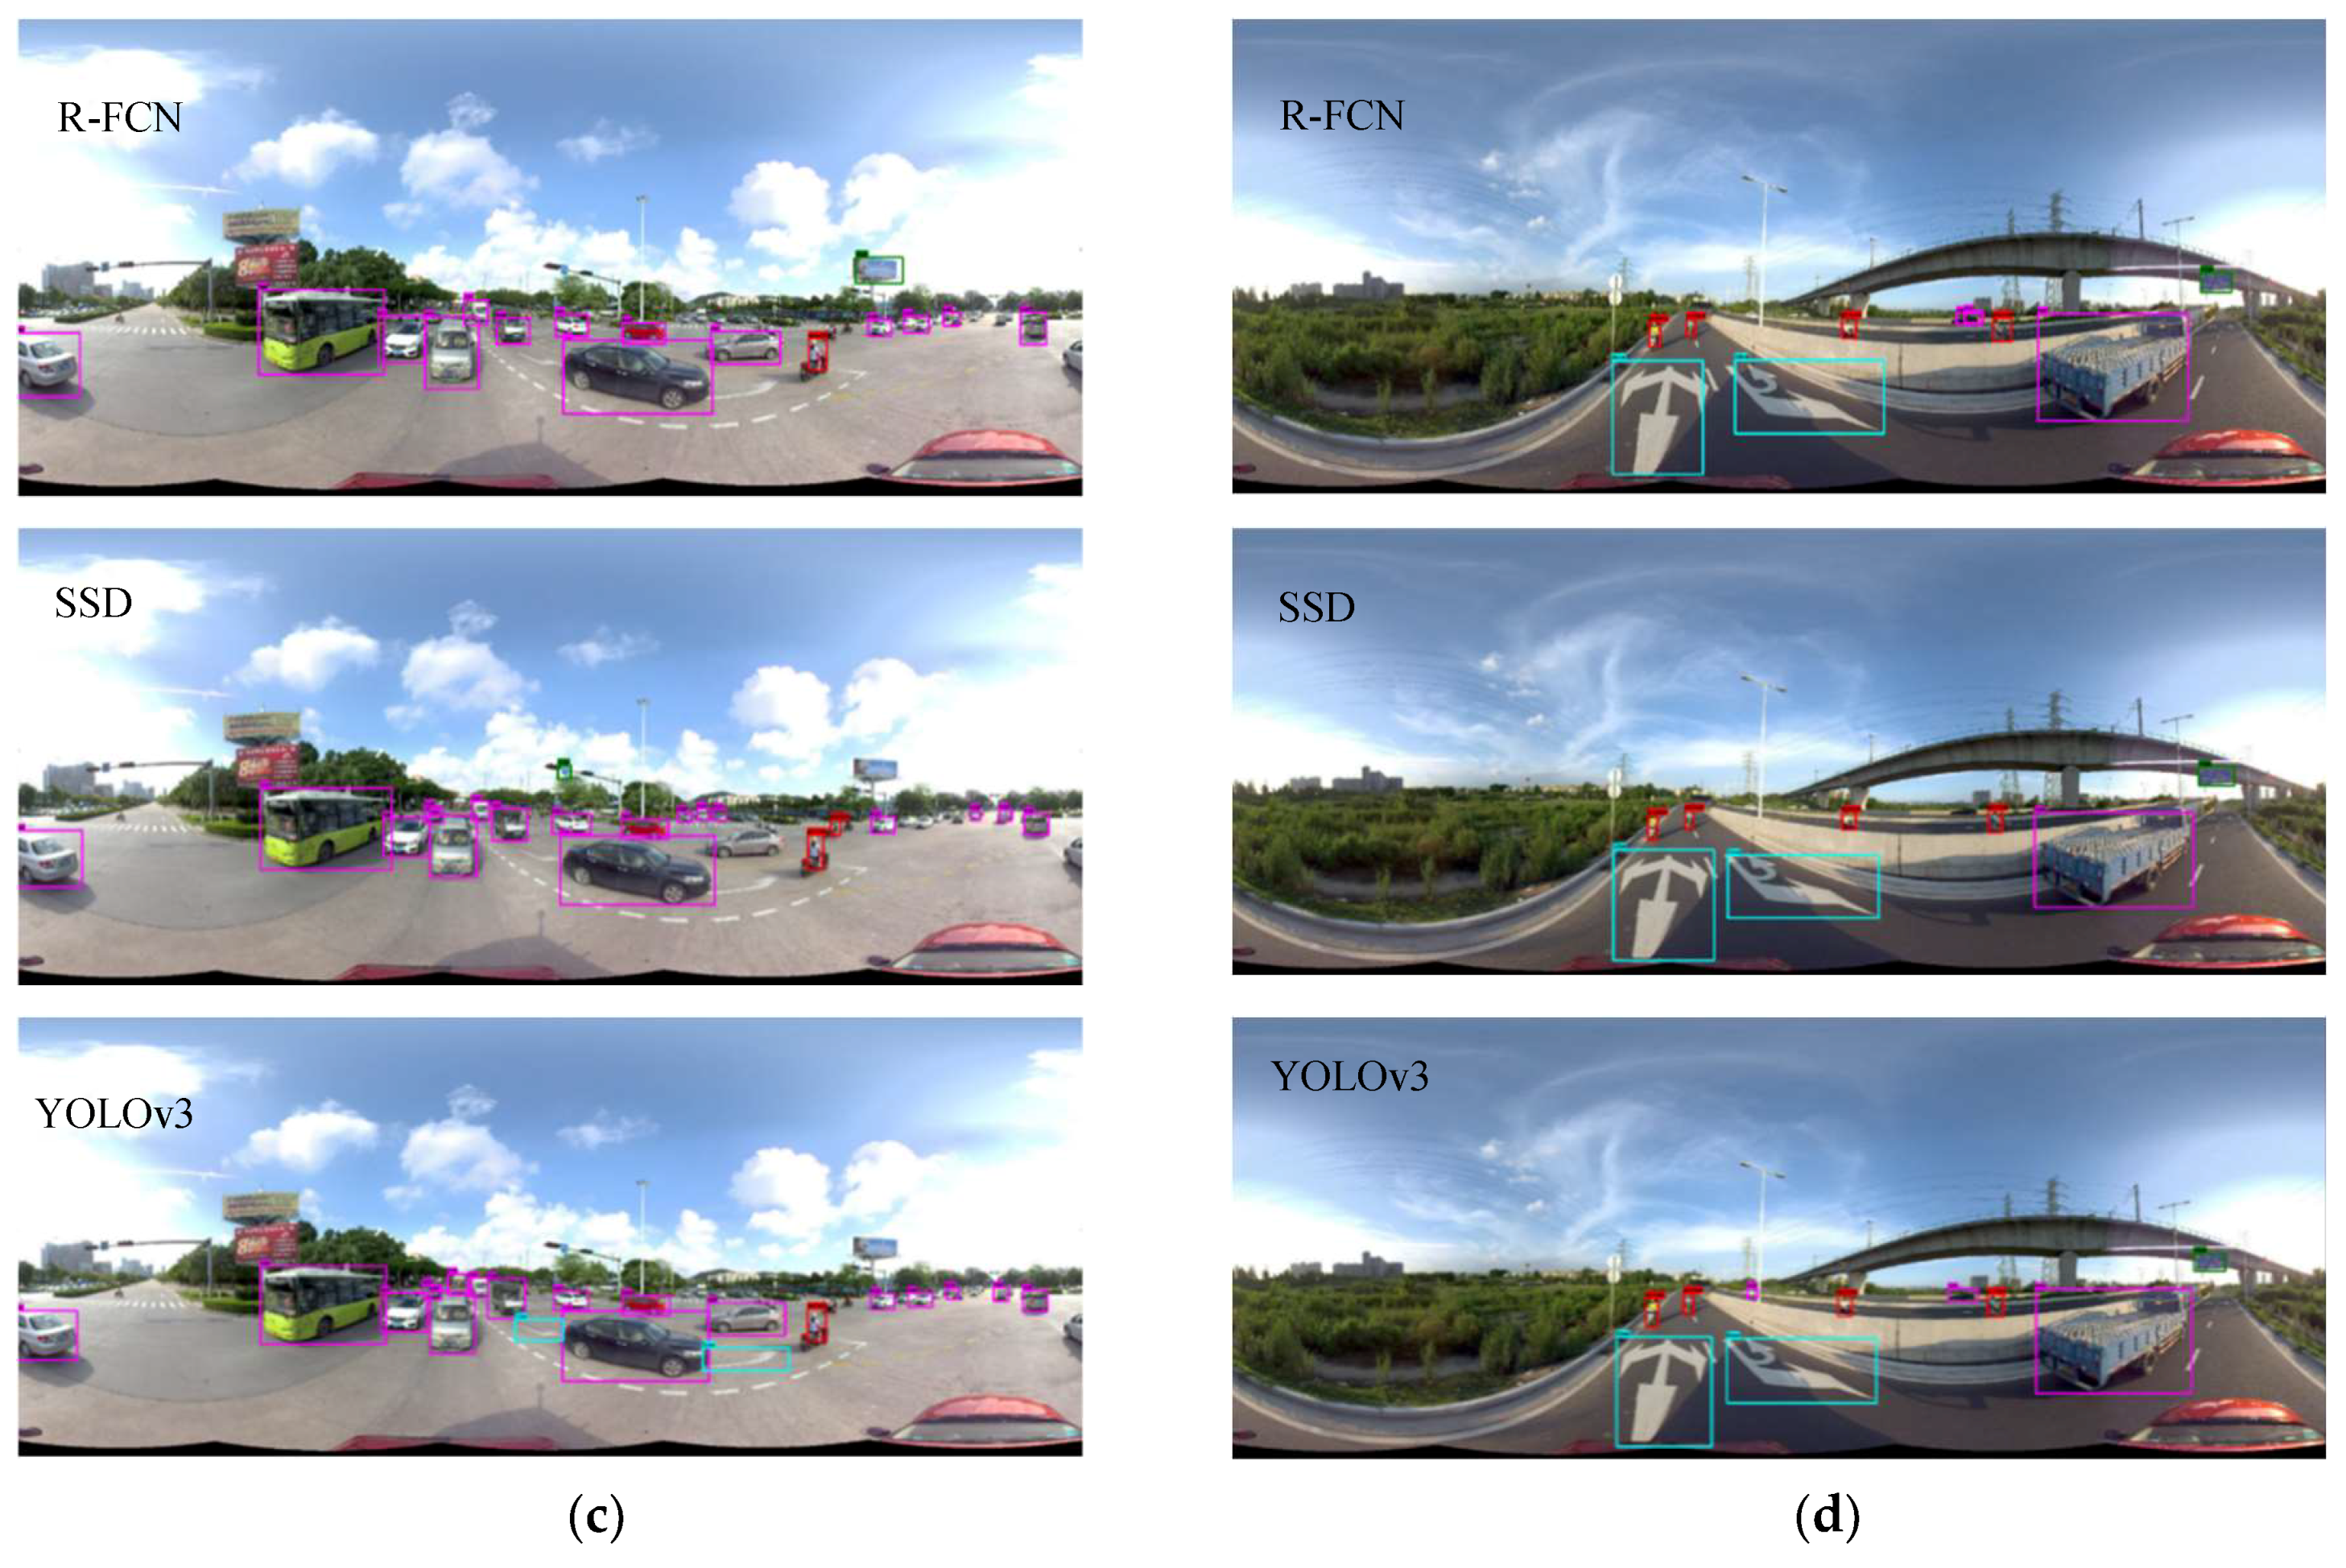
5.2.1. Qualitative Evaluation

In order to give a qualitative analysis of the performance of different detectors, we show the object detection results of the five baseline methods in four road scenes. As shown in Figure 8, the detection results for small objects are not performed well by the baselines methods. Besides, there are some missing and false detection results. For example, as shown in Figure 8a, some vehicles with larger size are not detected by faster RCNN(VGG-16) and R-FCN. The advertising board is mistakenly detected as traffic sign by faster RCNN(VGG-16), as shown in Figure 8c. This also reflects the diversity of background information in Pano-RSOD, which poses a severe challenge to object detection in large scene. Thus, how to correct the background and foreground is still the key task to improve the detection performance of our dataset.

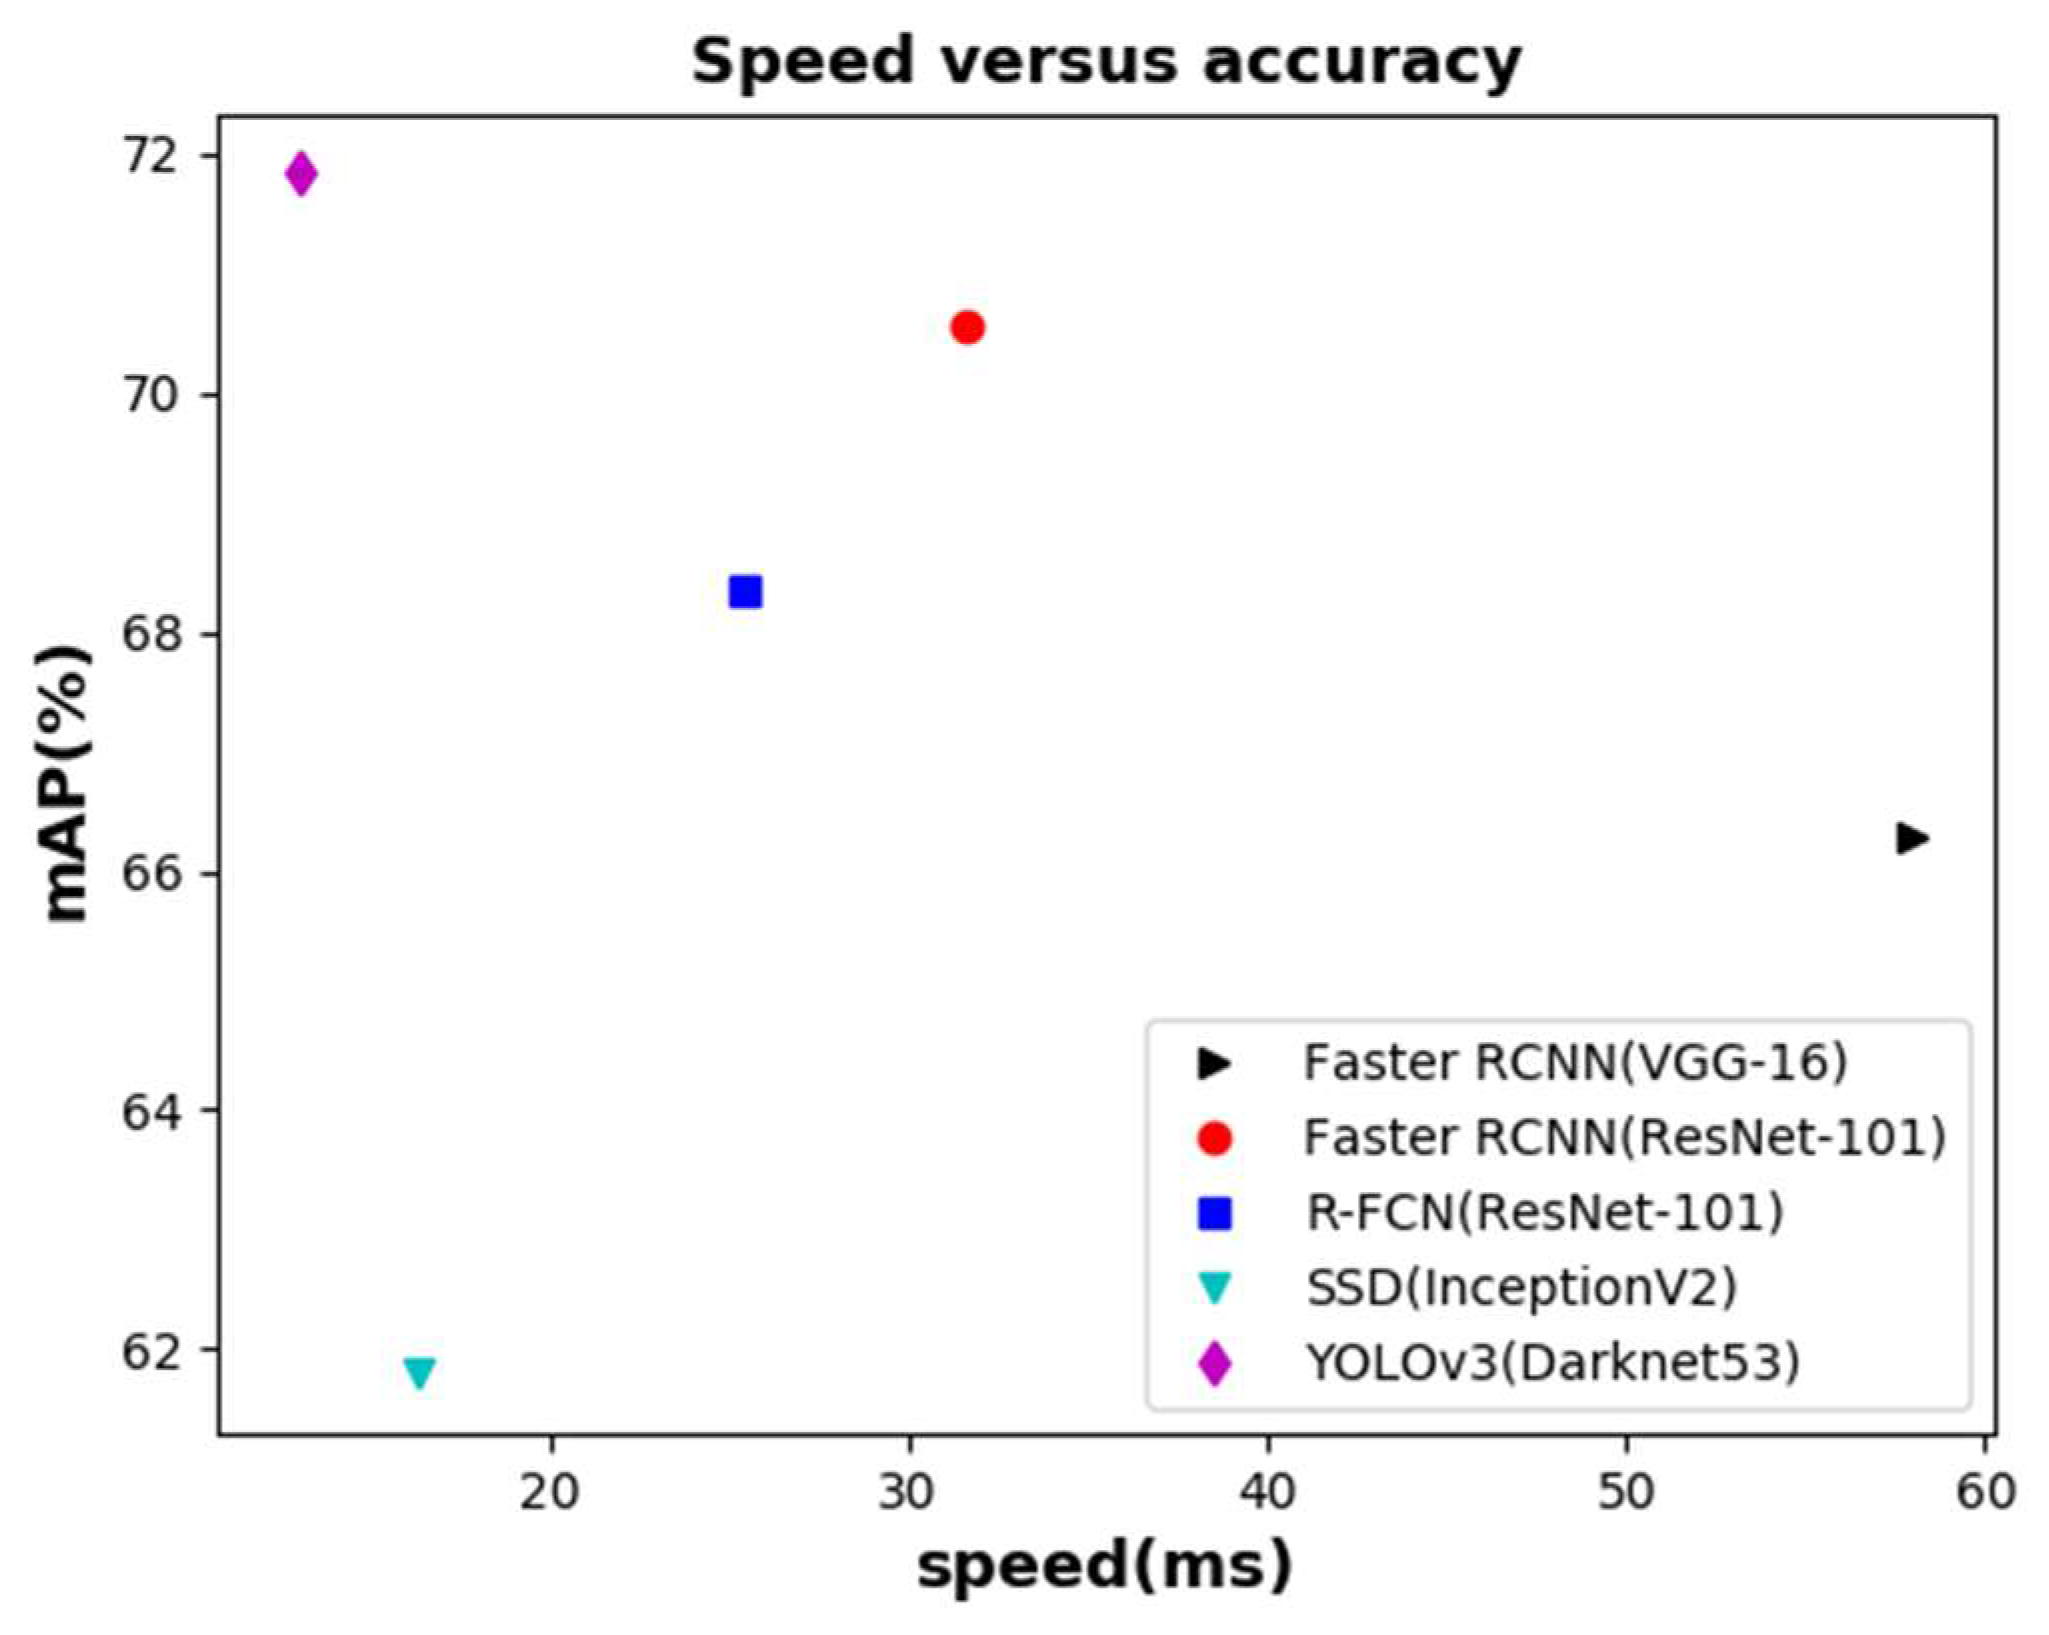
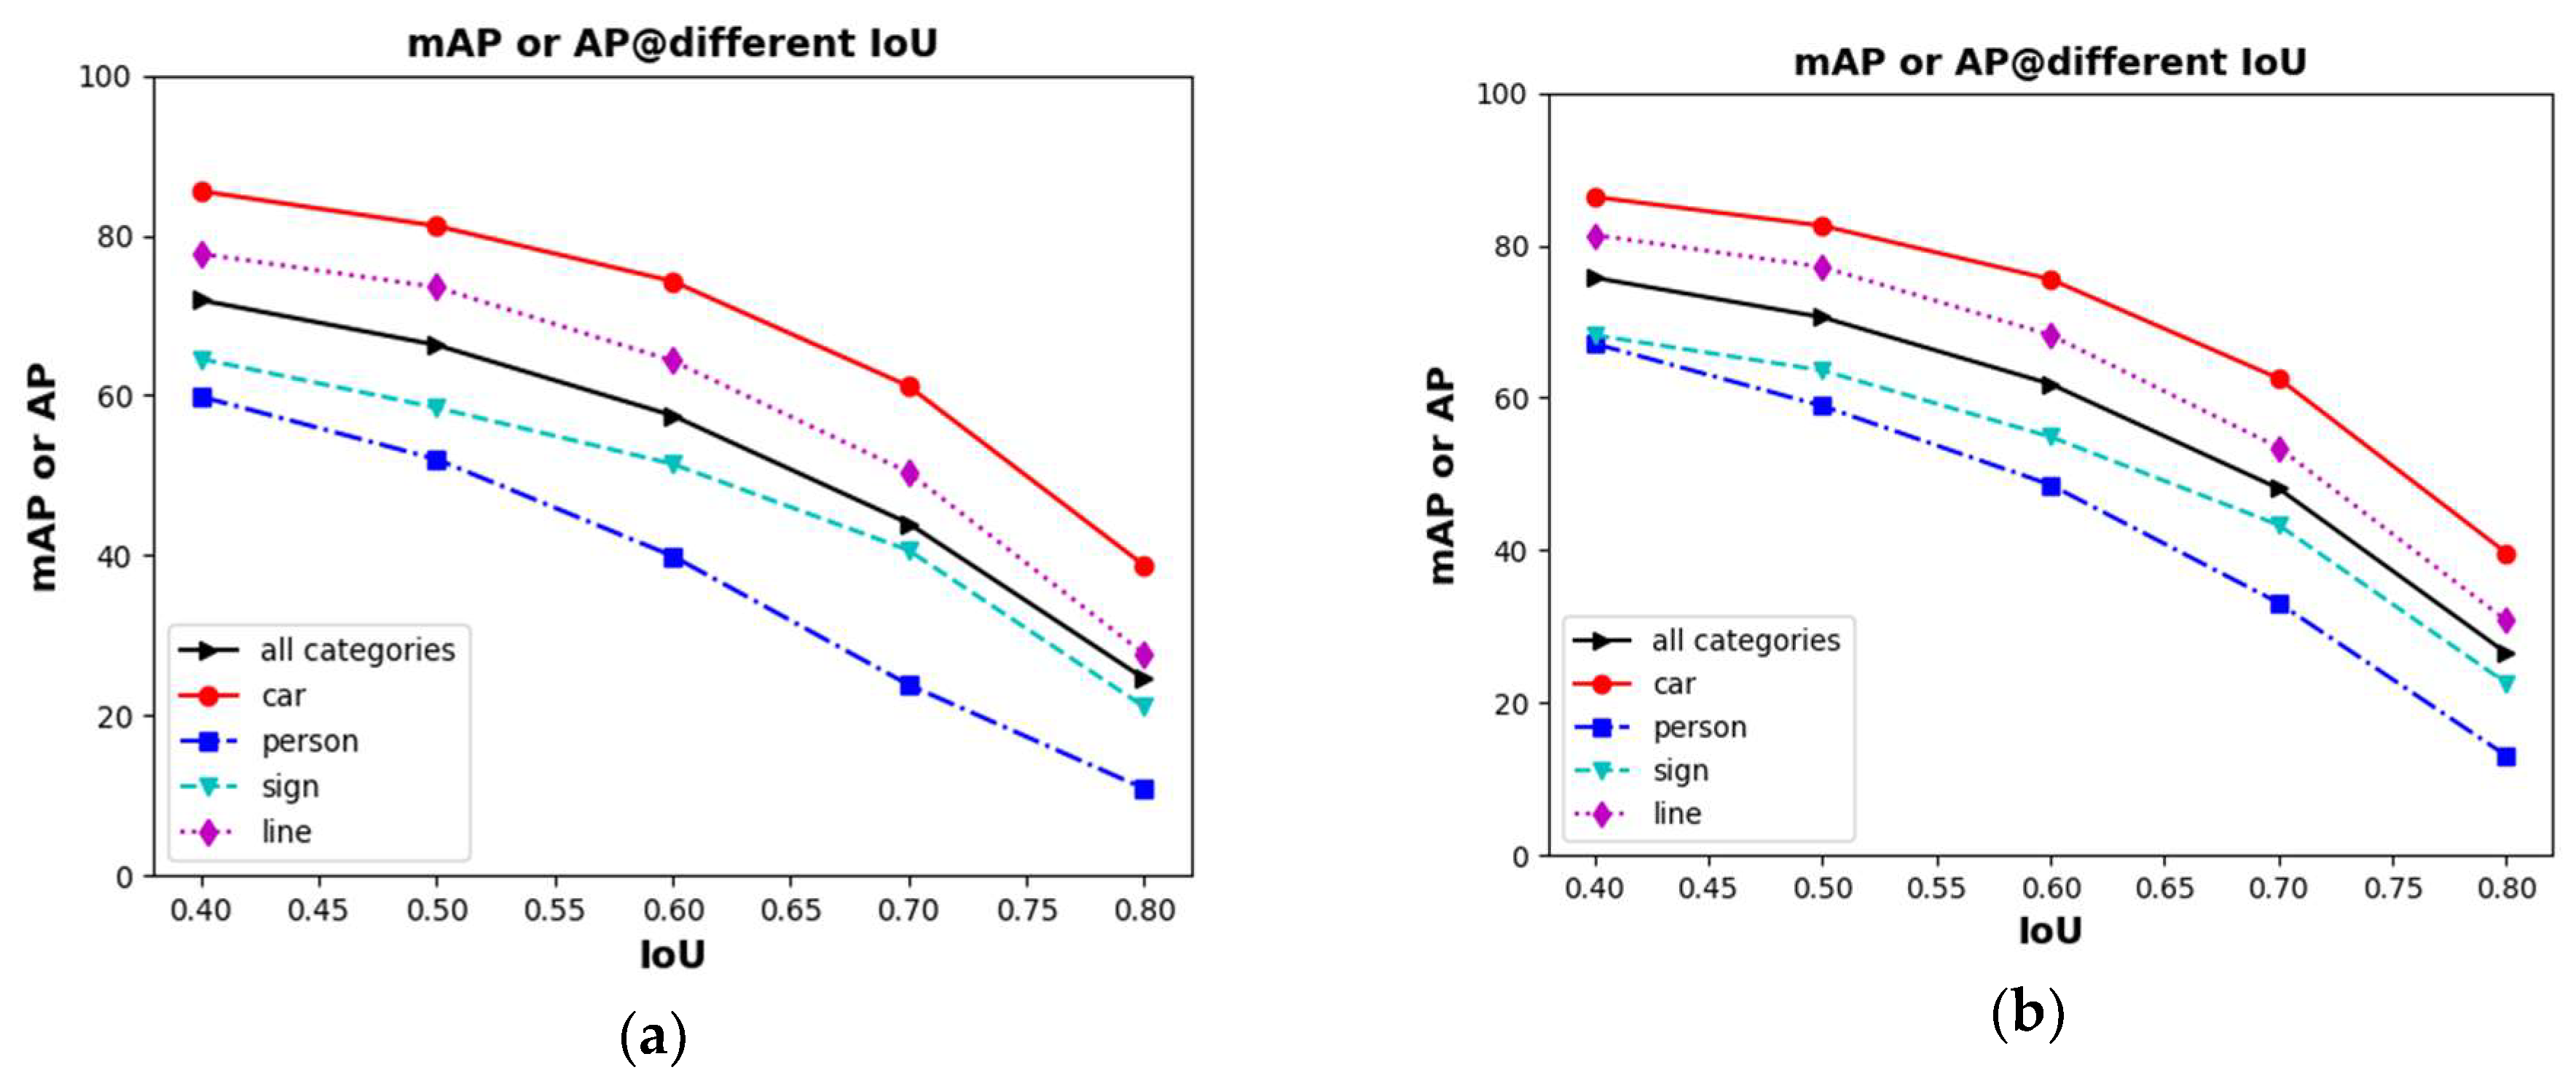
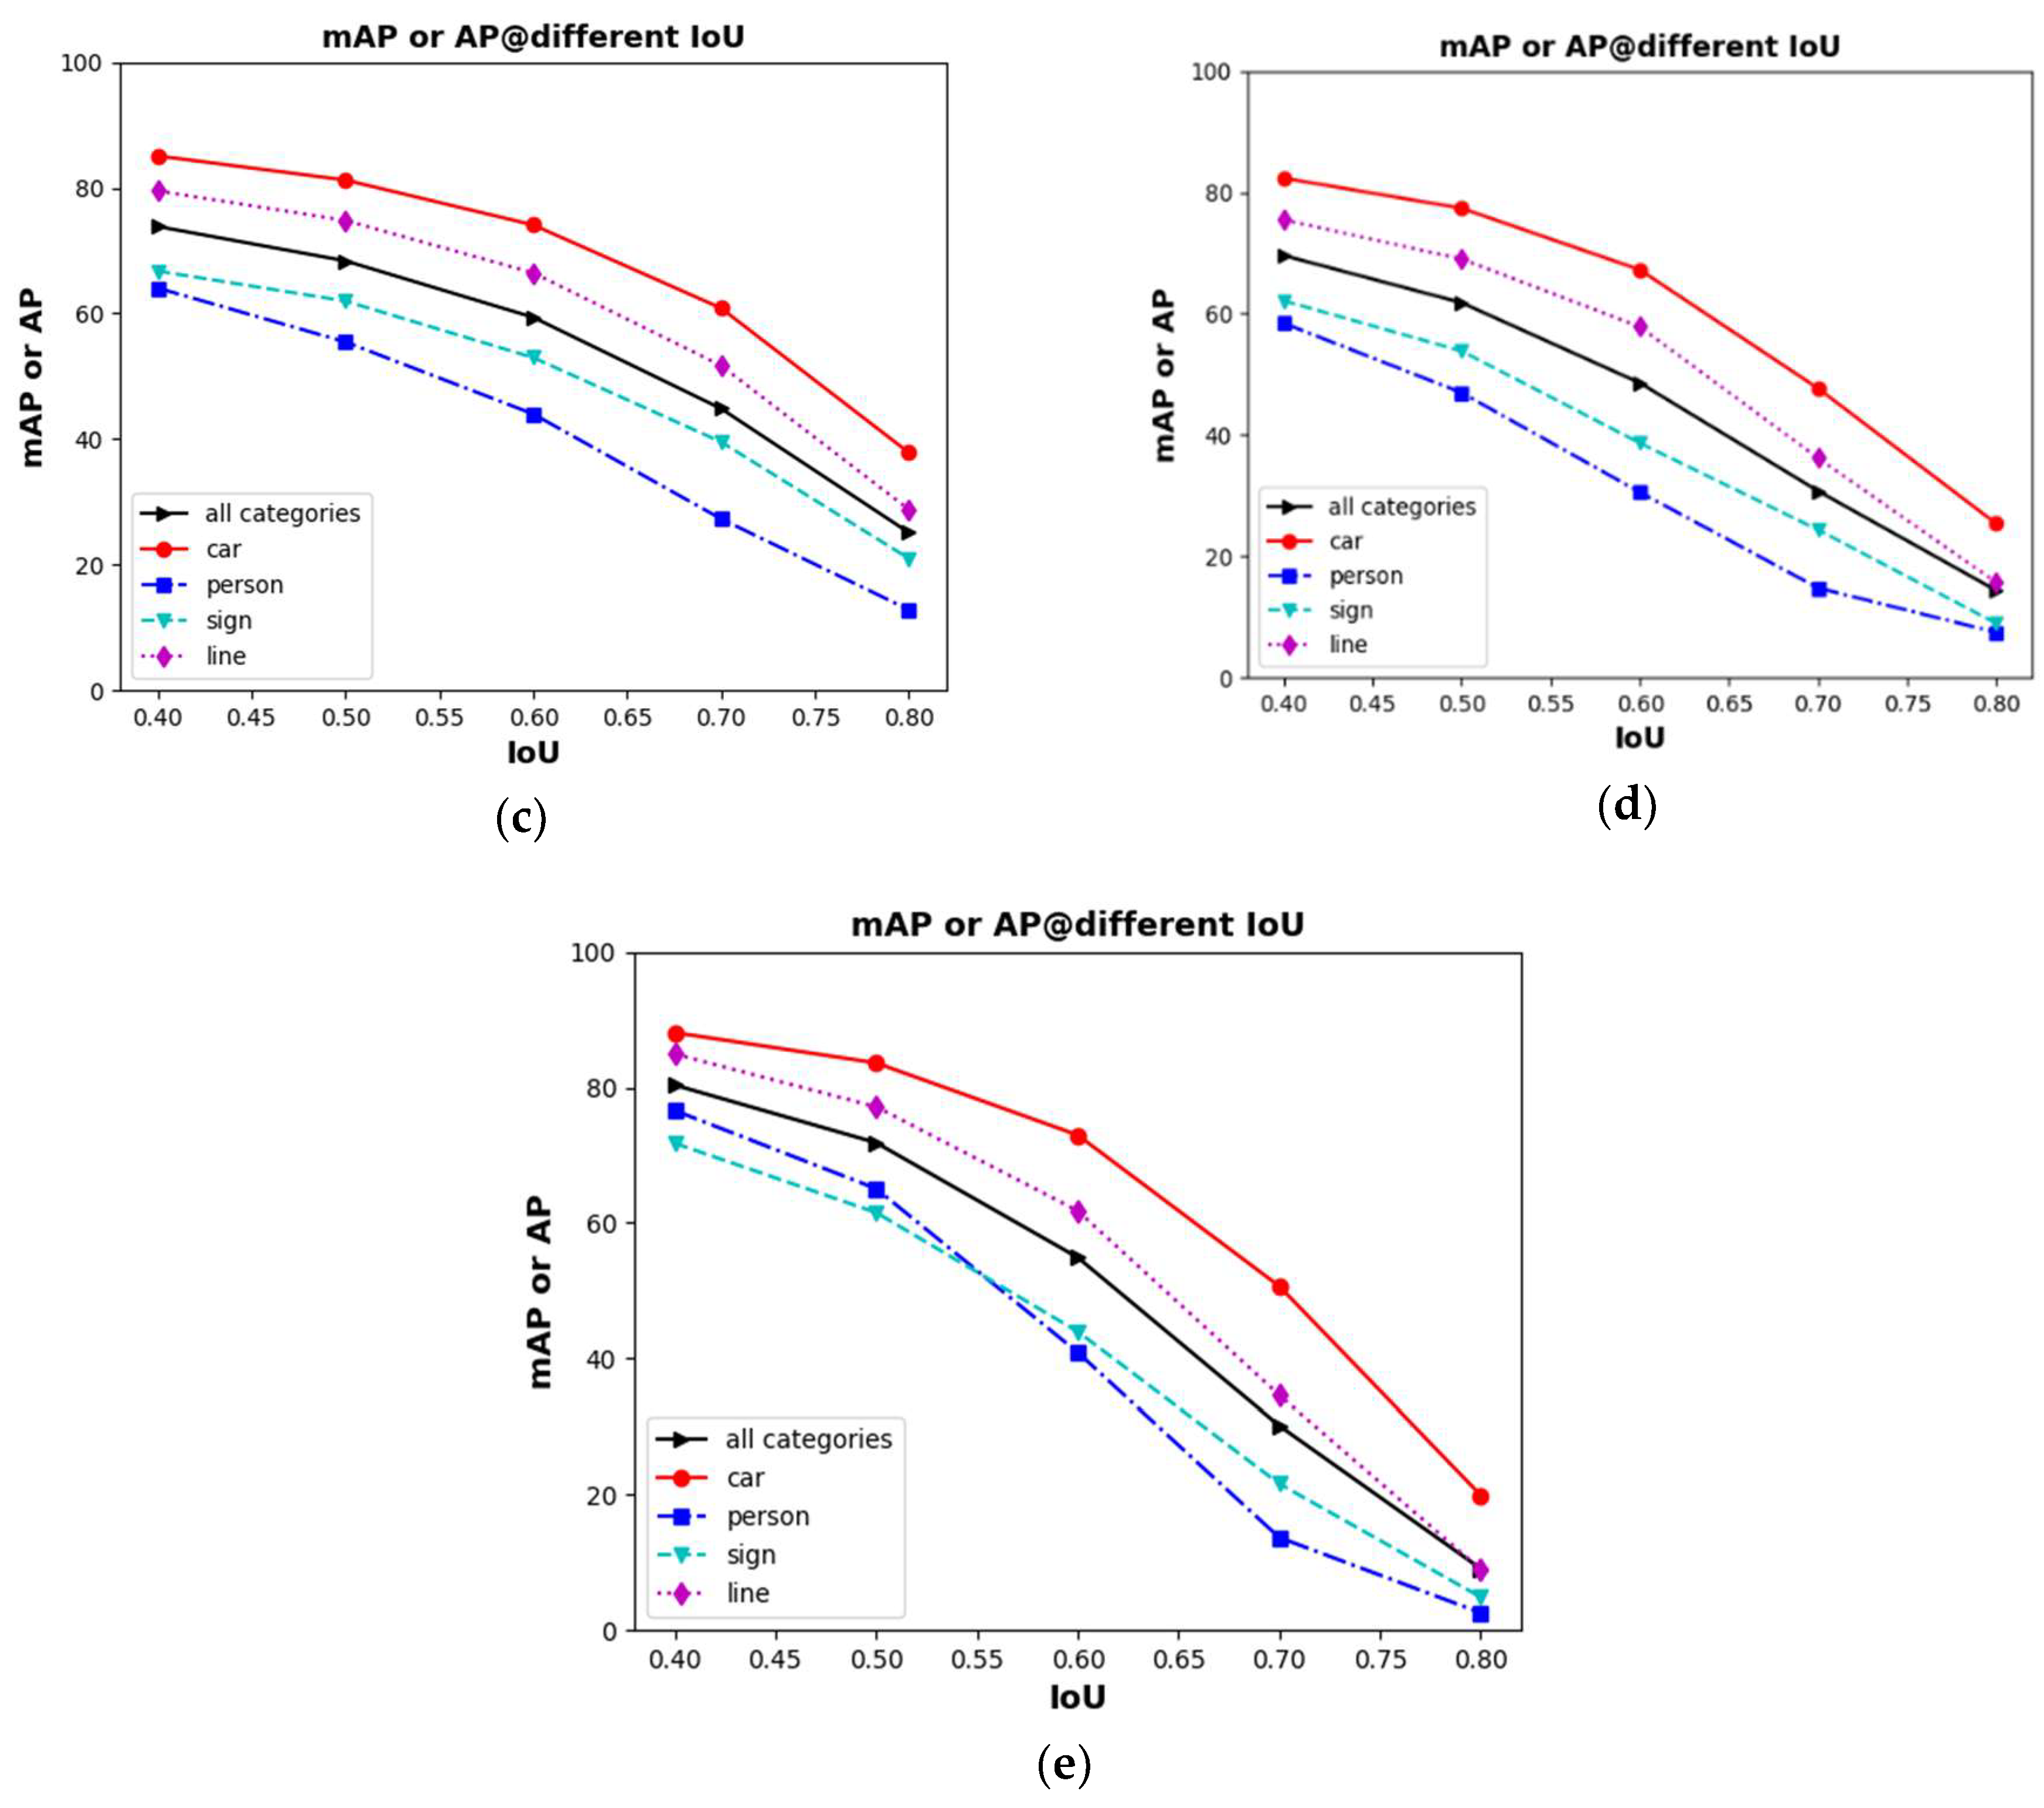
5.2.2. Quantitative Evaluation

In order to quantitatively analyze the performance of various algorithms, we evaluate and compare the performance of five detectors through mAP metric, and analyze the difficulty of the object detection of different categories by AP metric. In addition, we count the time required for the detector to test each image to measure the speed of the algorithm. Table 6 shows the specific performance statistics for different detectors. For a more direct comparison of the detection performance of the detectors, we plot the precision-recall curve per category of each detector with the IoU threshold 0.5. The specific results are shown in Figure 9.
As shown in Figure 9 and Table 6, from the overall mAP, YOLOv3 has achieved top performance, which is mainly due to its reference to the structure of FPN [10] feature pyramids. That structure combines low-resolution, semantically strong features with high-resolution, semantically weak features. It shows that the detection of a person has a large advantage. It can be seen that the AP of the person is 6.13 percentage points higher than the second best Faster RCNN (ResNet-101). From the performances of the detectors for each category, the car category gets the best performance, and the person category gets the worst performance (YOLOv3 is a counter-example). This is mainly because the car category has more training samples than the person category, and can provide more feature information. What’s more, there is also a considerable relationship with almost small objects of the person category in the images (as shown in Figure 4b, its scale is almost less than 64). In addition, the mAP of Faster RCNN (ResNet-101) is 4.27 higher than Faster RCNN (VGG-16). It can be seen that a better feature extraction network is very helpful for object detection tasks. On the whole, SSD gains slightly weaker performance. We assume that it can be a lack of higher-quality proposals compared to faster RCNN or R-FCN and not added to semantic information in context compared to YOLOv3. To sum up, these elements, i.e., better feature extraction network, higher-quality proposals and richer semantic information, all contribute to the promotion of detection performance in Pano-RSOD.
In terms of the speed of the algorithms, YOLOv3 also achieves top performance. On the one hand, YOLOv3 uses the Darknet deep learning framework, which is written in C language, to improve the running time of the program. On the other hand, it mainly benefits from its network structure and matching mechanism optimization between anchor and the ground-truth, such as the plenty of 1 × 1 convolution and shortcut structures in Darknet53, each ground-truth only matches one a priori box, which greatly reduces the complexity of the model.
SSD, which is an end-to-end detection method, also achieves good performance. In addition, R-FCN replaces the RoI pooling layer and the fully connected layer of faster RCNN with position-sensitive score maps composed of full convolutional layers, which reduces the computational complexity of the head and increases the prediction speed by 6.17 ms.
For a more intuitive analysis of the five detectors, we have drawn their speed versus accuracy diagram, as shown in Figure 10. It can be seen that Faster RCNN and R-FCN are significantly better than SSD in terms of detection accuracy. With regard to speed, the result is the opposite. For example, the mAP of Faster RCNN (ResNet-101) as the second-best result, is 8.77 percentage points higher than SSD, and the speed of faster RCNN (ResNet-101) is slower than the SSD. Besides, YOLOv3 has a good trade-off in terms of speed and accuracy, and achieved the best performance.

5.2.3. Comparisons with a General Dataset

To demonstrate the differences between the models trained on conventional non-panoramic datasets and the model trained on the Pano-RSOD, we compare its performance with other object detection datasets, i.e., COCO, KITTI and UA-DETRAC. Based on the experimental results of the five baseline detectors in Table 6, we find the YOLOv3 has a good trade-off in terms of detection accuracy and speed. Therefore, we choose the YOLOv3 (with pre-trained model) as the baseline method in the following comparative experiments. We totally set up five comparative experiments: COCO as training set and Pano-RSOD as test set, KITTI as training set and Pano-RSOD as test set, Pano-RSOD as training set and KITTI as test set, Pano-RSOD as training set and UA-DETRAC as test set, Pano-RSOD as training set and test set. Since common categories between Pano-RSOD and COCO, KITTI are vehicle and pedestrian, we used these two categories for experiments for fair comparisons.
Table 7 shows the experimental results of different training set in terms of AP, on conditions that IoU threshold is set 0.5. It is obvious that the model trained on COCO has a poor performance in panoramic dataset, i.e., Pano-RSOD. The reasons can be summarized in two aspects: (1) the traffic scenes in COCO are relatively few. (2) the images in Pano-RSOD are different from the COCO because Pano-RSOD’s panorama attribute will bring some optical distortions. Although the KITTI is a large-scale street-level object detection dataset whose scene is the same with Pano-RSOD, the AP of model trained on KITTI is still about 20% lower than the model trained on Pano-RSOD. This is good evidence that models trained on conventional non-panoramic imagery perform worse than trained on panoramic images. In contrast, when testing on KITTI and UA-DETRAC, the models trained on Pano-RSOD can achieve relatively good results due to the diversities of object scales of Pano-RSOD.

5.2.4. About Robustness of Detectors for Small Object

To evaluate the robustness of these detectors against varying IoU threshold, we evaluate five detectors with [email protected]:0.95(COCO’s metric).
From Table 8, we know that the accuracy of each algorithm is significantly reduced when the COCO evaluation metric is adopted, which indicates that the object detection algorithm is particularly sensitive to the selection of IoU threshold.
Then we increase the threshold from 0.4 to 0.8 by 0.1 increments and calculate AP regarding to each IoU threshold for each detector and plot IoU versus AP curve. The results are shown in Figure 11. As we can be seen from Figure 11, when the matching IoU value increases, the person category for every detector has a much sharper drop in the AP value than the car category, and falls to the worst result when IoU = 0.8. Such case implies that the detected bounding boxes do not have a high overlap ratio with the ground-truth and detection of small objects is more sensitive to IoU values. Therefore, more effort should be put into developing detectors that can better handle small objects for Pano-RSOD.

6. Conclusions

Pano-RSOD is a panoramic road scene dataset for object detection. It has distinctive characteristics: high-resolution, panorama, the richness of annotations and small objects, and diversity. Experiments have been conducted with different object detection algorithms based on deep neural networks. From the experimental results, we can conclude that Pano-RSOD can be used as a benchmark for performance evaluations of object detection. In that benchmark, YOLOv3 (Darknet53) has achieved the best results of AP (Car and Person), mAP and speed. While, the best results of AP (sign and line) and [email protected]:0.95(COCO’s metric) have been achieved by Faster RCNN(ResNet-101).
However, there are still challenges, such as the detection of small and hidden objects, and the panoramic view distortion. In future work, the method of dealing with the panoramic view distortion or directly converting from the panoramic view to normal view can be added to the new object detection algorithm. Further, object detection using new structures, like spherical CNN, which can directly process from the panoramic view, can be proposed. Besides, we also plan to extend Pano-RSOD and apply the dataset to other tasks such as semantic or instance segmentation in panoramic scene.

Author Contributions

Conceptualization, Y.L., H.G. and G.T.; methodology, Y.L., H.G. and Y.W.; software, Y.L., H.G. and H.C.; formal analysis, Y.L., Y.W. and L.Z.; data curation, Y.L., G.T., H.G. and H.C.; writing—original draft preparation, Y.L. and H.G.; supervision, G.T. and L.Z.; funding acquisition, Y.W. and L.Z.

Funding

This research was funded by National Natural Science Foundation of China, grant number 41801241 and 41371324. The APC was funded by Y.B Wang and L.Q. Zhang.

Acknowledgments

The authors would like to thank Shanshan Yin, Wenbo Zhao, Hao Wang, Liwei Gao, Tingting Zhu, Mantang Liu, Lin Yang and Changjian Ge in Northeastern University for helping to build the dataset of this paper.

Conflicts of Interest

The authors declare no conflict of interest.

References

  1. Bertozzi, M.; Castangia, L.; Cattani, S.; Prioletti, A.; Versari, P. 360° Detection and tracking algorithm of both pedestrian and vehicle using fisheye images. In Proceedings of the 2015 IEEE Intelligent Vehicles Symposium (IV), Seoul, Korea, 28 June–1 July 2015; pp. 132–137. [Google Scholar]
  2. Lin, M.; Xu, G.; Ren, X.; Xu, K. Cylindrical panoramic image stitching method based on multi-cameras. In Proceedings of the 2015 IEEE International Conference on Cyber Technology in Automation, Control, and Intelligent Systems (CYBER), Shenyang, China, 8–12 June 2015; pp. 1091–1096. [Google Scholar]
  3. Fakour-Sevom, V.; Guldogan, E.; Kämäräinen, J.K. 360 panorama super-resolution using deep convolutional networks. In Proceedings of the 13th International Joint Conference on Computer Vision, Imaging and Computer Graphics Theory and Applications, Funchal, Portugal, 27–29 January 2018; pp. 159–165. [Google Scholar]
  4. Kart, U.; Kamarainen, J.K.; Fan, L.; Gabbouj, M. Evaluation of visual object trackers on equirectangular panorama. In Proceedings of the International Conference on Computer Vision Theory and Applications, Funchal, Portugal, 27–29 January 2018. [Google Scholar]
  5. Frome, A.; Cheung, G.; Abdulkader, A. Large-scale privacy protection in Google Street View. In Proceedings of the 2009 IEEE 12th International Conference on Computer Vision, Kyoto, Japan, 29 September–2 October 2009. [Google Scholar]
  6. Balali, V.; Ashouri, A.; Golparvar, F. Detection, classification, and mapping of U.S. traffic signs using google street view images for roadway inventory management. Vis. Eng. 2015, 3, 3–15. [Google Scholar] [CrossRef]
  7. Everingham, M.; VanGool, L.; Williams, C.K.I.; Winn, J.; Zisserman, A. The Pascal visual object classes (VOC) challenge. Int. J. Comput. Vis. 2009, 88, 303–338. [Google Scholar] [CrossRef]
  8. Deng, J.; Dong, W.; Socher, R.; Li, L.J.; Li, K.; Li, F.F. ImageNet: A large-scale hierarchical image database. In Proceedings of the 2009 IEEE Conference on Computer Vision and Pattern Recognition, Miami, FL, USA, 20–25 June 2009; pp. 248–255. [Google Scholar]
  9. Lin, T.Y.; Maire, M.; Belongie, S.; Hays, J.; Perona, P.; Ramanan, D.; Dollár, P.; Zitnick, C.L. Microsoft COCO: Common objects in context. In Proceedings of the European Conference on Computer Vision, Zurich, Switzerland, 6–12 September 2014. [Google Scholar]
  10. Geiger, A.; Lenz, P.; Urtasun, R. Are We Ready for Autonomous Driving? The KITTI Vision Benchmark Suite. In Proceedings of the 2012 IEEE Conference on Computer Vision and Pattern Recognition, Providence, RI, USA, 16–21 June 2012; pp. 3354–3361. [Google Scholar]
  11. Dollár, P.; Wojek, C.; Schiele, B.; Perona, P. Pedestrian detection: An evaluation of the state of the art. IEEE Trans. Pattern Anal. Mach. Intell. 2012, 34, 743–761. [Google Scholar] [CrossRef] [PubMed]
  12. Wen, L.; Du, D.; Cai, Z.; Lei, Z.; Chang, M.C.; Qi, H.; Lim, J.; Yang, M.H.; Lyu, S. UA-DETRAC: A New Benchmark and Protocol for Multi-Object Detection and Tracking. 2015. Available online: https://arxiv.org/abs/1511.04136 (accessed on 4 September 2015).
  13. Gerhard, N.; Tobias, O.; Samuel, R.B.; Peter, K. The Mapillary Vistas Dataset for Semantic Understanding of Street Scenes. In Proceedings of the IEEE International Conference on Computer Vision (ICCV), Venice, Italy, 22–29 October 2017; pp. 4990–4999. [Google Scholar]
  14. Cordts, M.; Omran, M.; Ramos, S.; Rehfeld, T.; Enzweiler, M.; Benenson, R.; Franke, U.; Roth, S.; Schiele, B. The Cityscapes Dataset for Semantic Urban Scene Understanding. In Proceedings of the IEEE Conference on Computer Vision and Pattern Recognition (CVPR), Las Vegas, NV, USA, 27–30 June 2016; pp. 3213–3223. [Google Scholar]
  15. Huang, X.Y.; Cheng, X.J.; Geng, Q.C.; Cao, B.B.; Zhou, D.F.; Wang, P.; Lin, Y.Q.; Yang, R.G. The ApolloScape Dataset for Autonomous Driving. CoRR. 2018. Available online: https://arxiv.org/abs/1803.06184 (accessed on 26 September 2018).
  16. Hazelhoff, L.; Creusen, I.; de with, P.H.N. Robust detection, classification and positioning of traffic signs from street-level panoramic images for inventory purposes. In Proceedings of the 2012 IEEE Workshop on the Applications of Computer Vision (WACV), Breckenridge, CO, USA, 9–11 January 2012; pp. 313–320. [Google Scholar]
  17. Deng, F.; Zhu, X.; Ren, J. Object Detection on Panoramic Images Based on Deep Learning. In Proceedings of the 2017 3rd International Conference on Control, Automation and Robotics (ICCAR), Nagoya, Japan, 24–26 April 2017; pp. 375–380. [Google Scholar]
  18. Ren, S.; He, K.; Girshick, R.; Sun, J. Faster R-CNN: Towards real-time object detection with region proposal networks. In Proceedings of the International Conference on Neural Information Processing Systems, Montreal, QC, Canada, 7–12 December 2015; pp. 91–99. [Google Scholar]
  19. He, K.; Zhang, X.; Ren, S.; Sun, J. Deep residual learning for image recognition. In Proceedings of the IEEE Conference on Computer Vision and Pattern Recognition (CVPR), Las Vegas, NV, USA, 26 June–1 July 2016; pp. 770–778. [Google Scholar]
  20. Dai, J.; Li, Y.; He, K.; Sun, J. R-FCN: Object detection via region based fully convolutional networks. In Proceedings of the Advances in Neural Information Processing Systems 29 (NIPS 2016), Barcelona, Spain, 5–10 December 2016; pp. 379–387. [Google Scholar]
  21. Redmon, J.; Farhadi, A. Yolov3: An Incremental Improvement. 2018. Available online: https://arxiv.org/abs/1804.02767 (accessed on 8 April 2018).
  22. Liu, W.; Anguelov, D.; Erhan, D.; Szegedy, C.; Reed, S.; Fu, C.Y.; Berg, A.C. SSD: Single Shot MultiBox Detector. In Proceedings of the European Conference on Computer Vision, Amsterdam, The Netherlands, 8–16 October 2016; Springer: Cham, Switzerland, 2016; pp. 21–37. [Google Scholar]
  23. Szegedy, C.; Vanhoucke, V.; Ioffe, S.; Shlens, J.; Wojna, Z. Rethinking the inception architecture for computer vision. In Proceedings of the IEEE Conferences on Computer Vision and Pattern Recognition, Las Vegas, NV, USA, 27–30 June 2016; pp. 2818–2826. [Google Scholar]
  24. Hong, S.; Roh, B.; He, K.; Kim, Y.; Cheon; Park, M. Pvanet: Lightweight deep neural networks for real-time object detection. arXiv, 2016; arXiv:1611.08588. [Google Scholar]
  25. Fu, C.Y.; Liu, W.; Ranga, A.; Tyagi, A.; Berg, A.C. DSSD: Deconvolutional Single Shot Detector. arXiv, 2017; arXiv:1701.06659. [Google Scholar]
  26. Dalal, N.; Triggs, B. Histograms of oriented gradients for human detection. In Proceedings of the IEEE Computer Society, San Diego, CA, USA, 20–25 June 2005; pp. 886–893. [Google Scholar]
  27. Overett, G.; Petersson, L.; Brewer, N.; Andersson, L.; Pettersson, N. A new pedestrian dataset for supervised learning. In Proceedings of the IEEE Intelligent Vehicles Symposium, Eindhoven, The Netherlands, 4–6 June 2008; pp. 373–378. [Google Scholar]
  28. Ess, A.; Leibe, B.; Gool, L.V. Depth and appearance for mobile scene analysis. In Proceedings of the IEEE 11th International Conference on Computer Vision, Rio de Janeiro, Brazil, 14–21 October 2007; pp. 1–8. [Google Scholar]
  29. Gerónimo, D.; Sappa, A.; López, A.; Ponsa, D. Adaptive image sampling and windows classication for on-board pedestrian detection. In Proceedings of the International Conference on Computer Vision Systems, Bielefeld, Germany, 21–24 March 2007. [Google Scholar]
  30. Leung, B. Component-Based Car Detection in Street Scene Images. Master’s Thesis, Massachusetts Institute of Technology, Cambridge, MA, USA, May 2004. [Google Scholar]
  31. Dong, Z.; Wu, Y.; Pei, M.; Jia, Y. Vehicle type classification using a semisupervised convolutional neural network. IEEE Trans. Intell. Transp. Syst. 2015, 16, 2247–2256. [Google Scholar] [CrossRef]
  32. Razavian, A.S.; Azizpour, H.; Sullivan, J.; Carlsson, S. CNN features off-the-shelf: An astounding baseline for recognition. In Proceedings of the IEEE Conferences on Computer Vision and Pattern Recognition, Columbus, OH, USA, 23–28 June 2014; pp. 806–813. [Google Scholar]
  33. Girshick, R.B.; Donahue, J.; Darrell, T.; Malik, J. Rich Feature Hierarchies for Accurate Object Detection and Semantic Segmentation. In Proceedings of the IEEE Conferences on Computer Vision and Pattern Recognition, Columbus, OH, USA, 23–28 June 2014; pp. 580–587. [Google Scholar]
  34. Girshick, R.B. Fast R-CNN. In Proceedings of the IEEE International Conference on Computer Vision, Las Condes, Chile, 11–18 December 2015; pp. 1440–1448. [Google Scholar]
  35. Lin, T.Y.; Dollár, P.; Girshick, R.; He, K.; Hariharan, B.; Belongie, S. Feature pyramid networks for object detection. In Proceedings of the IEEE Conferences on Computer Vision and Pattern Recognition, Honolulu, HI, USA, 21–26 July 2017; pp. 936–944. [Google Scholar]
  36. He, K.; Gkioxari, G.; Dollár, P.; Girshick, R. Mask R-CNN. In Proceedings of the IEEE International Conference on Computer Vision, Venice, Italy, 22–29 October 2017; pp. 2980–2988. [Google Scholar]
  37. Redmon, J.; Divvala, S.; Girshick, R.; Farhadi, A. You Only Look Once: Unified, Real-Time Object Detection. In Proceedings of the IEEE Conferences on Computer Vision and Pattern Recognition, Las Vegas, NV, USA, 27–30 June 2016; pp. 779–788. [Google Scholar]
  38. Sermanet, P.; Eigen, D.; Zhang, X.; Mathieu, M.; Fergus, R.; LeCun, Y. Overfeat: Integrated recognition, localization and detection using convolutional networks. arXiv, 2013; arXiv:1312.6229. [Google Scholar]
  39. Redmon, J.; Farhadi, A. Yolo9000: Better, faster, stronger. In Proceedings of the IEEE Conferences on Computer Vision and Pattern Recognition, Honolulu, HI, USA, 21–26 July 2017; pp. 6517–6525. [Google Scholar]
  40. Jeong, J.; Park, H.; Kwak, N. Enhancement of SSD by concatenating feature maps for object detection. arXiv, 2017; arXiv:1705.09587. [Google Scholar]
  41. Li, L.; Ouyang, W.; Wang, X.; Fieguth, P.; Chen, J.; Liu, X.; Pietikäinen, M. Deep Learning for Generic Object Detection: A Survey. arXiv, 2018; arXiv:1809.02165. [Google Scholar]
  42. Uijlings, J.R.R.; van de Sande, K.E.A.; Gevers, T.; Smeulders, A.W.M. Selective Search for Object Recognition. Int. J. Comput. Vis. 2013, 104, 154–171. [Google Scholar] [CrossRef] [Green Version]
  43. Simonyan, K.; Zisserman, A. Very deep convolutional networks for large-scale image recognition. arXiv, 2014; arXiv:1409.1556. [Google Scholar]
  44. Shrivastrava, A.; Gupta, A.; Girshick, R. Training region-based object detectors with online hard example mining. In Proceedings of the IEEE Conferences on Computer Vision and Pattern Recognition, Las Vegas, NV, USA, 27–30 June 2016; pp. 761–769. [Google Scholar]
Figure 1. Different road scenes of panoramic images. (a) crossroad; (b) overpass; (c) urban road; (d) suburban road.
Electronics 08 00329 g001aElectronics 08 00329 g001b
Figure 2. Panoramic image acquisition vehicle.
Electronics 08 00329 g002
Figure 3. The multi-camera panoramic vision system and the acquired panoramic image.
Electronics 08 00329 g003
Figure 4. Dataset statistics results. (a) Number of objects per category; (b) Number of objects per scale. We define scale as the square root of the object’s area.
Electronics 08 00329 g004
Figure 5. The different types of objects in Pano-RSOD. (a) car; (b) person; (c) sign; (d) line.
Electronics 08 00329 g005
Figure 6. General pipeline of two types of object detection baseline methods adopted in this paper. The difference between two kinds of methods is described in Section 2.2, and we only give a simple and intuitive diagram.
Electronics 08 00329 g006
Figure 7. The distribution of anchors in the dataset (separate points are the distribution values of the anchors, and the gradient of the line represents the aspect ratio).
Electronics 08 00329 g007
Figure 8. The detection results of five algorithms in different road scenes. (a) crossroad; (b) overpasses; (c) crowded urban road; (d) suburban road. The text in the upper left corner of each image represents the algorithm adopted in the paper. The magenta box, red box, green box and cyan box separately represent car, person, sign and line.
Electronics 08 00329 g008aElectronics 08 00329 g008b
Figure 9. Performance comparison of different detectors. (a) Faster RCNN(VGG-16); (b) Faster RCNN(ResNet-101); (c) R-FCN(ResNet-101); (d) SSD(InceptionV2); (e) YOLOv3(Darknet53).
Electronics 08 00329 g009
Figure 10. Speed (ms) versus accuracy (mAP) on Pano-RSOD.
Electronics 08 00329 g010
Figure 11. Detection performance under different IoU threshold for each detector when predicting. (a) Faster RCNN(VGG-16); (b) Faster RCNN(ResNet-101); (c) R-FCN(ResNet-101); (d) SSD(InceptionV2); (e) YOLOv3 (Darknet53).
Electronics 08 00329 g011aElectronics 08 00329 g011b
Table 1. Comparison of typical object detection algorithms based on deep learning. The symbol * represents the multi-feature layer fusion. Methods evaluated in this work are bold-faced.
MethodsTwo-StageOne-Stage
Fast RCNNFaster RCNNPVAnetR-FCNYOLOYOLOv3SSDDSSD
Region proposalselective search [42]RPN [18]RPNRPNgrid cellsanchor boxesdefault boxesdefault boxes
Prediction layerOneoneOne *oneoneMultiple *multipleMultiple *
Table 2. Comparison of Statistical Results of Pano-RSOD and Other Datasets.
DatasetPascal VOC 2007Object Detection Evaluation 2012BIT-VehiclePano-RSODUA-DETRACCityscapes (Semantic)Mapillary Vistas (Semantic)
PanoramaNoNoNoYesNoNoNo
Traffic SceneNoYesYesYesYesYesYes
Resolution~375 × 5001240 × 3761600 × 1200
1920 × 1080
2048 × 1024960 × 5402048 × 10241920 × 1080
Number of Categories2036443018 (object)
Number of Cars2500Unknown10,05350,2558250Unknown~200 thousand
Number of Images996314,99998509402140 thousand25,00025,000
Number of Samples24,64080,25610,05387,5421.21 millionUnknownUnknown
Table 3. Different aspect ratios after clustering. The second and third column, i.e., H and W, separately height and width of objects in Pano-RSOD after clustering. The last column, i.e., aspect ratio, is calculated by dividing W by H.
TermsHWAspect Ratio
ClassesCarSignLinePersonCarSignLinePersonCarSignLinePerson
First6126129329824465181.60.93.60.6
Second11814681114211135239631.80.91.70.6
Third281872613941396392451.52.11.51.8
Fourth18267686443557114332.40.91.80.5
Table 4. Detailed setting parameters of five detectors’ anchors. We define the type of scales as S, the type of aspect ratios as A, so for Faster RCNN, R-FCN, and SSD, the type of anchors as S × A. For YOLOv3, we directly list anchor’s width and height.
MethodsScaleAspect RatioAnchor Type Number
Faster RCNN
(VGG-16)
{32,64,128,256,512}{0.5,1,2,3}20
Faster RCNN
(ResNet-101)
{32,64,128,256,512}{0.5,1,2,3}20
R-FCN
(ResNet-101)
{32,64,128,256,512}{0.5,1,2,3}20
SSD
(InceptionV2)
First layer:51.2
Second layer:102.4
Third layer:198.4
Fourth layer:294.4
Fifth layer:390.4
Sixth layer:486.4
{0.5,1,1,2}
{0.5,0.333,1,1,2,3}
{0.5,0.333,1,1,2,3}
{0.5,0.333,1,1,2,3}
{0.5,1,1,2}
{0.5,1,1,2}
30
YOLOv3
(DarkNet53)
{[14.96,13], [27.04,17], [21.1,32.06], [39.94,23.96], [38.1,51], [64.10,32.06], [80.08,52.02], [128,82.02], [291.02,142.04]}9
Table 5. Hyper-parameters used in training process.
Hyper-ParametersFaster RCNN
(VGG-16)
Faster RCNN
(ResNet-101)
R-FCN
(ResNet-101)
SSD
(InceptionV2)
YOLOv3
(Darknet53)
Steps100 k100 k100 k150 k150 k
Initial learning rate0.010.0010.0010.0040.001
Batch size11144
Momentum0.90.90.90.90.9
IoU threshold0.50.50.50.50.5
Table 6. Performance Statistics of Object Detection Using Different Algorithms. The best results are bold-faced.
MethodCarPersonSignLinemAPSpeed(ms)
Faster RCNN
(VGG-16)
81.1752.0258.4673.5266.29~58
Faster RCNN
(ResNet-101)
82.5658.9363.5977.1570.5631.58
R-FCN
(ResNet-101)
81.2255.4661.9674.7968.3625.41
SSD
(InceptionV2)
77.3648.9651.8269.0061.7916.38
YOLOv3
(Darknet53)
83.6065.0661.5377.1371.83~13
Table 7. Detection Results of Different Training Set.
TrainingTestVehicle (AP)Pedestrian (AP)
COCOPano-RSOD40.7528.92
KITTIPano-RSOD62.1847.53
Pano-RSODKITTI64.4639.25
Pano-RSODUA-DETRAC57.21-
Pano-RSODPano-RSOD83.6065.06
Table 8. [email protected]:0. 95 of five detectors.
MethodFaster RCNN
(VGG-16)
Faster RCNN
(ResNet-101)
R-FCN
(ResNet-101)
SSD
(InceptionV2)
YOLOv3
(Darknet53)
[email protected]:0.9535.7038.8037.0026.1029.48

