Article

A Pseudo-Dynamic Delay Calculation Using Optimal Zone Segmentation for Ultra-Compact Ultrasound Imaging Systems

1
Department of Electronic Engineering, Sogang University, Seoul 04107, Korea
2
Laboratory for Computational Sensing and Robotics, Whiting School of Engineering, Johns Hopkins University, Baltimore, MD 21218, USA
*
Authors to whom correspondence should be addressed.
Both authors contributed equally to this manuscript.
Electronics 2019, 8(2), 242; https://doi.org/10.3390/electronics8020242
Submission received: 12 January 2019 / Revised: 12 February 2019 / Accepted: 19 February 2019 / Published: 20 February 2019
(This article belongs to the Section Circuit and Signal Processing)

Abstract

:
The implementation of dynamic delay calculations (DDCs) is challenging for ultra-compact ultrasound imaging due to the enormous computation and power consumption requirements. Here, we present an efficient pseudo-DDC method based on optimal zone segmentation (PDC-Optimal), which significantly decreases these requirements relative to an unconstrained DDC method: reductions in flip-flops of 84.35% and in look-up tables of 94.19%, respectively. The reductions lead to an up to 94.53% lower dynamic power consumption and provide image quality comparable to the unconstrained DDC method. The proposed PDC-Optimal method also provides adaptive flexibility between beamforming accuracy and battery life using the delay error allowance, a user-definable parameter. A conventional pseudo-DDC method using uniform zone segmentation (PDC-Conv) presented substantial image degradation in the near imaging field when the same number of zone segments was used. Therefore, the PDC-Optimal method provides an efficient yet flexible DDC solution to improve the experiences for ultra-compact ultrasound imaging system users.

1. Introduction

In point-of-care ultrasound (US), demands for advanced imaging algorithms have been emphasized [1,2,3,4]. However, the implementation of such advanced features in an ultra-compact US system remains challenging because complex computations must be performed with limited hardware resources, circuit volume, and battery capacity, decreasing clinical efficacy.
Several efficient beamforming and/or compressive sensing algorithms have been proposed to address such demands [5,6,7,8,9,10]. The dynamic receive beamformer is one of the most complex processing components in a US imaging system; our previous research found that it contains 46.5% of the total hardware resources and 25.4% of the total power consumption of a system-on-chip solution for portable US imaging [11]. Here, we particularly focus in an efficient implementation of dynamic delay calculations (DDC) during dynamic receive beamforming, which allocates complex square roots and multipliers at each channel [12]. Although a time-sharing pseudo-DDC method (PDC-TS) has been proposed to alleviate this burden, it does not provide any flexibility with the complex multiplexing hardware structure [11,13]. A look-up-table (LUT)-based DDC method was proposed to address this problem and provide both high flexibility and reduced hardware usage by adopting a pseudo-dynamic delay interpolation concept, which is referred to as the “PDC-Conv” method in this paper. The PDC-Conv method interpolates between the representative delays of adjacent “zone segments” divided with a uniform distance within an entire imaging depth. With this method, both the use of computational units and the LUT size can be reduced [2,14]. However, its practical use in a US system has been difficult, as there are no clear design guidelines to regulate beamforming quality and hardware usage (e.g., the number and length of a zone segment, bit quantization in delay calculation, etc.). The lack of guidelines leads to irregular imaging performance, especially at near imaging depth, due to the fixed number and length of zone segments regardless of the dynamic changing in delay increments over the imaging depth.
In this paper, we propose a pseudo-DDC method using an optimal zone segmentation with non-uniform intervals (PDC-Optimal) for an efficient implementation of the ultra-compact US imaging system with a clear design methodology. This would provide more precise beamforming over an imaging field of view compared with the PDC-Conv method when using the same amount of hardware resources. In addition, the proposed PDC-Optimal method will empower adaptive management of dynamic power consumption as a function of user-definable delay error allowance, which enables an optimized user experience on various diagnostic circumstances requiring different levels of image quality and amounts of battery life.

2. Materials and Methods

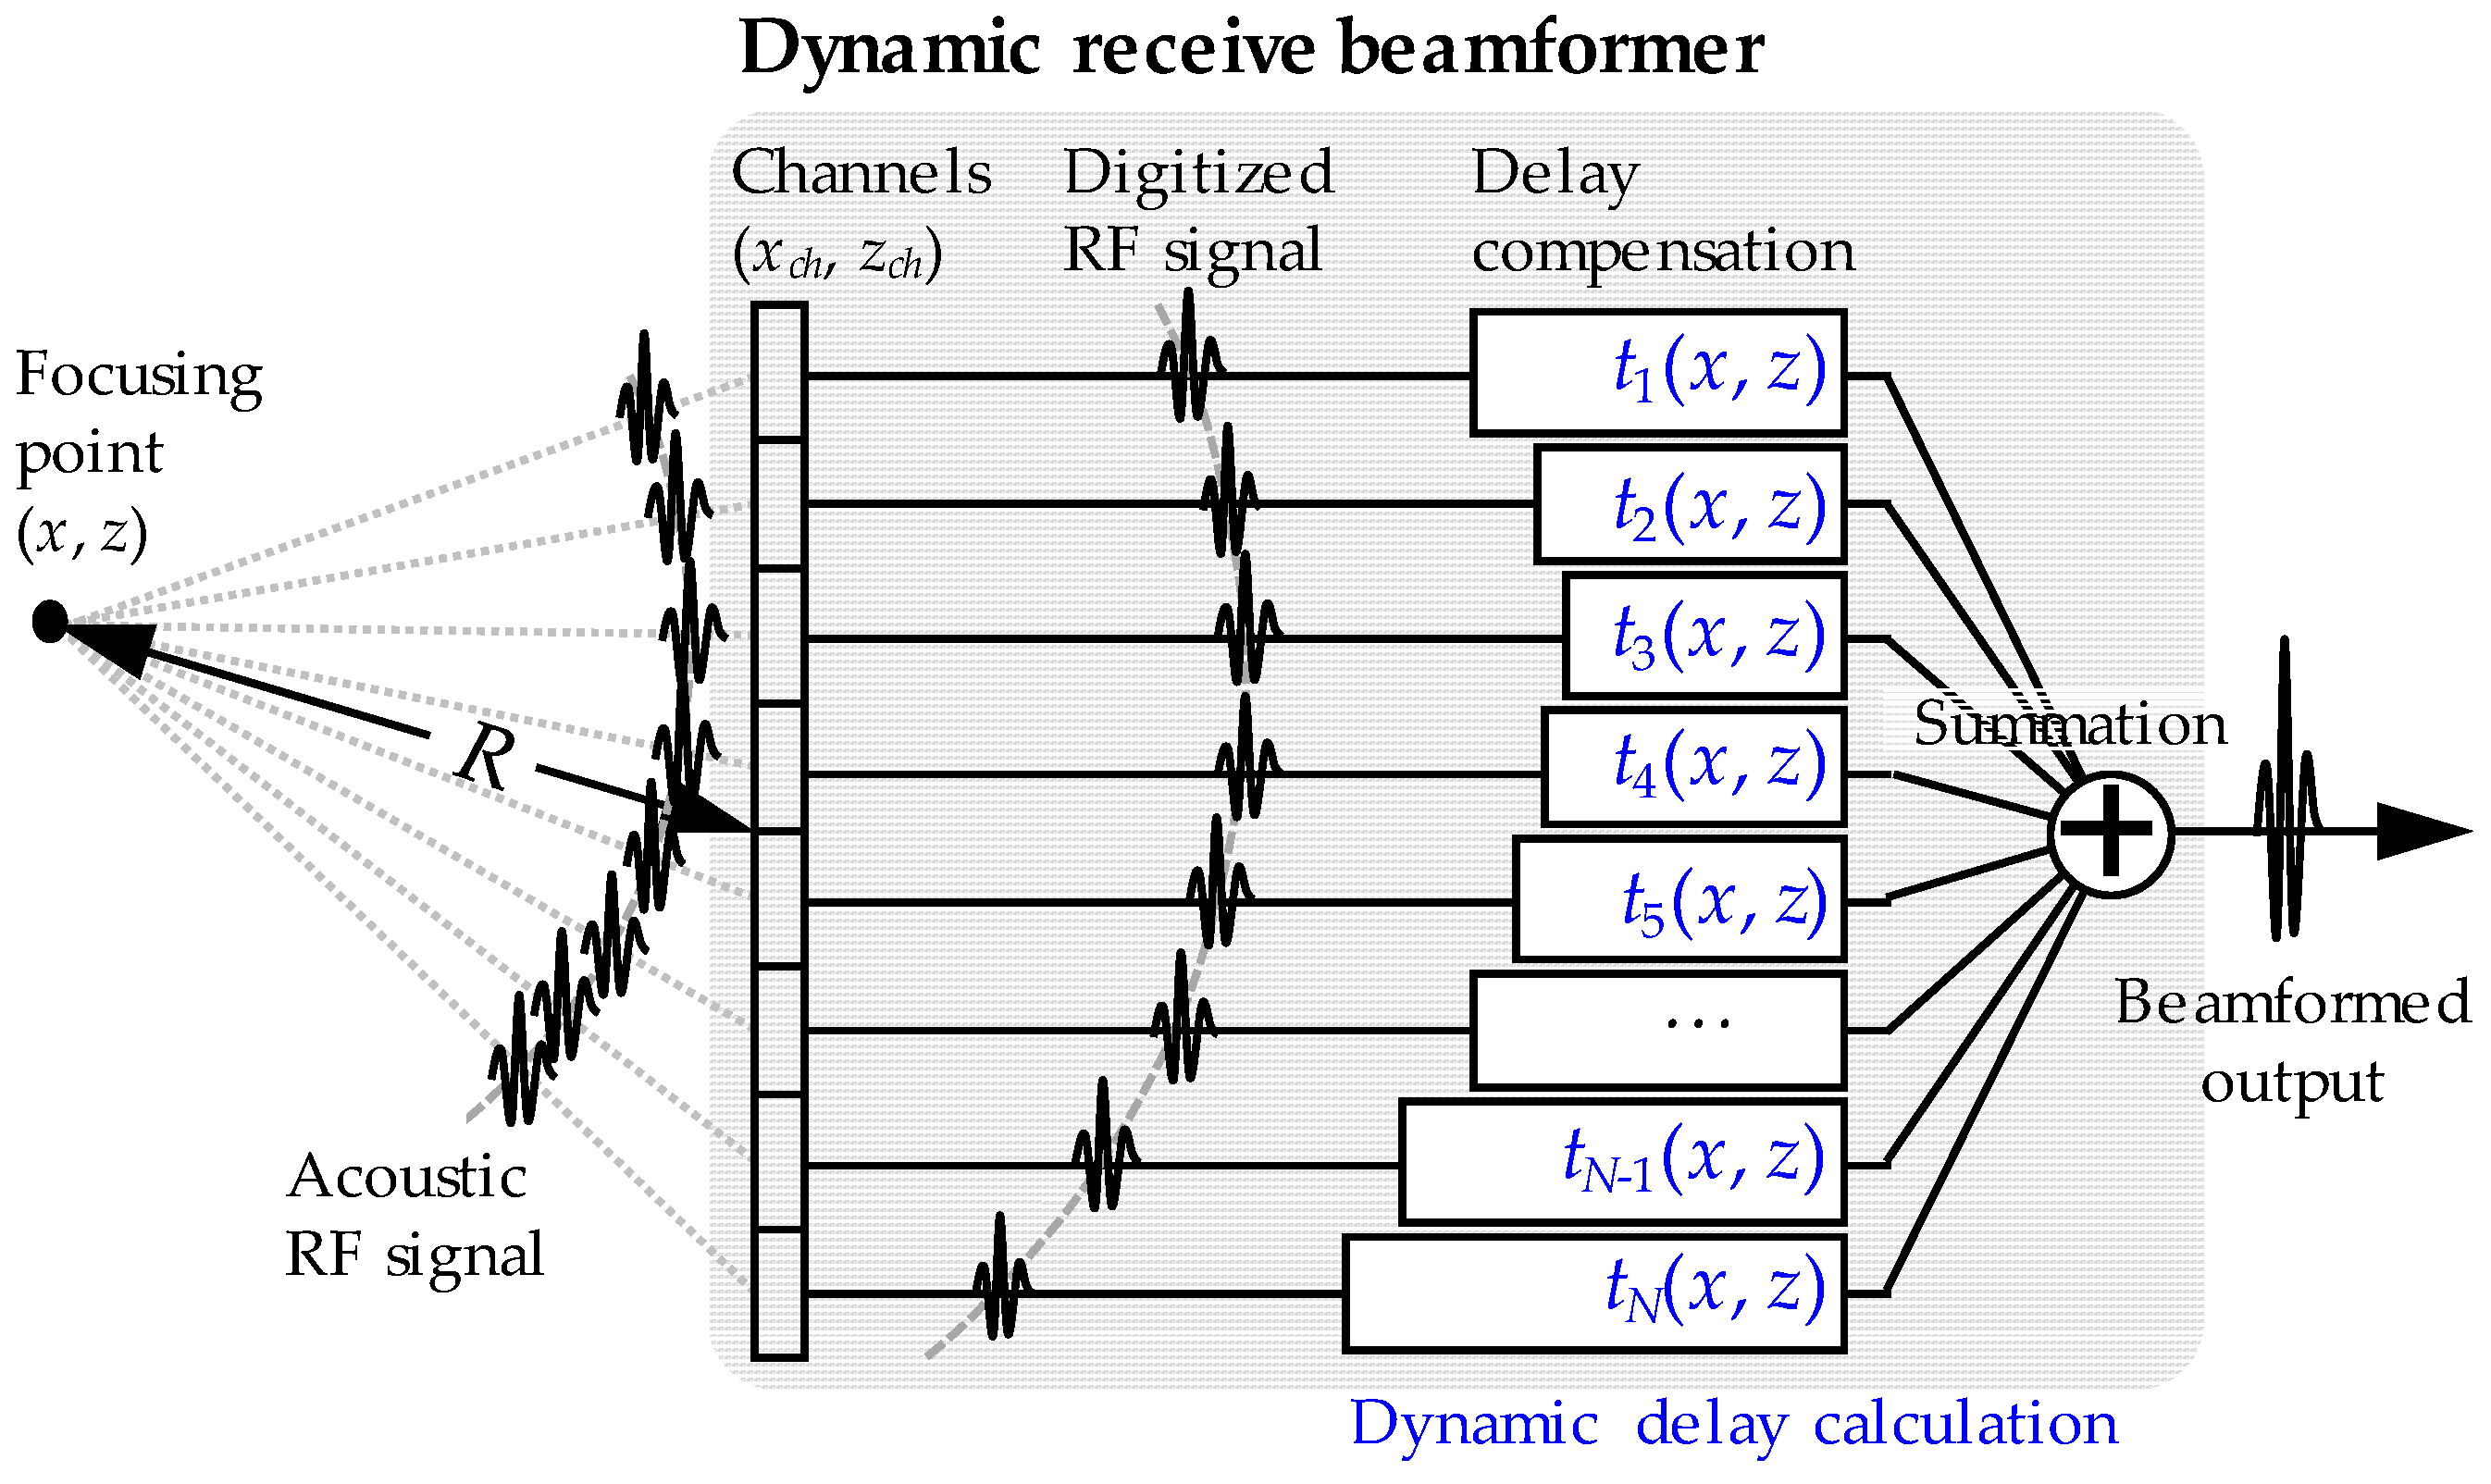
2.1. Dynamic Delay Calculation for Diagnostic U2.3ltrasound

Figure 1 shows the conceptual diagram of the dynamic receive beamforming block for the diagnostic US, which consists of the delay compensation for the digitized RF signals at each channel and its summation at each imaging depth. Each DDC event for a dynamic delay can be equated by
t c h ( x ,   z )   =   ( x c h     x ) 2 + ( z c h     z ) 2   +   R c
where ( x c h ,   z c h ) denotes the Cartesian geometry of the ch-th channel of the US array transducer ranging from 1 to the total number of channels (e.g., 128–256 in general); R is the distance between the center of the US transducer and a focusing point ( x ,   z ); t is the elapsed time since an acoustic transmission; c is the mean speed of sound in soft biological tissue, i.e., 1540 m/s.
In general, an electronic circuit for the DDC operates at an analog-to-digital conversion (ADC) frequency, usually >20 MHz, and its real-time calculation should be repeated at each beamforming point of multiple vertical scanlines (e.g., 128–512) comprising an image frame. For example, when assuming a DDC sequence for 128 scanlines and an 8 cm imaging depth at a 40 MHz ADC frequency in a 32-channel US system, 510.20 million of DDC events per second would be needed for a 30 Hz frame rate. Therefore, an efficient electronic DDC implementation would be crucial to secure the efficacy of an ultra-compact US imaging system in terms of hardware resource utilization and power consumption.

2.2. Pseudo-Dynamic Delay Calculation (PDC) Using Optimal Zone Segmentation

The PDC-Optimal method consists of a delay accumulator and a dedicated LUT module at each channel (Figure 2a). The LUT at each channel stores a preset for each zone segment, and it is fed to a dedicated delay accumulator for interpolating a dynamic delay at each focusing point during receive beamforming. Figure 2b shows how one can determine the delay increment and length of the N-th zone segment, i.e., Δ d N ( c h ) and LN(ch), as a function of the user-definable delay error allowance, τ . τ is defined by half of the target delay accuracy (e.g., 0.125, 0.25, 0.5, and 1 of τ for 0.25, 0.5, 1, and 2 of the target time delay resolution in the sample domain, respectively). This definition yields fs/2 τ of receive beamforming accuracy, in which fs is the data sampling frequency.
In Figure 2b, the ideal receive delay calculated by the unconstrained DDC method (i.e., d ideal ( z ,   c h ) ) is represented as a dashed line. Other solid lines present the receive delay of the PDC-Optimal method corresponding to τ . As one can see, as τ increases, the PDC-Optimal method has a larger N-th zone length although its delay error from the ideal delay is worsening. Note that modern US imaging systems are generally designed for 0.25 of target time delay resolution with a 4-f0 data sampling rate, in which f0 is the center frequency of an employed US transducer, leading to 16-f0 beamforming resolution [15,16]. The zone segment is defined by
L N ( c h )   = arg   m a x i ( i   | | d ideal ( z N ( c h )   +   i ,   c h )   d N 1 ( c h )     i   ·   Δ d test ( c h ) | <   τ ) .
Δ d test ( c h ) ranges from 0 to 1 in a bit quantization resolution, and index i 1 (integer number). The initial bit quantization resolution of Δ d test ( c h ) (i.e., Q ) is in 18 bit, determined for the highest-possible delay calculation accuracy from the default bit width of basic IPs in a modern field programmable gated array (FPGA). The Q would be further optimized in the following design procedures. d N 1 ( c h ) is the final delay at the previous N-1th zone segment; z N ( c h ) is the starting depth index of the N-th zone segment, given by
z N ( c h )   =   i   =   1 N 1 L i ( c h ) .
The Δ d test ( c h ) defining L N ( c h ) is the optimal delay increment in the N-th zone segment, denoted by Δ d N ( c h ) in this paper. The pre-defined preset for each zone segment is stored in an LUT allocated at each channel: Δ d N ( c h ) and L N ( c h ) . Therefore, total LUT size is dependent to Q so that an optimization would be needed. If the bit resolution for Δ d N ( c h ) is too low, the quantization error would deteriorate the designed beamforming accuracy in the N-th zone. However, a redundant bit resolution is either suboptimal, as the total data width of the preset would be increased. Therefore, we used a heuristic optimization between the number of zone segments and the LUT size for an individual US transducer, which is calculated by
Δ d N [ c h ]   =   arg   min Δ d N ( c h ) Q   L U T Q ,
which is subject to an unsigned fixed number Q , given u 1 . Q - 1 as a fractional bit resolution. · Q and L U T Q are the corresponding quantization operator and LUT memory size, respectively. The optimization of Q is conducted downward from an 18 bit resolution to lower resolutions (18, 17, 16, etc.) The LUT size L N ( c h ) is evaluated for each quantization resolution, and Δ d N ( c h ) Q giving the minimal L U T Q is set as Δ d N [ c h ] . Note that the bit resolution for L N ( c h ) is defined by the maximal zone length in sample (e.g., 10 bits for 1,024 samples = a 2 cm imaging depth at 40 MHz of fs and 1540 m/s of mean sound propagation speed in a biological tissue).
The pseudo-dynamic delay is calculated in our PDC-Optimal method as follows. In the first zone segment, the system writes d ideal ( 1 ,   c h ) Q = Δ d 1 [ c h ] on a delay latch (“D” in Figure 2a) to be used as d N 1 [ c h ] . When operating, a delay accumulator generates a pseudo-dynamic delay using the calculated preset for each zone segment, which is given by
d _ [ z N ( c h ) + i ,   c h ]   =   d N 1 [ c h ]   +   i   ·   Δ d N [ c h ]
in which i indicates each depth sample point within a zone segment, i.e., 1, 2, …, L N ( c h ) . The preset is updated when translating to the next zone segment.

2.3. Simulation Setup
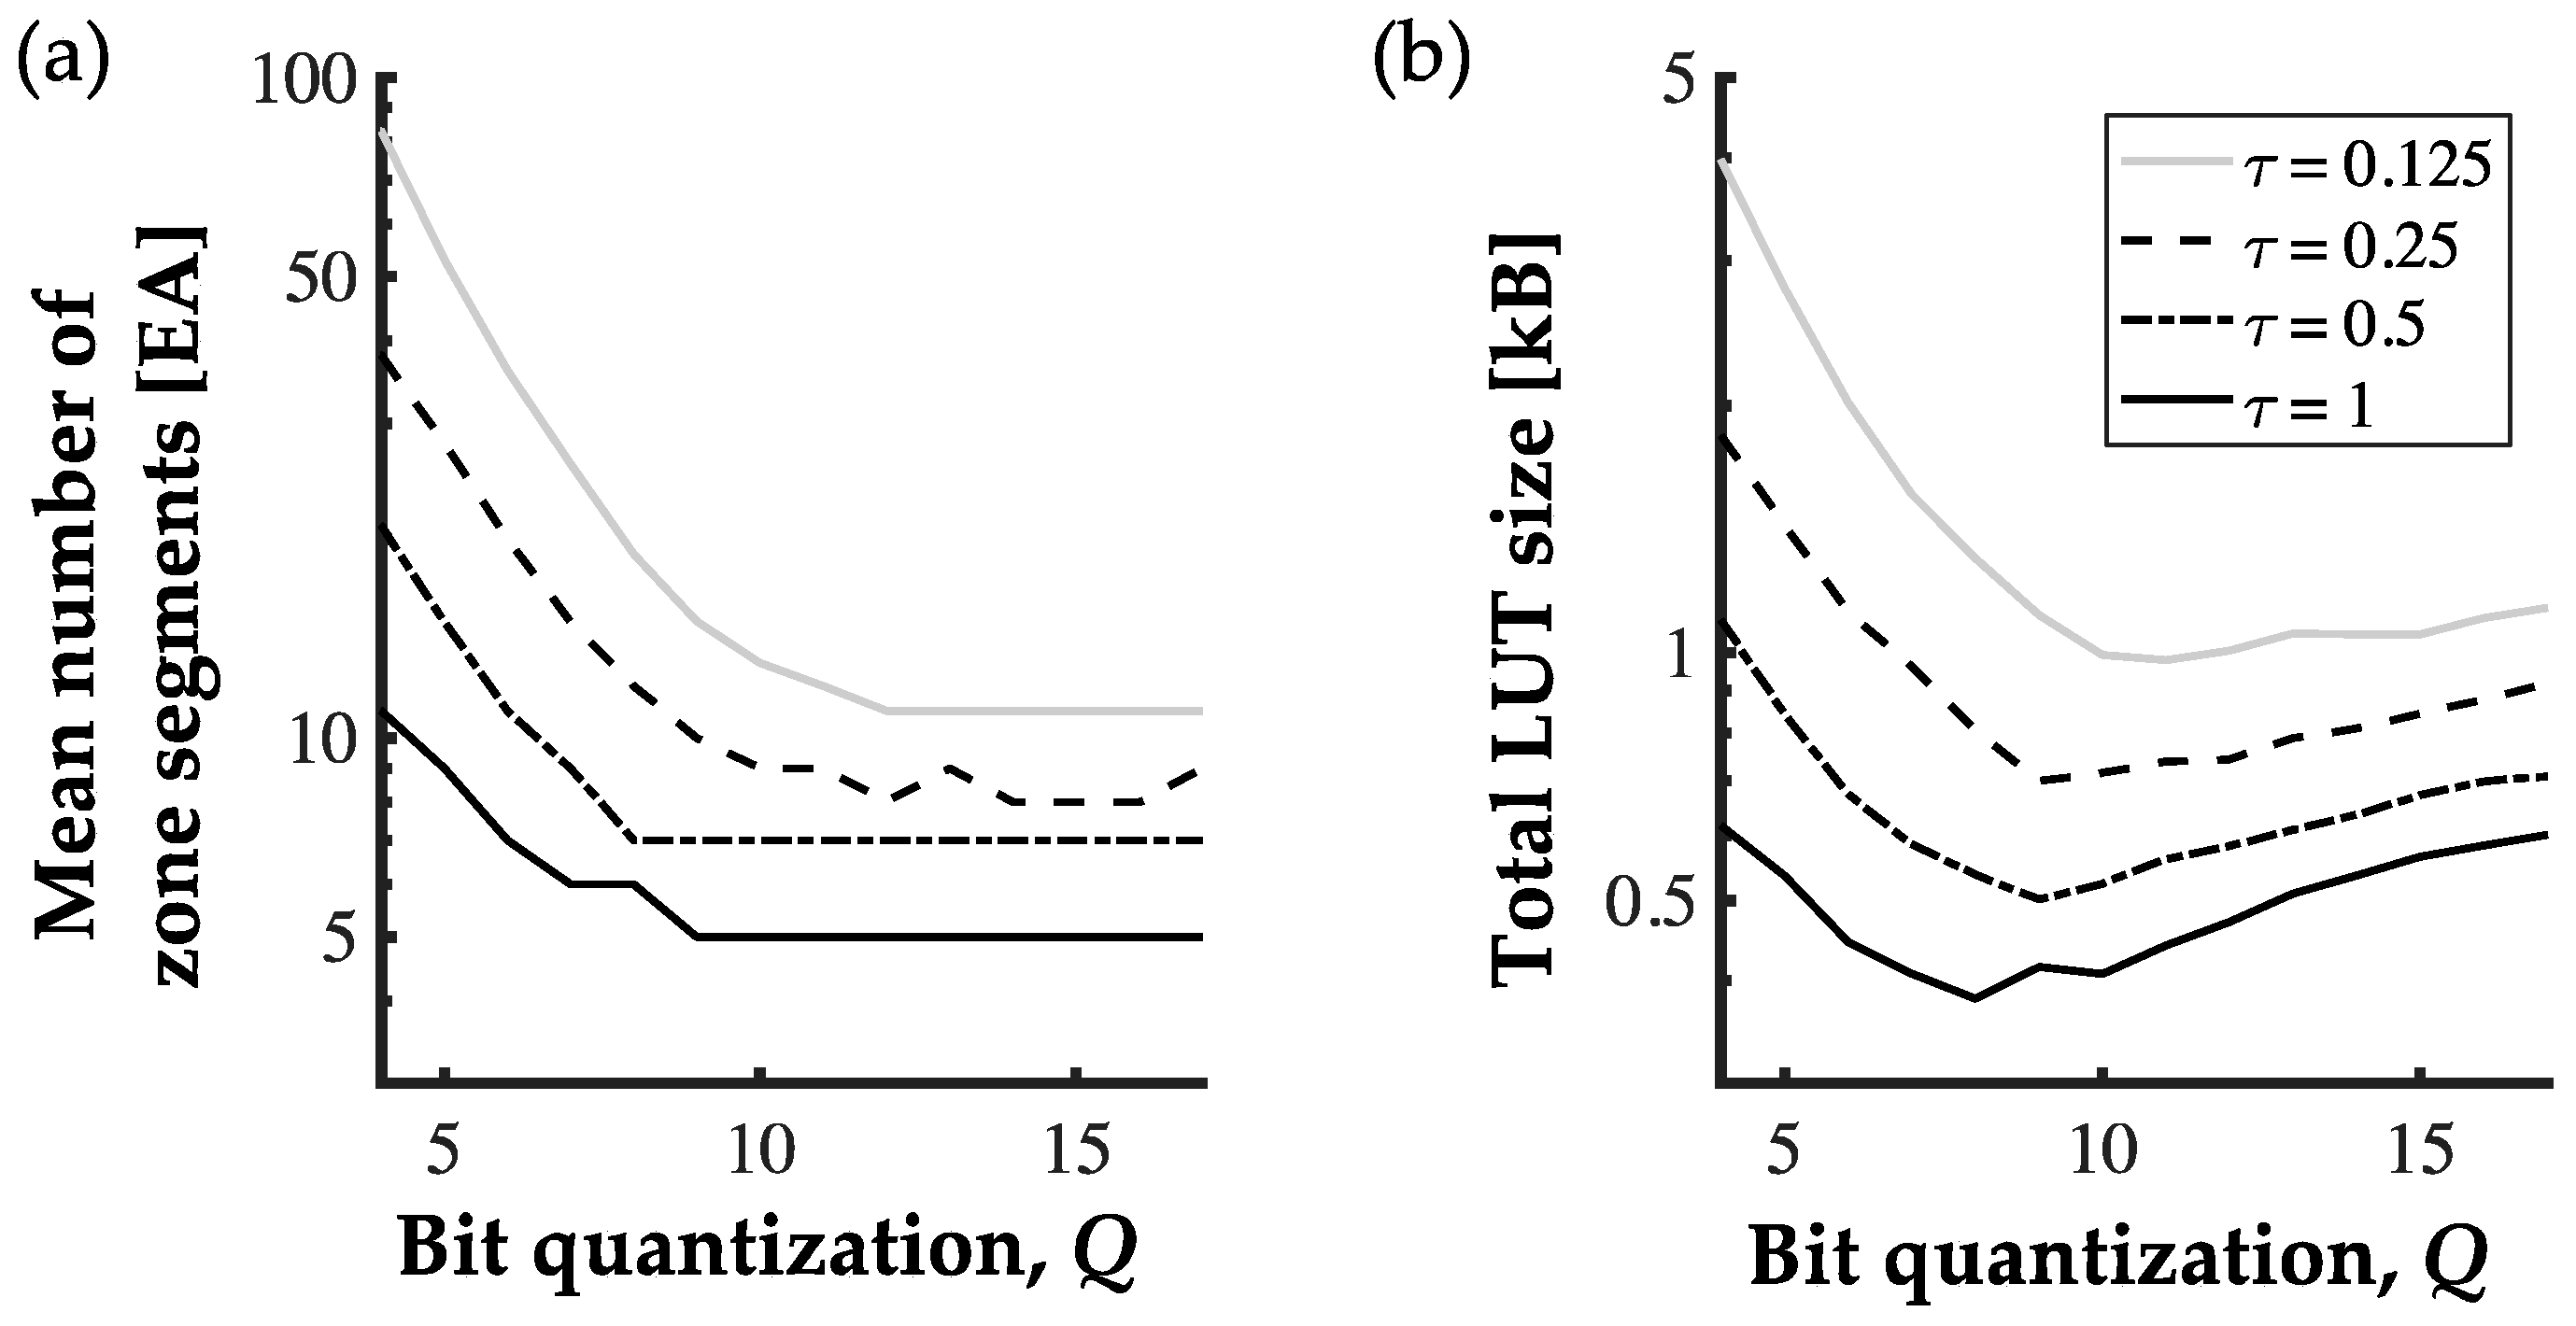
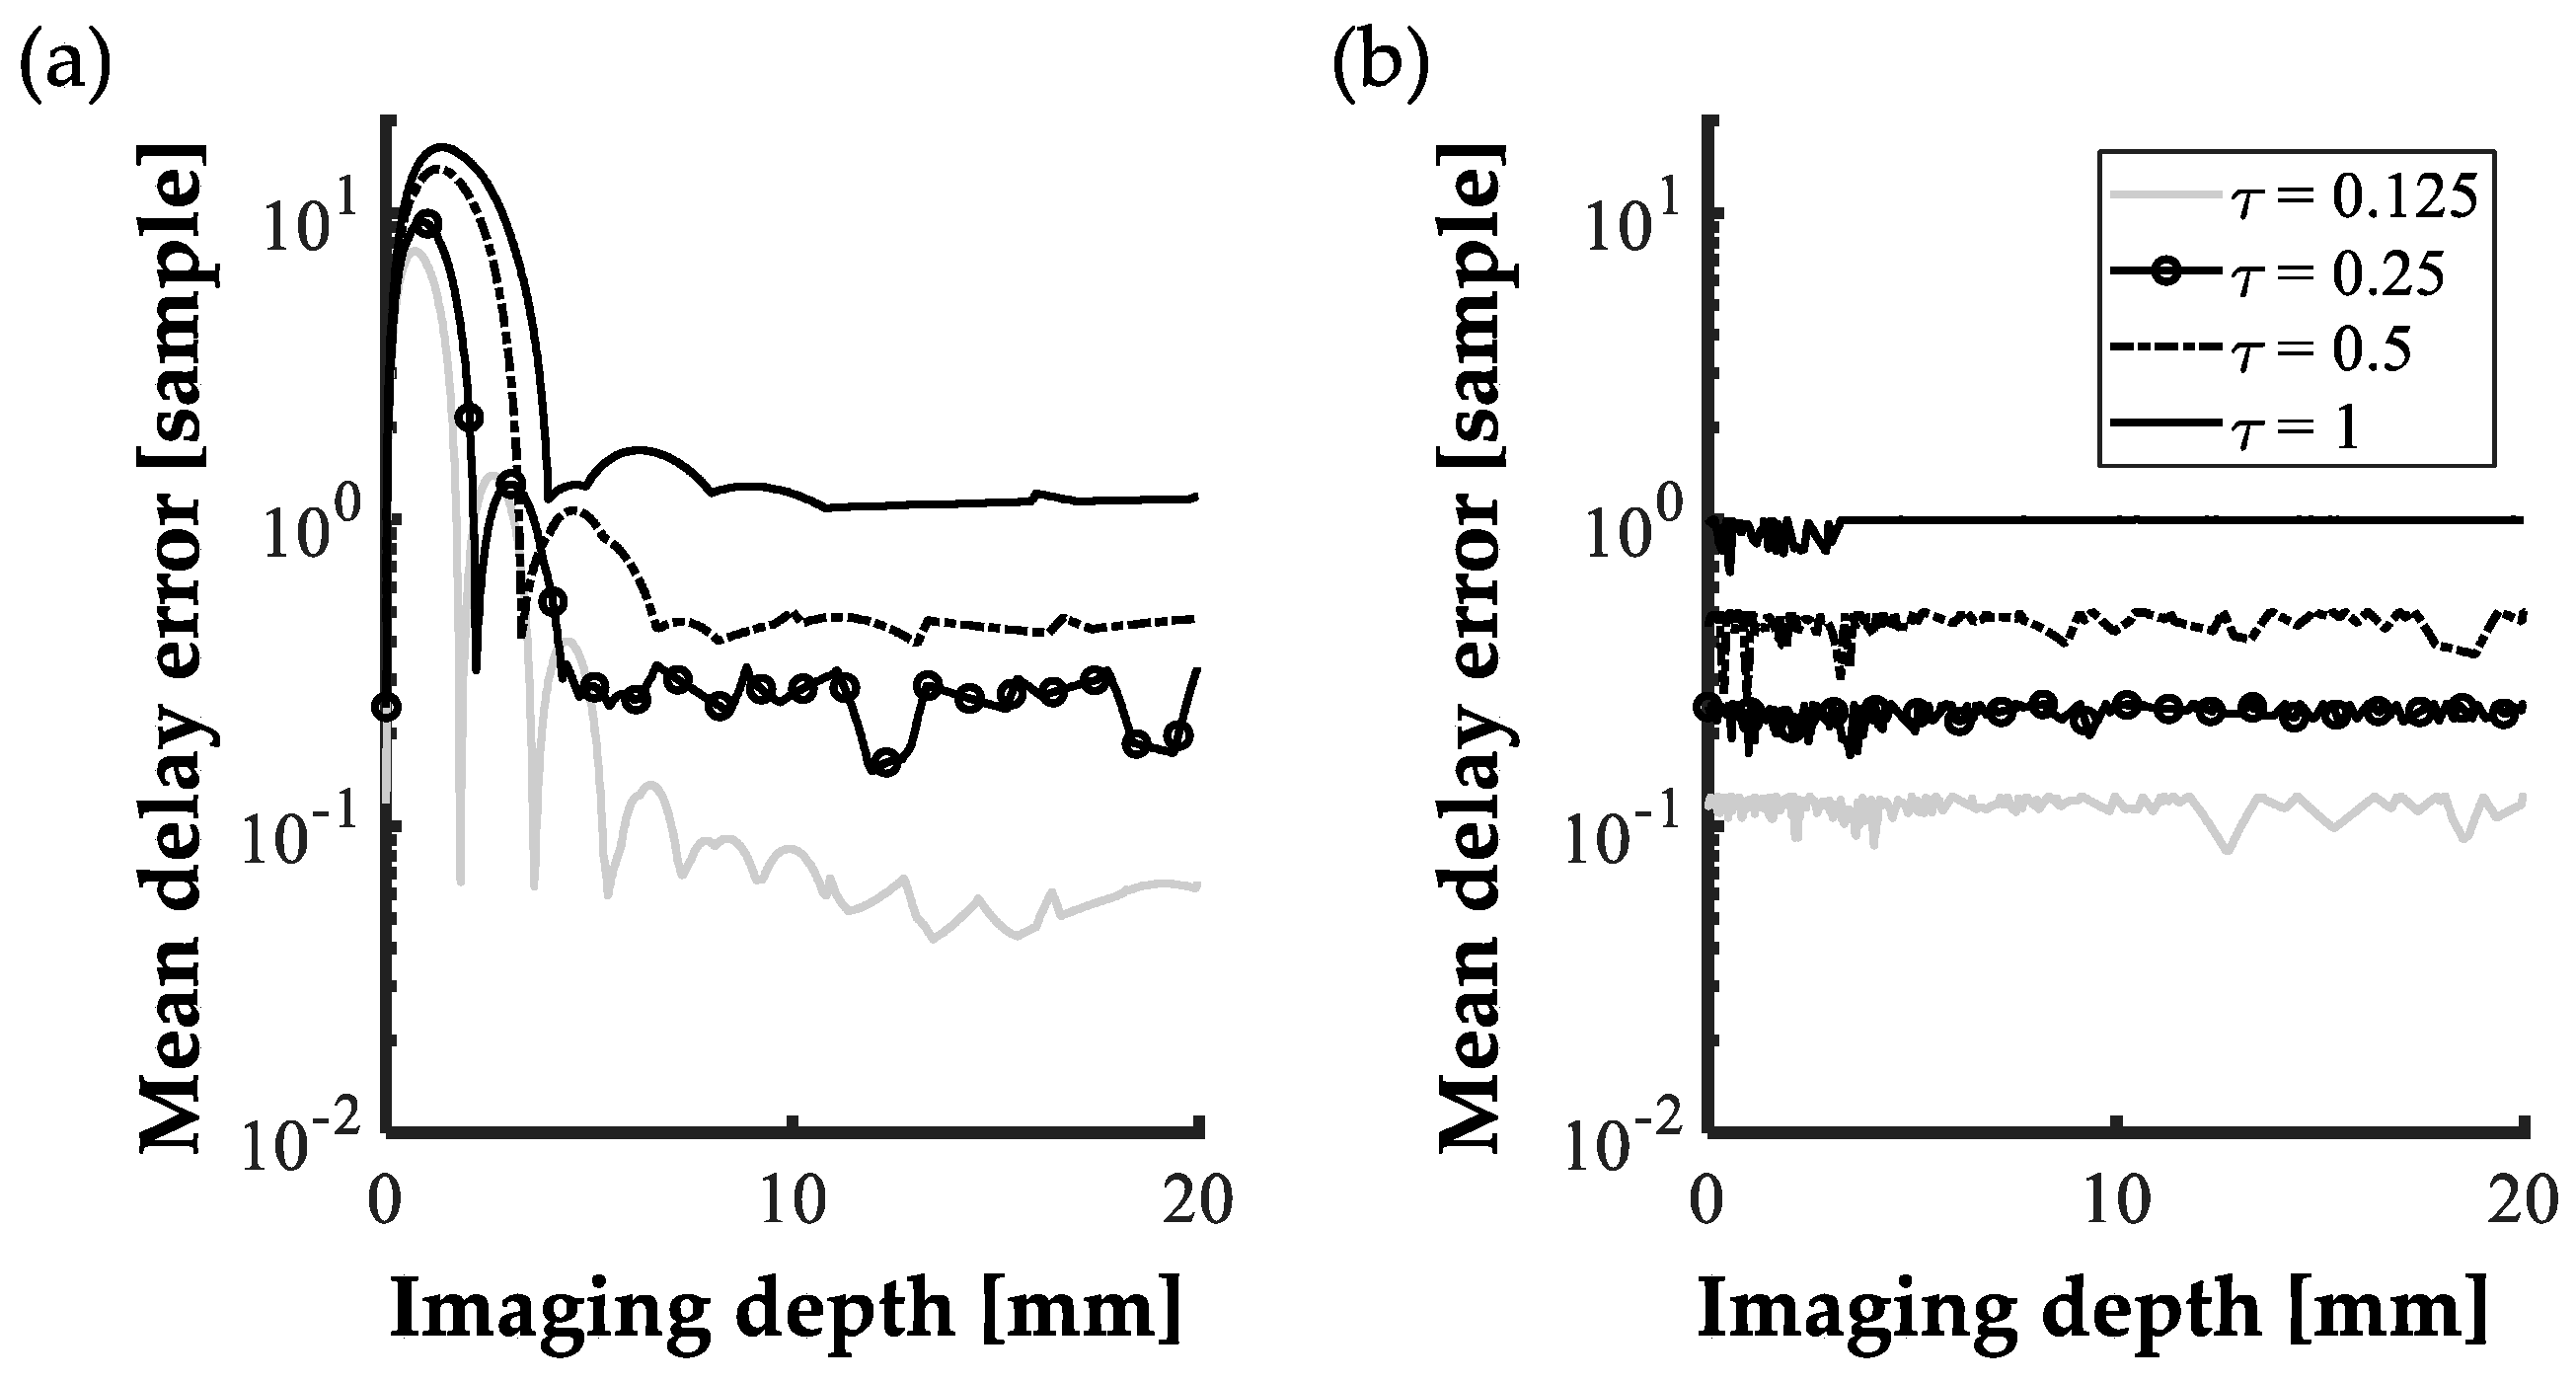
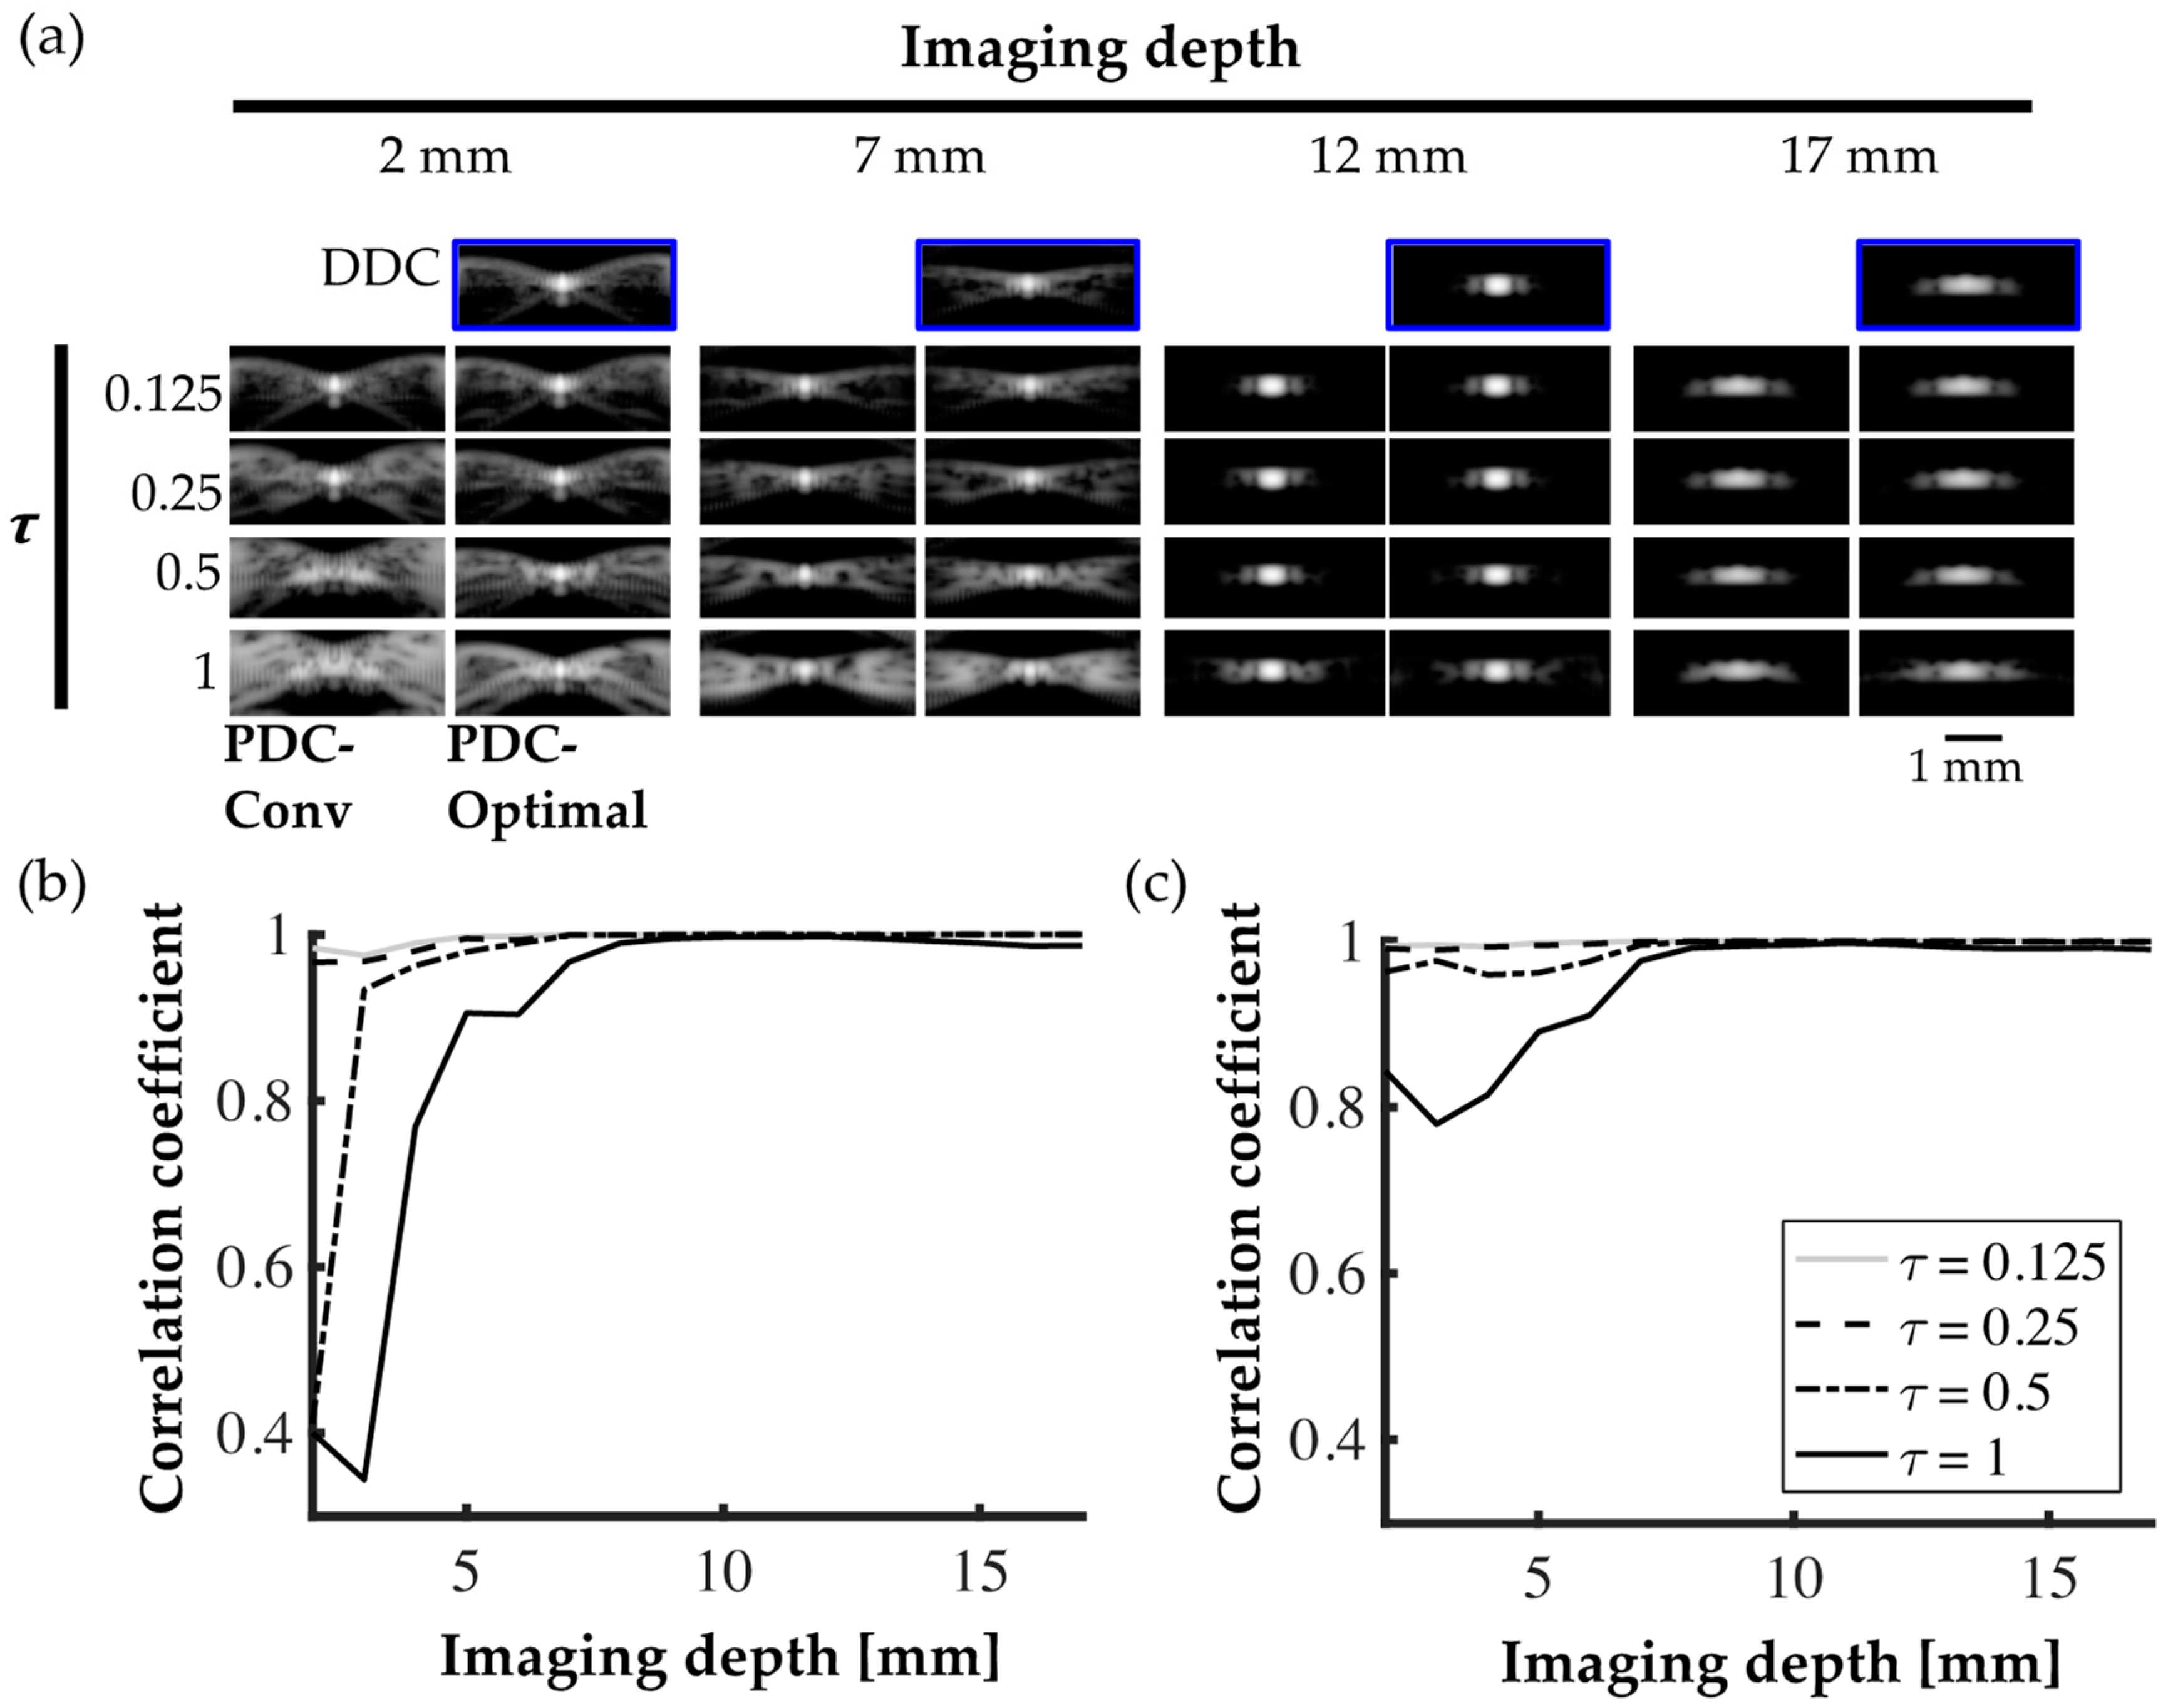
The delay calculation errors of the PDC-Conv and PDC-Optimal methods were evaluated compared to the unconstrained DDC method. The evaluation was performed with specific transducer specifications: 128-channel linear US array transducer at 15 MHz f0 with 100 µm of element pitch. The –6 dB fractional bandwidth was 48% from 11.4 MHz to 18.6 MHz. A 32-channel US system was assumed. The preset for the LUT (i.e., L N ( c h ) , and Δ d N ( c h ) ) was pre-calculated for 20 mm of imaging depth, which is typical in US diagnostics with the given f0. The fs was 60 MHz, i.e., 4 f0. Moreover, we conducted a comparative study for the ultrasound brightness mode (B-mode) images reconstructed by PDC-Conv and PDC-Optimal methods. The imaging quality expected from the aforementioned system configuration and imaging specifications was compared in a Field-II simulation [17]. The target geometry was comprised of the wire targets aligned in an axial direction at a center field of view from 2 mm to 17 mm in 1 mm intervals. The hardware resource utilization and dynamic power consumption were also estimated respectively in 32-channel unconstrained DDC, PDC-TS, and PDC-Optimal methods synthesized and implemented by a Vivado 14.4 on an Artix-7 FPGA (xc7A200T, Xilinx Inc., San Jose, CA, USA). Note that the estimated dynamic power consumption will project computational complexity in each method from the heterogeneous resources available in the FPGA (e.g., multipliers, adders, multiplexers, memories, etc.). The input voltages and operating frequency were equally applied for each method: fs, 40 MHz; 2.5 V for low-voltage differential signaling (LVDS) input; 3.3 V and 1.8 V for low-voltage complementary metal oxide semiconductor (LVCMOS) input.

3. Results

Figure 3a shows the mean number of zone segments across all channels as a function of Q for 0.125, 0.25, 0.5, and 1 of τ . As shown in Figure 3b, the total LUT size decreases with decreasing Q , although the mean number of zone segments remains fixed. However, once Q becomes lower than the optimal, the number of zone segments increases because a delay error would more easily exceed τ with quantization error in Equation (2). Conversely, each τ yielded a different optimal bit quantization resolution: 11, 9, 9, and 8 for 0.125, 0.25, 0.5, and 1 of τ , respectively (Figure 3b), which leads to differing mean numbers of zone segments: 12, 10, 7, and 6, respectively (Figure 3a). As a result, the total LUT sizes per channel were 982, 700, 502, and 380 bytes for 0.125, 0.25, 0.5, and 1 of τ , respectively.
Figure 4 presents the mean delay error across all delay approximation channels. An identical number of zone segments was used for the PDC-Conv and PDC-Optimal methods. For both methods, the errors were proportional to the number of zone segments, defined by τ in the proposed PDC-Optimal method. The delay error was well delimited in the proposed PDC-Optimal method at 0.125, 0.25, 0.5, and 1 over the entire imaging depth (Figure 4b). However, the PDC-Conv method exhibited unregulated performance especially in the near imaging depth, as shown in Figure 4a. In quantitative evaluation, the means and standard deviations of the dynamic delay errors throughout the imaging depths (0–20 mm) were 6.25 ± 1.82, 7.50 ± 2.39, 10.16 ± 3.94, and 11.66 ± 4.73 for the PDC-Conv method and 0.12 ± 0.02, 0.24 ± 0.04, 0.48 ± 0.09, and 0.99 ± 0.01 for the PDC-Optimal method, respectively at 0.125, 0.25, 0.5, and 1 of τ (p < 0.0001).
Figure 5a shows the point spread functions (PSFs) at different imaging depth for PDC-Conv and PDC-Optimal methods. In this figure, PSFs in the left and right subcolumns are reconstructed by PDC-Conv and PDC-Optimal methods corresponding to τ , respectively. Figure 5b,c shows a quantitative evaluation of the correlation coefficients (CCs) of the PSFs and those by the unconstrained DDC images at each depth. According to the average CCs in the superficial imaging depth (i.e., 0–5 mm), the PDC-Optimal method consistently yielded improved image quality compared to the PDC-Conv method: 1.00 ± 0.00, 0.99 ± 0.00, 0.97 ± 0.01, and 0.84 ± 0.05 for the PDC-Optimal method and 0.99 ± 0.01, 0.98 ± 0.01, 0.82 ± 0.27, and 0.60 ± 0.28 for the PDC-Conv method for 0.125, 0.25, 0.5, and 1 of τ , respectively. Otherwise, there was no significant difference in the deeper imaging depth (6–20 mm) between the methods. Both methods yielded > (0.98 ± 0.03), even when τ is set to 1. These results confirm the efficacy of the PDC-Optimal method: a well-defined design methodology with user-definable parameter τ , which is not available with the PDC-Conv method, and increasing uniformity in image quality compared to the PDC-Conv method.
Table 1 shows the hardware utilization and power consumption in the unconstrained DDC, PDC-TS, and PDC-Optimal methods. Active hardware resources for the PDC-Optimal method were significantly lower than those required by the unconstrained DDC method: the use of FF by 84.35–87.23% and the use of LUT by 94.19–95.78% for τ ranging from 0.125 to 1. Compared to the PDC-TS method, the hardware complexity of the PDC-Optimal method was comparable when τ is 0.125, although 13.83% and 49.54% of FF and LUT requirements could be further reduced when τ is 1. These savings in hardware resources reduces power consumption. The PDC-Optimal method decreased the dynamic power usage by 92.04–94.53% compared to the unconstrained DDC method and saved 20.00–45.00% of the dynamic power compared to the PDC-TS method for τ values ranging from 0.125 to 1.

4. Discussion and Conclusion

In the last few decades, there have been extensive accomplishments in point-of-care US imaging with several electronic systems in dedicated units [2,11], tablet PCs [18], and smartphone-based form factors [19]. This technological evolution inevitably necessitates more efficient receive beamforming for better clinical efficacy in terms of beamforming precision, system volume, and battery life. In this paper, we present the PDC-Optimal method for efficient implementation of ultra-compact US imaging systems as well as flexible user experience in various clinical settings. Using the L N ( c h ) and Δ d N ( c h ) optimized for each imaging zone (Figure 2 and Figure 3), the PDC-Optimal method presented the flexible yet regulated beamforming accuracy by a user-definable delay error allowance, τ . The beamforming accuracy of the PDC-Optimal method could be comparable to the unconstrained DDC method, whereas the PDC-Conv method suffered from substantial image degradation in the near imaging field when the same number of zone segments was used (Figure 4). Moreover, the PDC-Optimal method could significantly reduce hardware complexity and dynamic power consumption compared to the unconstrained DDC and PDC-TS methods (Table 1), which will enable a more compact system volume and a lighter weight with a longer battery life. We already embodied the proposed PDC-Optimal method in 16-channel tablet PC-based and smartphone-based prototypes using a low-cost FPGA (Spartan-6 LX150, Xilinx Inc., USA) [18,19,20]. The prototype was 180 × 55 × 35 mm3 and ~180 g, supporting B-mode and color Doppler mode at 1 of τ . The optimization of the PDC-Optimal method in these prototypes is currently being conducted and will be presented in a future publication.
These advantages of the PDC-Optimal method may lead to the improvement in its clinical efficacy in point-of-care diagnostics. For example, in prehospital settings in disaster and battlefield medicine, requiring as many diagnostic tasks as possible with a single charging, the PDC-Optimal method may be configured for the longest-possible operation time while moderating beamforming accuracy (e.g., τ   1). Moreover, if there is any need for high-precision imaging during the imaging sessions, an update of the LUT (e.g., τ   < 1) would shortly take effect and provide a higher image quality (up to the unconstrained DDC accuracy) over the entire imaging depth. Note that the transition of τ may necessitate a short FPGA reconfiguration time, but it could be minimized by the partial reconfiguration method [21]. On the other hand, in a daily diagnostic setting at patients’ bedside with accessible power supplies nearby, the maximal performance setting may be continuously used (i.e., τ = 0.125 for 16-f0 temporal resolution in delay compensation). In summary, the proposed PDC-Optimal method with a clear design methodology will support dynamic performance calibration for the best user experiences in the widest possible clinical settings with a single US imaging platform.
Our further work will be first focused on a translational investigation to establish the standards in beamforming accuracy and battery life in various clinical settings with considerations on different US transducer specifications (e.g., FAST examination for internal bleeding or pneumothorax using low-f0 linear/convex arrays with wide aperture, bedside triage of skin or musculoskeletal diseases using high-f0 linear arrays with narrow aperture, and extreme settings for disaster, battlefield, and/or outdoor diagnostics). This study will help us to find the detailed parameters for each application to secure an effective range of beamforming accuracy (e.g., relative mainlobe width to DDC), the minimal battery life, and an ergonomically applicable system volume. From the quantitative design specifications established, a prototype will be further optimized to support the clinical diagnosis in the most effective form factor. Afterward, the prototype system will be validated by a comprehensive performance evaluation and human clinical trials in practical circumstances. In addition, we also envision the extended use of the proposed PDC-Optimal method beyond the conventional US diagnostics. The photoacoustic (PA) imaging is an emerging biomedical imaging modality, in which a rich optical absorptive contrast at acoustic imaging depth (several centimeters) can be obtained [22,23,24]. Recently there have also been arising demands for, and investigations on, compact PA imaging systems [25,26,27], where an efficient beamforming solution is essential [28,29,30]. This may be needed for space-limiting clinical applications such as surgical and interventional guidance [24,31,32,33]. Moreover, a compact system volume in PA imaging may extend its scientific efficacy. For example, it may enable an implantable and/or wearable PA neurosensing system for continuous monitoring, leading to successful translations of current neuroscientific findings and neuro-engineering innovations into practice [24,25,26,27,28,29,30,31,32,33,34,35,36].

Author Contributions

Conceptualization, P.K., J.K., and T.-K.S.; methodology, validation, analysis, and data curation, P.K. and J.K.; resources, T.-K.S.; writing—original draft preparation, P.K.; Writing—review and editing, supervision, and project administration, J.K. and T.K.S.

Funding

This research was supported by the R&D program of MOTIE/KEIT (10076675, Development of MR Based High Intensity Focused Ultrasound Systems for Brain and Urinogenital Diseases). Jeeun Kang, Ph.D., was supported by the Basic Science Research Program through the National Research Foundation of Korea (NRF) funded by the Ministry of Education (2018R1A6A3A03011551).

Conflicts of Interest

The authors declare no conflict of interest. The funders had no role in the design of the study; in the collection, analyses, or interpretation of data; in the writing of the manuscript; or in the decision to publish the results.

Abbreviations

DDCdynamic delay calculations
PDCpseudo-dynamic delay calculations
FFflip-flop
LUTlook-up-table
LVDSlow-voltage differential signaling
LVCMOSlow-voltage complementary metal oxide semiconductor
PDC-TStime-sharing pseudo-dynamic delay calculations
PDC-Convconventional pseudo-dynamic delay calculations using uniform zone segmentation
PDC-Optimalpseudo-dynamic delay calculations using an optimal zone segmentation with non-uniform intervals
USultrasound
ADCanalog-to-digital conversion
RTCreal-time controller
RFradio-frequency signal
FPGAfield programmable gated array
PSFpoint-spread function
CCcorrelation coefficient
PAphotoacoustic

References

  1. Moore, C.L.; Copel, J.A. Point-of-care ultrasonography. N. Engl. J. Med. 2011, 364, 749–757. [Google Scholar] [CrossRef] [PubMed]
  2. Kim, G.-D.; Yoon, C.; Kye, S.-B.; Lee, Y.; Kang, J.; Yoo, Y.; Song, T.-K. A single FPGA-based portable ultrasound imaging system for point-of-care applications. IEEE Trans. Ultrason. Ferroelectr. Freq. Control 2012, 59, 1386–1394. [Google Scholar] [PubMed]
  3. Shin, B.; Jeon, S.; Ryu, J.; Kwon, H.J. Elastography for portable ultrasound. Biomed. Eng. Lett. 2017, 8, 101–116. [Google Scholar] [CrossRef] [PubMed]
  4. Di Ianni, T.; Hoyos, C.A.V.; Ewertsen, C.; Kjeldsen, T.K.; Mosegaard, J.; Nielsen, M.B.; Jensen, J.A. A Vector Flow Imaging Method for Portable Ultrasound Using Synthetic Aperture Sequential Beamforming. IEEE Trans. Ultrason. Ferroelectr. Freq. Control 2017, 64, 1655–1665. [Google Scholar] [CrossRef] [PubMed]
  5. George, S.S.; Huang, M.C.; Ignjatovic, Z. Portable ultrasound imaging system with super-resolution capabilities. Ultrasonics 2018, in press. [Google Scholar] [CrossRef] [PubMed]
  6. George, S.; Anand, A.; Mitrovic, J.; Ignjatovic, Z. Low-complexity compressive beamforming for portable ultrasound imaging. In Proceedings of the 2017 IEEE International Ultrasonics Symposium (IUS), Washington, DC, USA, 6–9 September 2017. 17318162. [Google Scholar] [CrossRef]
  7. Kim, J.H.; Yeo, S.; Kim, J.W.; Kim, K.; Song, T.-K.; Yoon, C.; Sung, J. Real-Time Lossless Compression Algorithm for Ultrasound Data Using BL Universal Code. Sensors 2018, 18, 3314. [Google Scholar] [CrossRef] [PubMed]
  8. Szasz, T.; Basarab, A.; Vaida, M.-F.; Kouamé, D. Elastic-net based beamforming in medical ultrasound imaging. In Proceedings of the 2016 IEEE 13th International Symposium on Biomedical Imaging (ISBI), Prague, Czech Republic, 13–16 April 2016; pp. 477–480. [Google Scholar]
  9. Byram, B.; Dei, K.; Tierney, J.; Dumont, D. A model and regularization scheme for ultrasonic beamforming clutter reduction. IEEE Trans. Ultrason. Ferroelectr. Freq. Control 2015, 62, 1913–1927. [Google Scholar] [CrossRef] [PubMed]
  10. China, D.; Tom, F.; Nandamuri, S.; Kar, A.; Srinivasan, M.; Mitra, P.; Sheet, D. UltraCompression: Framework for High Density Compression of Ultrasound Volumes using Physics Modeling Deep Neural Networks. arXiv, 2019; arXiv:1901.05880. Available online: https://arxiv.org/abs/1901.05880v1(accessed on 10 February 2019).
  11. Kang, J.; Yoon, C.; Lee, J.; Kye, S.-B.; Lee, Y.; Chang, J.H.; Kim, G.-D.; Yoo, Y.; Song, T.-K. A System-on-Chip Solution for Point-of-Care Ultrasound Imaging Systems: Architecture and ASIC Implementation. IEEE Trans. Biomed. Circuits Syst. 2016, 10, 1. [Google Scholar] [CrossRef] [PubMed]
  12. Mucci, R. A comparison of efficient beamforming algorithms. IEEE Trans. Acoust. Speech Signal Process. 1984, 32, 548–558. [Google Scholar] [CrossRef]
  13. Sohn, H.-Y.; Kang, J.; Cho, J.; Song, T.-K.; Yoo, Y. Time-sharing bilinear delay interpolation for ultrasound dynamic receive beamformer. Electron. Lett. 2011, 47, 89–91. [Google Scholar] [CrossRef]
  14. Yoon, C.; Kim, H.H.; Shung, K.K. Development of a Low-Complexity, Cost-Effective Digital Beamformer Architecture for High-Frequency Ultrasound Imaging. IEEE Trans. Ultrason. Ferroelectr. Freq. Control 2017, 64, 1002–1008. [Google Scholar] [PubMed]
  15. Cho, J.; Lee, J.-Y.; Song, J.-H.; Kim, Y.; Song, T.-K. A fractional filter-based beamformer architecture using postfiltering approach to minimize hardware complexity. IEEE Trans. Ultrason. Ferroelectr. Freq. Control 2007, 54, 1076–1079. [Google Scholar] [CrossRef] [PubMed]
  16. Li, P.-C.; Huang, J.-J.; Liu, H.-L.; O’Donnell, M. A Dynamic Focusing Technique for Delta-Sigma-Based Beamformers. Ultrason Imaging 2000, 22, 197–205. [Google Scholar] [CrossRef] [PubMed]
  17. Fink, M.; Kuperman, W.A.; Montagner, J.-P.; Tourin, A. (Eds.) Imaging of Complex Media with Acoustic and Seismic Waves; Springer: Berlin/Heidelberg, Germany, 2002; pp. 135–166. [Google Scholar]
  18. Lee, Y.; Kang, J.; Yeo, S.; Lee, J.; Kim, G.-D.; Yoo, Y.; Song, T.-K. A new smart probe system for a tablet PC-based point-of-care ultrasound imaging system: Feasibility study. In Proceedings of the 2014 IEEE International Ultrasonics Symposium, Chicago, IL, USA, 3–6 September 2014. 14698497. [Google Scholar] [CrossRef]
  19. Ahn, S.; Kang, J.; Kim, P.; Lee, G.; Jeong, E.; Jung, W.; Park, M.; Song, T.-K. Smartphone-based portable ultrasound imaging system: Prototype implementation and evaluation. In Proceedings of the 2015 IEEE International Ultrasonics Symposium (IUS), Taipei, Taiwan, 21–24 October 2015. 15601699. [Google Scholar] [CrossRef]
  20. Jeong, E.; Bae, S.; Park, M.; Jung, W.; Kang, J.; Song, T.-K. Color Doppler imaging on a smartphone-based portable US system: Preliminary study. In Proceedings of the 2015 IEEE International Ultrasonics Symposium (IUS), Taipei, Taiwan, 21–24 October 2015. [Google Scholar] [CrossRef]
  21. Churiwala, S. (Ed.) Designing with Xilinx® FPGAs: Using Vivado; Springer: Cham, Switzerland, 2017; pp. 237–249. [Google Scholar]
  22. Wang, L.V.; Hu, S. Photoacoustic Tomography: In Vivo Imaging from Organelles to Organs. Science 2012, 335, 1458–1462. [Google Scholar] [CrossRef] [PubMed]
  23. Wang, L.V. Multiscale photoacoustic microscopy and computed tomography. Nat. Photonics 2009, 3, 503–509. [Google Scholar] [CrossRef] [PubMed]
  24. Kang, J.; Chang, J.H.; Kim, S.M.; Lee, H.J.; Kim, H.; Wilson, B.C.; Song, T.-K. Real-time sentinel lymph node biopsy guidance using combined ultrasound, photoacoustic, fluorescence imaging: in vivo proof-of-principle and validation with nodal obstruction. Sci. Rep. 2017, 7, 45008. [Google Scholar] [CrossRef] [PubMed]
  25. Kalva, S.K.; Upputuri, P.K.; Pramanik, M. High-speed, low-cost, pulsed-laser-diode-based second-generation desktop photoacoustic tomography system. Opt. Lett. 2019, 44, 81–84. [Google Scholar] [CrossRef]
  26. Upputuri, P.K.; Pramanik, M. Performance characterization of low-cost, high-speed, portable pulsed laser diode photoacoustic tomography (PLD-PAT) system. Biomed. Opt. Express 2015, 6, 4118–4129. [Google Scholar] [CrossRef]
  27. Daoudi, K.; van den Berg, P.J.; Rabot, O.; Kohl, A.; Tisserand, S.; Brands, P.; Steenbergen, W. Handheld probe integrating laser diode and ultrasound transducer array for ultrasound/photoacoustic dual modality imaging. Opt. Express 2014, 22, 26365–26374. [Google Scholar] [CrossRef]
  28. Mozaffarzadeh, M.; Mahloojifar, A.; Orooji, M.; Adabi, S.; Nasiriavanaki, M. Double-Stage Delay Multiply and Sum Beamforming Algorithm: Application to Linear-Array Photoacoustic Imaging. IEEE Trans. Biomed. Eng. 2018, 65, 31–42. [Google Scholar] [CrossRef]
  29. Mozaffarzadeh, M.; Mahloojifar, A.; Orooji, M.; Kratkiewicz, K.; Adabi, S.; Nasiriavanaki, M. Linear-array photoacoustic imaging using minimum variance-based delay multiply and sum adaptive beamforming algorithm. J. Biomed. Opt. 2018, 23, 026002. [Google Scholar] [CrossRef] [PubMed]
  30. Omidi, P.; Zafar, M.; Mozaffarzadeh, M.; Hariri, A.; Haung, X.; Orooji, M.; Nasiriavanaki, M. A Novel Dictionary-Based Image Reconstruction for Photoacoustic Computed Tomography. Appl. Sci. 2018, 8, 1570. [Google Scholar] [CrossRef]
  31. Kang, J.; Kim, E.-K.; Kim, G.R.; Yoon, C.; Song, T.-K.; Chang, J.H. Photoacoustic imaging of breast microcalcifications: a validation study with 3-dimensional ex vivo data and spectrophotometric measurement. J. Biophotonics 2015, 8, 71–80. [Google Scholar] [CrossRef] [PubMed]
  32. Kim, G.R.; Kang, J.; Kwak, J.Y.; Chang, J.H.; Kim, S., II; Youk, J.H.; Moon, H.J.; Kim, M.J.; Kim, E.-K. Photoacoustic Imaging of Breast Microcalcifications: A Preliminary Study with 8-Gauge Core-Biopsied Breast Specimens. PLoS ONE 2014, 9, e105878. [Google Scholar] [CrossRef] [PubMed]
  33. Kang, J.; Kim, E.-K.; Kwak, J.Y.; Yoo, Y.; Song, T.-K.; Chang, J.H. Optimal laser wavelength for photoacoustic imaging of breast microcalcifications. Appl. Phys. Lett. 2011, 99, 153702. [Google Scholar] [CrossRef]
  34. Rao, B.; Zhang, R.; Li, L.; Shao, J.-Y.; Wang, L.V. Photoacoustic imaging of voltage responses beyond the optical diffusion limit. Sci. Rep. 2017, 7, 2560. [Google Scholar] [CrossRef]
  35. Kang, J.; Zhang, H.K.; Kadam, S.D.; Fedorko, J.; Valentine, H.; Malla, A.P.; Yan, P.; Harraz, M.M.; Kang, J.U.; Rahmim, A.; et al. Transcranial recording of electrophysiological neural activity in the rodent brain in vivo using functional photoacoustic imaging of near-infrared voltage-sensitive dye. bioRxiv 2019. Available online: https://www.biorxiv.org/content/10.1101/202408v10 (accessed on 12 January 2019). [CrossRef]
  36. Nasiriavanaki, M.; Xia, J.; Wan, H.; Bauer, A.Q.; Culver, J.P.; Wang, L.V. High-resolution photoacoustic tomography of resting-state functional connectivity in the mouse brain. PNAS 2014, 111, 21–26. [Google Scholar] [CrossRef]
Figure 1. Illustration for dynamic receive beamforming in a medical ultrasound system.
Electronics 08 00242 g001
Figure 2. The proposed PDC-Optimal method. (a) Schematic diagram; (b) determination of the Nth zone length, LN(ch), which provides flexibility between beamforming accuracy and the number of calculations needed. Dotted line presents an ideal delay for each beamforming depth, z, at a channel, ch. LUT: look-up table; RTC: real-time controller; D: delay latch; RF: radio-frequency signal.
Electronics 08 00242 g002
Figure 3. The optimization results for bit resolution of Δ d N [ c h ] in the PDC-Optimal method subject to allowance error. (a) The mean zone size averaged over all channels; (b) total LUT memory size.
Electronics 08 00242 g003
Figure 4. Mean delay error across channels at each imaging depth using the (a) PDC-Conv and (b) PDC-Optimal methods for varying τ : 0.125, 0.25, 0.5, and 1. An identical number of zone segments was used for both methods (i.e., 12, 10, 7, and 6 for 0.125, 0.25, 0.5, and 1 of τ , respectively).
Electronics 08 00242 g004
Figure 5. Field-II simulation. (a) Representative point-spread functions at 2-, 7-, 12-, and 17-mm depth. Correlation coefficients of PSFs in the (b) PDC-Conv and (c) PDC-Optimal methods and those by the unconstrained DDC for varying τ (i.e., 0.125, 0.25, 0.5, and 1).
Electronics 08 00242 g005
Table 1. Hardware resource utilization and on-chip power consumption of the DDC, PDC-TS, and PDC-Optimal methods in a target FPGA. FF: flip-flop; LUT: look-up table.
MethodDDCPDC-TS PDC - Optimal   ( τ )
0.1250.250.51
Hardware resourceFF20,97231083283295628862678
LUT45,05937692616233021731902
Dynamic power (mW)4024032272422

