Article

WSN Hardware for Automotive Applications: Preliminary Results for the Case of Public Transportation

1
Department of Electrical and Electronic Engineering, University of Cagliari, 09123 Cagliari, Italy
2
Department of Electrical, Electronic, Telecommunications Engineering, and Naval Architecture, University of Genoa, 16145 Genoa, Italy
3
CTM S.p.A., V.le Trieste 159/3, 09123 Cagliari, Italy
4
National Institute for Astrophysics, Cagliari Astronomical Observatory, Via della Scienza 5, 09047 Selargius, Italy
*
Author to whom correspondence should be addressed.
Electronics 2019, 8(12), 1483; https://doi.org/10.3390/electronics8121483
Submission received: 30 September 2019 / Revised: 28 November 2019 / Accepted: 2 December 2019 / Published: 4 December 2019
(This article belongs to the Special Issue Application of Wireless Sensor Networks in Monitoring)

Abstract

:
The ubiquitous nature and great potential of Wireless Sensors Network has not yet been fully exploited in automotive applications. This work deals with the choice of the cost-effective hardware required to face the challenges and issues proposed by the new trend in the development of intelligent transportation systems. With this aim, a preliminary WSN architecture is proposed. Several commercially available open-source platforms are compared and the Raspberry Pi stood out as a suitable and viable solution. The sensing layer is designed with two goals. Firstly, accelerometric, temperature, and relative humidity sensors were integrated on a dedicated PCB to test if mechanical or environmental stresses during bus rides could be harmful to the device or to its performances. The physical quantities are monitored automatically to alert the driver, thus improving the quality of service. Then, the rationale and functioning of the management and service layer is presented. The proposed cost-effective WSN node was employed and tested to transmit messages and videos, while investigating if any quantitative relationship exists between these operations and the environmental and operative conditions experienced by the hardware.

1. Introduction

Wireless Sensors Networks (WSN) are an expression of Internet of Things and are a powerful, promising and low-cost platform for several different applications [1], e.g., the development of an intelligent and automated system for irrigation [2], for the monitoring of cultural assets [3], or to the management of the container terminals logistic [4]. Basically, WSN are systems composed of radio-frequency (RF) transceivers, sensors, micro-controllers or processing units, and power sources [5,6]. Compared to the traditional wired sensors networks, WSN technology is cheaper, typically presents short deployment time and makes use of a higher number of sensors of various nature, e.g., temperature, humidity, acceleration, and concentration of chemicals [1,6]. Therefore, with WSN, it is possible to perform a multi-variable monitoring of a given industrial process of interest [6]. Moreover, the deployment of the sensors and nodes can cover large scale areas or be mobile [7]. The WSN can also ensure a robust digital transmission of information, with acceptable data rate [5,6,7].
Given these advantages, the WSN technology was proposed as a tool for the development of Intelligent Transportation Systems (ITS), i.e., solutions which can provide drivers relevant information about their ride, allow setting up convenient services to reduce traffic congestion, increasing the road capacity, and enhancing the efficiency in using transportation resources [8,9]. Especially in the case of urban transportation systems, the WSN potentialities satisfy the ITS requirement of being an efficient, cost-effective method for collecting and transfer information [8]. To date, WSNs were tested for intelligent parking systems and tracking of buses and taxi [8,10]. Some WSNs, designed and developed for automotive applications, are oriented to the monitoring of air quality and the road and traffic conditions [11,12]. Moreover, the commercially available WSN nodes and solutions monitor parameters such as the air temperature, light, acceleration, magnetic fields, and position [13]. For instance, the signal acquired from accelerometer can be employed to derive information about road bumps and to estimate the vehicle instantaneous speed [14]. Furthermore, WSN can be employed in intra-vehicle communication between heterogeneous devices [15], thus acting as a management system. However, for specific needs and issues, an ad hoc WSN architecture must be designed [13,16,17]. To this aim, an old analysis and comparison of the available hardware architectures for WSN in automotive applications and ITS can be found in [13,16,17,18]. From these surveys, it stands out that flexible and effective tools are required. Therefore, open hardware devices have been studied and investigated. Among the different available solutions, the employment of Raspberry Pi unit as core element in nodes [19,20], given its low-cost, low power consumption, and small dimensions that allow an easy placement inside a vehicle [21]. For example, the use of this embedded platform was explored in the management of traffic through the setup of dedicated vision tool systems for the obstacle detection and for enhancing the correct handling of the travel time [21]. The various SBC employed are often compared in terms of CPU, memory, operating system, and price [21]. However, from a practical point of view, to use one of these devices for automotive applications, a ECE-R10 certification for Electromagnetic Compatibility (EMC) is also required, according to ISO norms and CSN EN standards [22,23,24].
In this work, cost-effective open hardware and software are used to develop a simple but reliable, flexible, and powerful WSN for automotive application, in particular for the public transport case. Several available hardware solutions are compared. The selected device was tested against possibly risky, harsh, and adverse environmental and operational conditions, i.e., temperature, humidity, and vibrations due to the vehicle motion. With a multi-purpose and flexible design, the environmental and traveling data gathered from the WSN can be also exploited to improve the quality of service during bus ride thanks to an automatic alert system developed using open-source softwares. Furthermore, as explicitly required by the public transportation company, the WSN also manages the exchange of multimedia data (e.g., messages and videos) from a server and make them available by displaying on the bus screens. The influence of environmental and operative parameters on the WSN operations was investigated from a quantitative point of view.

2. A Proposal of WSN Architecture for Automotive Applications

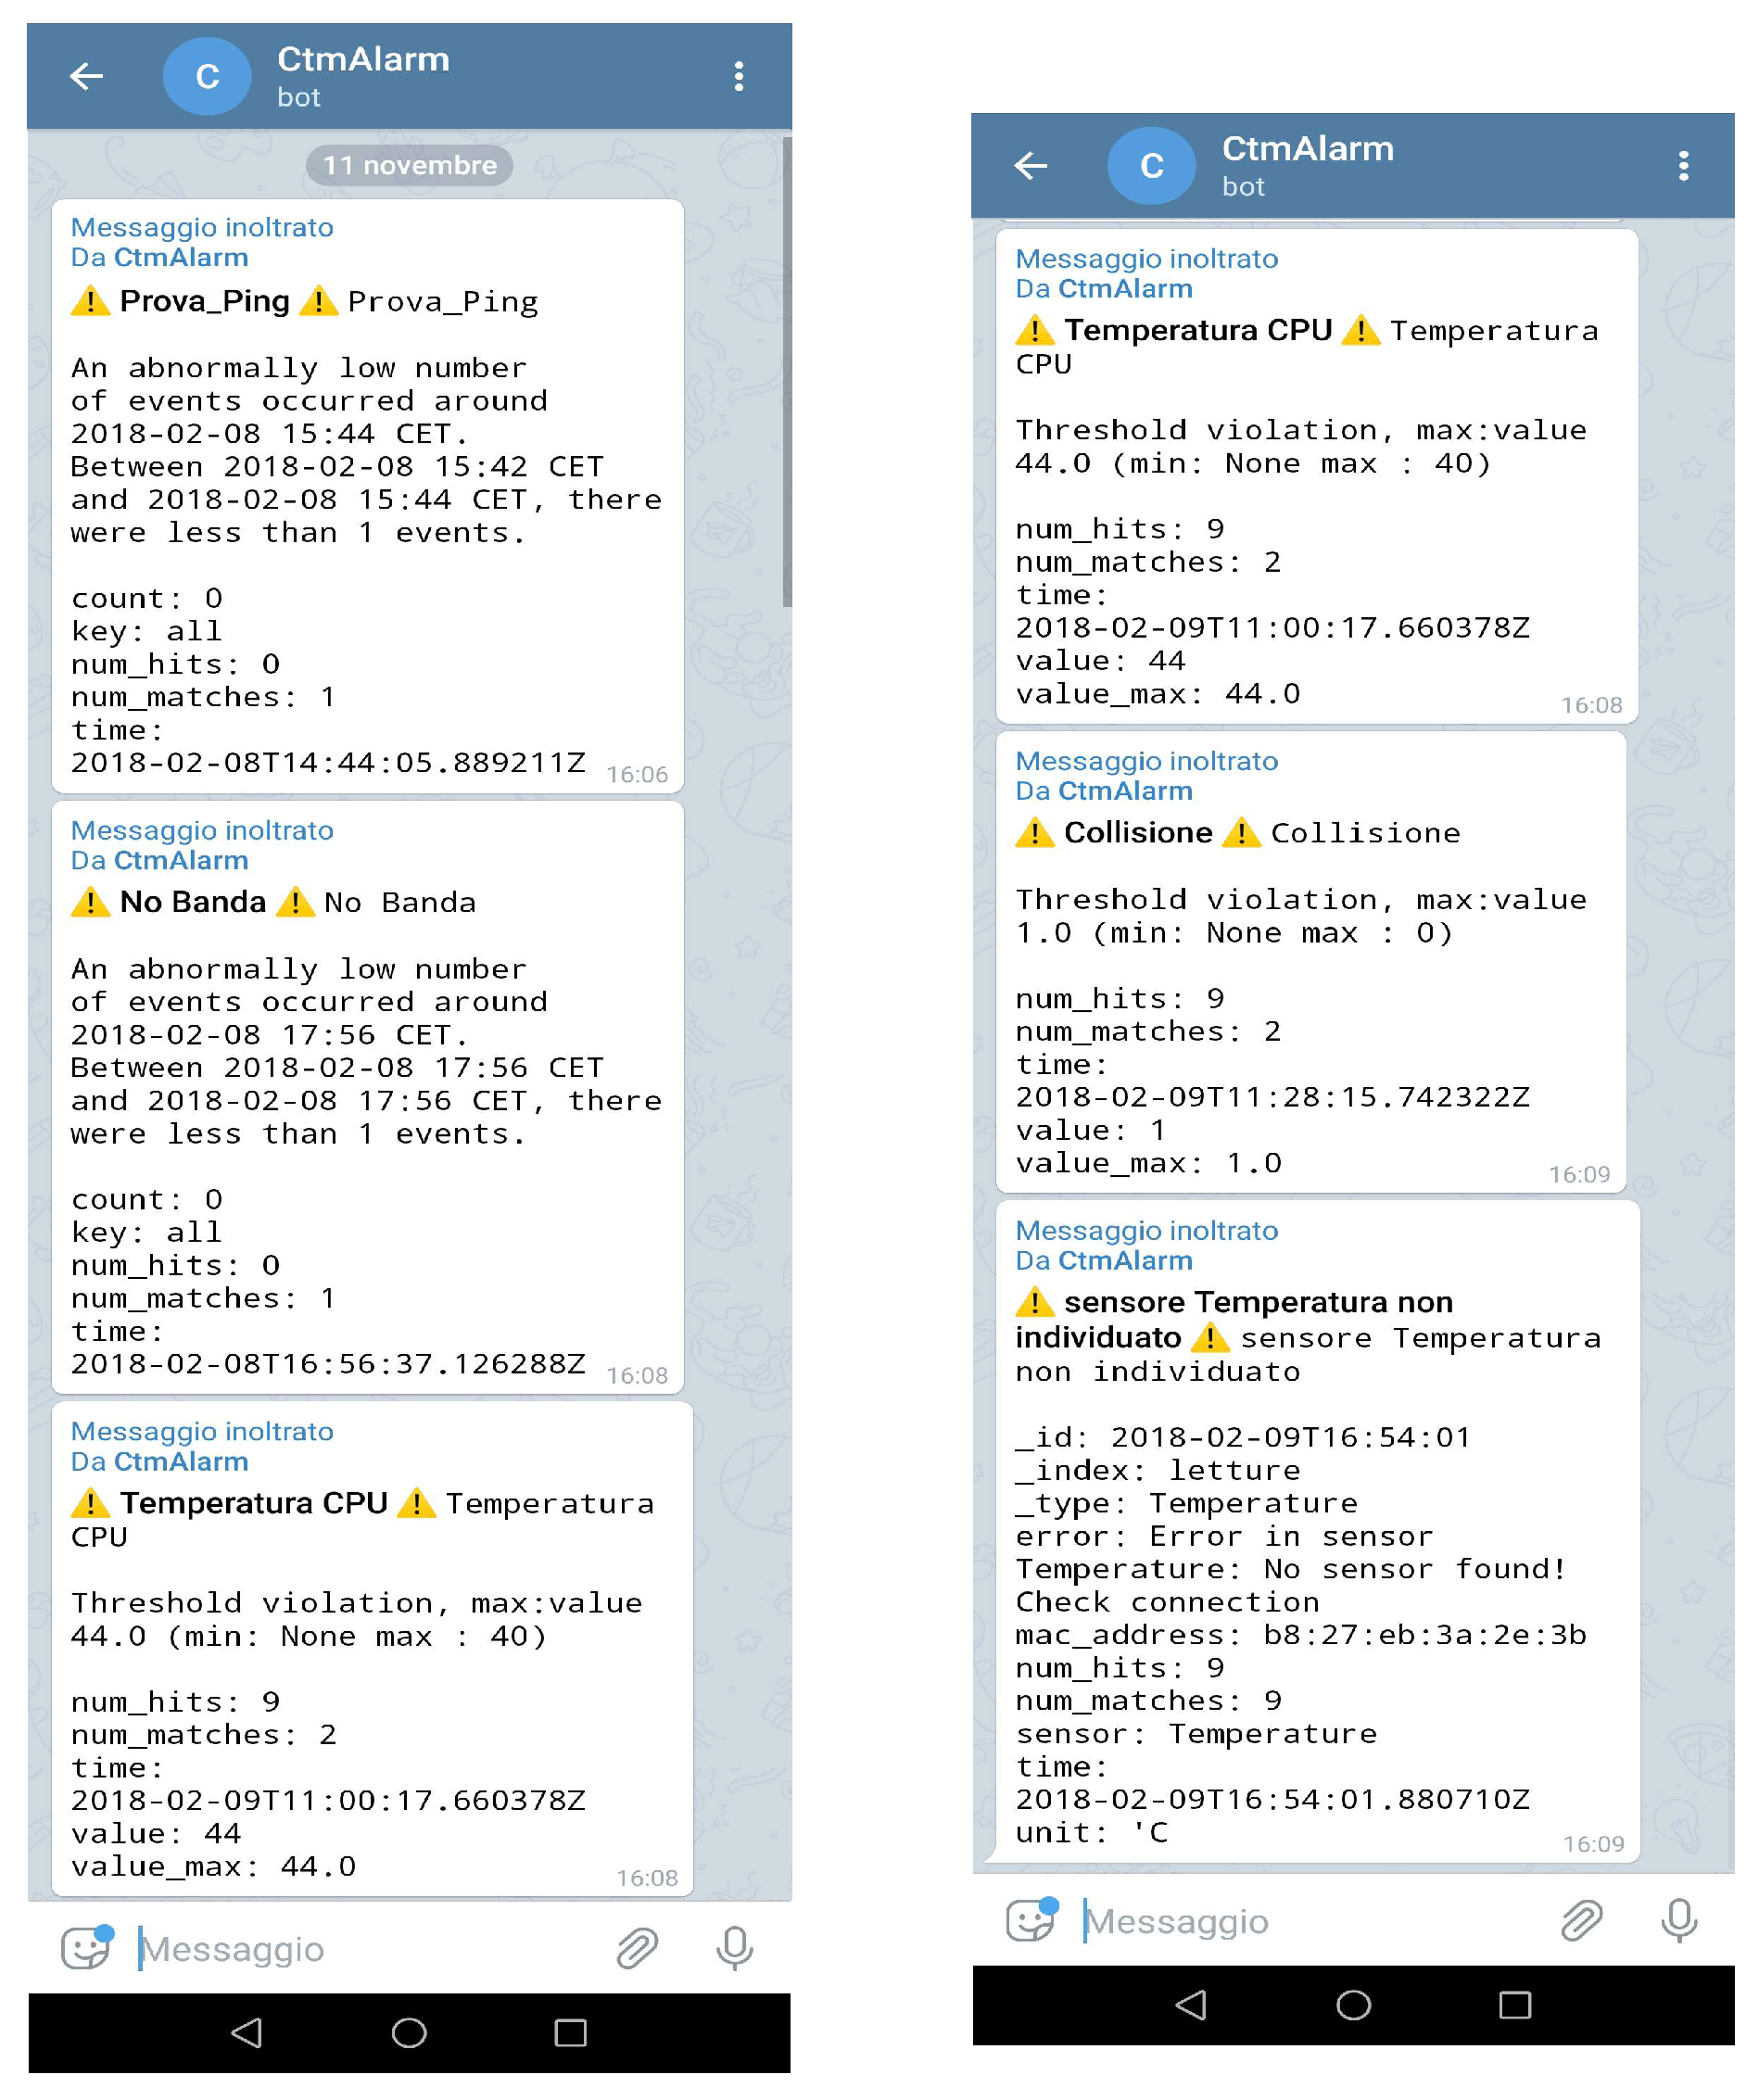
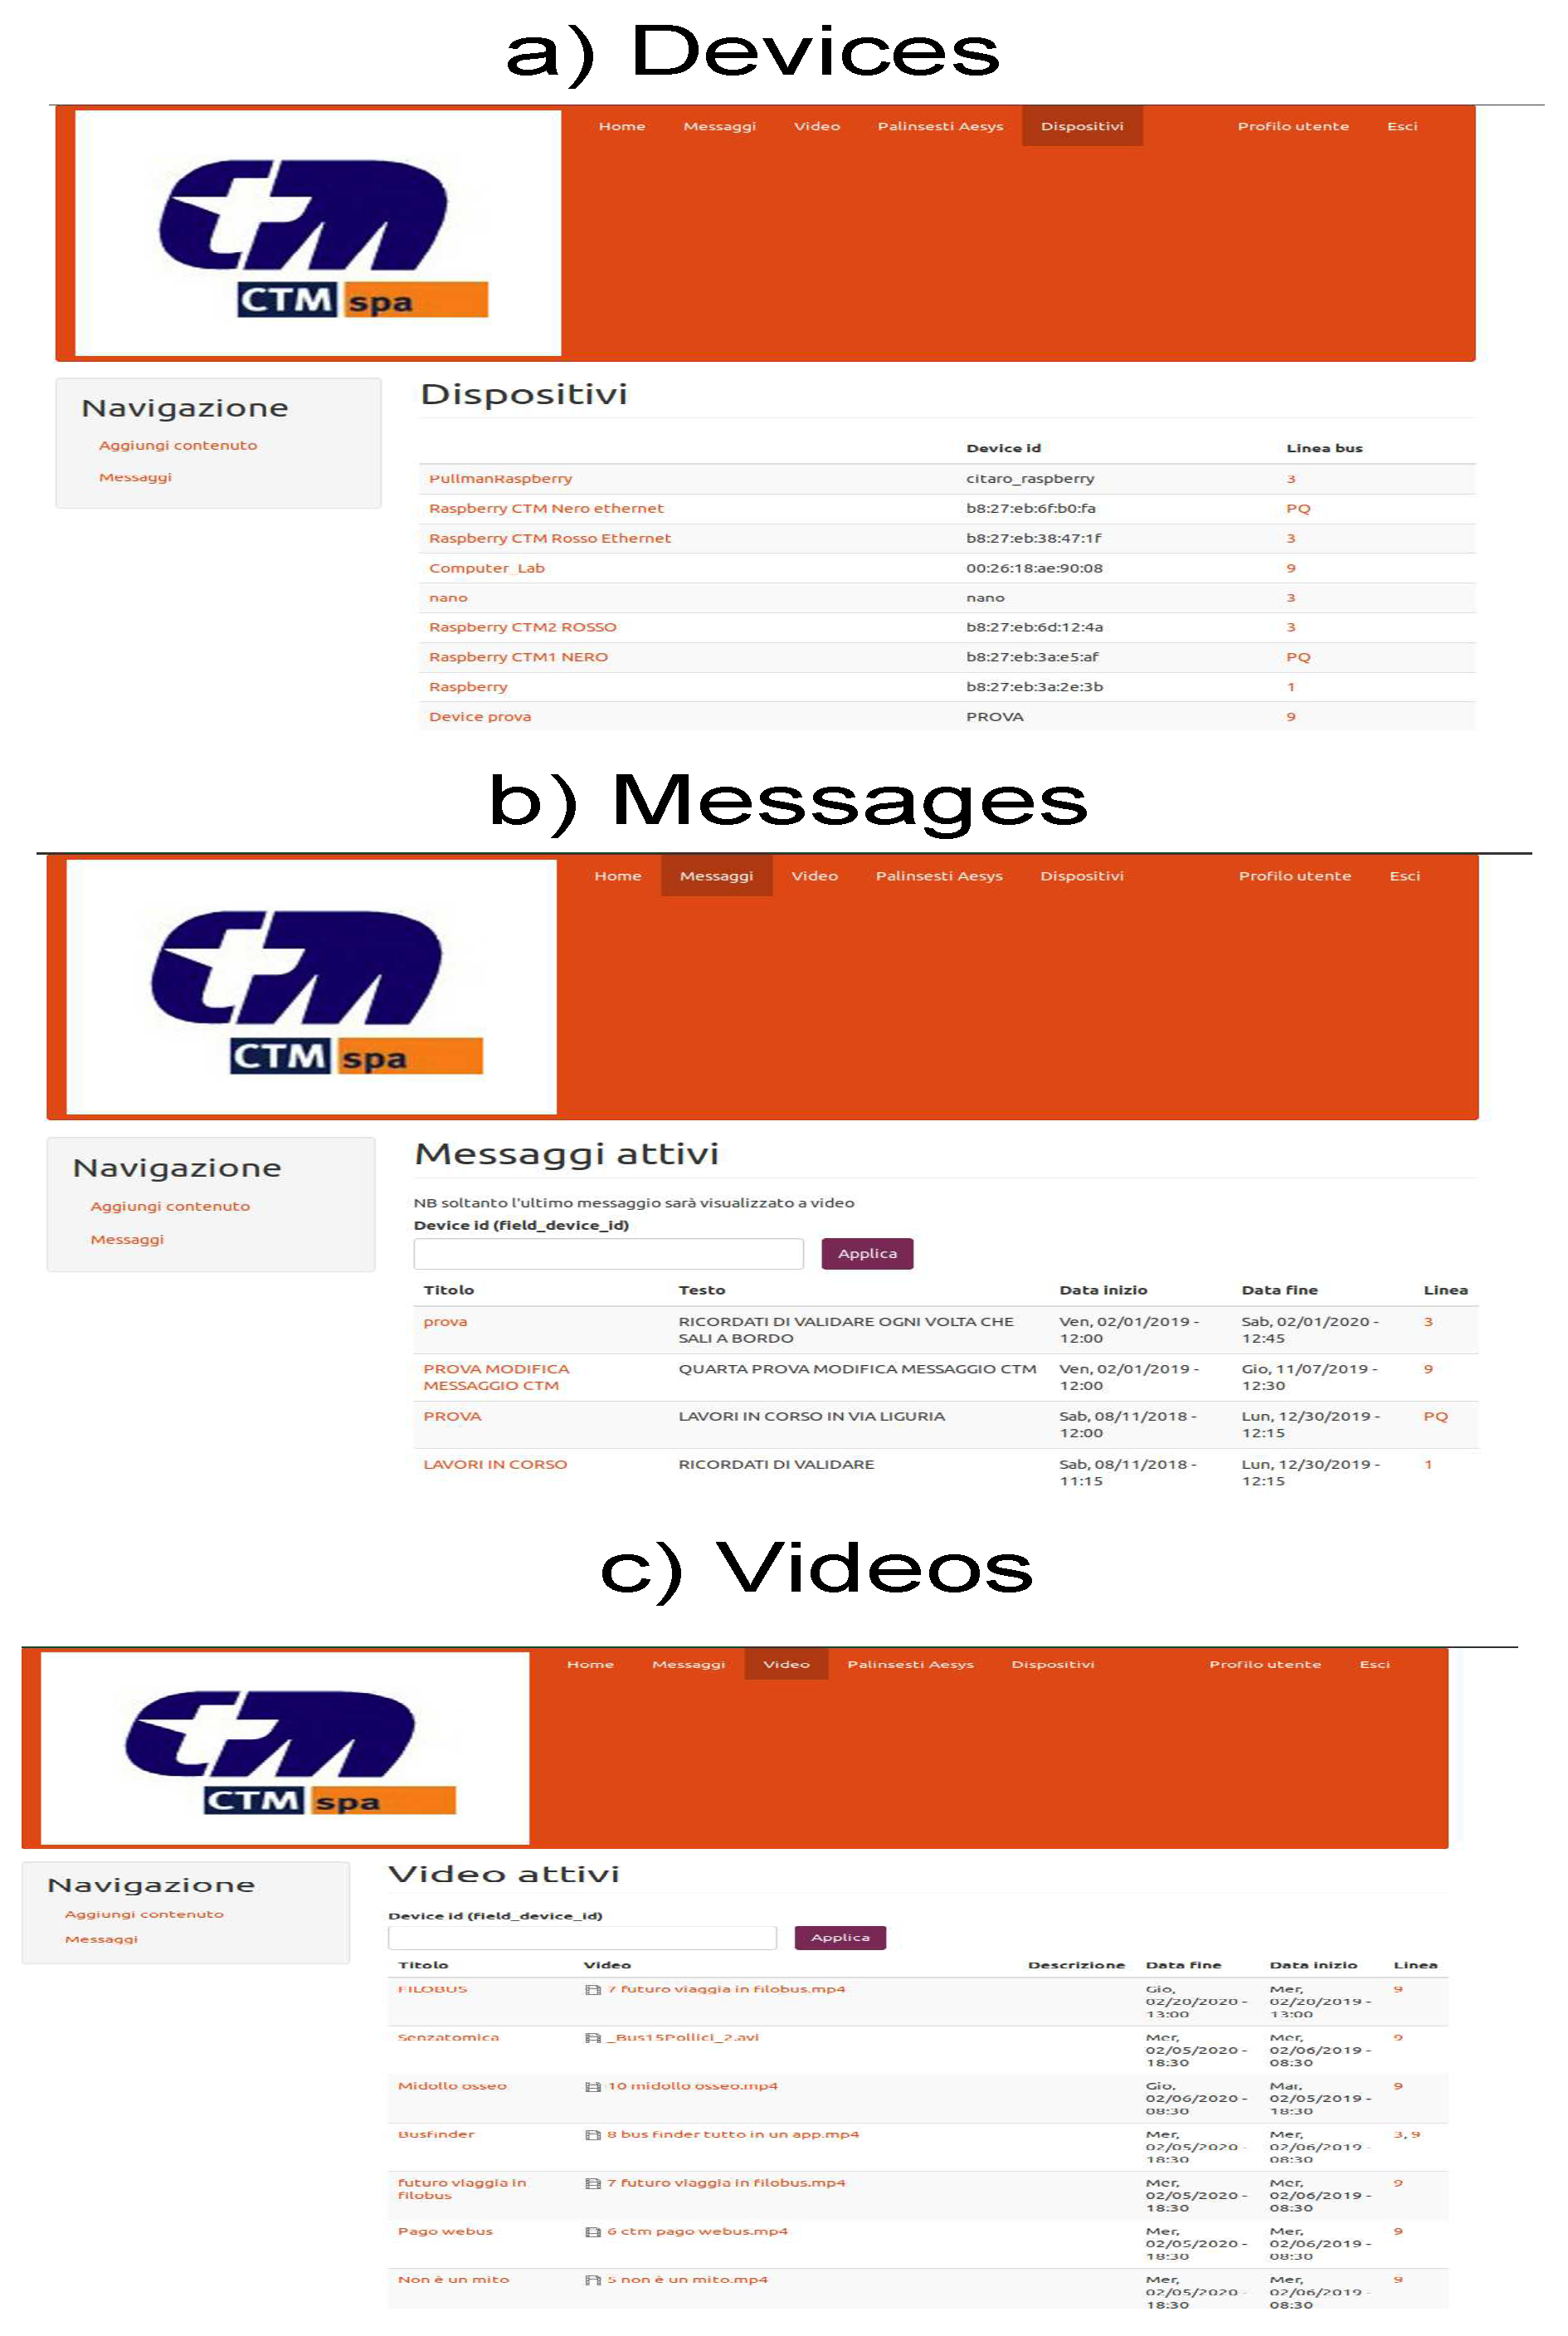
2.1. The System Functioning

The general scheme of the proposed WSN is presented in Figure 1. The WSN is composed of three different layers. The physical and sensing layer is composed of sensors and a Single Board Computer (SBC) for processing and storing, and which acts as data sink and gateway [25]. The SBC is equipped with a proper commercial radio-frequency transceiver. The sensors monitor in real-time the relative humidity, the air temperature, and the acceleration, experienced by the hardware, due to the bus vibrations. More details about the sensors and the node are given in Section 2.3. These data are immediately elaborated and analyzed by the SBC. The digitalized processed data are transferred to a dedicated server, where they are stored in “.json” format and organized in a database using the open-source software Elasticsearch (Elasticsearch, US). The Kibana (Elasticsearch, US) application is employed to visualize the data and manage the database. At this level, the information automatically derived by the processing unit from temperature, relative humidity, and accelerometer sensors can be used to verify if harsh or risky events are occurring. The application ElastAlert, included in Elasticsearch, performs the monitoring of the aforementioned physical data and detects whether a given threshold value is overcome. ElastAlert is then allowed to send an automatic alarm message through a dedicated Telegram bot, called CtmAlarm, as shown in Figure 2. The drivers or the technicians from the public transportation company receives these messages on their smartphones or electronic devices, such as the bus screens.
In parallel with these operations, the SBC is required to manage multimedia contents, namely messages and videos. This is a fundamental requirement of our WSN and it is relevant for the public transportation company we collaborated with. This information is related to the bus line, ride and stops, or advertisements. Therefore, the single board computer is interfaced with the screens and displays presents on the bus, as shown in Figure 1. A given bus line or ride is associated to a unique WSN node (or a single SBC) using a keyword. Alternatively, it is possible to discriminate the node relying on the IP address. The node interrogates the server for video and/or messages (“get” query in http protocol). The client, i.e., the Raspberry, does not know the list of videos and messages associated to it. The query is handled by the Content Management System (CMS, shown in Figure 3), which is developed in PHP language using the open-source software Drupal (Dries Buytaert, US). Given the node identifier, the CMS checks if the list elements to be sent to the node are present in the folders of the server, while also checking if the download can be performed. The client/node does not disconnect for 15 min. When the download starts, the files are saved in a temporary folder. The SBC cancels any old files and then copies the new ones into an intermediate folder, in its memory. During the download phase, at the SBC level, a video stream, written in Python language, runs on the monitor the videos copied from the aforementioned intermediate folder. To avoid problems, the refresh of the intermediate folder is independent from the refresh of the streamer. In particular, after all videos in the folder are played, the new check is performed. In this way, the search for new videos is not performed during the reproduction of the others. In particular, a thread runs the file transfer from the server to the device, while another independent thread executes the streamer, and these processes are not allowed to access the intermediate folder at the same time.
This WSN architecture is flexible and can be exploited for several different applications in the automotive field, especially to develop intelligent transport systems [8,9].

2.2. Comparison of Open-Source Hardware

The very first fundamental and most general requirement for WSNs in ITS is that the node should be low cost, since a high number of nodes might be deployed [1,8,9], i.e., in the case under analysis, a moderate to high number of buses may be equipped with the WSN node presented in Figure 1. Moreover, in general, the nodes and the networks must be energy efficient [16,26]. This last specification is not an issue for the peculiar case of automotive application investigated in this work. Indeed, the power supply of the vehicle can be exploited without any concern since the power consumption due to the SBC operation is negligible. The fault tolerance is another key criterion, since the nodes are deployed in a hostile and harsh environment which can damage them or cause malfunctions [8,13,16]. Furthermore, both the hardware and software employed in WSN for automotive applications must be integrable with other communication technologies [8]. Indeed, vehicle-to-vehicle and vehicle-to-infrastructure communications are often required [8]. In addition, a reliable and stable transmission of data between the nodes of the networks is a necessity. Finally, WSN security across all layers and electromagnetic compatibility requires particular attention [27], as in the case of ITS for public service infrastructure [28]. In particular, the fundamental EMC aspects for a system for automotive applications are that the designed system must not cause interference with other systems and that it should not be susceptible to emission from other devices [23].
To date, several different types of nodes and WSNs for various applications were developed and investigated [10,11,12,13,14,15,16,18,21]. To be cost-effective, recently the SBC employed for WSN nodes in automotive are open-hardware solutions, such as Arduino, Raspberry, or others. To discriminate and identify the best choice, it is possible to compare the SBCs in term of CPU, memory, and operative system, even though other parameters of the architecture should be considered for a fair comparison [18]. However, for the purposes of this work, given the huge number of available solutions, it is possible to not consider and neglect SBC with micro-controllers or processors working with less than 16 bit or which have small Synchronous Dynamic Random Access Memory (SDRAM), or which does not have a video interface (e.g., HDMI port), and also discharge those with old or inefficient operative systems, such as those reviewed in [18]. The possibility of employing Arduino modules was discharged [29]. Therefore, the comparison between Raspberry Pi 3 Bi+ (Raspberry Pi, UK), Nano-ULT3 (IEI Corp., Shanghai, China), and VB0X-3120 (Sintrones, New Taipei City, Taiwan) for our WSN is presented in Table 1. With respect to the well-known Arduino, the aforementioned pieces of instrumentation, especially the Raspberry Pi 3 B+, have 64-bit and high speed processor (e.g., 1.4 GHz for the Raspberry vs. 16 MHz for Arduino) and a high number of GPIO, UART, and IPQ ports, which suggests that these commercially available system can be a valuable building-block of WSN nodes [19]. Moreover, these devices have a HDMI output that allows a direct video connection, a feature not available in other devices such as Arduino. The selected SBCs are 64-bit processing unit, which operate with different clock frequencies and have rather different memory capacity. Furthermore, as discussed in Section 1, we included the certification for automotive applications. From the data reported in Table 1, given the trade-off between price and available memory, the Raspberry Pi was selected. This device is a cost-effective (17 times cheaper than the VBOX-3120) and commercially available solution for the core of a general-purpose node [19]. This device can be interfaced with several sensors thanks to a wide variety of available libraries. Furthermore, the Electromagnetic Compatibility (ECM) of Raspberry was assessed in the literature. Indeed, for such a device, several frequencies may cause severe interference in a given automotive scenario: 24 and 25 MHz for the extra USB clock and for the crystal for Ethernet link; 250 MHz for the GPU; 340 MHz for HDMI connection; and 450 and 900 MHz for the SDRAM and ARM components [23]. Recently, for the first time, the compatibility of the Raspberry Pi was tested in a gigahertz transverse electromagnetic chamber both in near- and far-field conditions and it was found that the device can withstand an electric field of about 10 Vm 1 in both situations and over the frequency range from 20 MHz to 2.5 GHz [23]. These promising results suggest that the Raspberry can be easily certified for automotive applications, thus implying that, with respect to the devices given in Table 1, this hardware is a valuable, reliable, and cost-effective choice for the development of a WSN.

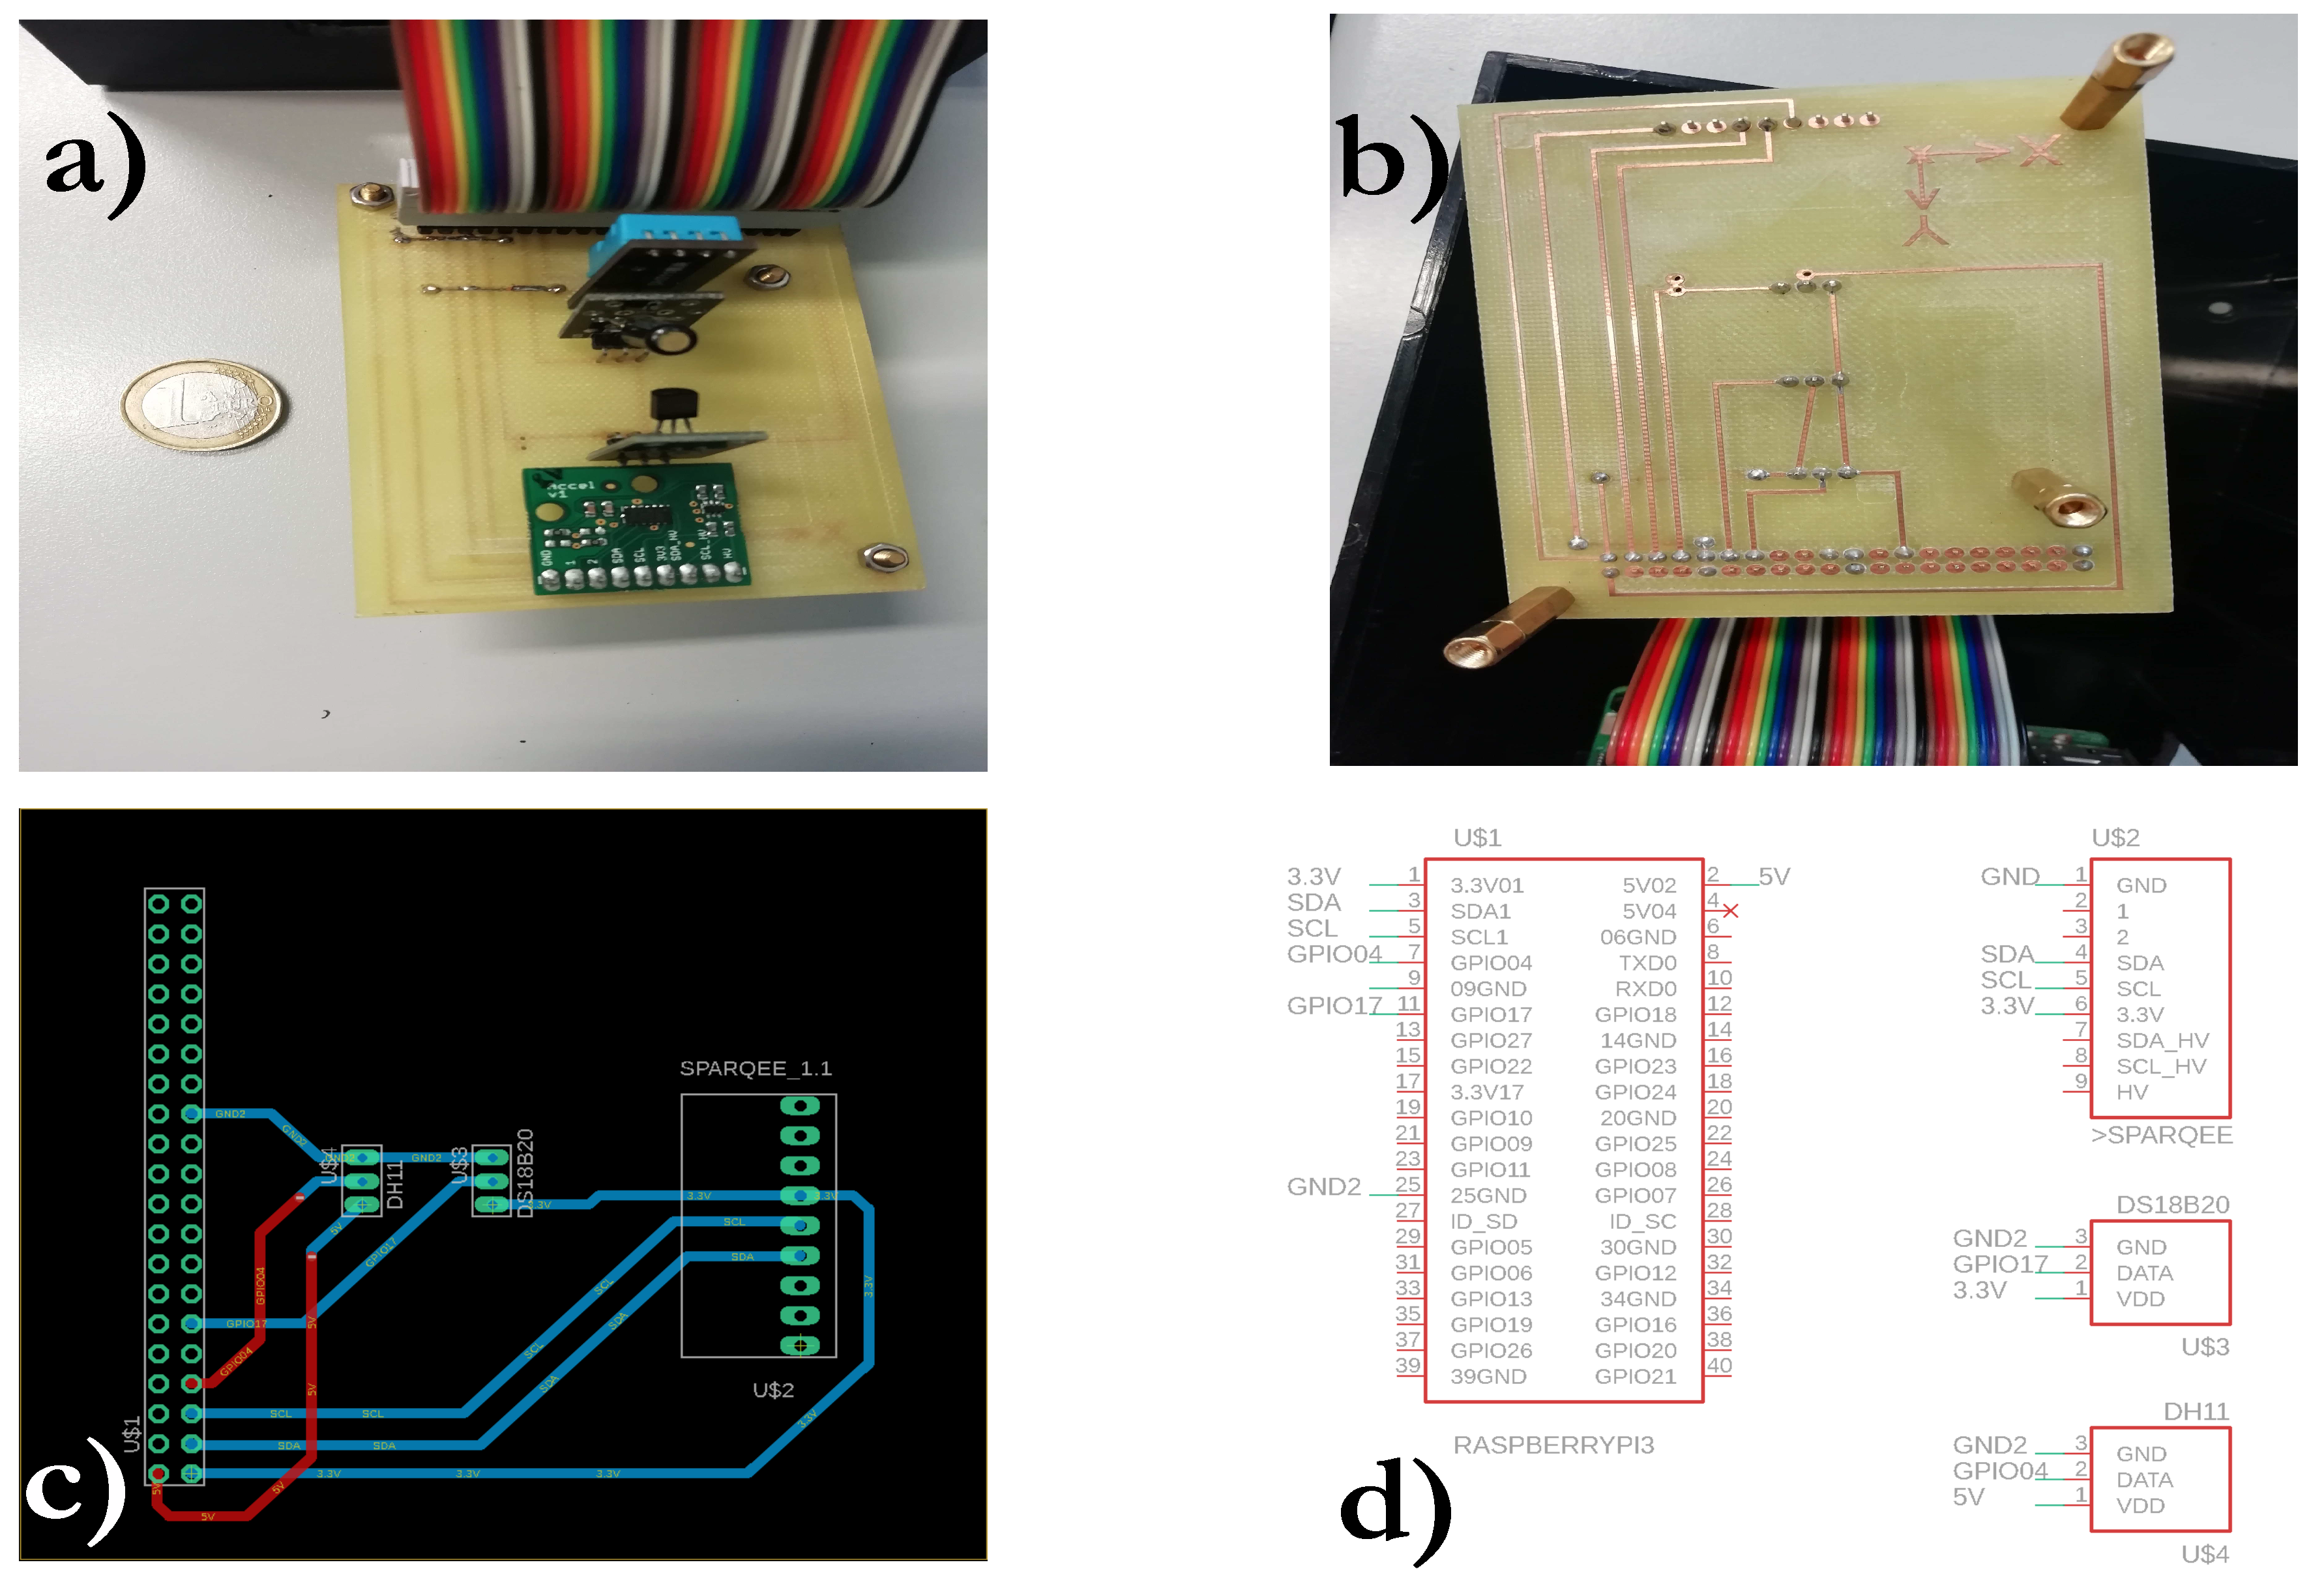
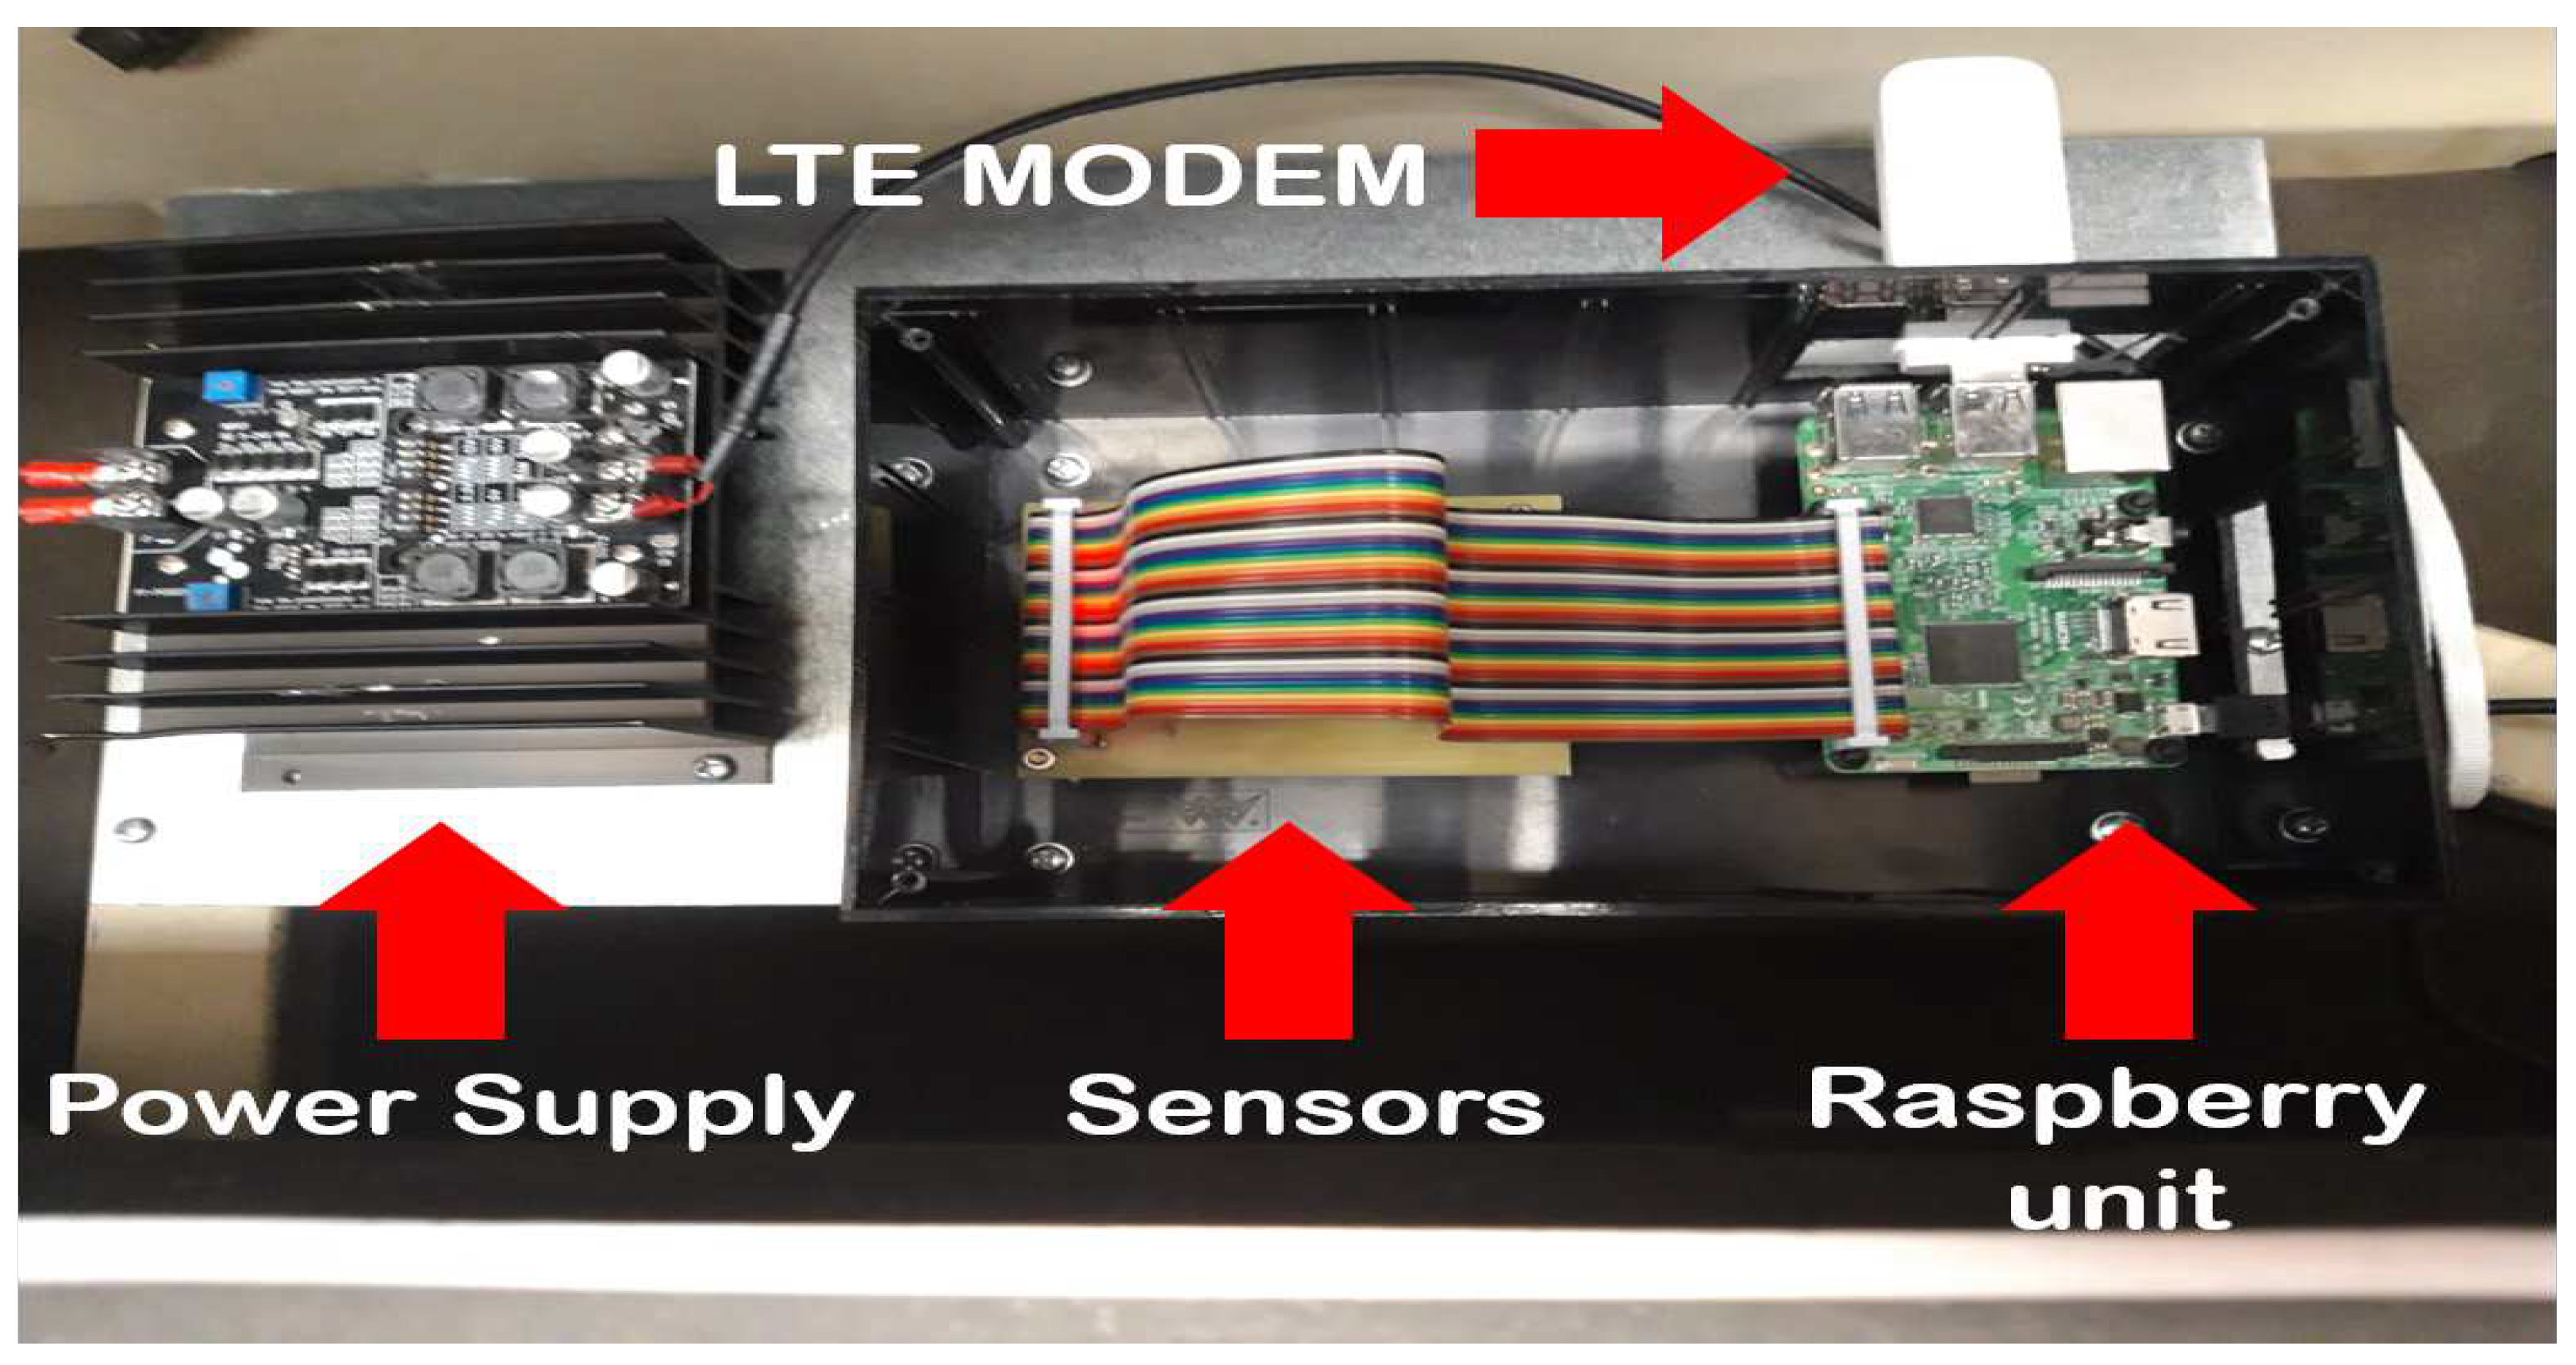
2.3. The Node Design

The node design is mainly oriented in understanding the influence of environmental parameters, namely temperature and relative humidity, and the operative conditions (vibrations, impacts, and mechanical stresses) on the core unit of the WSN node, i.e., the Raspberry unit. Therefore, the variables to be monitored are chosen to understand and evaluate how and if the functioning of the WSN node can be compromised. The relative humidity has been recognized as a limiting factor in any wireless transmission, while being a severe threat for electronics [1]. Temperature is a physical quantity already considered in the preliminary evaluation on the hardware for ITS applications [28]. The accelerometer is an obvious design choice since the shocks and vibrations on the hardware may be significantly relevant [14,28].
The aforementioned quantities can be monitored for purposes not strictly related to the hardware perspective. Indeed, in the ITS framework, data derived from such heterogeneous quantities are combined and integrated to develop a real-time information system or to devise intelligent feedback strategies [8]. For example, the monitoring of temperature, relative humidity, and cinematic parameter can be exploited to setup a smart system for improving the quality of passenger during the route [11]. In this work, relative humidity, temperature, and acceleration are employed to setup a real-time information system which can send alert messages to the driver or the public transportation technicians, as shown in Figure 1 and Figure 2.
The SNS-DH11 capacitive sensor was employed to measure relative humidity in the range 1–90%, with a precision of about ±5%. The choice of this physical quantity is also due to the fact that little is known about the influence of humidity on the operative condition of Raspberry unit, as shown in Table 1.
The temperature sensor Ad-001 Ds18b20 was employed to monitor temperature values from 10 C to 85 C with a precision of ±0.5 C.
Finally, the three-axial accelerometer ADXL-345 (SparqEE LLC), based on the MMA7361 component, was chosen to measure and monitor the mechanical stresses, e.g., vibration and/or impacts. This sensor has the twofold goal of allowing to identify if harsh conditions or potentially risky events may harm the Raspberry unit during the travels, while ensuring a constant and continuous observance of the conditions during the bus rides. Therefore, in addition to the hardware perspective, the data acquired and elaborated at the node level can be very useful to provide information to the driver or the passengers using the developed automatic alert system. As regards the monitoring of vibrations and impacts, the placement of the accelerometer in the PCB is a critical aspect (see Figure 4) [30]. Indeed, the x-axis of the sensor is required to point toward the front of the bus, whereas the y-axis should coincides with the sides of the vehicle and the z-axis has to be oriented with the top of the bus.
The sensors were integrated on a dedicated PCB designed using Eagle Autodesk (EDA Solutions, UK). The board was manufactured onto a FR4 board by exploiting a LPKF Protomat C100 HF (Germany) cutter. The schematics and the realized PCB are shown in Figure 4.
The WSN nodes was mounted on a single bus and tested in situ during January, February, and November 2019.
The node is fed using the automotive power system, which operates at 24 V. Therefore, two DC-DC converters, one for the Raspberry and one for the monitor, are necessary, as shown in Figure 5. For the down-conversion of voltage to the 5 V required for the SBC operations, the Yeeco (Germany) B1700526EU DC-DC converter esd employed. In regards to the monitor power supply, the ZC104300 CPT was used to lower the voltage to 12 V. It should be pointed out that the capacity of the vehicle battery is about 243 kWh and the maximum, overestimated, power consumption of the WSN node is about 80 Wh, implying that the energy efficiency is a negligible issue for this WSN.
The sensors and the Raspberry unit were connected to the power source. Furthermore, the chosen SBC was interfaced with the LTE modem for the transmission of the data from the sensors, as well as for the query and download of contents from the CMS. The Huawei E3372 Megafon dongle (Huawei Technologies Co., Ltd., China) was employed for the wireless data transmission (see Figure 5). This off-the-shelf device can operate in the GSM (2G, 900 and 1900 MHz), UMTS (3G, 900 and 2100 MHz), and LTE (4G, 800, 1800, 2100, and 2600 MHz) bands. The data rate ranges from a minimum of 236.8 kbps to 150 Mbps, thus implying a significant flexibility and performances comparable to other devices which make use of different communication protocols [10,11,12,13,14,15,16,18,21].
The strength of the signal, together with the connection quality were checked and monitored during the bus rides. If low quality or disconnection was detected, the ElastAlert application immediately sent the alert message. An eventual disservice can be due to a low signal level in urban or suburban areas. However, it is possible that the temperature, humidity, or acceleration due to the bus vibration plays a disturbing role. It is relevant to analyze the influence of these quantities on the hardware performances. Moreover, remembering that the management of multimedia content is a primary requirement for the WSN under investigation, it should be pointed out that both the CSM and server operations contribute to the efficiency of data download. Therefore, to perform a quantitative analysis of the WSN architecture performances, we defined the download time efficiency Γ as follows:
Γ = Files Size Total Tranfer Time M B s

3. Signal Processing and Data Analysis

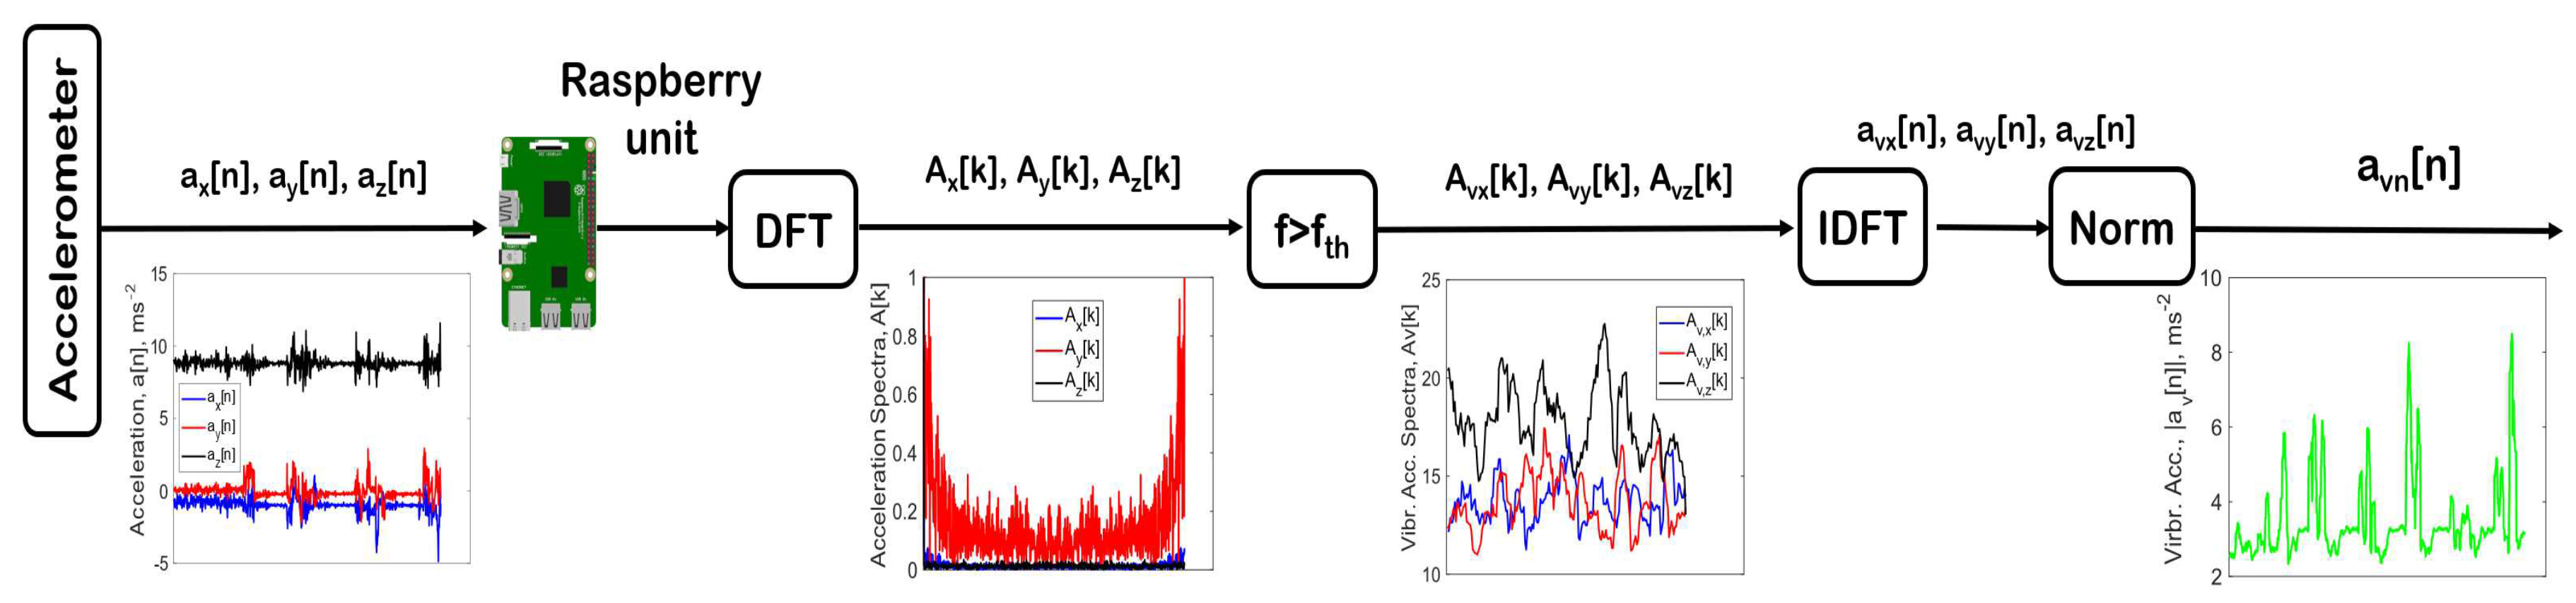
3.1. Signal Processing

All the signals from the accelerometer, temperature, and relative humidity sensors are digital in nature. Therefore, all the elaborations steps and the filtering were carried out using software routine written in Python and handled by the Raspberry unit.
The signals of the accelerometer, temperature, and relative humidity sensors were high-pass filtered using a 16-tap moving average filter to slightly smooth the signal without adding a delay.
As regards the signal acquired by the SparqEE ADXL-345 accelerometer, this type of signal is often noisy, thus it does not provide relevant information to the possible mechanical threat to the electronic system, to the vehicle, or to the passengers. It is known that the spectrum of the accelerometer signal contains information which is related to very different mechanical phenomena and originates from various sources [30]. Assume that the acceleration signal, a[n] (which is a vector quantity), is composed by the gravitational acceleration (a g [n]), the acceleration produced by the vibration (a v [n]), and the random noise (RN[n]). We are interested in extracting the magnitude of the acceleration experienced by the hardware of the WSN node due to the vibration during bus ride. Now, the relevant information of the acceleration vector and the noise frequency band may overlap in an arbitrary way [30]. This makes it difficult to employ traditional denoising techniques [31,32,33]. Therefore, the signal from the accelerometer was elaborated following the approach found in [30] and summarized in Figure 6. Firstly, being the discrete time sequence a[n] = (a x [n],a y [n],a z [n]) the signal of the accelerometer sensor, the Discrete Fourier Transform (DFT) of these time sequences was performed for each channel to derive the spectra A [ k ] as follows [30]:
A [ k ] = D F T a [ n ] = n = 0 N 1 a [ n ] e 2 π N n k
where both the discrete time n and the Fourier index k assumes values between 0 and N 1 , being N the number of time samples. Then the spectrum of each channel (i.e., A x [ k ] , A y [ k ] , and A z [ k ] ) is high-pass filtered to extract the components above a given threshold frequency called k t h , equal to about 1 kHz. These operations allow removing, canceling, and eliminating the frequency components due to the gravitational acceleration (a g [n]) and to the low-frequency noise (RN[n]), e.g., the road curves or slowly time-varying increment of velocity [30]. In this way, the remaining spectrum is the spectrum of the accelerations due to the vehicle vibration [30]. In mathematical terms:
A v , n [ k ] = A [ k > k t h ]
Then, the inverse transformation of the spectra of vibration to the time-domain is performed as follows:
a v [ n ] = I D F T A v , n [ k ]
In this way, the time sequence of the vibrational acceleration was evaluated (i.e., a v , x [ n ] , a v , y [ n ] , a v , z [ n ] ). Finally, these three filtered signals were combined and used to calculate the norm a v , n [ n ] [30]:
a v , n [ n ] = | a v [ n ] | = a v , x [ n ] 2 + a v , y [ n ] 2 + a v , z [ n ] 2
From the analysis of this signal, it is possible to derive the peaks related to the maximum stresses which arises from the vibrations and stresses.
All these calculations and elaborations were performed by the Raspberry unit using an in-house Python script. The results were temporarily stored in the memory of the SBC and then sent to the Elasticsearch server and database using the LTE modem. The ElastAlert application monitored the data from the sensor and evaluated whether the values of the temperature, the relative humidity, and of the norm of the acceleration due to the vibration were higher than the given thresholds. Then, an alarm message was sent using the Telegram bot, as in Figure 2. For the temperature, the threshold was set to 36 C, because this value is retained to be a potential risk, therefore the WSN node would be cooled down to avoid troubles and damages. As regards the value of relative humidity, it was believed that a maximum value of 60% should be reached. Indeed, the electronic devices which compose the WSN node may be damaged or prone to malfunctioning. Finally, the value of 20 ms 2 was set as the upper limit for the magnitude of the acceleration due to the bus vibration. This value indicates a collision or a bump, and it implies that a force twenty time higher than the gravitational force is experienced at the node location [30].

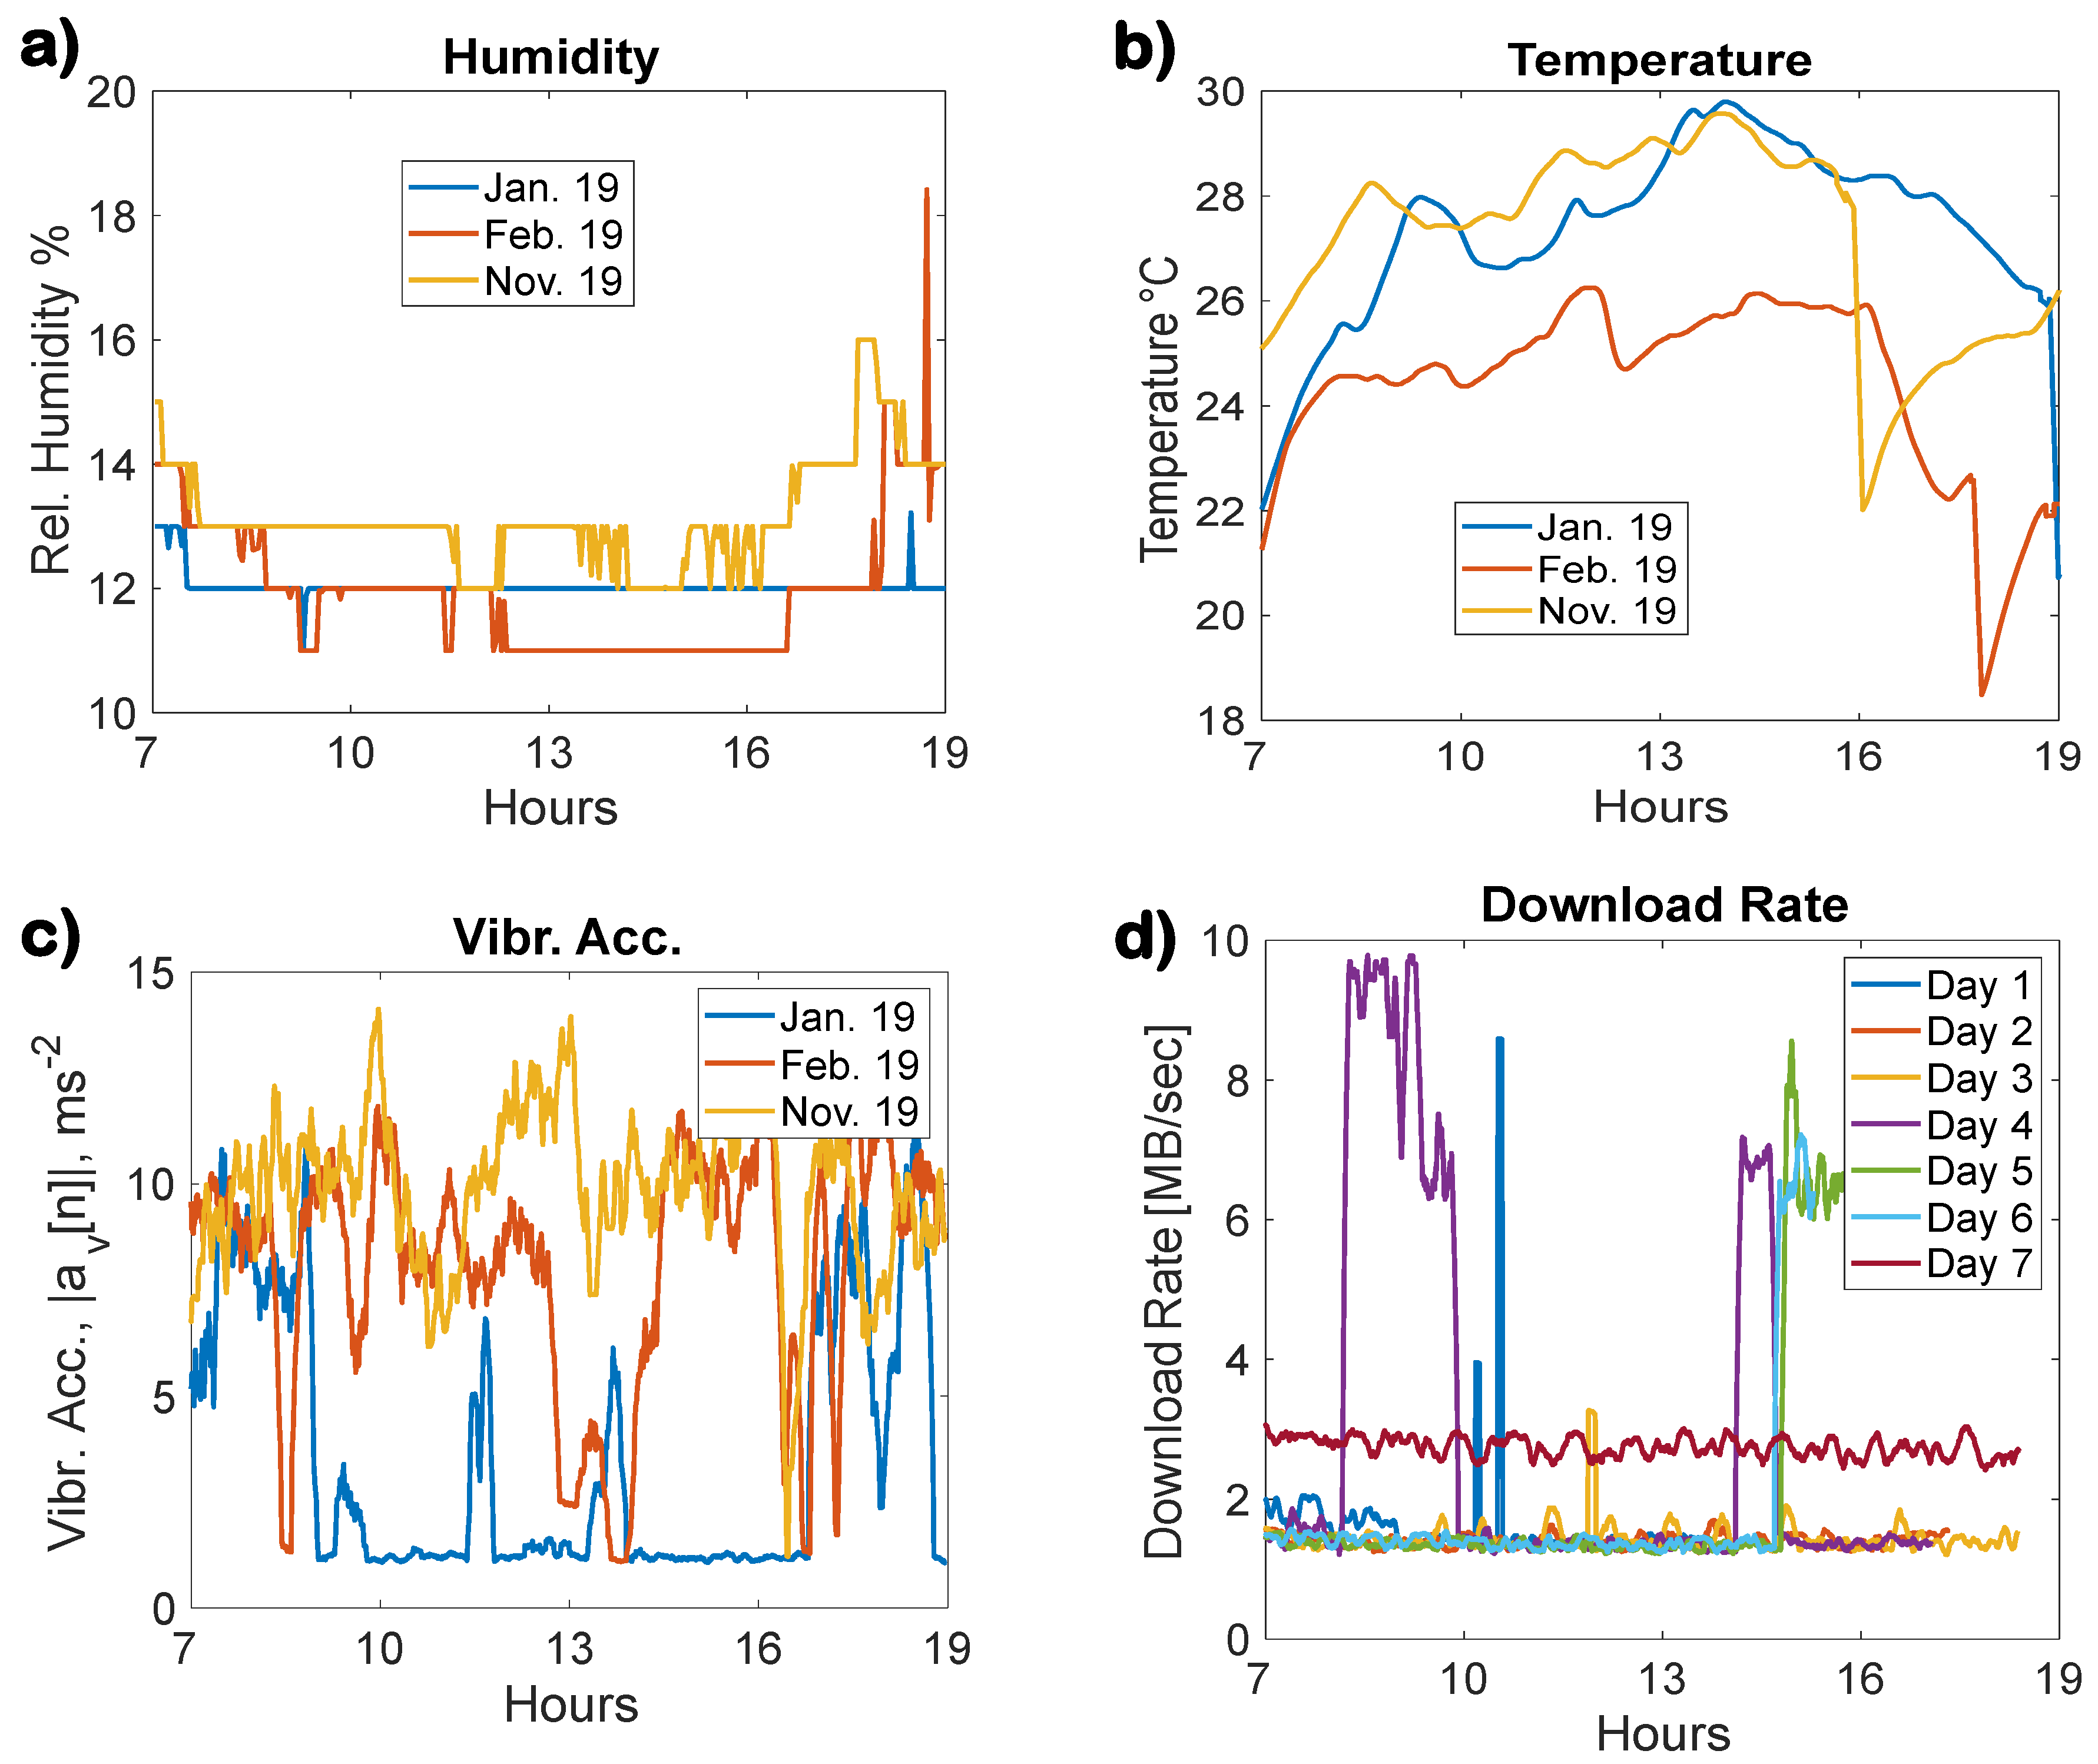
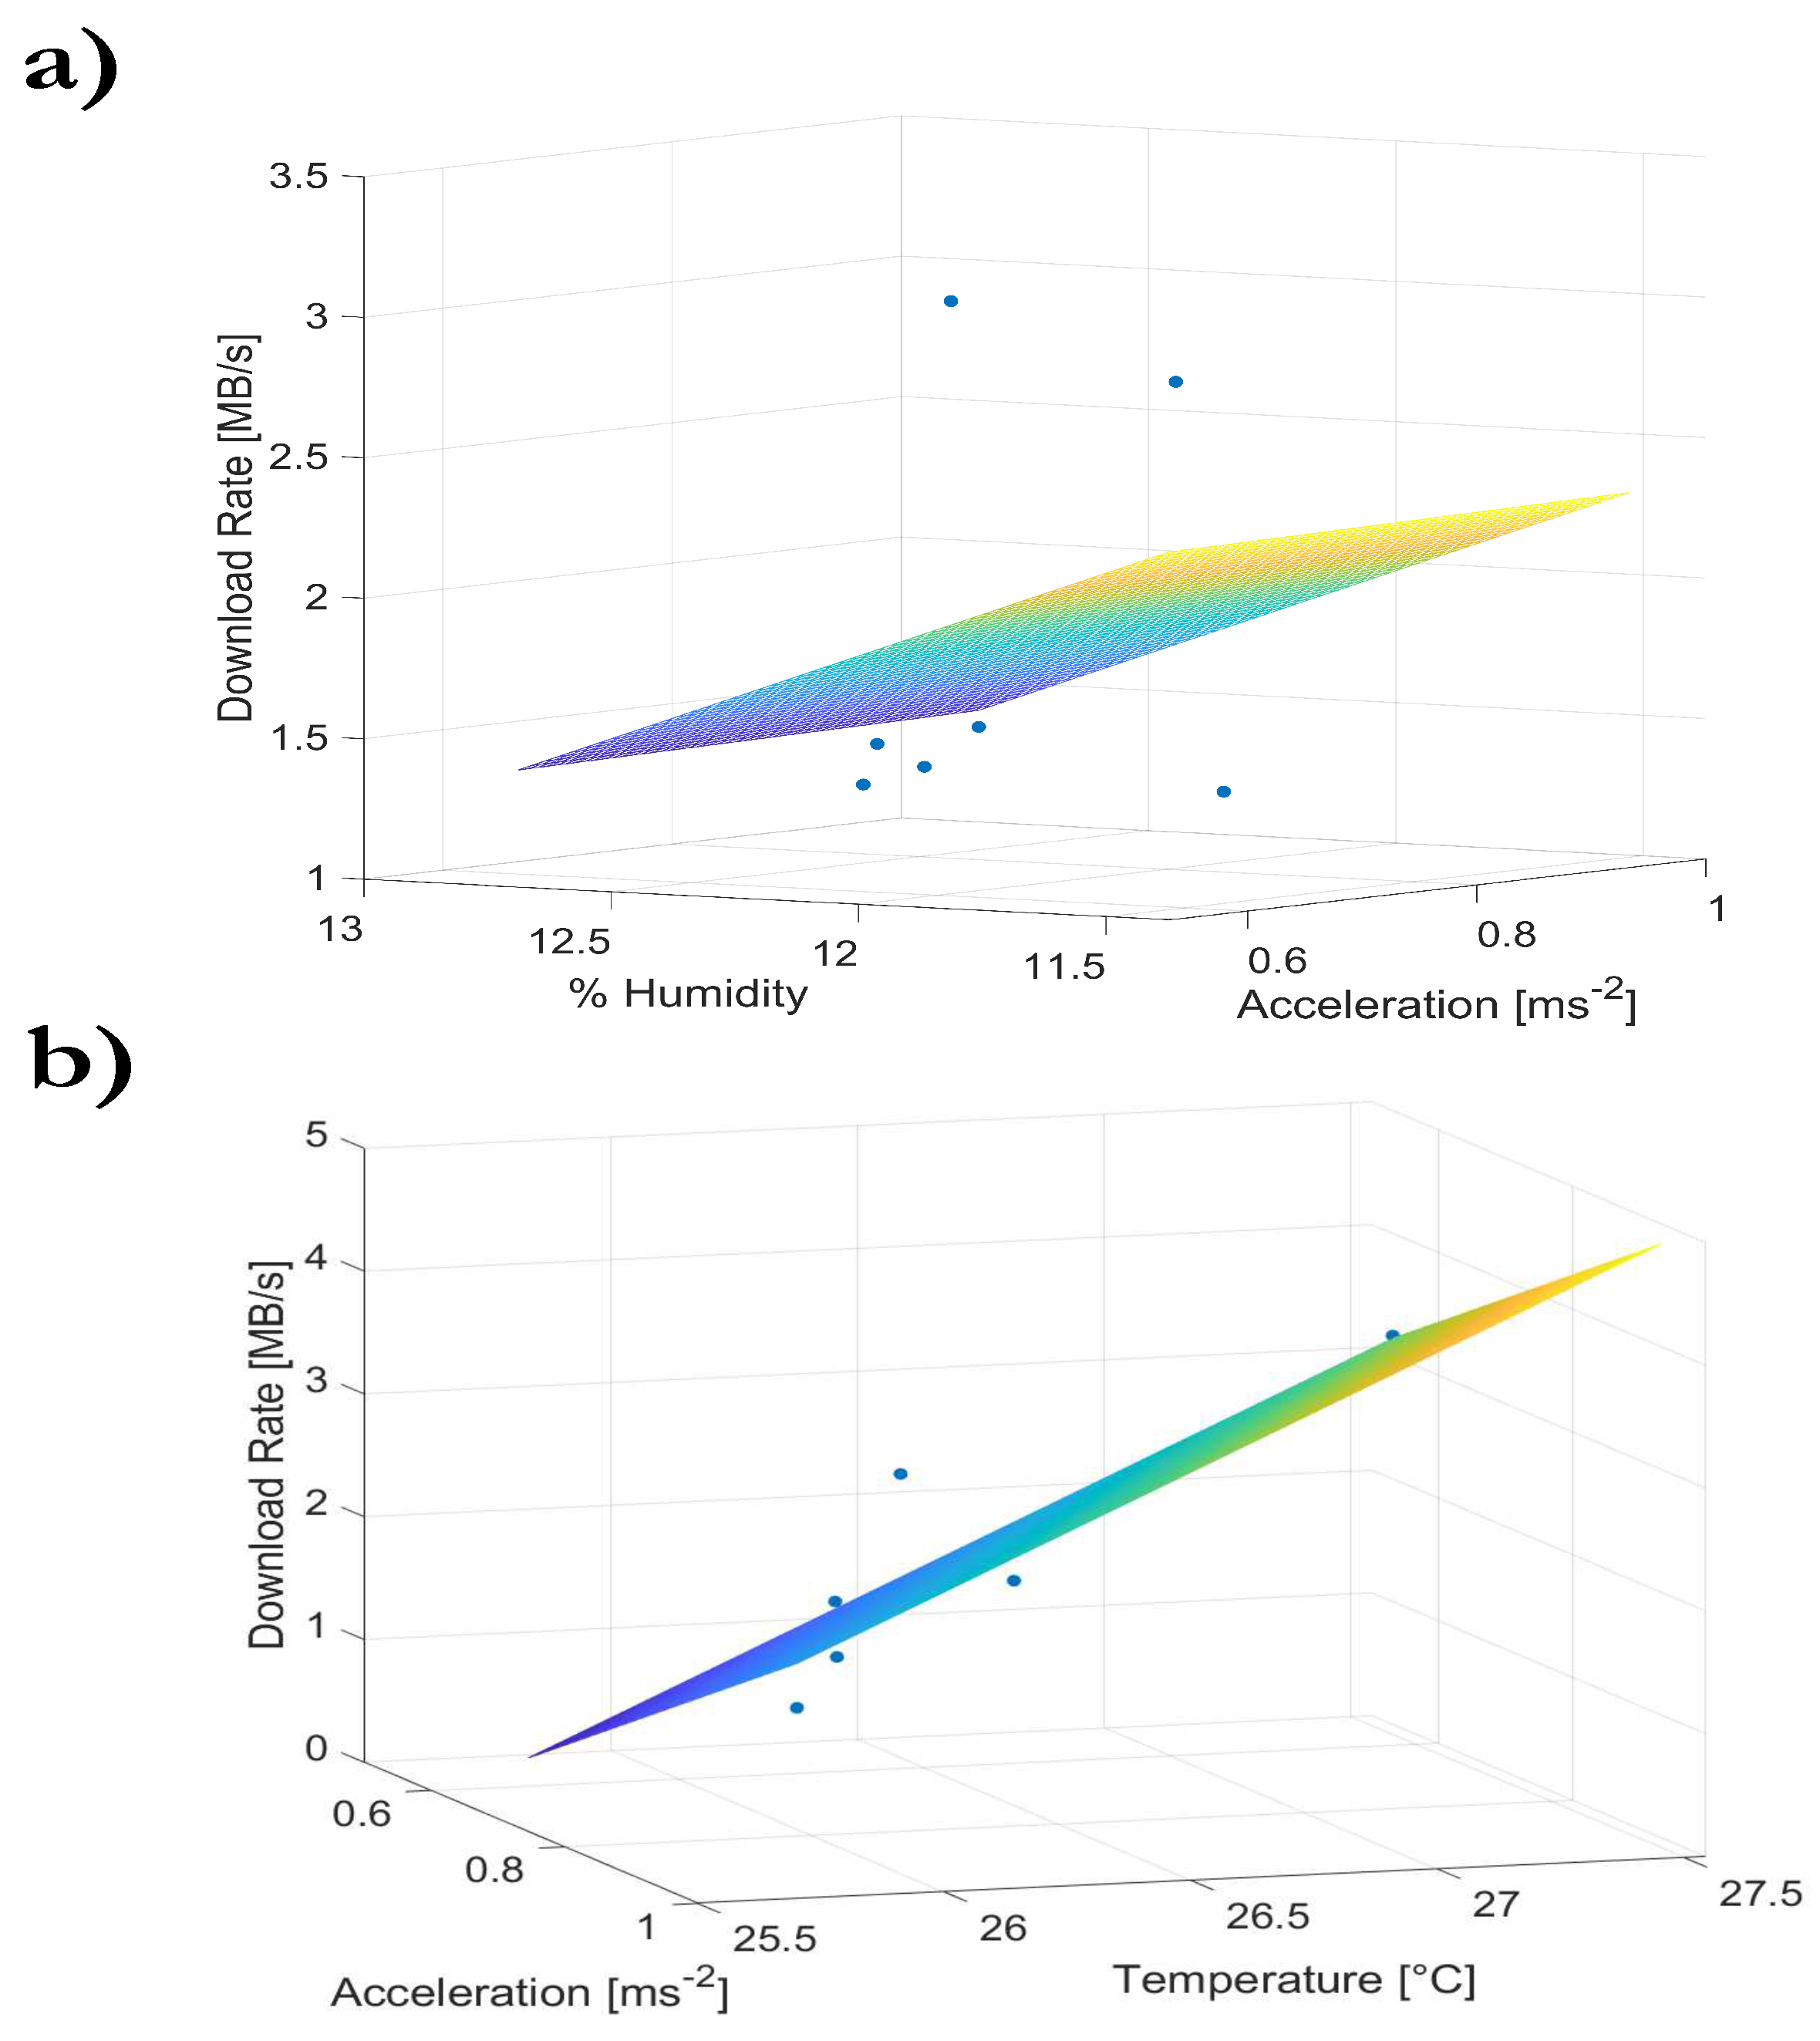
3.2. Data Analysis: Descriptive Statistics

The data acquired from the temperature, relative humidity, and accelerometer sensors were analyzed to investigate if any quantitative relationships exist among them. To this aim, the Pearson’s correlation coefficient between two generic variables x and y can be evaluated as follows [34,35,36]:
R x , y = σ x , y σ x σ y
where σ x , y is the covariance and σ x and σ y are the standard deviations of the variables. The correlation coefficient is a measure of the possible linear relationship between two variables. R x , y values can vary between 1 , which indicates negative correlation, and 1, which implies a positive correlation. The correlation coefficient between the temperature and relative humidity ( R T , H ), and the correlation coefficients between the download rate Γ and the humidity, and the temperature and the vibration acceleration were derived for each day of acquisition (i.e., R Γ , H , R Γ , T , R Γ , | a v , n | , respectively).
Then, as previously discussed in Section 2.3, with the knowledge gained after the simple correlation analysis, we investigated if a linear regression model could be established between the multimedia files download rate and the environmental and vehicle parameters. This allowed us to verify and quantify if and in which measure the file download varies with the physical quantities monitored by the WSN node. In other words, being Γ as the ratio between the file size (see Equation (1)), in MB, and the total download time from the server to the WSN node, the following multivariate linear regression was performed [37,38]:
Γ = β 0 + β 1 | a v , n | + β 2 H + β 3 T
where | a v , n | is the norm of the acceleration due to the vehicle vibrations, as previously defined, while T is the temperature, in C, measured at sensor location and H is the relative humidity, in percent. With the coefficients β i , for i = 0, …, 3, it is possible to determine a linear relationship between the three monitored variables and the download performances exists. The residual sum of squares R 2 was employed as index to measure the level of significance of the linear regression. The higher is the value of R 2 , the higher is the significance of the relationship among Γ , | a v , n | , H, and T. Furthermore, with this linear regression model, it is possible to study the rate of variation of the unit of transmission Γ as a function of the three variables. The analysis was oriented to understand the influence of the different quantities.

4. Results

In Figure 7, as examples, are reported the curves for the physical quantities monitored by the designed WSN node. These curves are the average of the data gathered during January, February, and November 2019. The dynamic of relative humidity, in percent, and temperature, in C, for 12 h of bus ride are shown in Figure 7a,b. From these graphs, it is possible to notice that, on average, at the PCB location, humidity presents a relatively narrow variation during the observation period (e.g., between 8% and 18.3%). These relatively low values are due to the node position, which is very close to the air conditioning system in a dedicated box above the driver seat. As regards the temperature, the range of variations is wider and, on average, it can vary between a minimum of 18 C and a maximum of 30 C. However, the automatic monitoring system detected values above the threshold of 36 C, especially in the summer season, and then sent the alert messages, as shown in Figure 2. It is worth noting the inverse trend of the relative humidity with respect to the temperature, i.e., the colder is the air temperature, the higher is the relative water content retained in the environment, and vice versa [39]. The intra-vehicle monitoring is an aspect often neglected in the literature related to WNS for automotive applications [11].
The results of the elaboration (see Section 3, Figure 6) of the accelerometer signals are shown in Figure 7c. The average monthly curves in Figure 7c represent the acceleration experienced by the hardware of the WSN node. This acceleration, as explained in Section 3 and Figure 6, is caused by the high-frequency vibrations of the vehicle, and they represent a potential threat for the hardware and its functioning. It can be noticed that the sensor, during an average ride, is subject to vibrations with acceleration values generally higher than 9.8 ms 2 , i.e., the gravitational acceleration value. Therefore, the force to which the WSN node is subjected during a typical bus route can be about two times higher than the force it experiences at rest, when the gravitational force is acting. In particular, the value of | a v , n [ n ] | , during several days, can overcome the threshold level of 20 ms 2 . Therefore, alarm messages are frequent for this physical quantity (see Figure 2). Finally, in Figure 7d, the rate of download of multimedia files, Γ , in MBs 1 , is presented. The videos and massages have a variable size and they were chosen according to the need of the public transportation company.
It is possible to observe that, for seven random days during January, February, and November 2019, the download rate can have a constant trend of 3 MBs 1 , or can be as high as 10 MBs 1 . However, several sudden variations can be noticed. Focusing on the period of February 2019, the possible differences in the download of messages and videos was investigated. The results for the eight tests for messages with different number of characters are shown in Table 2. On average, the update time is 1.5 s for about 32 characters, i.e., 128 bits, for an average transfer rate of 85.3 bits per second. Then, the potentially more complicated transfer of video was tested. As derived form the results presented in Table 3, the average transfer time is of about 94.8 s for an average size of 21.12 MB. The results from Table 2 and Table 3 are coherent with the findings in Figure 7d. Moreover, these are relatively good performances compared to those of other WSN tested with vehicle in movements [40].
It must be reported that, during both the tests and during the operating period some issues with the download occurred. Due to the variability of the physical quantities and the different routes, a complete and systematic understanding can be troublesome. However, some theoretical or adaptive strategies can be implemented to avoid these adverse situations [41,42,43]. This is why, as explained in Section 3.2, the Pearson’s correlation coefficient between the aforementioned variables and the download rate was investigated for the three months of monitoring. The average correlation values for whole period are reported in Table 4. As suggested by the curves in Figure 7c,d, it can be noticed that there exists a strong negative correlation (−0.6601) between temperature and humidity. As regards the relationship between the download rate and the temperature, the positive correlation value of 0.6321 indicates that, if the temperature increases, Γ increases. On the other hand, the correlation between the download rate and the relative humidity is relatively lower and negative, equal to −0.3683. This means that, a lowering in the humidity value calls for an increase in the download rate. Therefore, in merit to the correlation between the download rate and the norm of the acceleration due to the vehicle vibration, since a value of −0.2653 was found, it is possible to infer that, the lower is the bus vibration, the better is the multimedia content management by the WSN.
With the knowledge retrieved from the rather simple correlation analysis, the data analysis was deepened to investigate if a linear relationship between the download rate and the environmental and vehicle parameters exist. A multivariate regression was performed according to Equation (7). The coefficients for Γ ( | a v , n | , H , T ) , averaged on the three months of observations, are β 0 = 41.82529 , β 1 = 4.9100, β 2 = 0.4035 , and β 3 = 1.7046, found with R 2 = 0.6272. The results cannot be presented due to the 4D nature of the function. The value of the residual sum of squares indicates that the hypothesis of a linear relationship is a well posed one. Indeed, values very close to one can indicate a bias due to the combination of data [37,38]. However, since the Pearson’s correlation coefficient R T , H is high, it is possible that one of these variable may not be significant to describe the variations of the download rate during the bus rides.
Therefore, the multivariate regression of Equation (7) was performed again imposing β 3 = 0 in order to identify the level of significance of humidity and the norm of the acceleration due to the bus vibrations. It was found that β 0 = 9.9947, β 1 = 0.06, and β 2 = 0.67 , with R 2 = 0.1357. The results of the multivariate linear regression for this case are presented in Figure 8a. Then, the model was fitted imposing β 2 = 0, to exclude the humidity variable. The resulting surface with coefficients β 0 = 47.6639 , β 1 = 4.2130, and β 2 = 1.7633 is shown in Figure 8b. In this case, in a way similar and very close to the three variable models, the residual sum of squares is 0.6046. The derived model is fit to the experimental data. Therefore, from this last finding, it is possible to infer that the download rate of the proposed WSN architecture is slightly affected by the environmental parameters (especially the temperature) and by the strength of the acceleration of the vehicle vibrations. These analyses and results justify the proposed design and study, while encouraging to further develop, enhance, characterize, and investigate this architecture in order to develop a robust, reliable engineering tool for the automotive field of public transportation.

5. Conclusions

Wireless Sensors Network are recognized as a powerful expression of the Internet of Things. However, despite the great advantages offered by this technology, their application has been partially investigated in automotive applications, especially public transportation and intelligent transportation systems. A first goal was the investigation of whether open-hardware software can be safely and effectively employed in a peculiar scenario such as a bus. Moreover, the aim of this study was to develop a cost-effective WSN node that can monitor several physical parameters (i.e., acceleration, temperature, and relative humidity), while managing the download and streaming of multimedia content, as well as set up an automatic alert system. Therefore, in this work, several off-the-shelf, open, and cost-effective hardware components were compared to identify a suitable choice for the node and WSN design to be employed in the automotive field. The Raspberry Pi unit is a good candidate, given the fact that the EMC has been recently studied [19,23]. The WSN was set up in the bus vehicles and it was tested for three months, i.e., January, February, and November 2019. During this period, the physical quantities of interest were monitored and analyzed. After preliminary test of the efficiency of the download rate of multimedia contents, given the variability of this quantity, a correlation analysis was performed. Then, a linear multivariate regression was investigated to derive a model that could describe the variation of this relevant quantity with respect to the environmental and operative parameters. The findings indicate that the lower is the magnitude of the vibrations experienced by the WSN node, the higher and the better is the download rate. Therefore, as a conclusion, the proposed solution can be employed in automotive applications.
The proposed WSN architecture was also carefully analyzed in terms of Strengths, Weakness, Opportunities, and Threats (SWOT), as shown in Figure 9 [44,45]. The engineering tool investigated and characterized in this work offers a versatile multimedia management, combined with a real time messaging system. Furthermore, the system is selective, since it can easily track and discriminate the nodes and vehicles, implying that the overall quality of service can be improved. As regards the cost-effectiveness of the system, considering the functionalities, the choice of the Raspberry Pi as SBC allows reducing the cost by about 30%, with respect to the Nano-ULT3 and the VB0X-3120, as shown in Table 5. This low-cost solution for automotive application can be appealing for the automotive field because of the open source hardware employed, which is a flexible, reliable, easy to update, and portable platform. The flexibility and high modularity add new functionalities with respect to the other devices currently available, at a lower price (see Table 1). However, despite the advantages, strengths, and promising findings of the proposed WSN architecture, it must be pointed out that the design and results are at a preliminary stage. Hence, one major limitation is that the automotive certification for the Raspberry Pi unit is not available at the moment, but some recent literature findings encourage the possibility to easily obtain it [19,23,46]. Furthermore, even though it has been demonstrated that the temperature, humidity, and bus vibrations do not affect the management of multimedia content, the data transmission in upload and download should be optimized and enhanced to avoid instabilities, since this is a primary requirement for the case company. To these weaknesses, it should be stressed that the threat of WSN security is a pivotal aspect that deserves to be investigated in the future. Future works may deal with the empowerment of the proposed WSN node. For instance, a thermographic or optical camera [11,12] could be integrated to derive useful features and information to measure some parameters related to the quality of the service or the security during the transportation, e.g., the count of passengers or the detection of passengers smoking on the bus.

Author Contributions

Conceptualization, A.F., S.F., T.P., and G.M.; methodology, A.F., M.B., and A.M.; hardware realization: A.M. and T.P.; software, M.B.; validation, M.B., A.M., M.B.L., and C.D.; formal analysis, A.M., M.B.L., and C.D.; investigation, M.B., A.M., M.B.L., and C.D.; data curation, M.B. and A.M.; writing—original draft preparation, M.B.L.; writing—review and editing, M.B., A.M., M.B.L., C.D., A.F., S.F., T.P., and G.M.; visualization, M.B.L. and A.M.; logistic aspects, S.F.; supervision, A.F., S.F., T.P., and G.M.; project administration, A.F.; and funding acquisition, A.F. and S.F.

Funding

This work was funded by CTM S.p.A. under the contract “Sperimentazione sul campo di servizi multimediali sui monitor dei bus di linea CTM”.

Acknowledgments

The authors would like to sincerely thanks Franco Spiga, from CTM S.p.A. for support and help for the experimental setup on the buses, and Dr. Luca Lodi for the extensive and helpful discussions related to the data analysis. Moreover, we would like to express our gratitude to Dr. Filippo Ledda for his valuable suggestions and support with the development of the CMS. Finally, the authors must kindly acknowledge the reviewers for their valuable comments and suggestions, which helped to improve this paper.

Conflicts of Interest

The authors declare no conflict of interest.

Abbreviations

The following abbreviations are used in this manuscript:
ANNArtificial Neural Networks
ARMAdvanced RISC Machines
CMSContent Management System
DFTDiscrete Fourier Transform
EMCElectromagnetic Compatibility
GPUGraphic Processing Unit
HDMIHigh-Definition Multimedia Interface
ICTInformation and Communication Technology
IDFTInverse Discrete Fourier Transform
ITSIntelligent Transportation Systems
LTELong Term Evolution
PCBPrinted Circuit Board
SBCSingle Board Computer
SDRAMSynchronous Dynamic Random Access Memory
SWOTStrengths, Weaknesses, Opportunities, Threats
Wi-FiThree letter acronym
WLANWireless Local Area Network
WSNWireless Sensors Network

References

  1. Wu, F.J.; Kao, Y.F.; Tseng, Y.C. From wireless sensor networks towards cyber physical systems. Pervasive Mob. Comput. 2011, 7, 397–413. [Google Scholar] [CrossRef]
  2. Gutiérrez, J.; Villa-Medina, J.F.; Nieto-Garibay, A.; Porta-Gándara, M.Á. Automated irrigation system using a wireless sensor network and GPRS module. IEEE Trans. Instrum. Meas. 2013, 63, 166–176. [Google Scholar] [CrossRef]
  3. Rodriguez-Sanchez, M.; Borromeo, S.; Hernández-Tamames, J. Wireless sensor networks for conservation and monitoring cultural assets. IEEE Sens. J. 2010, 11, 1382–1389. [Google Scholar] [CrossRef]
  4. Gómez, R.; Camarero, A.; Molina, R. Development of a vessel-performance forecasting system: Methodological framework and case study. J. Waterw. Port. Coast. Ocean Eng. 2015, 142, 04015016. [Google Scholar] [CrossRef]
  5. Gungor, V.C.; Hancke, G.P. Industrial wireless sensor networks: Challenges, design principles, and technical approaches. IEEE Trans. Ind. Electron. 2009, 56, 4258–4265. [Google Scholar] [CrossRef] [Green Version]
  6. Da Xu, L.; He, W.; Li, S. Internet of things in industries: A survey. IEEE Trans. Ind. Inform. 2014, 10, 2233–2243. [Google Scholar]
  7. Ehrlich, M.; Wisniewski, L.; Jasperneite, J. State of the art and future applications of industrial wireless sensor networks. In Kommunikation und Bildverarbeitung in der Automation; Springer: Berlin/Heidelberg, Germany, 2018; pp. 28–39. [Google Scholar]
  8. Hu, X.; Xiong, W.; Li, W.; Ke, L. Application scenarios of wireless sensor networks for urban transportation: A survey. In Proceedings of the 2015 34th Chinese Control Conference (CCC), Hangzhou, China, 28–30 July 2015; pp. 7688–7691. [Google Scholar]
  9. Petracca, M.; Maggiani, L.; Stefano Bocchino, C. When Buses Become Smart: The OBIT Experience. In Intelligent Transportation Systems; CRC Press: Boca Raton, FL, USA, 2016; pp. 48–68. [Google Scholar]
  10. Bohli, J.M.; Hessler, A.; Ugus, O.; Westhoff, D. A secure and resilient WSN roadside architecture for intelligent transport systems. In Proceedings of the First ACM Conference on Wireless Network Security, Alexandria, VA, USA, 31 March–2 April 2008; pp. 161–171. [Google Scholar]
  11. Kang, L.; Poslad, S.; Wang, W.; Li, X.; Zhang, Y.; Wang, C. A public transport bus as a flexible mobile smart environment sensing platform for IoT. In Proceedings of the 2016 12th International Conference on Intelligent Environments (IE), London, UK, 14–16 September 2016; pp. 1–8. [Google Scholar]
  12. Nellore, K.; Hancke, G. A survey on urban traffic management system using wireless sensor networks. Sensors 2016, 16, 157. [Google Scholar] [CrossRef] [Green Version]
  13. Rodelgo-Lacruz, M.; Gil-Castineira, F.; Gonzalez-Castano, F.; Pousada-Carballo, J.; Contreras, J.; Gomez, A.; Bueno-Delgado, M.; Egea-Lopez, E.; Vales-Alonso, J.; Garcia-Haro, J. Base technologies for vehicular networking applications: Review and case studies. In Proceedings of the 2007 IEEE International Symposium on Industrial Electronics, Vigo, Spain, 4–7 June 2007; pp. 2567–2572. [Google Scholar]
  14. Strutu, M.; Stamatescu, G.; Popescu, D. A mobile sensor network based road surface monitoring system. In Proceedings of the 2013 17th International Conference on System Theory, Control and Computing (ICSTCC), Sinaia, Romania, 11–13 October 2013; pp. 630–634. [Google Scholar]
  15. ElBatt, T.; Saraydar, C.; Ames, M.; Talty, T. Potential for intra-vehicle wireless automotive sensor networks. In Proceedings of the 2006 IEEE Sarnoff Symposium, Princeton, NJ, USA, 27–28 March 2006; pp. 1–4. [Google Scholar]
  16. Tavares, J.; Velez, F.; Ferro, J. Application of wireless sensor networks to automobiles. Meas. Sci. Rev. 2008, 8, 65–70. [Google Scholar] [CrossRef] [Green Version]
  17. Tewolde, G.S. Sensor and network technology for intelligent transportation systems. In Proceedings of the 2012 IEEE International Conference on Electro/Information Technology, Indianapolis, IN, USA, 6–8 May 2012; pp. 1–7. [Google Scholar]
  18. Chien, T.V.; Chan, H.N.; Huu, T.N. A comparative study on hardware platforms for wireless sensor networks. Int. J. Adv. Sci. Eng. Inf. Technol. 2012, 2, 70–74. [Google Scholar] [CrossRef] [Green Version]
  19. Vujović, V.; Maksimović, M. Raspberry Pi as a Wireless Sensor node: Performances and constraints. In Proceedings of the 2014 37th International Convention on Information and Communication Technology, Electronics and Microelectronics (MIPRO), Opatija, Croatia, 26–30 May 2014; pp. 1013–1018. [Google Scholar]
  20. Baire, M.; Melis, A.; BrunoLodi, M.; Fanti, A.; Mazzarella, G. Study and Design of a Wireless Sensors Network for the Optimization of Bread Manufacturing Process. In Proceedings of the 2018 26th Telecommunications Forum (TELFOR), Belgrade, Serbia, 20–21 November 2018; pp. 1–4. [Google Scholar]
  21. Iszaidy, I.; Ngadiran, R.; Ahmad, R.; Jais, M.; Shuhaizar, D. Implementation of raspberry Pi for vehicle tracking and travel time information system: A survey. In Proceedings of the 2016 International Conference on Robotics, Automation and Sciences (ICORAS), Ayer Keroh, Malaysia, 5–6 November 2016; pp. 1–4. [Google Scholar]
  22. Beadman, T. Legislation Update–Radio and EMC in the Automotive Environment. J. Navig. 2001, 54, 65–69. [Google Scholar] [CrossRef]
  23. Mach, V.; Kovář, S.; Valouch, J.; Adámek, M.; Silva, R.M.S. Electromagnetic compatibility of Raspberry Pi development platform in near and far-field. In Proceedings of the 2017 Progress in Electromagnetics Research Symposium-Fall (PIERS-Fall), Singapore, 19–22 November 2017; pp. 2466–2472. [Google Scholar]
  24. Tsukioka, A.; Nagata, M.; Taniguchi, K.; Fujimoto, D.; Akimoto, R.; Egami, T.; Niinomi, K.; Yuhara, T.; Hayashi, S.; Mathews, R.; et al. Simulation techniques for EMC compliant design of automotive IC chips and modules. In Proceedings of the 2017 International Symposium on Electromagnetic Compatibility-EMC EUROPE, Angers, France, 4–7 September 2017; pp. 1–6. [Google Scholar]
  25. Luchian, E.F.; Taut, A.; Ivanciu, I.A.; Lazar, G.; Dobrota, V. Mobile wireless sensor network gateway: A raspberry Pi implementation with a VPN backend to OpenStack. In Proceedings of the 2017 25th International Conference on Software, Telecommunications and Computer Networks (SoftCOM), Split, Croatia, 21–23 September 2017; pp. 1–5. [Google Scholar]
  26. Ovsthus, K.; Kristensen, L.M. An industrial perspective on wireless sensor networks—A survey of requirements, protocols, and challenges. IEEE Commun. Surv. Tutor. 2014, 16, 1391–1412. [Google Scholar]
  27. Romer, K.; Mattern, F. The design space of wireless sensor networks. IEEE Wirel. Commun. 2004, 11, 54–61. [Google Scholar] [CrossRef] [Green Version]
  28. Gawade, P.; Meeankshi, A. IOT Based Smart Public Transport System. Int. J. Sci. Res. Publ. 2017, 7, 390–396. [Google Scholar]
  29. Ferdoush, S.; Li, X. Wireless sensor network system design using Raspberry Pi and Arduino for environmental monitoring applications. Procedia Comput. Sci. 2014, 34, 103–110. [Google Scholar] [CrossRef] [Green Version]
  30. Liu, J.; Wang, P.; Tian, X. Vibration displacement measurement based on three axes accelerometer. In Proceedings of the 2017 Chinese Automation Congress (CAC), Jinan, China, 20–22 October 2017; pp. 2374–2378. [Google Scholar]
  31. Castellini, P.; Montanini, R. Automotive components vibration measurements by tracking laser Doppler vibrometry: Advances in signal processing. Meas. Sci. Technol. 2002, 13, 1266. [Google Scholar] [CrossRef]
  32. Le Sage, T.; Bindel, A.; Conway, P.; Justham, L.; Slawson, S.; West, A. Embedded programming and real-time signal processing of swimming strokes. Sport. Eng. 2011, 14, 1. [Google Scholar] [CrossRef]
  33. Karlsson, R.; Gustafsson, F. The future of automotive localization algorithms: Available, reliable, and scalable localization: Anywhere and anytime. IEEE Signal Process. Mag. 2017, 34, 60–69. [Google Scholar] [CrossRef] [Green Version]
  34. Chudzikiewicz, A.; Drozdziel, J.; Sowinski, B. Practical Solution of Rail Vehicle and Track Dynamics Monitoring System. In Key Engineering Materials; Trans Tech Publ: Zurich, Switzerland, 2012; Volume 518, pp. 271–280. [Google Scholar]
  35. Weippert, M.; Stielow, J.; Kumar, M.; Kreuzfeld, S.; Rieger, A.; Stoll, R. Tri-axial high-resolution acceleration for oxygen uptake estimation: validation of a multi-sensor device and a novel analysis method. Appl. Physiol. Nutr. Metab. 2012, 38, 345–351. [Google Scholar] [CrossRef]
  36. Rettore, P.H.; Campolina, A.B.; Villas, L.A.; Loureiro, A.A. Identifying relationships in vehicular sensor data: A case study and characterization. In Proceedings of the 6th ACM Symposium on Development and Analysis of Intelligent Vehicular Networks and Applications, Malta, Malta, 13–17 November 2016; pp. 33–40. [Google Scholar]
  37. Guestrin, C.; Bodik, P.; Thibaux, R.; Paskin, M.; Madden, S. Distributed regression: An efficient framework for modeling sensor network data. In Proceedings of the 3rd International Symposium on Information Processing in Sensor Networks, Berkeley, CA, USA, 26–27 April 2004; pp. 1–10. [Google Scholar]
  38. Bejarano-Luque, J.L.; Toril, M.; Fernández-Navarro, M.; Acedo-Hernández, R.; Luna-Ramírez, S. A Data-Driven Algorithm for Indoor/Outdoor Detection Based on Connection Traces in a LTE Network. IEEE Access 2019, 7, 65877–65888. [Google Scholar] [CrossRef]
  39. Nguyen, J.L.; Schwartz, J.; Dockery, D.W. The relationship between indoor and outdoor temperature, apparent temperature, relative humidity, and absolute humidity. Indoor Air 2014, 24, 103–112. [Google Scholar] [CrossRef] [Green Version]
  40. Silveira, E.; Bonho, S. Temperature monitoring through wireless sensor network using an 802.15. 4/802.11 gateway. IFAC-PapersOnLine 2016, 49, 120–125. [Google Scholar] [CrossRef]
  41. Galvan-Tejada, G.M.; Aguilar-Torrentera, J. Analysis of Propagation for Wireless Sensor Networks in Outdoors. Prog. Electromagn. Res. 2019, 83, 153–175. [Google Scholar] [CrossRef] [Green Version]
  42. Celaya-Echarri, M.; Azpilicueta, L.; López-Iturri, P.; Aguirre, E.; Falcone, F. Performance Evaluation and Interference Characterization of Wireless Sensor Networks for Complex High-Node Density Scenarios. Sensors 2019, 19, 3516. [Google Scholar] [CrossRef] [PubMed] [Green Version]
  43. Merabtine, N.; Djenouri, D.; Zegour, D.E.; Boumessaidia, B.; Boutahraoui, A. Balanced clustering approach with energy prediction and round-time adaptation in wireless sensor networks. IJCNDS 2019, 22, 245–274. [Google Scholar] [CrossRef]
  44. Pickton, D.W.; Wright, S. What’s swot in strategic analysis? Strateg. Chang. 1998, 7, 101–109. [Google Scholar] [CrossRef]
  45. Alarifi, A.; Al-Salman, A.; Alsaleh, M.; Alnafessah, A.; Al-Hadhrami, S.; Al-Ammar, M.A.; Al-Khalifa, H.S. Ultra wideband indoor positioning technologies: Analysis and recent advances. Sensors 2016, 16, 707. [Google Scholar] [CrossRef]
  46. Spano, I.L.; Mocci, A.; Serpi, A.; Marongiu, I.; Gatto, G. Performance and EMC analysis of an interleaved PFC boost converter topology. In Proceedings of the 2014 49th International Universities Power Engineering Conference (UPEC), Cluj-Napoca, Romania, 2–5 September 2014; pp. 1–6. [Google Scholar]
Figure 1. Scheme of the Wireless Sensors Network (WSN) proposed for automotive applications. The single node is composed of relative humidity, temperature, and accelerometer sensors. A Raspberry PI 3+ unit is employed as core, sink, and gateway node. The Raspberry unit process and elaborate the sensor data in real time. The bus monitor is connected to the Single Board Computer (SBC). The Raspberry transfers data to and from a server. The ElastAlert application monitors the data elaborated by the Raspberry and, if fixed threshold values are overcome, it sends alert messages through a Telegram application. The Content Management System (CMS) recognizes the device and the line to which is associated. The CMS transfers data and messages to the Raspberry unit, which displays them on the bus screens.
Electronics 08 01483 g001
Figure 2. Examples of the Telegram bot, which forwards the messages created by ElastAlert. The alert messages are sent for the absence of connection, the CPU and air temperature, and the detection of collisions.
Electronics 08 01483 g002
Figure 3. Examples of the CMS: (a) devices seen from the different nodes in the WSN; (b) downloadable and active messages for the different lines; and (c) downloadable and active videos for the different lines.
Electronics 08 01483 g003
Figure 4. (a) Top and (b) bottom view of the designed and realized PCB for the single node. (c) PCB schematic from the Eagle Autodesk software. (d) Schematic of the connection for the single node.
Electronics 08 01483 g004
Figure 5. Prototypes of the intra-vehicle WSN node mounted on the bus. The DC-DC converters for the power supply, the ad hoc PCB, the Raspberry unit, and the dongle for the wireless transmission are shown.
Electronics 08 01483 g005
Figure 6. Summary of the processing steps for the accelerometer signal. The discrete digital time sequence of the three channel ( a x [ n ] , a y [ n ] , and a z [ n ] ) is acquired and registered by the Raspberry unit. The single board computer performs the Discrete Fourier Transform (DFT) of each channel to derive the spectrum of the accelerometric signal, i.e., A x [ k ] , A y [ k ] , and A z [ k ] . The low-frequency components related to gravitational acceleration and noise are eliminated by high-pass filtering. The remaining spectra is the acceleration due to the vibration of the vehicle during the bus ride ( A v , x [ k ] , A v , y [ k ] , and A v , z [ k ] ). The Inverse DFT is then computed to derive the time sequences a v , x [ n ] , a v , y [ n ] , and a v , z [ n ] . Finally, the three channels are employed to derive the norm of the signal, a v , n [ n ] , for further analysis handled by the ElastAlert application.
Electronics 08 01483 g006
Figure 7. Examples of the acquired signals during 12 h of a typical urban bus route during January, February, and November 2019: (a) average relative humidity curves, in percent, for the three months of monitoring; (b) average temperature curves, in C, for the three months of monitoring; (c) average curves of the norm of the acceleration due to bus vibration, | a v , n [ n ] | in ms 2 for the three months of monitoring; and (d) multimedia download rate from the server to the WSN node, Γ , in MBs 1 , for seven random days in January, February, and November 2019.
Electronics 08 01483 g007
Figure 8. (a) Result of the linear regression ( R 2 = 0.1357) employing relative humidity, in percent, and the norm of acceleration due to the bus vibration, in ms 2 , as dependent variables for the total transfer rate of multimedia files, Γ , in MBs 1 . (b) Result of the linear regression ( R 2 = 0.6046) employing the temperature, in C, and the norm of acceleration due to the bus vibration, in ms 2 , as dependent variable for the total transfer rate of multimedia files, Γ , in MBs 1 .
Electronics 08 01483 g008
Figure 9. Strengths, Weakness, Opportunities, and Threats (SWOT) analysis of the designed WSN architecture for automotive applications.
Electronics 08 01483 g009
Table 1. Comparison of open-source hardware for automotive applications.
Raspberry Pi 3 Bi+Nano-ULT3VB0X-3120
CPUCortex-A53 64b, 1.4 GHzCel3955UDualC 64b, 2 GHzI32980U 64b, 1.6 GHz
Ram Memory1 GB4 GB8 GB
Disk16-32-64 GB32 GB256 GB
Operative SystemRaspbianUbuntu 18.10Windows 7, 8.1, Linux 3.0
Display InterfaceNoYesNo
Num. HDMI Port121
I/O InterfaceYesYesYes
AudioYesYesYes
DC Power Input, V5129
Dimension, mm × mm × mm82 × 56 × 19.5115 × 165182 × 167.6 × 54
Weight, g508501406
Operating Temp., °C−10–85−20–6−40–70
Humidity, %Not declared5–9510–90
Certified for AutomotiveNoNoYes
Price, €(VAT excluded)61.419501065
Table 2. Results from the test of single messages transfer from server to WSN node during several bus rides.
DateTransfer Time, secNo. of Characters
25 February 2019122
25 February 2019242
25 February 2019122
25 February 2019142
26 February 2019341
27 February 2019121
27 February 2019222
27 February 2019142
Table 3. Results from the test of video transfer from server to WSN node during several bus rides.
DateTransfer Time, secNo. of VideosSize, MB
25 February 20195918.91
25 February 2019122222.91
25 February 20196115.9
25 February 2019117230.59
26 February 201958114
27 February 201964116.59
27 February 2019123230.59
27 February 2019155139.5
Table 4. Values of the Pearson’s correlation coefficients derived from the correlation analysis.
Value
R T , H 0.6601
R Γ , T 0.6321
R Γ , H 0.3683
R Γ , | a v , n | 0.2653
Table 5. Estimated prices, in €, per 60 vehicles.
Raspberry Pi 3 Bi+Nano-ULT3VB0X-3120
Automotive Certification Price, €45.1745.170
Software Cost, €5005001000
Hardware Cost, €264.4111501065
Minimum Total Cost, €1416.582306.172175.00
Maximum Total Cost, €1828.082716.672586.50

