Abstract
Background: The sense of smell has been recently recognized as one of the most important sensory features in the human being, representing a reliable biomarker for a number of clinical conditions. The relationship between olfactory function and the person’s attitude towards food has frequently been investigated, often using questionnaires. The administration of minimally invasive methods for characterizing autonomic nervous system (ANS) functionality could help in objectivizing such measurements. Methods: The present study assessed ANS activation through the analysis of the electrocardiogram (ECG) and galvanic skin response (GSR) signals, in response to olfactory stimuli using non-invasive wearable devices. The ANS activation was also studied with respect to the odor familiarity, as well as with other olfactory and food dimensions (e.g., odor identification, odor pleasantness, food neophobia). Results: We demonstrated a significant activation of the ANS, in particular of its sympathetic branch, during the olfactory stimulation, with the ECG signal seen as more sensitive to detect ANS response to moderate olfactory stimuli rather than the GSR. Conclusions: When applied to a greater number of subjects, or to specific groups of patients, this methodology could represent a promising, reliable addition to diagnostic methods currently used in clinical settings.
1. Introduction
Smell is one of the five human senses and, together with taste, it has a central role in guiding food choices. Indeed, the olfactory modality is known to be both evolutionarily and functionally linked to food [1], with odors having a significant effect on both psychological and physiological parameters connected to eating behavior, including, for example, salivation and overfeeding [2,3,4]. Thanks to its unique pathway, olfaction is also closely linked to emotions [5], in turn pivotal in eating behaviors [6,7].
One of the key pieces of information conveyed by the olfactory pathway is the highly subjective “odor hedonic value” [8], which is central to our decisions towards feeding [9]. The hedonic value of an odor is widely affected by genetic and environmental factors [10], including cognitive inputs, which can extensively modify the perception we have of an odorous substance [11]. The two dimensions of odor hedonic are odor pleasantness and odor valence. Odor pleasantness often guides behaviors towards an environment or food, with pleasant odors eliciting positive feelings which lead to approach behavior, such as a safe environment or an edible food, while unpleasant odors evoking negative feelings lead to avoidance behavior, like shying away from predator or poison. The different effect induced by pleasant and unpleasant odors is supported by studies investigating reaction time [12], physiological response patterns [5,13], and functional neuroimaging [14,15].
Odor familiarity, i.e., the a priori knowledge of an odorous compound, at least for neutral and pleasant odors [16,17], is correlated with odor pleasantness. This correlation is, however, not fully unraveled: indeed, it is not known whether human beings voluntarily expose themselves to pleasant odors, increasing their familiarity with time, or they start liking odors as much as they become more familiar, but recent evidence falls in favor of the second hypothesis, at least when applied to highly familiar odors [18].
Notably, there is evidence that edibility is also an important factor in influencing the effect of odors. Indeed, unpleasant food odor (e.g., fish) is detected faster and more accurately than either pleasant (e.g., orange) or nonedible odors (e.g., dirty socks, rose) [19].
Together with odor familiarity and odor pleasantness, food preferences are also modulated by the so-called “food neophobia” [20], defined as the avoidance of novel food and the overall reluctance to eat, in turn driving a lower dietary variety [21]. Food neophobia is driven by sensory factors, including the smell, taste, and texture of the food [22]. In various research, it is also hypothesized that food neophobics, individuals less willing to try new foods, therefore having less contact with them, have a lower knowledge of odors; therefore, they would more likely judge odors as “less pleasant” than food neophilics [11,23]. In addition, it can be stated that food neophobics have a lower olfactory identification score, since their knowledge a priori of odors is lower, and it is known that odor identification ability is strictly related to the degree of knowledge a subject has for the proposed odors [20]. Interestingly, food neophobia is linked to general neophobia [21], in turn defined as, “the fear of anything new, especially a persistent and abnormal fear” or, similarly, “the unwillingness to try new things or break from routine”.
The above discussed aspects regulating food preference suggest that food choice is poorly based on cognitive information processing and rational reasoning, while it is more regulated by unarticulated/unconscious motives and associations [24]. These associations are not very well captured by traditional tests based on conscious cognitive processes, and may be better captured by physiological measures of the autonomic nervous system (ANS), which do not require conscious processes [25].
The analysis of the oscillation in the interval between consecutive heartbeats of the electrocardiogram (ECG), called heart rate variability (HRV) analysis, allows the characterization of the two arms of the autonomic nervous system, i.e., the sympathetic and parasympathetic influences [26]. Literature evidence suggests that heart rate and HRV are largely affected by odor inhalation, with decreased heart rate and increased parasympathetic activity in response to specific ‘natural’ odors [27]. In addition to ECG, electrodermal recordings, which are also related to ANS activity, could be especially effective for investigations of affective olfactory processes. Notably, the administration of minimally invasive methods for characterizing ANS functionality, through the use of wearable devices, could help in objectivizing such measurements, without requiring a particular methodological effort, nor causing annoyance to the patient monitored.
The evaluation of the ANS in response to odorants with different hedonic value, and in particular of food odors, can have several implications. From a more scientific point of view, this type of analysis can help in elucidating the mechanisms associated with the preference for certain types of food compared to others. Importantly, previous evidence shows different amplitudes and durations of the ANS response according to the hedonic valence or emotional loads of the odorants [28,29], indicating the validity of using ANS assessment to evaluate the emotional response associated with odorants more than more traditional hedonic tests. The autonomic nervous system may be considered a goal-direct system, acting as an intermediary between internal emotional feelings and external output behavior (such as liking responses, or the decision to continue or stop eating). Therefore, ANS response may provide additional insights into the mechanisms underlying sensory-specific satiety.
Then, a proper evaluation of ANS measures in response to food odors could be used as a tool for marketing (research). It has been observed that up to 80% of all new food products introduced in the market fail, although they are typically subjected to a large number of sensory and consumer tests before their market introduction [30]. This suggests that the “standard” tests have a low predictive validity with respect to general product performance. Consumer choice is more likely driven by a more implicit mechanism, which could be more objectively and deeply investigated by the analysis of ANS.
Finally, the evaluation of the assessment of the relationship between olfactory and ANS responses can have a clinical implication. Previous studies suggest that the sense of smell affects metabolism, and this relationship is mediated by the ANS. In mice, it has been shown that reduced olfactory inputs initiate prolonged sympathetic responses to severe energy depletion through increased β-adrenergic signaling in adipose tissue, therefore promoting increased lipolysis in gonodal fat and increased thermogenesis in brown and subcutaneous fat fads [31]. In humans, a reduced olfactory function is commonly accompanied by a loss of flavor from food, with subsequent loss of appetite and weight loss or anorexia [32]. On the contrary, loss of the insulin-like growth factor 1 receptor (IGF1R) in the olfactory epithelium seems to increase smell perception, associated with increased adiposity, hyperleptinemia, and hyperinsulinemia [31]. Thus, a better understanding of the coupling between food odors stimuli and ANS response can be used in the clinical management of eating disorders such as anorexia or obesity.
To date, very few studies have investigated the ANS response to odor presentation and, in particular, food odors [33,34,35,36]. These studies have some limitations, including the use of a very limited number of odorants [33,35], or might have experienced methodological limitation, mainly concerning the autonomic assessment, as in the case of [34]. In addition, these studies did not clearly investigate the link between odor pleasantness, odor familiarity, and food neophobia with the assessment of ANS functioning.
Therefore, the aim of our pilot research is to investigate, in a small group of healthy adults, the activation of the ANS as an objective measure to quantify the psychophysiological response to olfactory stimuli and its relationship with odor familiarity, as well as with food- and general- neophobia scores. The understanding of the mechanisms for activation of the ANS in response to food-like odors in a group of healthy subjects, without particular risks and/or confounding factors, could be of interest to later define more specific protocols investigating the autonomic reactivity to odors and the relationship with feeding attitude in subjects with eating disorders.
2. Materials and Methods
2.1. Study Population
For this study, 22 healthy volunteers (8 males, 14 females) aged 18–50 (mean age 31.9 ± 7.5 years old), all Caucasian, with a normal body mass index (18.5 < BMI < 25 kg/m2) were enrolled at the National Research Council of Italy, headquarter of Pisa. The work was carried out in accordance with the Code of Ethics of the World Medical Association (Declaration of Helsinki), and informed consent was obtained by all subjects involved after they received an exhaustive explanation of the study aims and methodology.
For the present research, exclusion criteria were: age > 50, presence of cardiovascular or neurological pathologies, complete or partial reduction of the olfactory function, history of head trauma, allergy and respiratory problems, as well as the unwillingness to provide signed informed consent. Such criteria were applied to carry out research on a somewhat uniform study population, to avoid possible biases concerning the autonomic response to the stimuli proposed, and to avoid issues connected with the sensory (olfactory) perception studied.
All the subjects were asked to undergo physiological signal measurements at rest and during the presentation of odorous stimuli and to compile a battery of psychological questionnaires on-site and partially at home, in order to reduce the burden associated with the present protocol.
2.2. Signal Acquisition
The volunteers enrolled were equipped with two minimally obtrusive, wireless, wearable sensors for the monitoring of electrocardiogram (ECG) and galvanic skin response (GSR). The ECG signal was acquired through the Shimmer ECG sensor (Shimmer Sensing, Dublin, Ireland) with a sampling frequency of 500 Hz, whereas the GSR signal was monitored by the Shimmer3 GSR+ sensor (Shimmer Sensing, Dublin, Ireland) with a sampling frequency of 51.2 Hz. The Shimmer ECG acquired the relevant signal by being attached to a fitness-like chest strap manufactured by Polar Electro Oy (Kempele, Finland), whereas the Shimmer3 GSR+ captured the galvanic skin response by adhering to two nearby fingers of the subject’s non-dominant hand through rings.
Both ECG and GSR signals were acquired during the morning (9:00 to 13:00) in a clean, ventilated room, with a controlled temperature of 22 °C (71.6 °F) to avoid eventual temperature biases, following a three-phase procedure:
- Baseline (3’): Basal measurement. Here, the volunteer was asked to sit comfortably on a chair and relax;
- Task (8’): The subject was presented with 12 odors for 10 s each, followed by an inter-stimulus lag of 30 s;
- Recovery (3’): Post-task rest measurement. The volunteer was asked to sit comfortably on a chair and relax, analogously to the Baseline.
2.3. Olfactory Stimulation
A 12-item olfactory test battery, derived from the Sniffin’ Sticks Odor Identification Test (Burghart Medizintechnik, GmbH, Wedel, Germany), was administered during the Task phase under the procedure mentioned above. The battery, randomly presented to avoid serial, was composed of 11 food-like odors (orange, banana, lemon, apple, pineapple, pear, grapefruit, raspberry, coconut, melon, peach) and one non-food like odor, acting as a distractor (lavender). To define the random sequence of odor presentation, each odor was assigned a number and a random generator was launched through an application (with rand and rng functions) of Matlab (MathWorks, Natick, MA, USA) prior to each test administration. The choice for the selected odorants was performed based on the results of our previous research dealing with odor identification tests [37,38], with the 11 food-like odors picked as the most frequently recognized odors among the food-like odors available from the Sniffin’ Sticks Odor Identification Test. Lavender was otherwise selected as a distractor on the same principle (the most widely recognized non-food-like odor in our previous works).
The choice for a 30 s lag between two consecutive odorants was performed in order to guarantee a proper purge of the nasal cavity for the volunteer undergoing the test, as suggested elsewhere [39].
2.4. Questionnaires
- A smell self-rating questionnaire, related to the subjective perception of their own olfactory function ability, was administered prior to the registration. Here, the volunteer was asked to answer the question, “How good do you judge your sense of smell?” on a seven-item Likert-like scale ranging 1 (very poor) to 7 (very good), as already used in literature [40];
- During the protocol, a validated odor identification test was administered on the 12 odors previously described, employing the multiple-response, forced-choice form of the Sniffin’ Sticks Odor Identification Test [41,42];
- At the same time, volunteers were asked to complete two questionnaires, one for assessing odor pleasantness and one investigating odor familiarity. The odor pleasantness questionnaire required the volunteer to answer the question, “How pleasant do you judge this odor?” on a nine-item Likert-like scale ranging from –4 (extremely unpleasant) to +4 (extremely pleasant) for each perceived odor [11]. On the other hand, odor familiarity was administered by asking the volunteer, “How familiar is this odor for you?” allowing them to answer on a seven-item Likert-like scale ranging 1 (completely unknown) to 7 (completely familiar), in a similar fashion to existing literature;
- After the completion of physiological recording and olfactory testing, two validated, well-grounded questionnaires were presented for the assessment of food and general neophobia. The first one was the Food Neophobia Scale (FNS), consisting of 10 questions (items), such as, “I am constantly sampling new and different foods”, or “I don’t trust new foods”, each producing a score ranging from 1 to 7 [21]. The second one, General Neophobia Scale (GNS), consisted of eight questions, each one similarly defined by scores ranging 1 to 7 [21]. Such questions were, for example: “I feel uncomfortable when I find myself in novel situations”, or “Whenever I’m away, I want to get home to my familiar surroundings”, therefore more related to general sensations of phobia and not devoted to feeding situations, which were specifically investigated by the FNS.
2.5. Signal Analysis
2.5.1. ECG
ECG signal was analyzed through a Matlab (Mathworks, Natick, MA, USA)-based interface properly developed, which made it possible to calculate the associated tachogram (RR series, i.e., the time elapsed between two successive R-waves) according to the Pan–Tompkins algorithm [43] and to extract both time- and frequency-domain features characterizing the ANS [44,45,46,47]. Pre-processing steps before computing the tachogram included an infinite impulse response (IIR) low pass filter at 40 Hz, which was applied to eliminate muscular noise, a stepwise filtering to remove artifacts and interferences, a cubic spline third order interpolation between the fiducial isoelectric points of the ECG to remove body movements and respiration, and a notch filter to remove the power line interference at 50 Hz. In addition, an interpolation using the Fourier method was applied to the signal to improve RR fiducial points recognition. From the tachogram, residual artifacts and outliers were removed from by visual inspection. Outliers were replaced by division or summation. The division was applied when the outlier was determined by a failure to detect an R-peak, while summation was applied when it was caused by faulty detections of two or more peaks within a period representing the RR interval (RRI).
The features were then extracted separately for each of the three phases (Baseline, Task, Recovery) of the protocol. More specifically, the features extracted included:
- -
- In the time domain:
- Heart rate (HR): the number of contractions of the heart occurring per time unit, expressed in bpm;
- Standard deviation of normal to normal RR intervals (SDNN): measure of heart rate variability (HRV), expressed in ms;
- Changes in successive normal sinus (NN) intervals exceeding 50 ms (pNN50), expressed as a percentage;
- -
- In the frequency domain:
- Normalized component of the power spectral density of the ECG signal at low frequency (0.04–0.15 Hz) (nLF);
- Normalized component of the power spectral density of the ECG spectrum at high frequency (0.15–0.4 Hz) (nHF);
- Low versus high Frequency components of the power spectral density of the ECG spectrum (LF/HF Ratio).
Frequency domain parameters were extracted by the power spectral density estimated by the Welch method [48].
2.5.2. GSR
GSR signal pre-processing included filtering with a fourth-order IIR filter with a cutoff frequency of 2 Hz, and smoothing with a moving average window of 100 samples. The GSR signal was then analyzed through the Matlab-based software Ledalab [49]. With the help of this tool, several characteristic features were extracted for each phase. More specifically, the overall mean and standard deviation of the GSR signal were calculated for the Baseline, Task, and Recovery phases, whereas during the Task a more in-depth analysis was performed for each of the 12 odorous stimuli administered. Specifically, the GSR variation between pre-stimulus and during-stimulus was computed, according to the methodology already described by Wieser and colleagues [50].
2.6. Statistical Analysis
First, the normality of data was assessed through the Shapiro–Wilk Test [51]. Since the data were not normally distributed, a non-parametrical approach was chosen for statistical evaluation.
Concerning the comparison between phases (i.e., Baseline versus Task versus Recovery), a Friedman’s Test was performed, with a post-hoc analysis administered through the Wilcoxon signed-rank test.
Correlations between autonomic and olfactory parameters, as well as with the scores obtained from the questionnaires, were performed by means of the Spearman’s Test with false discovery rate (FDR) post-hoc correction. Significance was defined at p < 0.05 for all the statistical tests mentioned, except when corrected by FDR.
3. Results
3.1. ECG
The features extracted from the ECG signal during the different recording phases are displayed in Table 1 and Figure 1.

Table 1.
Electrocardiogram (ECG) features in the different recording phases.
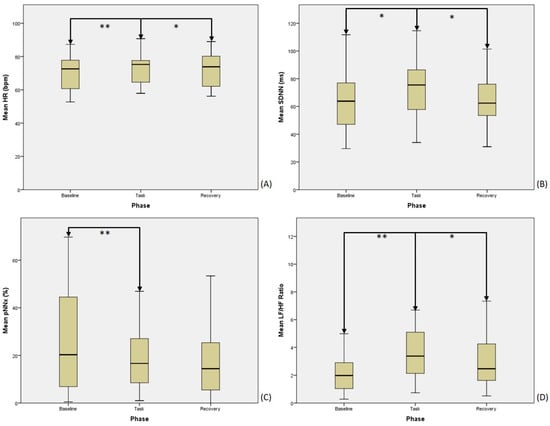
Figure 1.
ECG features in the different recording phases: (A) heart rate (HR), (B) standard deviation of normal to normal RR intervals (SDNN), (C) changes in successive normal sinus (NN) intervals exceeding 50 ms (pNNx), (D) ratio between low and high frequency (LF/HF) (*: significance at p < 0.05; **: significance at p < 0.01).
Post-hoc analysis was otherwise conducted by comparing the features above, citing two phases at a time (e.g., Baseline versus Task; Task versus Recovery). Their statistical comparison, including Z-values (retrieved through the Wilcoxon signed-rank test) and p-values, are reported in Table 2.
Table 2.
Comparison between the ECG features two phases at a time.
3.2. GSR
The mean GSR signal extracted for each recording phase is displayed in Figure 2. The value of this signal was significantly increased (p < 0.001) from Baseline (1.52 ± 1.13 µS) to Task (2.39 ± 1.83 µS) to Recovery (2.69 ± 1.98 µS), with a significant increase noticed in the two-by-two comparison between phases (Z = 3.980, p < 0.001 between Baseline and Task; Z = 3.493, p < 0.001 between Task and Recovery).
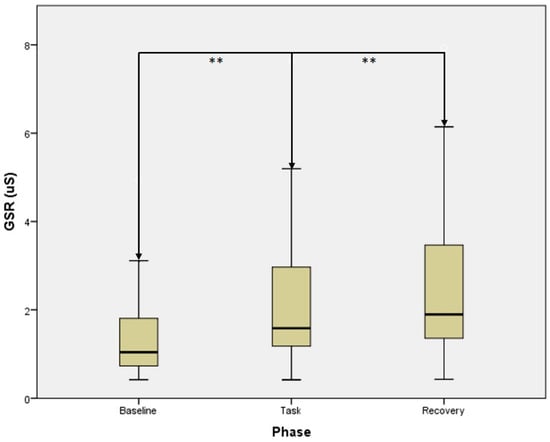
Figure 2.
Galvanic skin response (GSR) mean signal in the different recording phases **: significance at p < 0.01).
Average values of the GSR response, calculated as “deltas” (stimulus–pre-stimulus), as mentioned above, for the different odors displayed in Table 3.
Table 3.
Average GSR response to the different odor compounds, with reference to their CAS numbers.
Correlations were investigated for all physiological signals with respect to the parameters calculated through the questionnaires (i.e., SSR odor identification, pleasantness and familiarity, food and general neophobia). In addition, the average GSR responses to each different odor were correlated with both familiarity and pleasantness in turn associated with that odor.
Significant correlations were found between olfactory pleasantness and different ECG parameters at the Task stage, including HR (r = −0.595, p = 0.004), nLF (r = −0.596, p = 0.003), nHF (r = 0.596, p = 0.003), LF/HF (r = −0.599, p = 0.003).
No further correlation was found between any of the autonomic parameters investigated, nor between the questionnaires after the post-hoc correction (Table 4).
Table 4.
Correlations (correlation coefficients and p-values) between autonomic parameters and questionnaires (top) and between questionnaires (bottom).
4. Discussion
The results obtained by the present study, conducted on healthy volunteers, demonstrated significant modifications of the parameters related to the ANS in response to food-like odors. In addition, significant correlations between ANS features and a measure of odor pleasantness were identified.
Specifically, an increased HR during the Task with respect to the Baseline was observed. This increase was reversible, as it was followed by a subsequent decrease of this feature during the Recovery, until values close to the Baseline. Such variation is probably due to an increased sympathetic nervous system (SNS) activity caused by the presentation of odorous stimuli, as already demonstrated by our group [52]. The increased SNS was probably the main driver for the overall increase in the ANS activity observed during the Task through the SDNN and nLF features, both indicators of the ANS functioning, as previously demonstrated [53]. Indeed, the parasympathetic nervous system (PNS) contribution decreased during the odorous stimulation, as demonstrated by the lowering of both pNNx and nHF. In addition, LF/HF, in some instances believed to be a sort of “SNS/PNS ratio” activation feature, followed the same trend as the HR (although not significantly), corroborating the previous findings. The correlation between ANS features during the task and the odor pleasantness revealed that the significant SNS activation noticed during the Task was related to a lower pleasantness for the odorants perceived. Specifically, the lower the average pleasantness a subject reported for the odors smelled, the higher the SNS activation during the Task for this subject, similarly to the findings of Bensafi et al. [33]. Indeed, it has already been demonstrated that SNS activation, and particularly the HR, was increased in the context of rejection, possibly due to the presentation of unpleasant odors [33].
On the other hand, an increased PNS activity, and an SNS decrease, was seen to occur when presenting pleasant odors, such as Ylang-Ylang [54] or citrus fruit-yuzu [55]. Therefore, the results obtained in the present work somewhat confirm the literature evidence about the autonomic activation mainly depending on the pleasantness of the odors administered.
As expected, the GSR signal was also increased during the Task with respect to the Baseline. This is coherent with several studies on this specific topic [29,33], and in particular with evidence arising in the case of the presentation of negatively judged odors [56], demonstrating an increased galvanic skin response to olfactory stimuli. However, in the present study, the GSR values continued to rise even after Task completion, possibly demonstrating a different dynamic trend with respect to the ECG features previously discussed, or reflecting a lower sensitivity to olfactory-driven changes for the GSR signal with respect to the ECG. In fact, already many years ago, it was demonstrated that the galvanic skin response is normally associated with the concentration of an odorant and that weak odor concentrations evoke low or negligible skin responses [57]. Despite the odors presented here being at concentrations above the physiological threshold of human beings, they were not perceived as particularly strong by the volunteers, and this might have caused this relatively limited response, possibly at a lower magnitude than the one produced by the overall annoyance brought by the test duration. This hypothesis is fostered by the relatively low skin responses to the single odors, ranging up to 0.07 µS, a value lower than reported, for example, in the work by Bensafi and colleagues [33].
On the other hand, the questionnaires administered revealed some interesting trends between the parameters studied, even if, after the FDR correction, many of them did not result in being significant. Specifically, a good knowledge of odors (odor familiarity) prior to the test administration seemed to significantly improve the olfactory identification test performances. This statement might be intuitive but it was also demonstrated in recent literature dealing with olfaction [58,59], highlighting the importance of developing dedicated smell tests, especially for children and adolescents. Among cognitively typical young people, the awareness of one’s own olfactory functionality is a good predictor for an effective good functioning of the olfactory system, as marginally displayed in our research. This characteristic is normally present in healthy subjects, like our volunteers were, but is known to be lacking in people with different neurological conditions, including mild cognitive impairment, as well as Alzheimer’s and Parkinson’s Diseases [60,61,62].
Another important trend observed was between odor familiarity and odor pleasantness. In particular, odors judged as more pleasant were also more familiar for the subjects enrolled in this study. However, the consequentiality between those two characteristics is still debated. Indeed, while Delplanque and colleagues [63] hypothesized that the initial pleasantness for a given stimulus appears to modulate the impact of repeated exposures on an individual’s attitude towards that compound, Knaapila et al. [11] suggest that knowledge acquisition through repetitive exposure to an odor might increase its pleasantness. Therefore, given the numerous evidences describing the existence of this correlation, such a relationship should be more properly faced in future, tailored investigations. The clarification of the methods for which those two odor dimensions interacted with each other could also have significant applications in a clinical setting (i.e., for the treatment of burdensome eating disturbances).
Finally, a negative trend was seen between the self-judgement of olfactory function (SSR) and the food neophobia scale (FNS) score. In this respect, people with lower neophobia (i.e., people who are more open to trying new food-related stimuli) appeared to judge their olfactory function as increased with respect to people with higher FNS scores. In turn, this might be related to an improved odor identification ability, as mentioned above, though a direct relationship between FNS and odor identification score was not found in our study, requiring further dedicated investigation.
Several limitations should be acknowledged for the present study. At first, the protocol was conducted on a small sample size, which is quite usual for a pilot research, though it does not allow particularly reliable conclusions to be drawn. In particular, the quite weak correlation values, which in most cases did not survive the strict FDR post-hoc correction, are probably due to the limited sample size, thus they should be confirmed on larger cohorts. In addition, given the rationale of the study, a control condition is missing. Indeed, only food odors (except lavender, which was used as a distractor) were used, thus the ANS responses to food odors were not compared with those to non-food odors, which will be the object of a future investigation. Finally, we decided to not analyze the response to the single odors in terms of ECG-related features, representing a further limitation of this pilot. This choice was due to the fact that the algorithms we used for this evaluation require longer periods of time to provide reliable results in both time- and (especially) frequency-domain features.
5. Conclusions
The pilot study described here aimed to investigate, in a small group of healthy volunteers, the activation of the ANS in response to olfactory, food-related stimuli with respect to odor familiarity, pleasantness, and neophobia scores.
Despite the limitations stated above, the results obtained mostly confirmed the literature evidence, and evaluated for the first time the link between odor pleasantness, odor familiarity, and food neophobia with the assessment of ANS functioning. In light of the good reliability of the methodology employed, further studies with this approach can be used for several applications. In the market research, such an approach could be used to guide the selection of food odor products on the basis of the unconscious response of the consumers. In a clinical perspective, the proposed approach could indeed be used to study the ANS reaction to pleasant and unpleasant odor stimuli in conditions in which an abnormal olfactory function has been observed [64,65,66], like neurodegenerative diseases or metabolic disorders. In addition, as previously mentioned, the consequentiality between odor familiarity and odor pleasantness should be carefully assessed, and its investigation could open new, potentially disrupting paths towards the clinical treatment of eating disorders or neurodevelopmental disorders.
Importantly, the use of wearable device, allow to record autonomic activity in an ecological contest. This new prospect has made physiological research accessible also outside the laboratory and allowed, for the first time, to study the autonomic response also in vulnerable subjects like people with mental health problems [67] or young children [46].
Author Contributions
Conceptualization, A.T. and L.B.; Data curation, J.D.M. and M.B.M.; Formal analysis, J.D.M., M.B.M. and A.T.; Investigation, A.T., J.D.M., M.B.M. and R.C.; Methodology, A.T. and L.B.; Software, F.S. and A.P.P.; Supervision, A.T. and R.C.; Writing—original draft, A.T., L.B; Writing—review & editing, A.T., L.B., F.S., A.P.P. and R.C.
Funding
This research received no external funding.
Conflicts of Interest
The authors declare no conflict of interest.
References
- Hoover, K.C. Smell with inspiration. The evolutionary significance of olfaction. Am. J. Phys. Anthropol. 2010, 53, 63–74. [Google Scholar] [CrossRef] [PubMed]
- Klajner, F.; Herman, C.P.; Polivy, J.; Chhabra, R. Human obesity, dieting, and anticipatory salivation to food. Physiol. Behav. 1981, 27, 195–198. [Google Scholar] [CrossRef]
- Legoff, D.B.; Spigelman, M.N. Salivary response to olfactory food stimuli as a function of dietary restraint and body-weight. Appetite 1987, 8, 29–35. [Google Scholar] [CrossRef]
- Rogers, P.J.; Hill, A.J. Breakdown of dietary restraint following mere exposure to food stimuli. Interrelationships between restraint, hunger, salivation, and food intake. Addict. Behav. 1989, 14, 387–397. [Google Scholar] [CrossRef]
- Bensafi, M.; Rouby, C.; Farget, V.; Bertrand, B.; Vigouroux, M.; Holley, A. Psychophysiological correlates of affects in human olfaction. Neurophysiol. Clin. 2002, 32, 326–332. [Google Scholar] [CrossRef]
- Jacquier, C.; Bonthoux, F.; Baciu, M.; Ruffieux, B. Improving the effectiveness of nutritional information policies. Assessment of unconscious pleasure mechanisms involved in food-choice decisions. Nutr. Rev. 2012, 70, 118–131. [Google Scholar] [CrossRef]
- Rodgers, R.F.; Paxton, S.J.; McLean, S.A.; Campbell, K.J.; Wertheim, E.H.; Skouteris, H.; Gibbons, K. Maternal negative affect is associated with emotional feeding practices and emotional eating in young children. Appetite 2014, 80, 242–247. [Google Scholar] [CrossRef]
- Stevenson, R.J.; Mahmut, M. Using response consistency to probe olfactory knowledge. Chem. Senses 2013, 38, 237–249. [Google Scholar] [CrossRef]
- Trellakis, S.; Tagay, S.; Fischer, C.; Rydleuskaya, A.; Scherag, A.; Bruderek, K.; Schlegl, S.; Greve, J.; Canbay, A.E.; Lang, S.; et al. Ghrelin, leptin and adiponectin as possible predictors of the hedonic value of odors. Regul. Pept. 2011, 167, 112–117. [Google Scholar] [CrossRef]
- Knaapila, A.; Tuorila, H.; Silventoinen, K.; Wright, M.J.; Kyvik, K.O.; Keskitalo, K.; Hansen, J.; Kaprio, J.; Perola, M. Environmental effects exceed genetic effects on perceived intensity and pleasantness of several odors: A three-population twin study. Behav. Genet. 2008, 38, 484–492. [Google Scholar] [CrossRef]
- Knaapila, A.; Laaksonen, O.; Virtanen, M.; Yang, B.; Lagström, H.; Sandell, M. Pleasantness, familiarity, and identification of spice odors are interrelated and enhanced by consumption of herbs and food neophilia. Appetite 2017, 109, 190–200. [Google Scholar] [CrossRef]
- Bensafi, M.; Pierson, A.; Rouby, C. Modulation of visual event-related potentials by emotional olfactory stimuli. Clin. Neurophysiol. 2002, 32, 335–342. [Google Scholar] [CrossRef]
- Masago, R.; Shimomura, Y.; Iwanaga, K.; Katsuura, T. The effects of hedonic properties of odors and attentional modulation on the olfactory eventrelated potentials. J. Physiol. Anthropol. Appl. Hum. Sci. 2001, 20, 7–13. [Google Scholar] [CrossRef]
- Anderson, A.K.; Christoff, K.; Stappen, I.; Panitz, D.; Ghahremani, D.G.; Glover, G.; Gabrieli, J.D.; Sobel, N. Dissociated neural representations of intensity and valence in human olfaction. Nat. Neurosci. 2003, 6, 196–202. [Google Scholar] [CrossRef]
- Grabenhorst, F.; Rolls, E.T.; Margot, C.; da Silva, M.A.; Velazco, M.I. How pleasant and unpleasant stimuli combine in different brain regions: Odor mixtures. J. Neurosci. 2007, 27, 13532–13540. [Google Scholar] [CrossRef]
- Delplanque, S.; Grandjean, D.; Chrea, C.; Aymard, L.; Cayeux, I.; Le Calve, B.; Velazco, M.I.; Scherer, K.R.; Sander, D. Emotional processing of odors: Evidence for a nonlinear relation between pleasantness and familiarity evaluations. Chem. Senses 2008, 33, 469–479. [Google Scholar] [CrossRef]
- Ferdenzi, C.; Roberts, S.C.; Schirmer, A.; Delplanque, S.; Cekic, S.; Porcherot, C.; Cayeux, I.; Sander, D.; Grandjean, D. Variability of affective responses to odors: Culture, gender, and olfactory knowledge. Chem. Senses 2013, 38, 175–186. [Google Scholar] [CrossRef]
- Schloss, K.B.; Goldberger, C.S.; Palmer, S.E.; Levitan, C.A. What’s that smell? An ecological approach to understanding preferences for familiar odors. Perception 2015, 44, 23–38. [Google Scholar] [CrossRef]
- Boesveldt, S.; Frasnelli, J.; Gordon, A.R.; Lundström, J.N. The fish is bad: Negative food odors elicit faster and more accurate reactions than other odors. Biol. Psychol. 2010, 84, 313–317. [Google Scholar] [CrossRef]
- Demattè, M.L.; Endrizzi, I.; Biasioli, F.; Corollaro, M.L.; Pojer, N.; Zampini, M.; Aprea, E.; Gasperi, F. Food neophobia and its relation with olfactory ability in common odour identification. Appetite 2013, 68, 112–117. [Google Scholar] [CrossRef]
- Pliner, P.; Hobden, K. Development of a scale to measure the trait of food neophobia in humans. Appetite 1992, 19, 105–120. [Google Scholar] [CrossRef]
- Wildes, J.E.; Zucker, N.L.; Marcus, M.D. Picky eating in adults: Results of a web-based survey. Int. J. Eat. Disord. 2012, 45, 575–582. [Google Scholar] [CrossRef]
- Frank, R.A.; van der Klaauw, N.J. The contribution of chemosensory factors to individual differences in reported food preferences. Appetite 1994, 22, 101–123. [Google Scholar] [CrossRef]
- Wansink, B. Environmental factors that increase the food intake and consumption volume of unknowing consumers. Annu. Rev. Nutr. 2004, 24, 455–479. [Google Scholar] [CrossRef] [PubMed]
- Greenwald, A. Supplemental material for understanding and using the implicit association test: III. Meta-analysis of predictive validity. J. Personal. Soc. Psychol. 2009, 97, 17–41. [Google Scholar] [CrossRef] [PubMed]
- Billman, G.E. Heart rate variability—A historical perspective. Front. Physiol. 2011, 2, 86. [Google Scholar] [CrossRef]
- Kuroda, K.; Inoue, N.; Ito, Y.; Kubota, K.; Sugimoto, A.; Kakuda, T.; Fushiki, T. Sedative effects of the jasmine tea odor and (R)-(−)-linalool, one of its major odor components, on autonomic nerve activity and mood states. Eur. J. Appl. Physiol. 2005, 95, 107–114. [Google Scholar] [CrossRef]
- Robin, O.; Alaoui-Ismaïli, O.; Dittmar, A.; Vernet-Maury, E. Emotional responses evoked by dental odors: An evaluation from autonomic parameters. J. Dent. Res. 1998, 77, 1638–1646. [Google Scholar] [CrossRef]
- Robin, O.; Alaoui-Ismaïli, O.; Dittmar, A.; Vernet-Maury, E. Basic emotions evoked by eugenol odor differ according to the dental experience. A neurovegetative analysis. Chem. Senses 1999, 24, 327–335. [Google Scholar] [CrossRef]
- Crawford, C. Marketing research and the new product failure rate. J. Market. 1977, 41, 55–61. [Google Scholar] [CrossRef]
- Riera, C.E.; Tsaousidou, E.; Halloran, J.; Follett, P.; Hahn, O.; Pereira, M.M.; Ruud, L.E.; Alber, J.; Tharp, K.; Anderson, C.M.; et al. The Sense of Smell Impacts Metabolic Health and Obesity. Cell Metab. 2017, 26, 198–211. [Google Scholar] [CrossRef] [PubMed]
- Bonfils, P.; Avan, P.; Faulcon, P.; Malinvaud, D. Distorted odorant perception: Analysis of a series of 56 patients with parosmia. Arch. Otolaryngol. Head Neck Surg. 2005, 131, 107–112. [Google Scholar] [CrossRef] [PubMed]
- Bensafi, M.; Rouby, C.; Farget, V.; Bertrand, B.; Vigouroux, M.; Holley, A. Autonomic nervous system responses to odours: The role of pleasantness and arousal. Chem. Senses 2002, 27, 703–709. [Google Scholar] [CrossRef] [PubMed]
- Raudenbush, B.; Capiola, A. Physiological responses of food neophobics and food neophilics to food and non-food stimuli. Appetite 2012, 58, 1106–1108. [Google Scholar] [CrossRef] [PubMed]
- He, W.; Boesveldt, S.; de Graaf, C.; de Wijk, R.A. Dynamics of autonomic nervous system responses and facial expressions to odors. Front. Psychol. 2014, 5, 110. [Google Scholar] [CrossRef] [PubMed]
- He, W.; de Wijk, R.A.; de Graaf, C.; Boesveldt, S. Implicit and Explicit Measurements of Affective Responses to Food Odors. Chem. Senses 2016, 41, 661–668. [Google Scholar] [CrossRef]
- Tonacci, A.; Baldus, G.; Corda, D.; Piccaluga, E.; Andreassi, M.; Cremonesi, A.; Guagliumi, G.; Picano, E. Olfactory non-cancer effects of exposure to ionizing radiation in staff working in the cardiac catheterization laboratory. Int. J. Cardiol. 2014, 171, 461–463. [Google Scholar] [CrossRef]
- Tonacci, A.; Mrakic-Sposta, S.; Ujka, K.; Sansone, F.; Ferrisi, A.; Giardini, G.; Conte, R.; Pratali, L. Neurosensory and Cognitive Modifications in Europe’s Toughest RandoRaid Competition: The Transpyrénéa Extreme Study. Front. Physiol. 2017, 8, 201. [Google Scholar] [CrossRef]
- Lötsch, J.; Lange, C.; Hummel, T. A simple and reliable method for clinical assessment of odor thresholds. Chem. Senses 2004, 29, 311–317. [Google Scholar] [CrossRef]
- Knaapila, A.; Tuorila, H.; Kyvik, K.O.; Wright, M.J.; Keskitalo, K.; Hansen, J.; Kaprio, J.; Perola, M.; Silventoinen, K. Self-ratings of olfactory function reflect odor annoyance rather than olfactory acuity. Laryngoscope 2008, 118, 2212–2217. [Google Scholar] [CrossRef]
- Hummel, T.; Kobal, G.; Gudziol, H.; Mackay-Sim, A. Normative data for the “Sniffin’ Sticks” including tests of odor identification, odor discrimination, and olfactory thresholds: An upgrade based on a group of more than 3000 subjects. Eur. Arch. Otorhinolaryngol. 2007, 264, 237–243. [Google Scholar] [CrossRef] [PubMed]
- Sorokowska, A.; Albrecht, E.; Haehner, A.; Hummel, T. Extended version of the “Sniffin’ Sticks” identification test: Test-retest reliability and validity. J. Neurosci. Methods 2015, 243, 111–114. [Google Scholar] [CrossRef] [PubMed]
- Pan, J.; Tompkins, W.J. A real-time QRS detection algorithm. IEEE Trans. Biomed. Eng. 1985, 32, 230–236. [Google Scholar] [CrossRef] [PubMed]
- Billeci, L.; Tartarisco, G.; Brunori, E.; Crifaci, G.; Scardigli, S.; Balocchi, R.; Pioggia, G.; Maestro, S.; Morales, M.A. The role of wearable sensors and wireless technologies for the assessment of heart rate variability in anorexia nervosa. Eat. Weight Disord. 2015, 20, 23–31. [Google Scholar] [CrossRef] [PubMed]
- Di Palma, S.; Tonacci, A.; Narzisi, A.; Domenici, C.; Pioggia, G.; Muratori, F.; Billeci, L.; MICHELANGELO Study Group. Monitoring of autonomic response to sociocognitive tasks during treatment in children with Autism Spectrum Disorders by wearable technologies: A feasibility study. Comput. Biol. Med. 2017, 85, 143–152. [Google Scholar] [CrossRef]
- Billeci, L.; Tonacci, A.; Narzisi, A.; Manigrasso, Z.; Varanini, M.; Fulceri, F.; Lattarulo, C.; Calderoni, S.; Muratori, F. Heart Rate Variability during a Joint Attention Task in Toddlers with Autism Spectrum Disorders. Front. Physiol. 2018, 9, 467. [Google Scholar] [CrossRef]
- Tonacci, A.; Billeci, L.; Sansone, F.; Masci, A.; Pala, A.P.; Domenici, C.; Conte, R. An Innovative, Unobtrusive Approach to Investigate Smartphone Interaction in Nonaddicted Subjects Based on Wearable Sensors: A Pilot Study. Medicina 2019, 55, 37. [Google Scholar] [CrossRef]
- Welch, P.D. The use of Fast Fourier Transform for the estimation of power spectra: A method based on time averaging over short, modified periodograms. IEEE Trans. Audio Electroacoust. 1967, 15, 70–73. [Google Scholar] [CrossRef]
- Benedek, M.; Kaernbach, C. A continuous measure of phasic electrodermal activity. J. Neurosci. Methods 2010, 190, 80–91. [Google Scholar] [CrossRef]
- Wieser, M.J.; Pauli, P.; Alpers, G.W.; Mühlberger, A. Is eye to eye contact really threatening and avoided in social anxiety?—An eye-tracking and psychophysiology study. J. Anxiety Disord. 2009, 23, 93–103. [Google Scholar] [CrossRef]
- Shapiro, S.S.; Wilk, M.B. An analysis of variance test for normality (complete samples). Biometrika 1965, 52, 591–611. [Google Scholar] [CrossRef]
- Tonacci, A.; Sansone, F.; Pala, A.P.; Centrone, A.; Napoli, F.; Domenici, C.; Conte, R. Effect of Feeding on Neurovegetative Response to Olfactory Stimuli. In Proceedings of the 2017 E-Health and Bioengineering Conference, EHB 2017, Sinaia, Romania, 21–24 June 2017; pp. 9–12. [Google Scholar]
- Shaffer, F.; Ginsberg, J.P. An Overview of Heart Rate Variability Metrics and Norms. Front. Public Health 2017, 5, 258. [Google Scholar] [CrossRef] [PubMed]
- Jung, D.J.; Cha, J.Y.; Kim, S.E.; Ko, I.G.; Jee, Y.S. Effects of Ylang-Ylang aroma on blood pressure and heart rate in healthy men. J. Exerc. Rehabil. 2013, 9, 250–255. [Google Scholar] [CrossRef] [PubMed]
- Matsumoto, T.; Kimura, T.; Hayashi, T. Aromatic effects of a Japanese citrus fruit-yuzu (Citrus junos Sieb. ex Tanaka)-on psychoemotional states and autonomic nervous system activity during the menstrual cycle: A single-blind randomized controlled crossover study. Biopsychosoc. Med. 2016, 10, 11. [Google Scholar] [CrossRef]
- Kolbeneva, M.G.; Alexandrov, Y.I. Mental Reactivation and Pleasantness Judgment of Experience Related to Vision, Hearing, Skin Sensations, Taste and Olfaction. PLoS ONE 2016, 11, e0159036. [Google Scholar] [CrossRef]
- Uryvaev, Y.V.; Golubeva, N.K.; Nechaev, A.M. Differences in human involuntary reactions to perceptible and imperceptible odors. Dokl. Akad. Nauk SSSR 1986, 290, 501–504. [Google Scholar]
- Sorokowska, A.; Schriever, V.A.; Gudziol, V.; Hummel, C.; Hähner, A.; Iannilli, E.; Sinding, C.; Aziz, M.; Seo, H.S.; Negoias, S.; et al. Changes of olfactory abilities in relation to age: Odor identification in more than 1400 people aged 4 to 80 years. Eur. Arch. Otorhinolaryngol. 2015, 272, 1937–1944. [Google Scholar] [CrossRef]
- Fjaeldstad, A.; Sundbøll, J.; Niklassen, A.; Ovesen, T. Odor Familiarity and Identification Abilities in Adolescents. Chem. Senses 2017, 42, 239–246. [Google Scholar] [CrossRef]
- Bahar-Fuchs, A.; Moss, S.; Rowe, C.; Savage, G. Awareness of olfactory deficits in healthy aging, amnestic mild cognitive impairment and Alzheimer’s disease. Int. Psychogeriatr. 2011, 23, 1097–1106. [Google Scholar] [CrossRef]
- Kawasaki, I.; Baba, T.; Takeda, A.; Mori, E. Loss of awareness of hyposmia is associated with mild cognitive impairment in Parkinson’s disease. Parkinsonism Relat. Disord. 2016, 22, 74–79. [Google Scholar] [CrossRef]
- White, T.L.; Sadikot, A.F.; Djordjevic, J. Metacognitive knowledge of olfactory dysfunction in Parkinson’s disease. Brain Cognit. 2016, 104, 1–6. [Google Scholar] [CrossRef] [PubMed]
- Delplanque, S.; Coppin, G.; Bloesch, L.; Cayeux, I.; Sander, D. The mere exposure effect depends on an odor’s initial pleasantness. Front. Psychol. 2015, 6, 911. [Google Scholar] [CrossRef] [PubMed]
- Tonacci, A.; Billeci, L.; Tartarisco, G.; Ruta, L.; Muratori, F.; Pioggia, G.; Gangemi, S. Olfaction in autism spectrum disorders: A systematic review. Child Neuropsychol. 2017, 23, 1–25. [Google Scholar] [CrossRef] [PubMed]
- Muratori, F.; Tonacci, A.; Billeci, L.; Catalucci, T.; Igliozzi, R.; Calderoni, S.; Narzisi, A. Olfactory processing in male children with autism: Atypical odor threshold and Identification. J. Autism Dev. Disord. 2017, 47, 3243–3251. [Google Scholar] [CrossRef]
- Tonacci, A.; Calderoni, S.; Billeci, L.; Maestro, S.; Fantozzi, P.; Ciuccoli, F.; Morales, M.A.; Narzisi, A.; Muratori, F. Autistic traits impact on olfactory processing in adolescent girls with Anorexia Nervosa restricting type. Psychiatry Res. 2019, 274, 20–26. [Google Scholar] [CrossRef]
- Okruszek, L.; Dolan, K.; Lawrence, M.; Cella, M. The beat of social cognition: Exploring the role of Heart Rate Variability as marker of mentalizing abilities. Soc. Neurosci. 2017, 12, 489–493. [Google Scholar] [CrossRef]


© 2019 by the authors. Licensee MDPI, Basel, Switzerland. This article is an open access article distributed under the terms and conditions of the Creative Commons Attribution (CC BY) license (http://creativecommons.org/licenses/by/4.0/).