1. Introduction
In the last two decades, innovative results have been achieved in the field of metamaterials, namely, artificial structures that exhibit electromagnetic, acoustical, and optical properties that are generally not found in nature. From the moment of the first experimental verification of the single negative metamaterials [
1,
2], the unique properties based on negative permittivity, permeability or index of refraction have found a place in a number of novel devices and applications [
3,
4,
5,
6,
7,
8]. Special attention has been given to double-negative or left-handed (LH) media, which at the same time show negative values of permittivity and permeability in a certain frequency range.
Considerable attention has been focused on the implementation of metamaterials in sensor designs for material characterization applications, as well as on their integration with microfluidic devices [
9,
10]. Although a number of sensor solutions have been proposed so far, all proposed designs operate according to the resonant effect that relays resonant frequency changes. In this paper, we propose a metamaterials-based sensor that utilizes a transmission line (TL) concept and operates at one specific frequency. The special case is concerning 1D metamaterials in which the fundamental electromagnetic properties of the left-handed media can be modelled using a conventional transmission line (TL) theory [
11]. The TL approach, which is based on the composite left–right handed (CLRH) line, provides good insight into physical phenomena. The general CLRH model consists of an ideal LH section that can be modelled as the combination of a per-unit length series capacitance and a per-unit length shunt inductance, and a parasitic RH section (i.e., a parasitic per-unit length series inductance and a per-unit length shunt capacitance). The CLRH line has two propagation bands, one left-handed and one right-handed. The group velocity and phase velocity of CLRH calculated from the dispersion diagram in [
11] show that group and phase velocity are parallel in the RH band and antiparallel in the case of the LH one. Therefore, phase advance happens in the LH frequency range, while phase delay arises in the RH frequency range. The first experimental verification of the 1D concept of CLRH is demonstrated using microstrip line configuration in [
11]. The phase response in the case of the microstrip CLRH is nonlinearly dependent on the propagation constant in the LH band, and it is strongly influenced by substrate properties (i.e., its permittivity and permeability). This concept was utilized in the design of the novel microstrip microfluidic sensor that operates according to the phase shift measurement.
In this paper, we propose a novel metamaterial-based microfluidic sensor that permits the monitoring of the fluid properties inside the microfluidic reservoir embedded between the CLRH TL line and the ground plane. In the case of the microstrip configuration, the properties of the dielectric substrate have a strong influence on the phase response. The operating principle is based on the transmission phase shift measurement of the two signals, the referent one guided through the conventional microstrip RH line section and the signal guided through the CLRH line. The TL method is one of the commonly used methods appropriate for material characterization in a wider frequency band. Therefore, a number of TL configurations have been proposed for the characterization of different hard solid, liquid or powder materials [
12,
13,
14,
15,
16,
17,
18,
19]. The TL method comprises measurements of both reflection and transmission characteristics and their combination, and can be used for characterization of permittivity as well as permeability. One of the relatively fast and simple TL methods for the determination of dielectric properties of material is a method based on the measurement of the phase shift of the transmitted signal. Compared with the other TL methods, phase shift methods are less sensitive to noise [
19,
20], which permits characterization at a single frequency and simplifies the development of supporting electronics and easy integration with the sensor element, as well as allowing the fabrication of low-cost in-field sensing devices. For that reason, TL methods have found application in different sensor designs such as soil moisture sensors [
21], microfluidic sensors for detection of fluid mixture efficiency [
22], and so on.
The proposed method based on phase shifting will be explained in detail using our CLRH microstrip microfluidic sensor configuration as an example. The permittivity of the fluid inside the microfluidic channel will be correlated by measuring the phase shift of the signal that passes thought the CLRH sensing section. A detailed description is provided. of the complete measurement system, including the design of the microstrip Wilkinson power divider, which splits the signal between the conventional-referent section and the CLRH section, microfluidic reservoirs, and a detection circuit for the measurement of the phase difference. The proposed microfluidic sensor has been manufactured using hybrid microfluidic fabrication technology that combines a laser micromachining process, the xurography technique, and lamination, [
23]. The detection electronic circuit has been developed using printed circuit board (PCB) technology. The sensor’s performances have been evaluated based on the measurement of different fluids inside the microfluidic channel. To demonstrate applicability, the proposed sensor has been used to evaluate the biomass of the MRC-5 fibroblast cells grown in the microfluidic bioreactor.
2. Materials and Methods
2.1. Materials
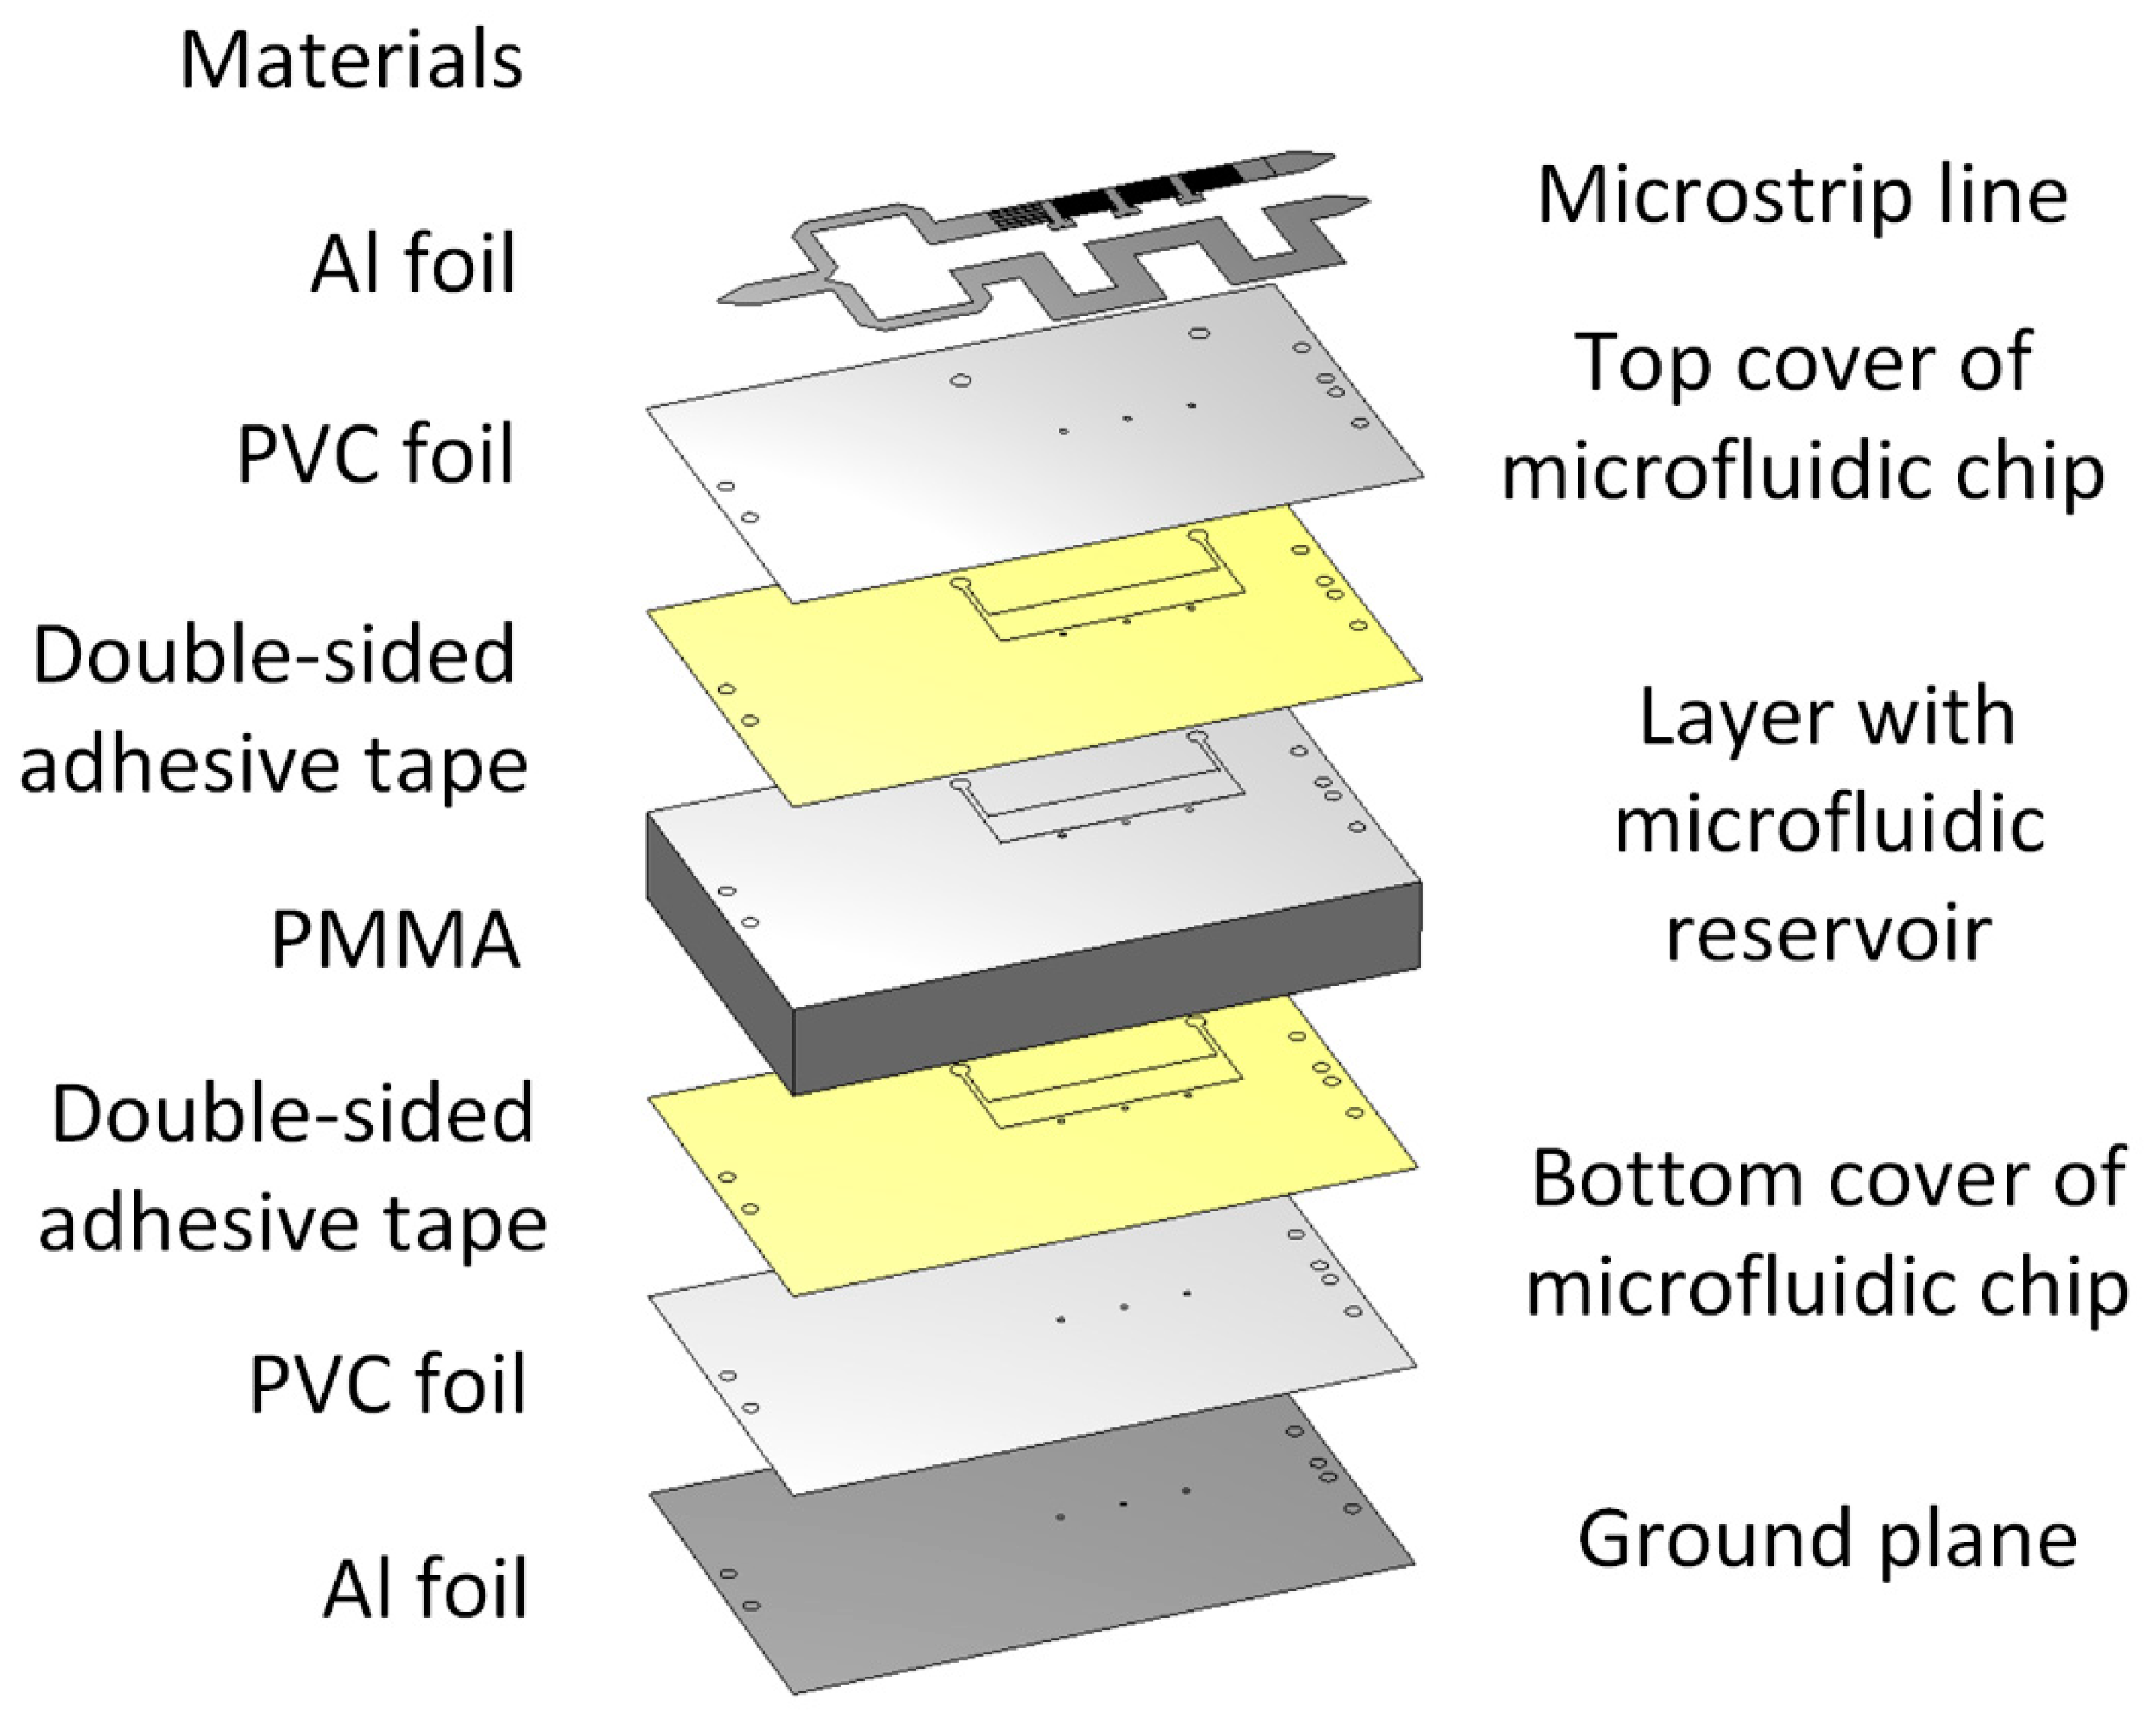
The proposed microfluidic chip was manufactured using an 80-µm thick polyvinyl chloride (PVC) lamination foil (MBL 80MIC Belgrade, Serbia) and a 2-mm thick poly(methyl methacrylate) (PMMA). Double-sided 3M 9088 tape was used for microfluidic chip bounding. Conductive aluminum foil 3M 3302 was used for the realization of the microchip TL lines and the sensor ground plane. RS PRO silver conductive adhesive epoxy was used for mounting vias, resistor, and surface mount assembly (SMA) connectors.
Deionized water (Grade 2 by ISO 3696 (1987)), isopropyl (99.7%, Sigma-Aldrich, Saint Louis, MO, USA), methanol (99.8%, Sigma-Aldrich), ethanol (99.8%, Sigma-Aldrich), and sunflower oil (Vital, Vrbas, Serbia) were used as fluids in the microfluidic channel.
The cell line used in this study for cultivation in the microfluidic bioreactor was MRC-5 (human fibroblasts, American Type Culture Collection CCL 171). The cells were grown in Dulbecco’s modified Eagle’s medium (DMEM) with 4.5% of glucose, supplemented with 10% of fetal calf serum (Sigma-Aldrich) and antibiotic/antimycotic solution (Sigma-Aldrich). The single cell suspension was obtained using 0.25% trypsin in EDTA (Serva). Cells were harvested and counted by 0.1% trypan blue exclusion. The viability of cells used in the assay was over 90%.
The phase detector module for phase shift difference measurement was realized using integrated circuit AD8302 Analogue Devices on the PCB board with supporting electronic components according to the manufacturer’s recommendation [
24].
2.2. Equipment and Small Tools
PMMA layer was cut with a CO2 Gravograph LS1000XP laser. A plotter cutter (CE6000-60 PLUS, Graphtec America, Inc., Irvine, CA, USA) with a 45 cutting blade (CB09U) and cutting mat (12” Silhouette Cameo Cutting Mat, Sacramento, USA) was used for carving inlets, outlets, and edges of PVC layers for microfluidic chips. Bondage between PVC and PMMA was performed through lamination with the uniaxial press (Carver 3895CEB, Wabash, USA). Aluminum tapes were cut with a Rofin-Sinar Power Line D-100 laser (Germany).
A vector network analyzer (VNA) E5071C Agilent Technology was used to measure the complex S-parameters (scattering parameters) and generate an input signal for phase shift measurement. An MSP430FR6989 LaunchPad Development Kit (Texas Instruments, USA) was used for the measurement of the output voltage.
2.3. Sensor Fabrication
The proposed microfluidic chip was composed of five dielectric layers. The top and bottom layers were manufactured using PVC foils, the middle one was realized in PMMA, and the two bonding layers between them were made using double-sided adhesive tape; two conductive layers (a microstrip line on the top and a ground plane from the bottom side) were realized using aluminum sticky foil, as shown in
Figure 1. In the first step, the CO
2 laser was used for cutting the middle chip layer with the microfluidic reservoir in the PMMA using a power of 60 W and a feed speed of 20 mm/s. Top and bottom PVC covers with the inlet and outlet of the microfluidic channels were cut using plotter cutter, as is the standard xurography technique. The cutting speed was set to 30 cm/s, while cutting force was set to 19 (range 1–38).
A multilayered chip was created by bonding PVC layers from the top and bottom side on PMMA using double-sided 3D adhesive tape in the uniaxial press with a pressure of 400 kg and a temperature of 70 °C for 1 min. Next, the conductive aluminum tapes were cut with the Nd:YAG laser with a current of 27.6 mA, a frequency of 10 kHz, and a cutting speed of 30 mm/s, and assembled on the top and bottom side of the microfluidic chip. Finally, the vias that connected inductive stubs and the ground plane, SMA connectors, and 100 Ω resistor for the Wilkinson power divider, were mounted using RS PRO silver conductive adhesive epoxy.
3. Configuration of the Proposed Sensor
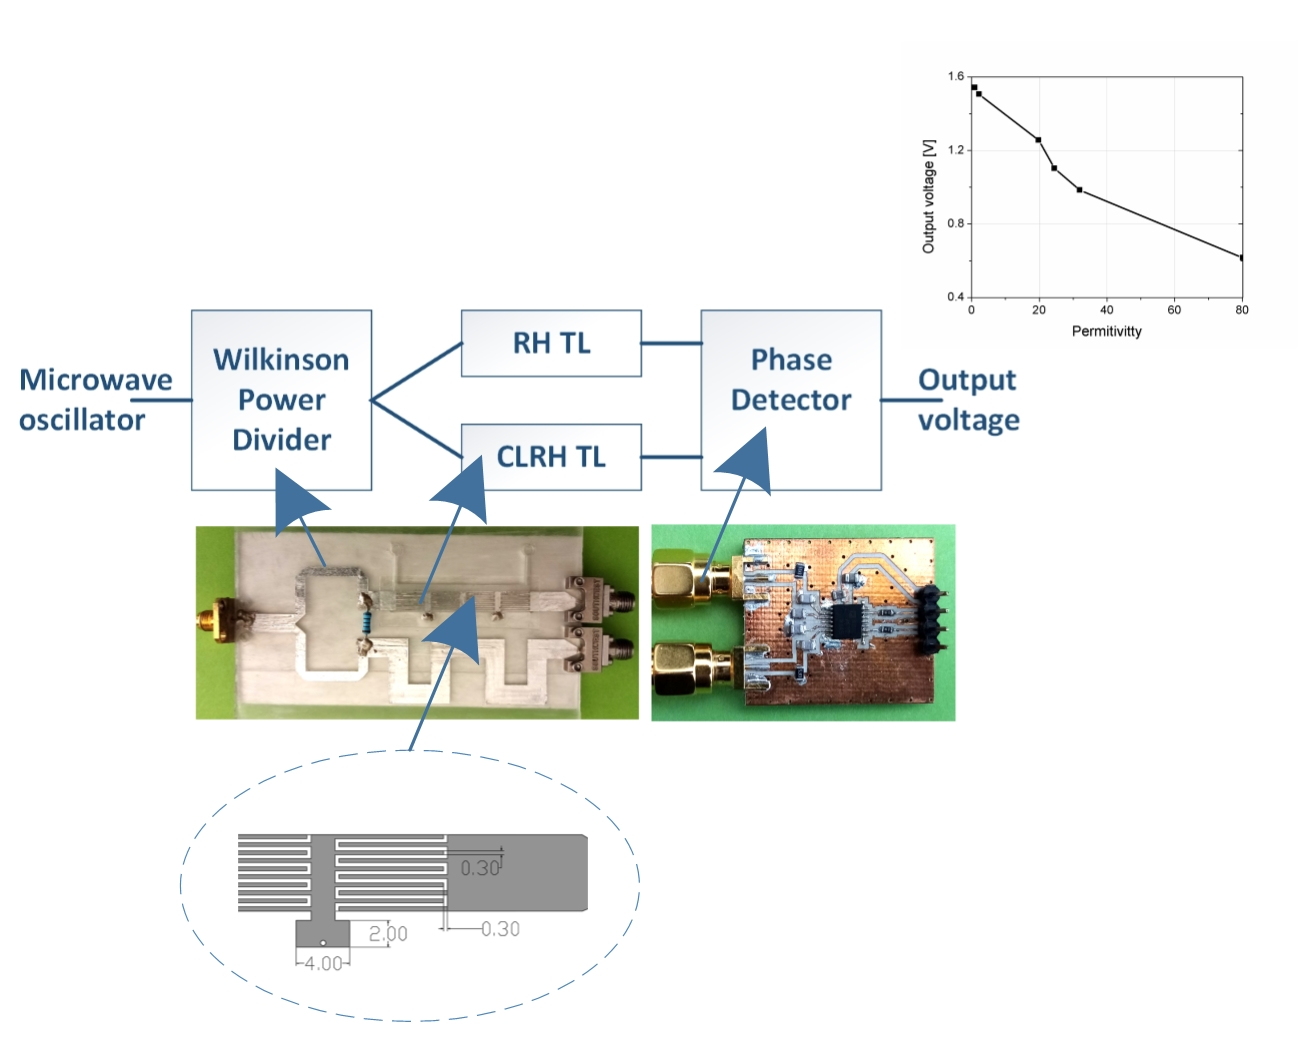
The block diagram of the proposed sensor with supporting electronics is shown in
Figure 2. It consists of a Wilkinson power divider that splits the input signal from the microwave oscillator between two TLs (the conventional RH TL and the CLRH TL), and a phase detector that converts the phase shift into the output voltage. The sinusoidal signal generated by the VNA is divided by the Wilkinson divider into measurement and referent signals. The measurement signal propagates along the CLRH TL section where the different phase shifts can be detected at the output for different fluids inside the microfluidic channel as a result of changes in the effective permittivity of the medium. The referent signal from the output of the RH TL and the signal from the CLRH sensor are fed into the input of the phase detector, which compares their phase responses. The voltage on the output of the phase detector is proportional to the phase shift of the input signals and is in relation to a dielectric constant in the microfluidic reservoir, as will be discussed below.
The propagation signal propagates thought two sections: the RH TL and the CLRH TL, shown in
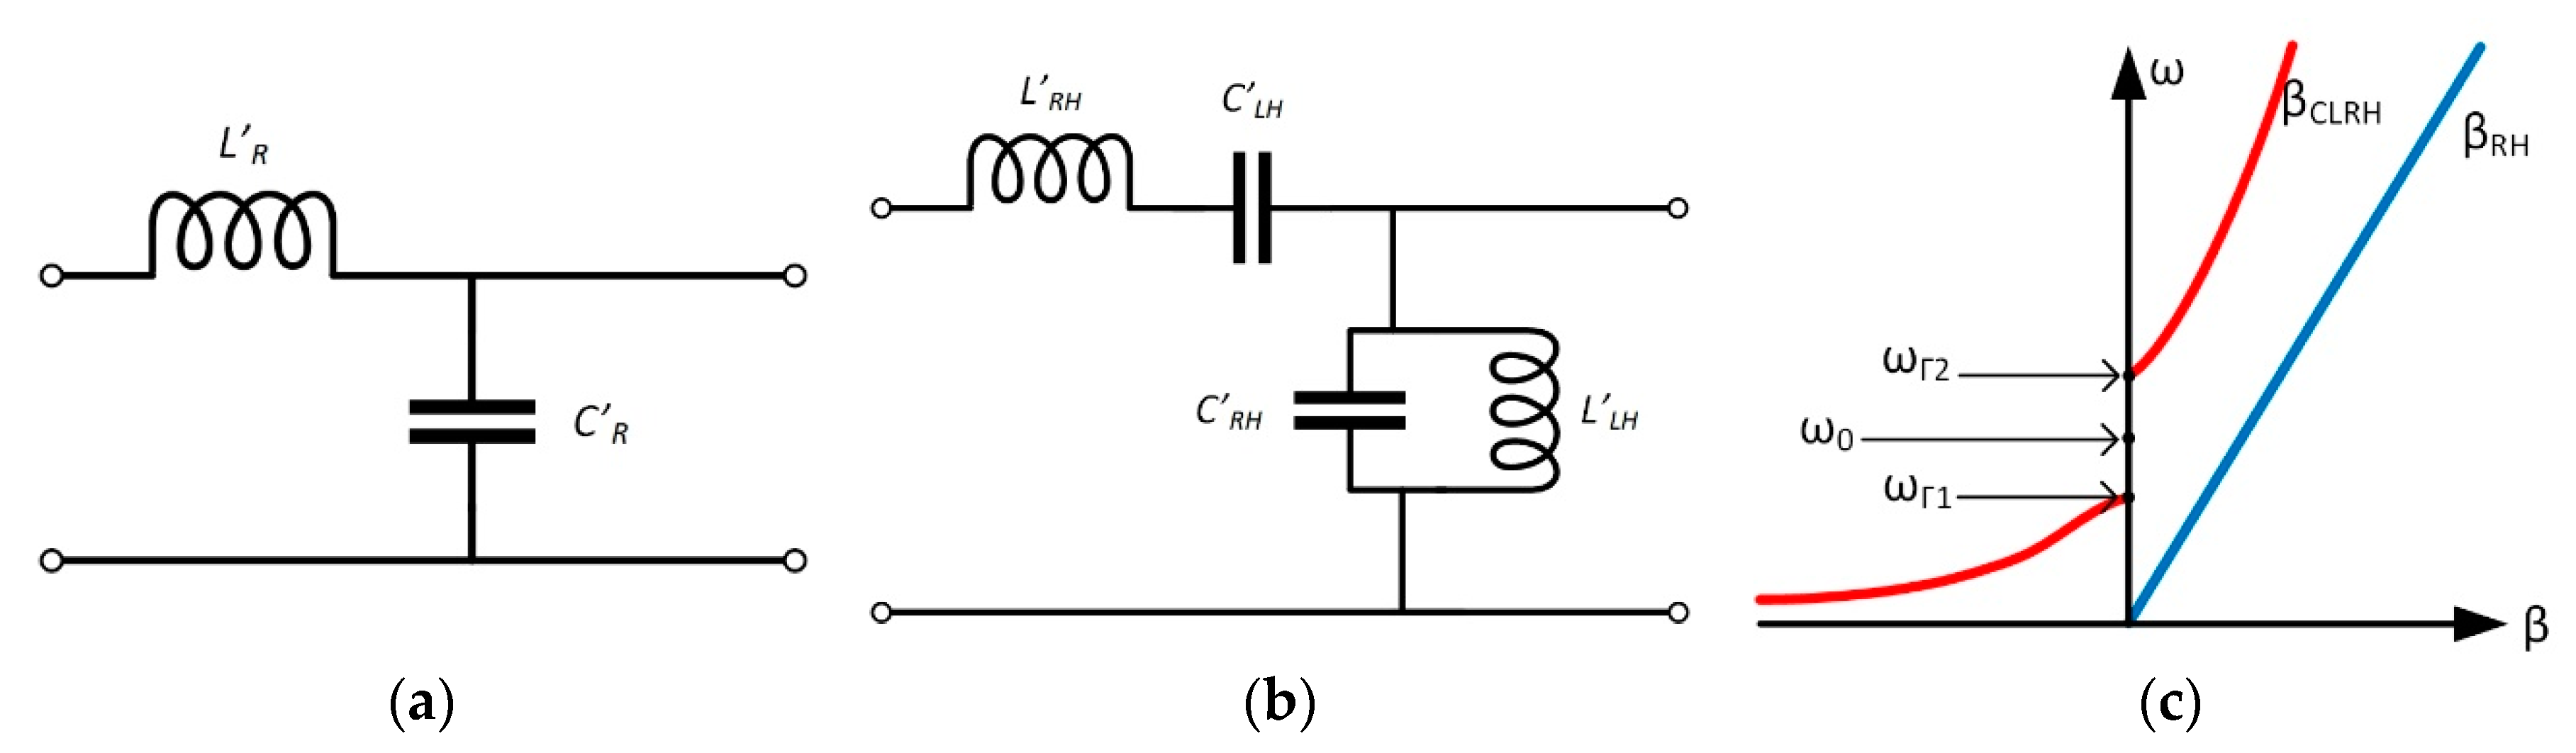
Figure 3 together Wilkinson with a power divider. The equivalent circuit model of the conventional RH and CLRH microstrip TLs is shown in
Figure 4a,b, respectively [
11]. RH line was modelled using per-unit length series inductance (
LR’) and per-unit length shunt capacitance (
CR’), while the CLRH circuit model consists of a purely LH section in the form of per-unit length series capacitance (
CLH’), as well as a per-unit length shunt inductance (
LLH’) and parasitic RH section. The phase shift of the signal propagating through both TLs can be expressed as
and it is determined by phase velocity (
νp), angular frequency of the propagating signal (
ω), and the physical properties of the transmission line (
l). The phase velocity depends on the dispersion (
β):
For the RH TL, the dispersion relation is defined as
while for the CLRH it can be expressed as
where
From the dispersion diagram shown in
Figure 4c for both transmission lines, it can be seen that in the case of the RH TL, the propagation constant is real and positive. On the other hand, for the CLRH TL the propagation constant can be purely real or purely imaginary. If the
is purely real then propagation occurs, while stopband will exist for the imaginary value. Therefore, the CLRH line has two propagation bands in the lower LH and the upper RH. By combining Equation (3) into (1) we can see that phase shift is a linear function of the physical length in the case of the RH TL. Alternately, in the case of the CLRH TL, the phase shift changes intensely in the LH band and therefore has a stronger influence on the phase shift. In the used topology, the impact of the changes in fluid permittivity in the microfluidic channel is reflected in total capacitance of the CLRH TL and, consequently, will influence the phase velocity and the phase shift.
The proposed metamaterials-based microfluidic sensor was manufactured as a combination of the proposed sensing concept and microfluidic platform with a reservoir placed under the CLRH section. The 3D view of the proposed microstrip microfluidic sensor is shown in
Figure 1, while
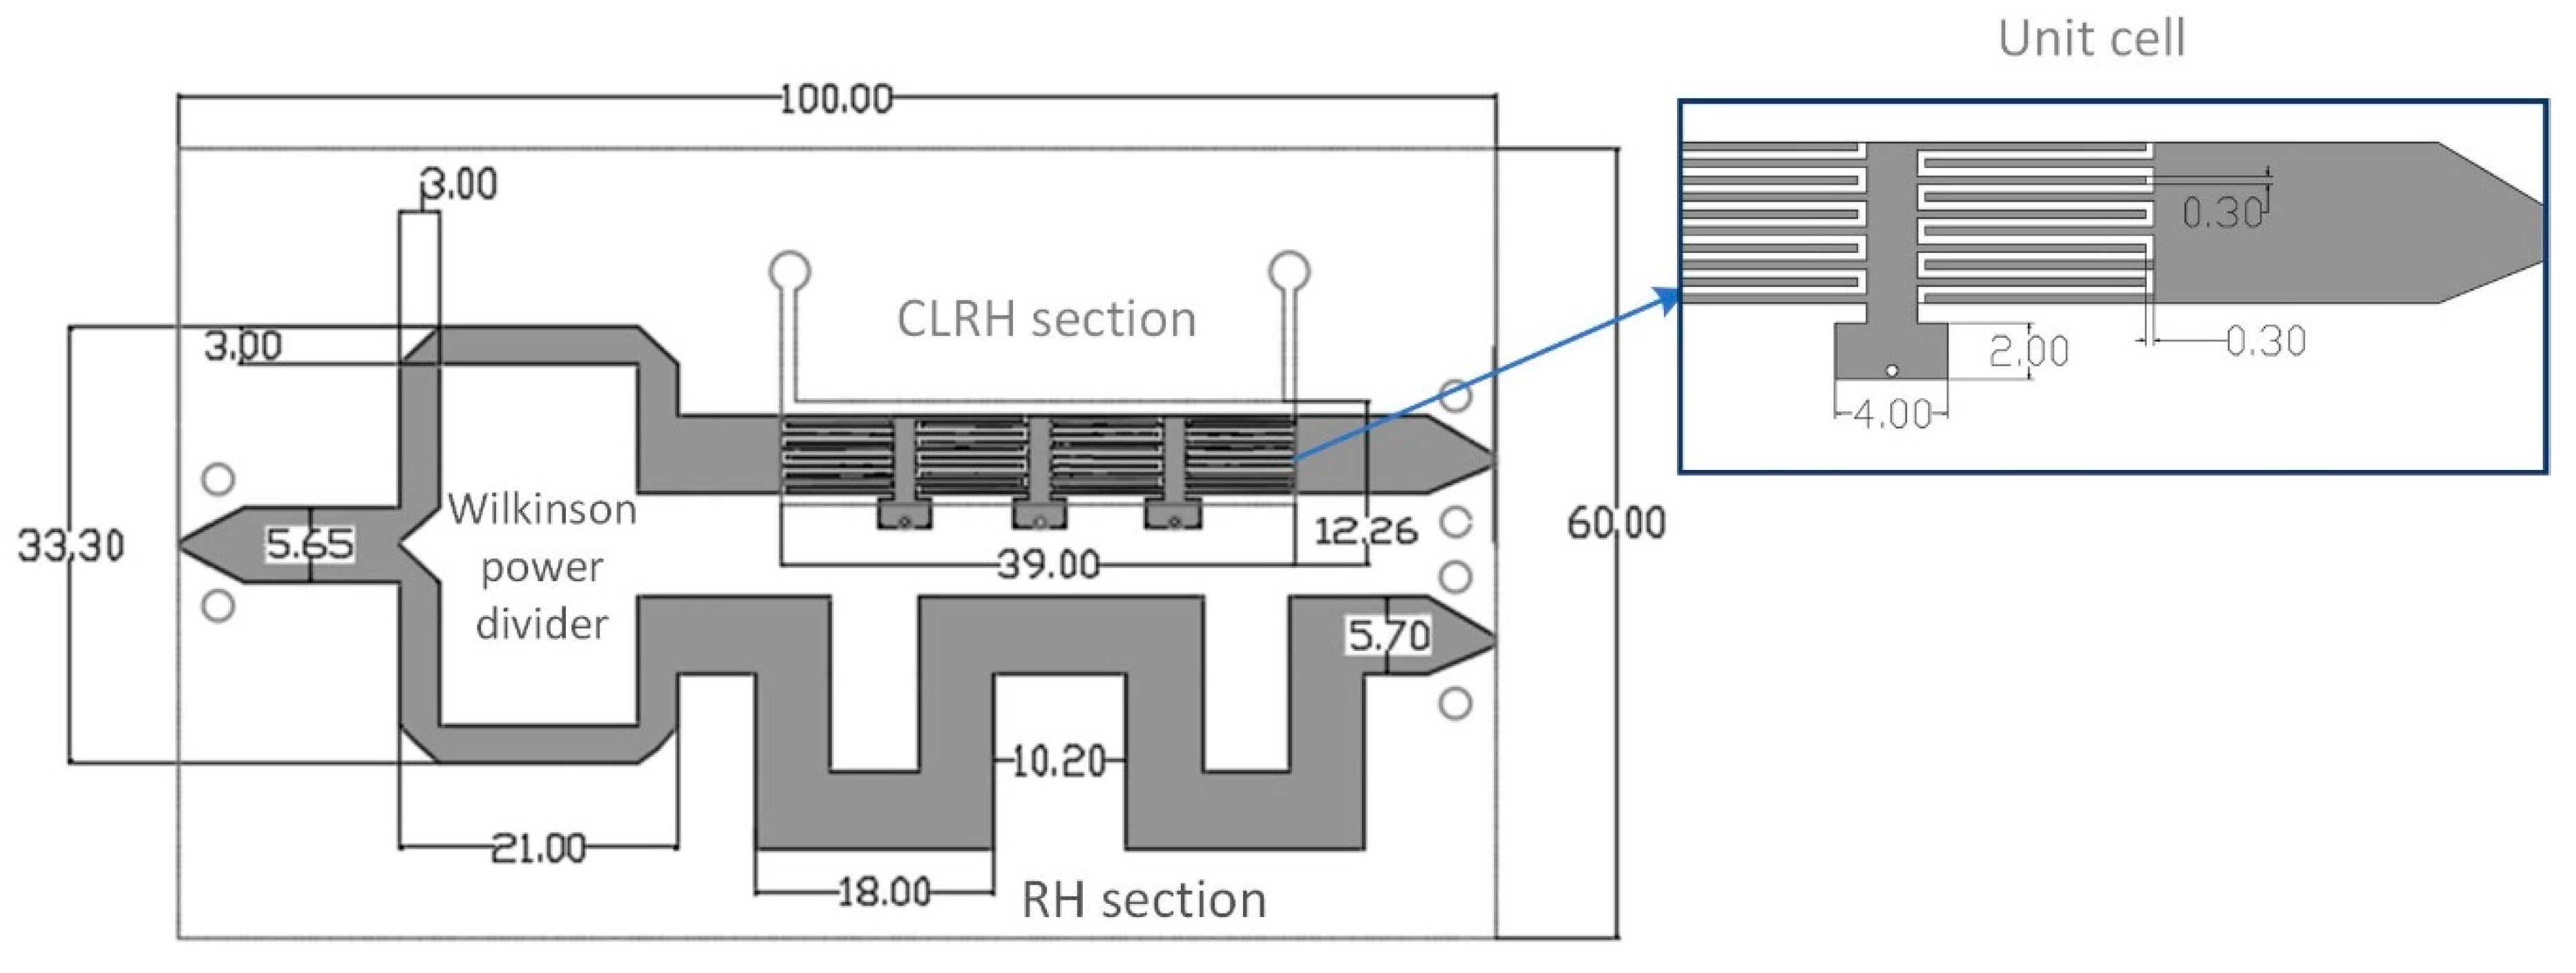
Figure 3 shows the optimized dimensions of transmission lines and the Wilkinson power divider, which is integrated together with two TL sections. The complete system is designed to operate at a frequency of 1.275 GHz. This frequency is high enough to neglect the effect of conductance on the phase shift, but also low enough to allow the realization of the electronic read-out using standard electronics components and commercially available integrated circuits. The RH microstrip line section was made as a meandered line, while the CLRH section was designed using three-unit cells comprised of per-unit length serial capacitance in the form of the interdigital capacitor, and per-unit length shunt inductance in the form of shunted inductive stub. Dimensions of the unit cell are optimized to provide LH behavior at a frequency of 1.275 GHz. In contrast to the standard phase comparator, a conventional microstrip line was replaced with the CLRH transmission line. In that manner, the phase “advance” occurs in the case of the CLRH line, while phase delay occurs in the RH frequency band, due to the backward wave propagation in the LH range [
11]. Due to such an improved phase shift, the response can be obtained with better sensitivity at the output of the sensor, as will be discussed in more detail below.
The Wilkinson power divider and RH and LH TLs were designed separately using Sonnet software [
25] and CST Microwave studio [
26]. The optimized dimensions of these components are shown in
Figure 3. In all simulations, the PVC foil was modelled with a permittivity of 3.1 and dielectric losses of 0.1, while the PMMA was modelled with permittivity of 3 and dielectric losses of 0.02 at a frequency of 1 GHz.
The response of the designed power divider is shown in
Figure 5. It can be seen that, at an operating frequency of 1.275 GHz, the insertion losses of the transmitted signals for the proposed configuration are about −3.5 dB, while the isolation between two paths is higher than 40 dB.
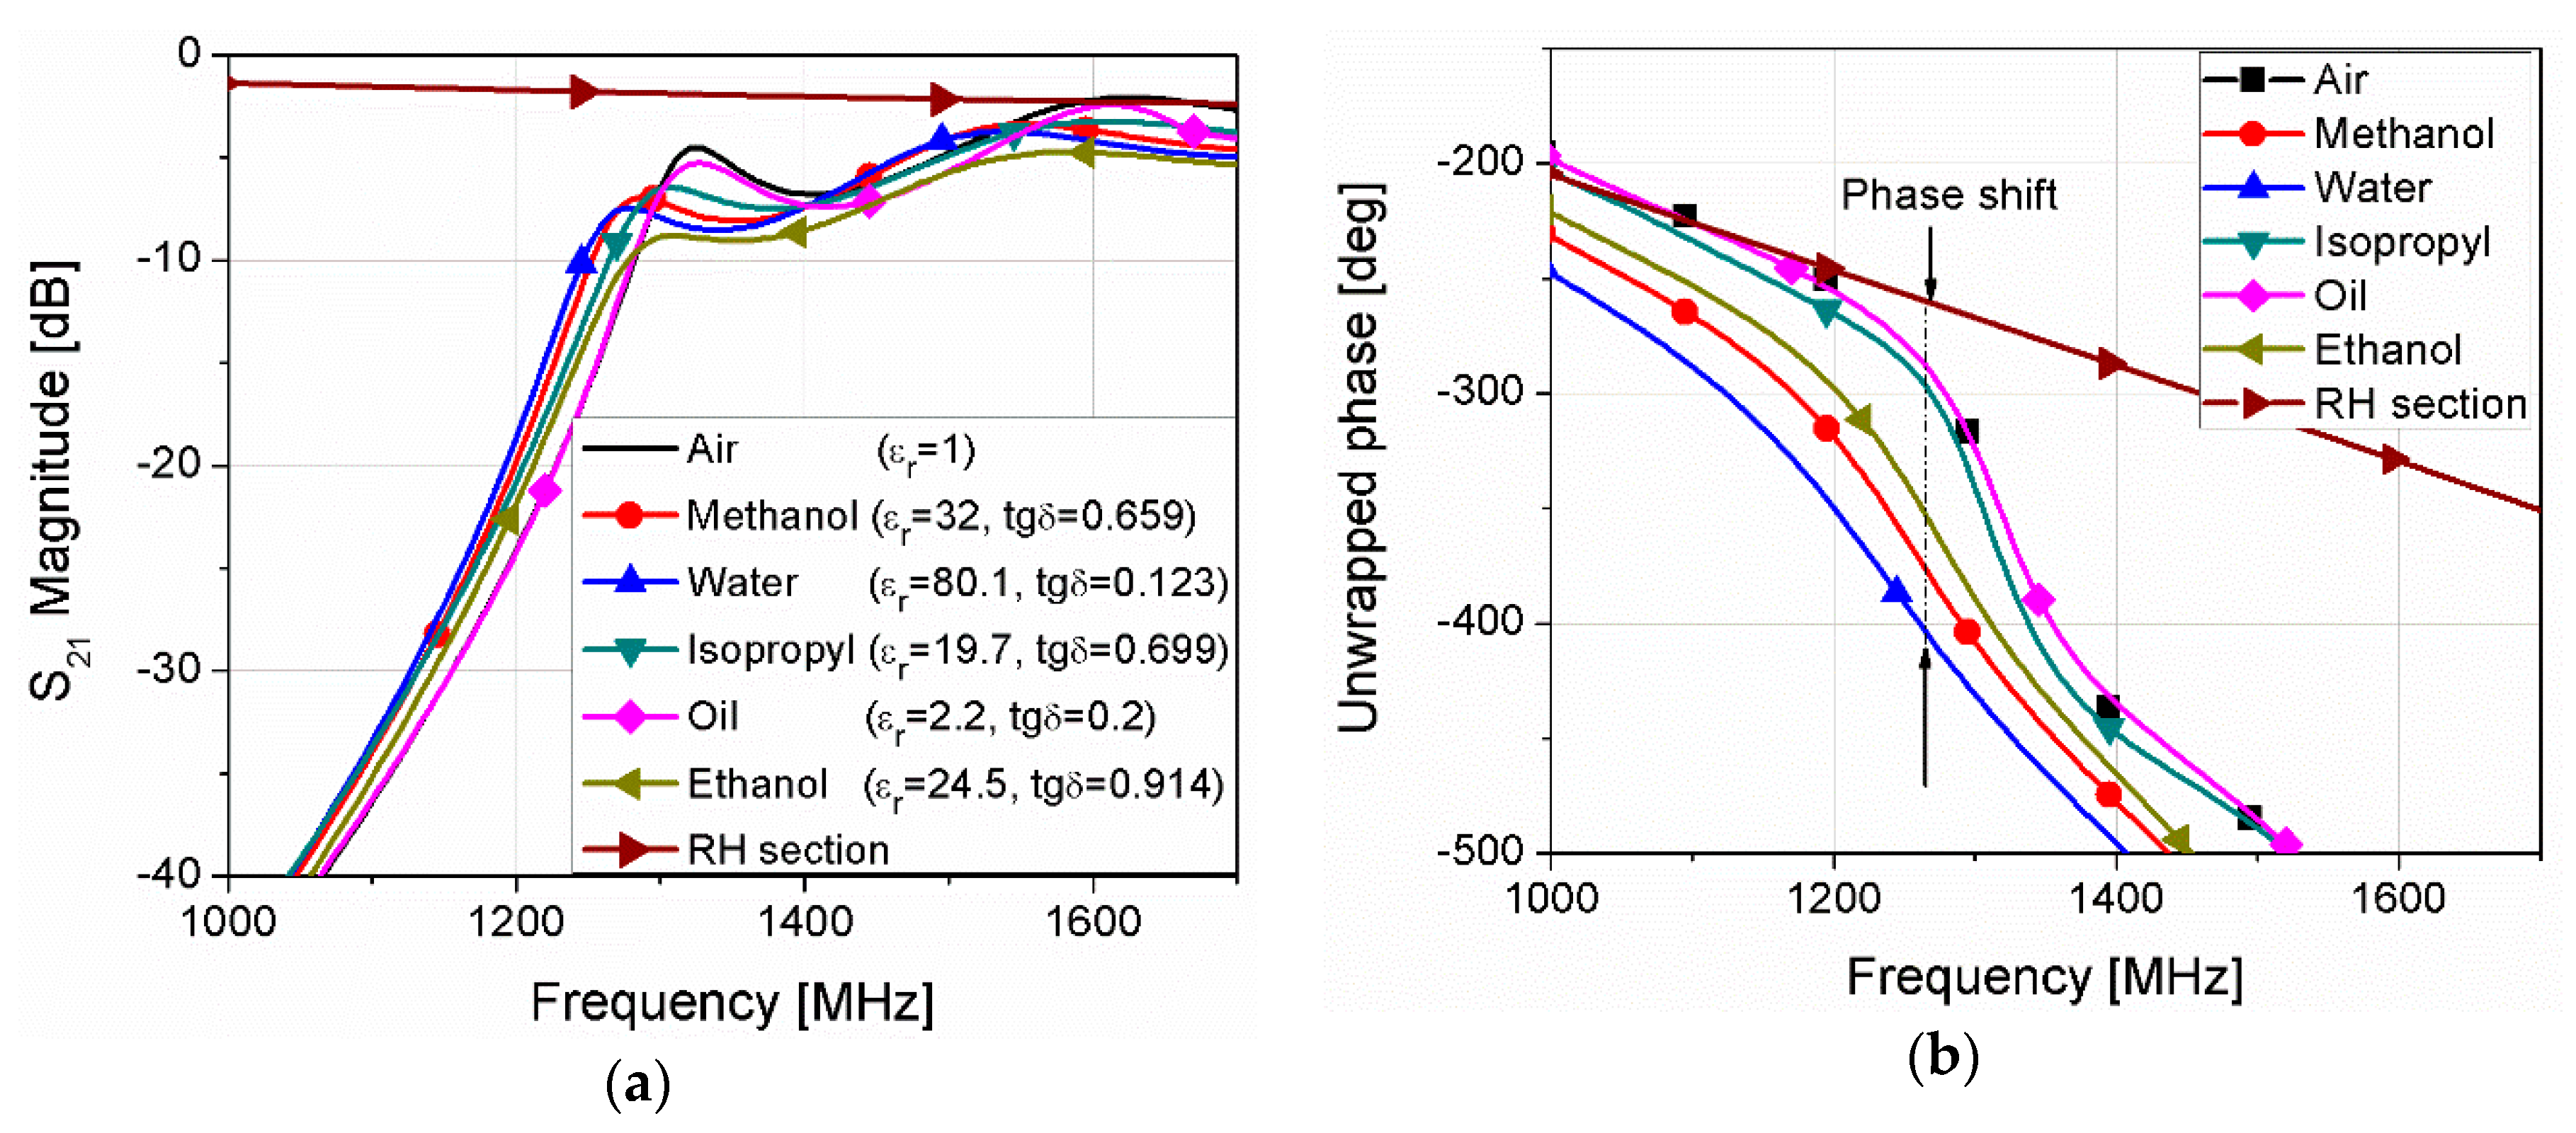
The amplitude and phase characteristics of the referent RH line and CLRH line above the reservoir with various fluids in the reservoir are shown in
Figure 6. The propagation constant and phase characteristics of the CLRH depend on the characteristics of the microstrip substrate (i.e., its dimensions and dielectric constant). Therefore, the change of the fluid in the microfluidic reservoir will influence the effective permittivity of the substrate and consequently the phase response [
27]. For that reason, the central resonance of the LH band slightly shifts (
Figure 6a), while the slope of the phase characteristics changes intensely (
Figure 6b) when the properties of the fluid that flows through the microfluidic channel change. The phase shown in
Figure 6b presents an unwrapped phase of the transmitted signals. The simulations have been performed for different fluids in the microfluidic reservoir, where the fluids are represented using their dielectric permittivity (
εr) and dielectric loss tangent (
tgδ) (whose values are also given in the
Figure 6a). The amplitude difference between two signals (i.e., the referent and measurement signals) is lower than 10 dB in the worst case at the operating frequency. Based on the above, we conclude that the commercially available phase detector can be used for phase shift measurement. In this study, an AD8302 phase comparator [
24] was used to measure the phase shift. The RH line designed on PVC/PMMA substrate combination was optimized to have a 30 degree phase difference relative to the signal of the CLRH line with the empty reservoir. In that manner, we will set up the phase detector to operate in the linear regime and to measure a maximum of 120 degrees of the phase difference for different fluids in the channel (i.e., from air to water for permittivity in the range between 1 and 80.1). The permittivity of different fluids used in simulations corresponds to the real permittivity at the operating frequencies of different fluids such as oil, isopropanol, methanol, ethanol, and so on (and is used later for validation).
The designed divider and TLs are fabricated together with a microfluidic reservoir onto the combined PVC and PMMA substrate, as was described in
Section 2. The fabricated prototype of the TL sections with the integrated Wilkinson divider is shown in
Figure 7.
The phase detector module used for measuring the phase shift between two signals propagating thought RH and CLRH TLs is made using integrated circuit AD8302 Analogue Devices (
Figure 8a). The phase detector circuit developed to operate in the linear regime is set to the phase difference measurement mode according to the manufacturer’s recommendation. Integrated circuit AD8302 on its output provides a voltage signal proportional to the phase difference of the signals on its inputs. A vector network analyzer (VNA) was used for experimental verification and accuracy testing of the designed phase-shifter device. The fabricated circuit of the phase detector manufactured using standard PCB technology is shown in
Figure 8b.
4. Results
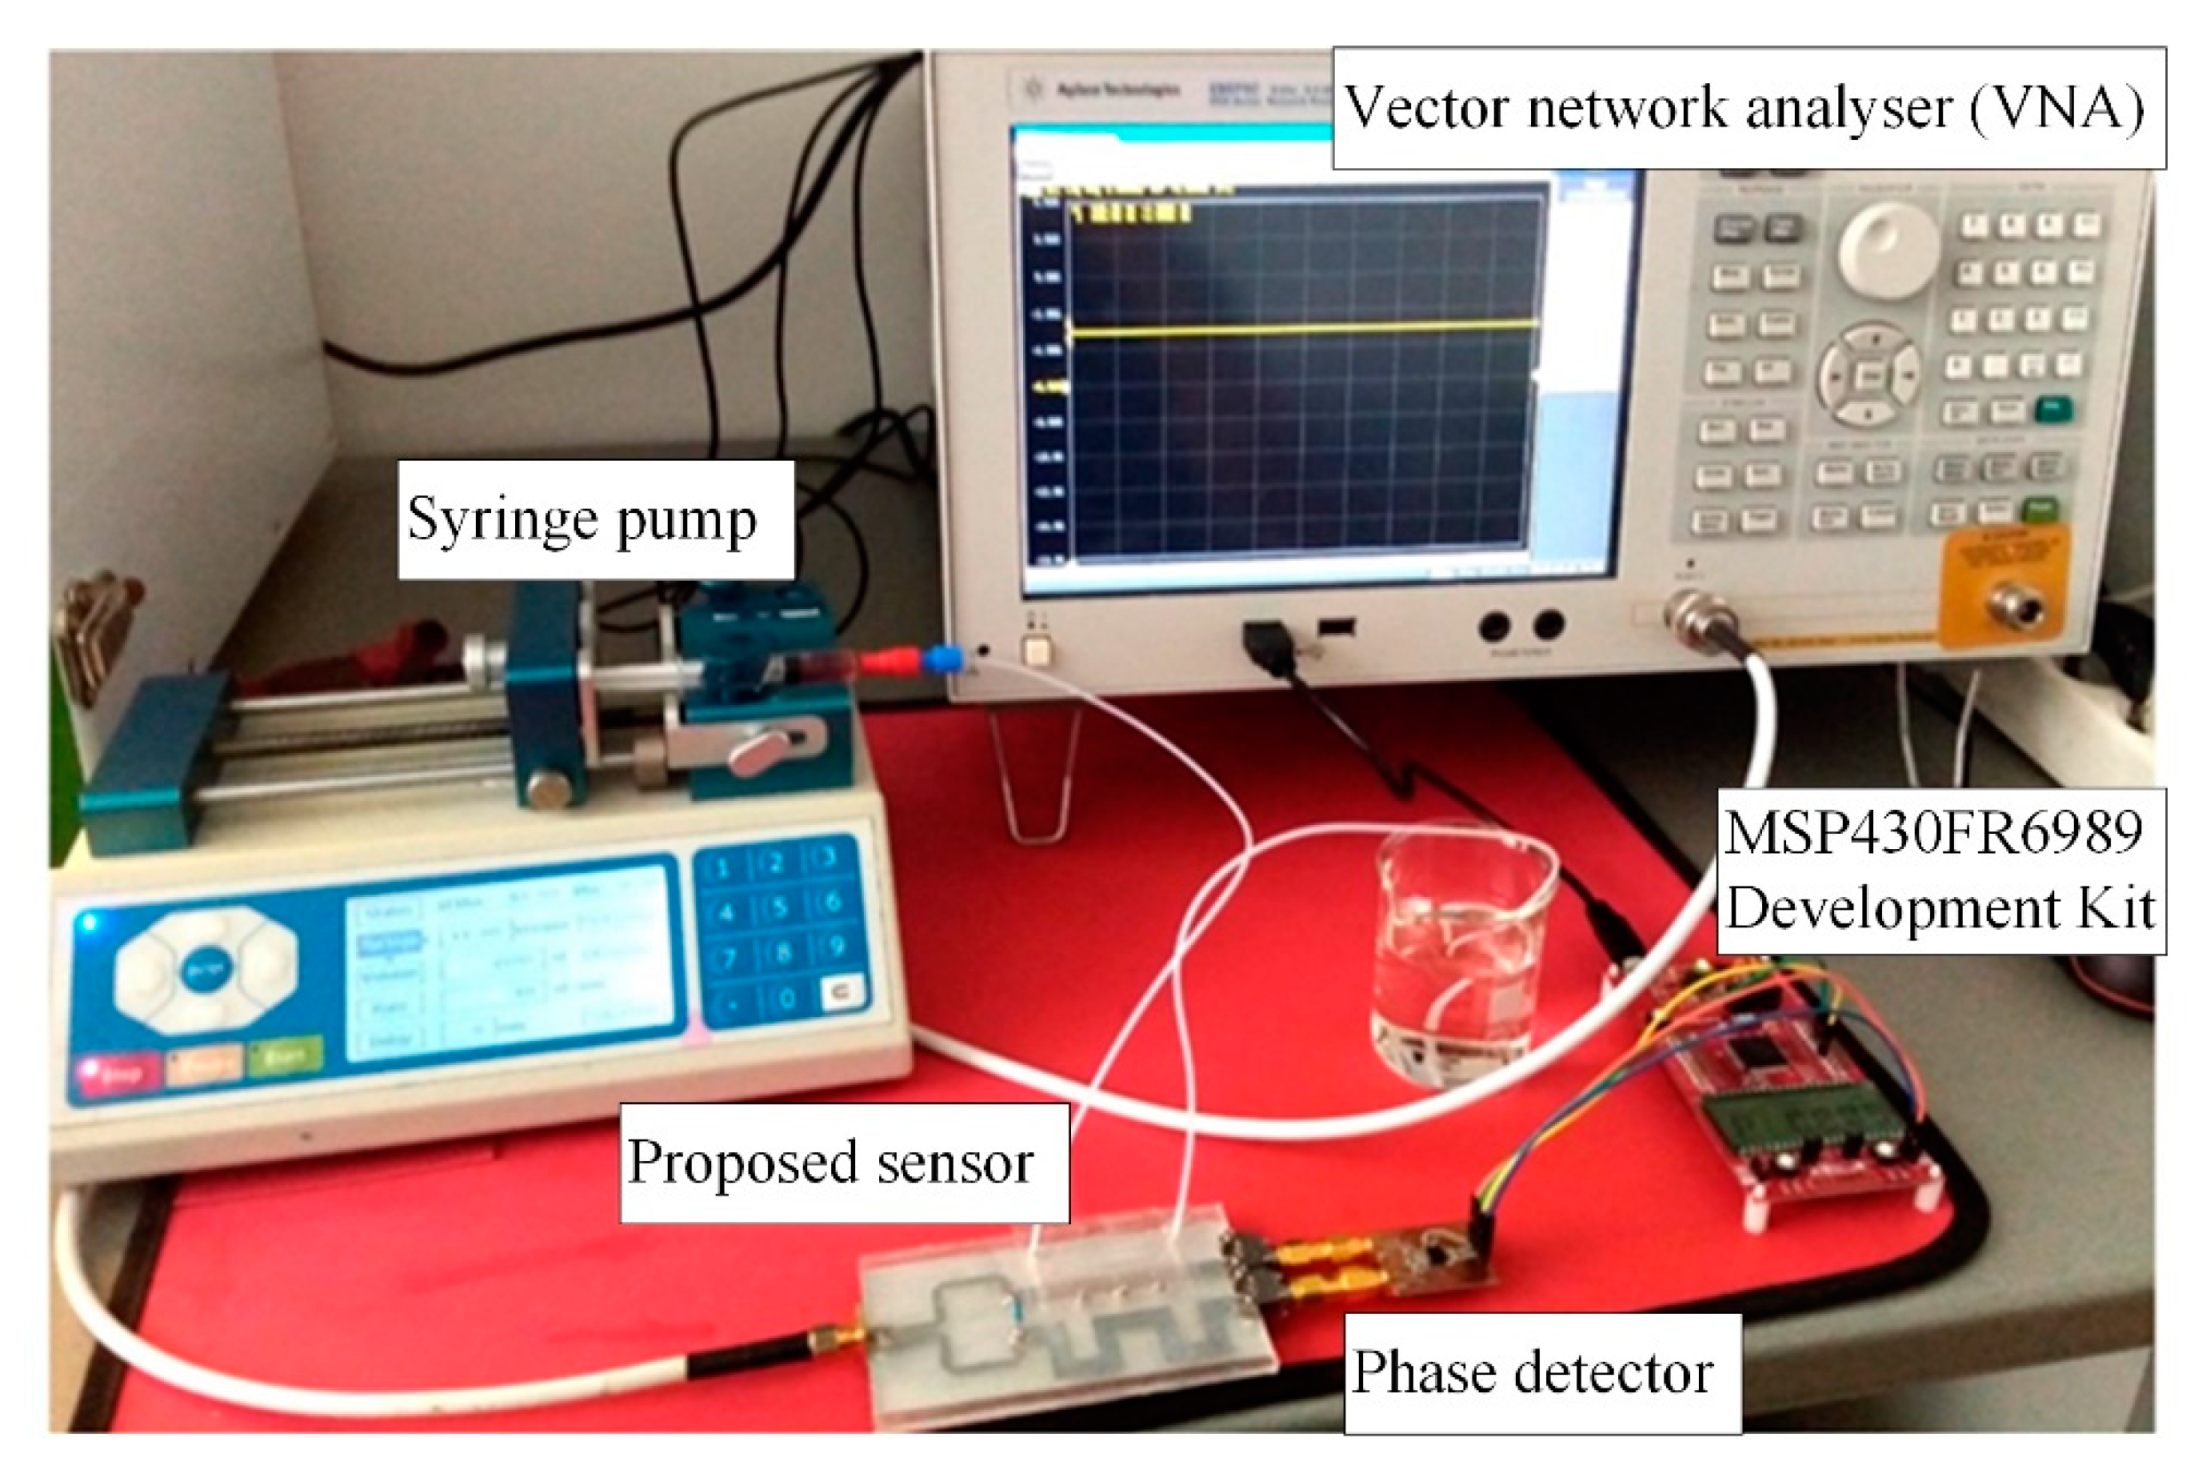
The measurement setup is shown in
Figure 9. It consists of a VNA (which is used for characterization of the TLs and generation of the input signal), proposed sensors with the power divider, the phase detector, and the MSP430FR6989 LaunchPad Development Kit [
28] for measuring the output voltage and the syringe pump.
Firstly, the designed sensor was characterized using a three-port measurement of the transmission signal.
Figure 10a shows the transmission characteristics of the RH and LH sections in the frequency range of interest for air and water placed in the microfluidic reservoir and a comparison with the results of the simulation. Good agreement was obtained between the measured and simulated results, except for the small shift in the frequency. It should be noted that the measured amplitude of the signals was several dB larger than in the simulations. However, the maximum difference between the signal through the CLRH and RH sections was still within the 10 dB range. Increased losses arose as a result of imperfections in the fabrication process and were also related to the low conductivity of the aluminum tape used for the conductive layers. Due to the small frequency shift, the phase difference was reduced for 9.5% and the maximal detected phase shift was 112.3 degrees.
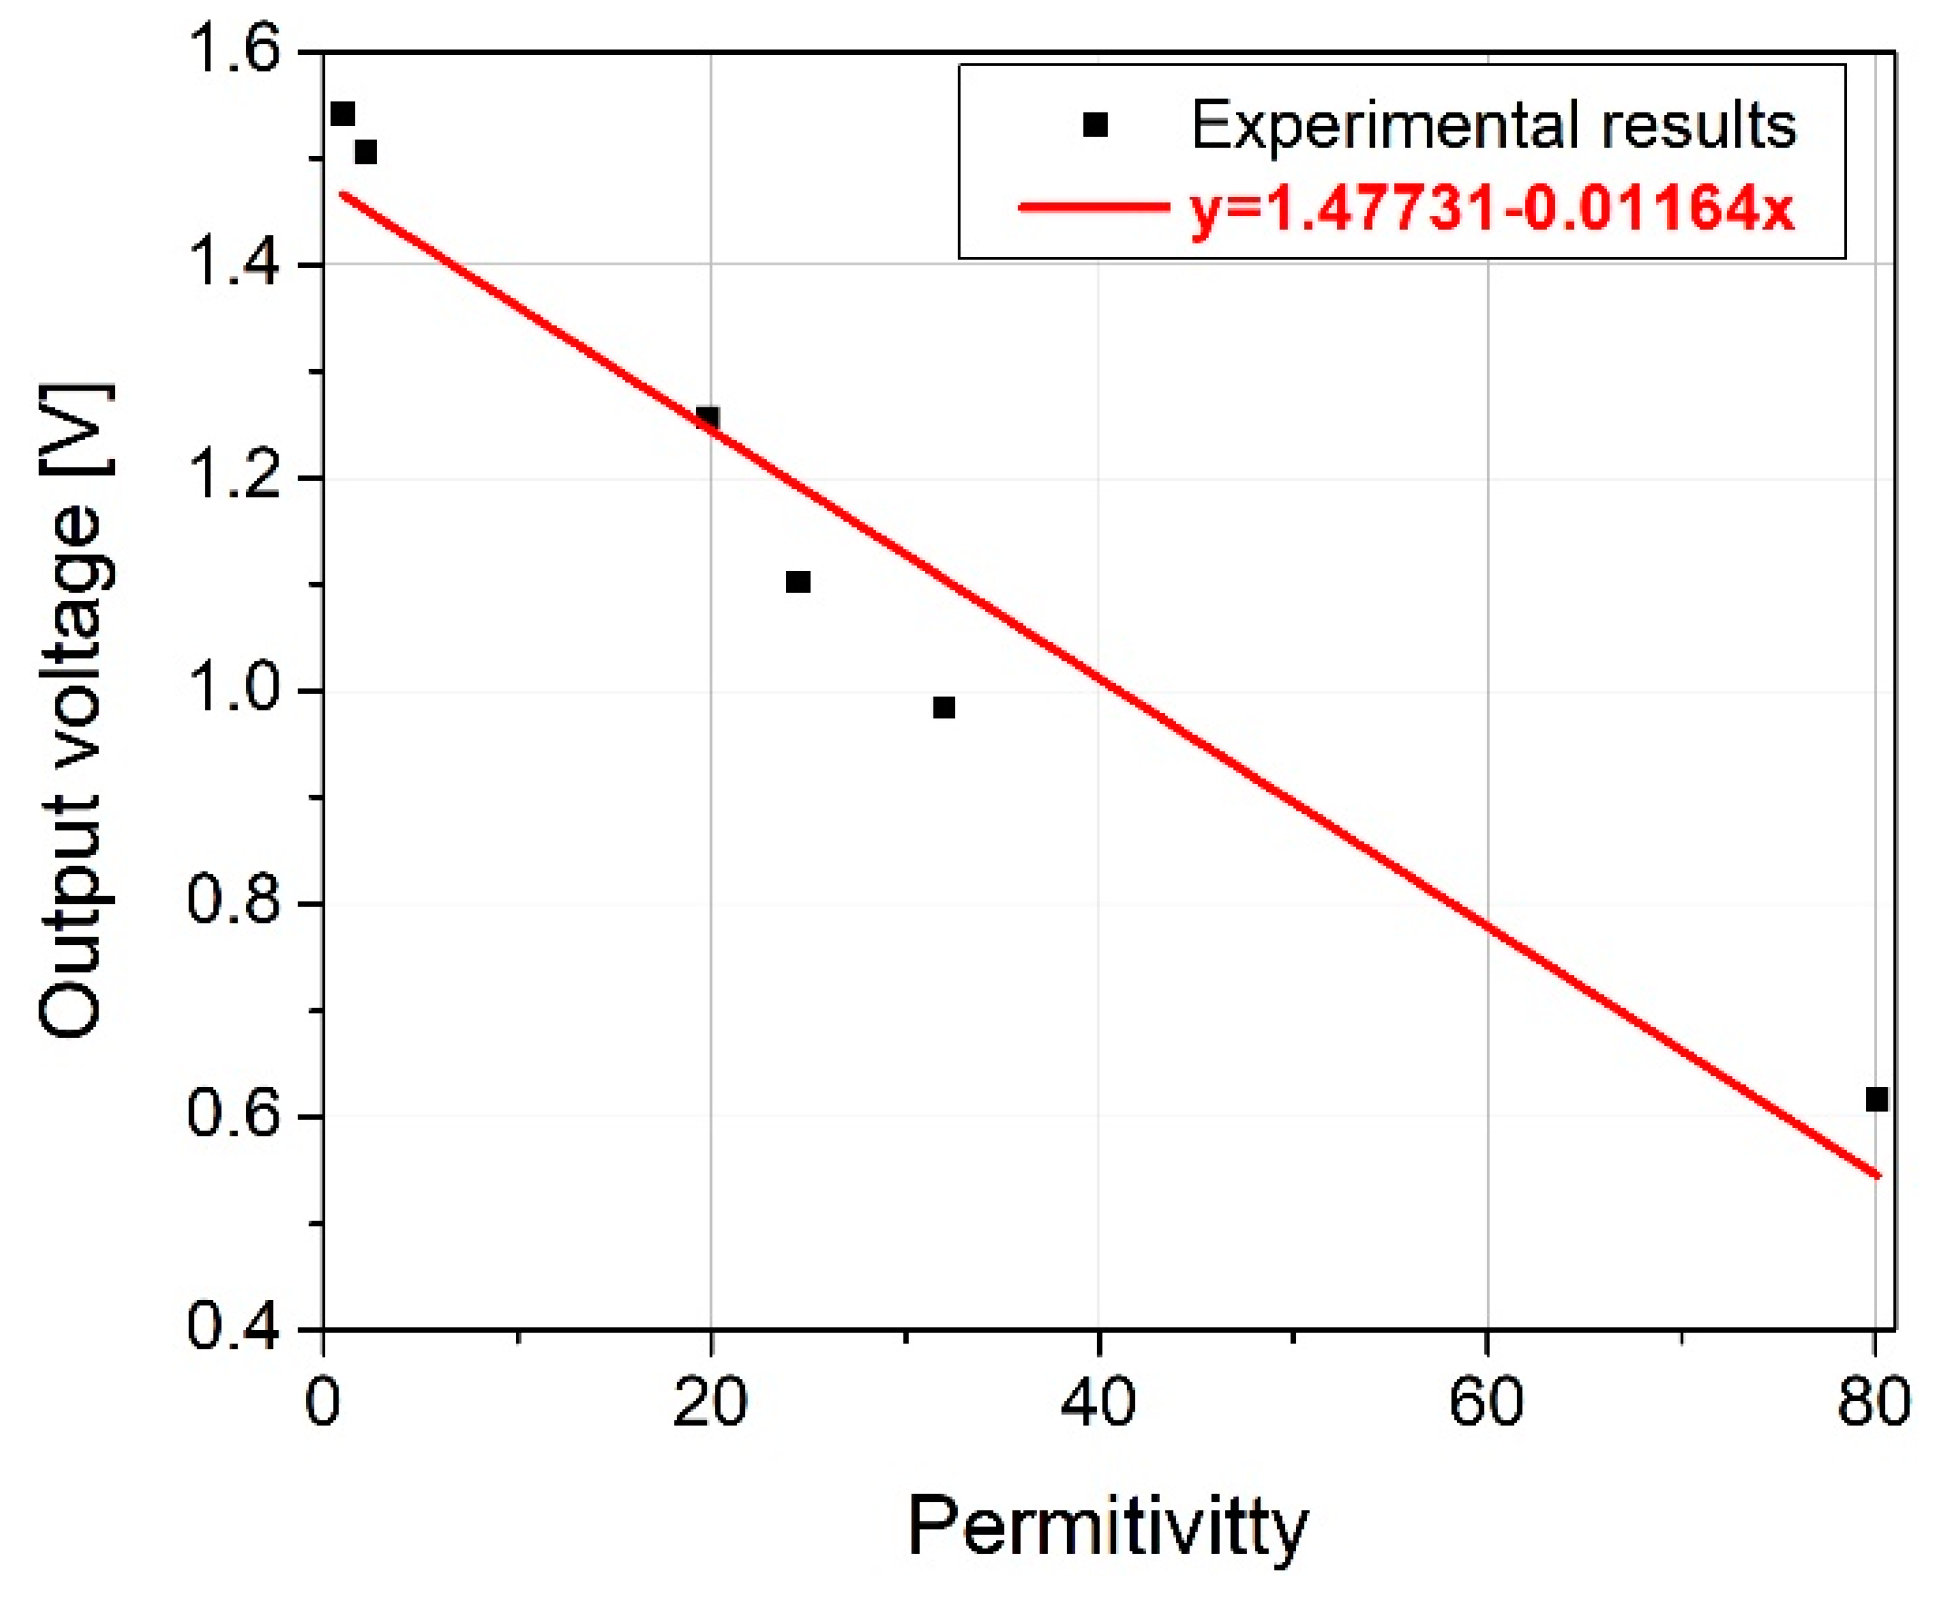
In the next step, the phase detector was used at the output to measure the phase difference for different fluids inside the microfluidic reservoir.
Figure 11 shows the variation of the output voltage versus the dielectric constant of the fluid in the reservoir. The output voltage almost linearly depended on the dielectric constant of the fluid in the reservoir with a regression factor of R
2 = 0.94. The limit of detection of the output voltage of the proposed device was determined by the accuracy of the AD8302 integrated circuit and was equal to 10 mV. It can be mentioned that the imaginary part of the complex permittivity does not affect the phase shift, but can influence the amplitude of the signal and insertion losses [
1]. The imaginary part of the complex permittivity cannot be directly calculated from the phase shift and therefore the measurement of the amplitudes of two signals should be taken into account. Since the used phase comparator allows a measurement of the amplitude difference between two signals, it can be used for estimating the imaginary part of the complex permittivity, or for mitigation of the comparator measurement error of the phase shift.
The proposed sensor was used to measure the cell concentration (i.e., biomass) inside the microfluidic bioreactor. MRC-5 human fibroblasts were grown in DMEM with 4.5% glucose supplemented with 10% fetal calf serum and antibiotic/antimycotic solution. The cell density (number of cells per unit volume) and the percentage of viable cells were determined before the measurement using the proposed sensor. The measurement by the sensor was performed immediately after seeding the cells into the reservoir while still free-floating in suspension. This is done for proof-of-concept purposes.
Figure 12 shows the output voltage as a function of the number of cells in 1 mL of medium solution. The number of cells influences the effective permittivity of the fluid in the reservoir. Therefore, the effective permittivity of the substrate under the CLRH TL changes and consequently the output voltage changes. Although the change in output voltage is relatively small due to the high permittivity of the medium solution, the measurement response possesses better linearity in terms of the variation of the number of cells with a regression factor of R
2 = 0.98.
5. Discussion
The metamaterial CLRH transmission line approach was used to make a novel microfluidic sensor for the characterization of fluid flowing in the microfluidic reservoir. The proposed sensor comprises a power divider, microstrip lines, and a phase detector designed as a low-cost microfluidic platform using hybrid fabrication technology combining laser micromachining process, xurography, and lamination techniques. The CLRH TL fabricated above the channel is used to improve the sensitivity of the conventional TL in the phase comparator. The TL method was used, since it represents a fast and simple method for determination of the dielectric properties of the material, as well as allowing characterization at a single frequency with a high degree of integration with the sensor elements. The complete read-out detection circuit for determination of permittivity based on the phase shift is suitable for in-field measurement, and has been designed to operate at a frequency of 1.275 GHz.
The measurement results of the fabricated sensor confirm that a change in the permittivity of fluids in the micro reservoir from 1 to 80.1 (from air to water) results in a phase shift of almost 115 degrees. Using the phase advance phenomena of the CLRH line, the sensitivity of the sensor can be improved more than 10-fold compared with the conventional RH line with the same length. The phase difference for the same sensor realized with the RH TL instead of the CLRH one is only 12 degrees. In addition, the designed read-out detection circuit is relatively simple and allows measurement at a single frequency. The output voltage is approaching the linear function of the dielectric constant in the microfluidic reservoir with a regression factor of R2 = 0.94.
Proof of concept for the potential application was demonstrated by implementing the proposed sensor for measurement of the cell concentration in a suspension-like cell culture in a microfluidic bioreactor. The experimental test confirmed that phase difference linearly changes with cell concentration. The signal was relatively low due to the very high dielectric constant of the cell suspension (i.e., the cells floating in the medium). However, the sensor was able to detect even such a low signal intensity.
The proposed device based on a metamaterials-based CLRH sensor presents a low-cost detection solution characterized by relatively high sensitivity and linearity, and therefore it can be used for monitoring small concentrations of specific fluids in different mixtures. On the other hand, the proposed sensor is suitable for a number of biomedical applications utilizing suspension cell cultures, or for fluid characterization.

 ,
, 


