Article

An Economical Energy Management Strategy for Viable Microgrid Modes

1
Department of Computer Science, COMSATS University Islamabad, Islamabad 44000, Pakistan
2
Department of Computer Science, College of Computer and Information Systems, Umm Al-Qura University, Makkah 21955, Saudi Arabia
3
Department of Electrical Engineering, Institute of Space Technology (IST), Islamabad 44000, Pakistan
4
Department of Computer Systems Engineering, University of Engineering and Technology Peshawar, Peshawar 25000, Pakistan
5
Department of Electrical and Computer Engineering, COMSATS University Islamabad, Islamabad 44000, Pakistan
*
Author to whom correspondence should be addressed.
Electronics 2019, 8(12), 1442; https://doi.org/10.3390/electronics8121442
Submission received: 12 October 2019 / Revised: 23 November 2019 / Accepted: 28 November 2019 / Published: 1 December 2019
(This article belongs to the Special Issue New Technologies for Smart Distribution Grid)

Abstract

:
In the last couple of decades, numerous energy management strategies have been devised to mitigate the effects of greenhouse gas emission, hence introducing the concept of microgrids. In a microgrid, distributed energy generators are used. Microgrid enables a point which ameliorates in exchanging power with the main grid during different times of day. Based on the system constraints, in this work, we aim to efficiently minimize the operating cost of the microgrid and shave the power consumption peaks. For this purpose, we introduce an improved binary bat (iBBat) algorithm which helps to schedule the load demand of smart homes and energy generation from distributed generator of microgrid to the load demand and supply. The proposed energy management algorithm is applied to both grid-connected and islanded modes of the microgrid. The constraints imposed on the algorithm ensure that the load of electricity consumer does not escalate during peak hours. The simulation results are compared with BBat and binary flower pollination algorithm, which validate that the iBBat reflects substantial reduction in operating cost of microgrid. Moreover, results also show a phenomenal reduction in the peak-to-average ratio of load demand from main the main grid.

1. Introduction

Every year, an increase in energy consumption has been observed and hence numerous challenges must be tackled such as harmful effects of non-renewable energy sources (N-RES), depletion of energy reserves and controlling energy consumption pattern of consumers etc. As stated in [1], N-RESs are a trivial cause of environment pollution. As a matter of fact, N-RESs are the main cause of greenhouse gas emission around the world [2]. To provide a solution of the above-mentioned problem, a strategy is required that employs RESs and manage the electricity demand and supply efficiently. For this purpose, the development of distributed generators (DGs) is required which helps to generate electricity through renewable resources. To establish and maintain a sustainable alliance between DGs and the upstream utility grid, the concept of microgrid came into existence. It integrates DGs and energy storage systems (ESSs) to fulfill the demand of users and ensures the provision of electricity on a small scale. It can operate in two modes: grid-connected and island modes. In a grid-connected mode it sells the surplus energy to main grid and buys from it when its energy generation is less than the demand. In this mode microgrid is always connected to main grid. On the other hand, an island mode is useful mostly in cases when power supply is interrupted due to the detection of any fault in the grid or in regions such as Russia, where 60% of the territories are not connected to the utility due to their geographical positions [3]. In this case, the connection between microgrid and main grid is terminated.
Optimally scheduling the microgrid resources has become a hot research topic from a couple of years. Devising a strategy for managing energy also puts a great impact to optimize the generation pattern of the microgrid in either of its modes. The authors in [4] noticed the large integration of RESs in the microgrid due to which the use of ESS dramatically increased. For this purpose, the authors introduced a bat algorithm to develop corrective strategies to perform least cost dispatches. The authors in [5] employed flower pollination algorithm (FPA) to schedule home appliances to balance the load demand of consumer for demand side management (DSM). Moreover, they put emphasis on the reduction of peak-to-average ratio (PAR) and electricity cost. Zhang et al. [6] introduced a method which helps to schedule the microgrid resources. For this purpose, they proposed a hybrid optimization algorithm. Muhammad et al. [7] introduced an architecture which integrates RESs. A mix-mode energy management strategy is introduced in [8]. It also presents a battery sizing method which helps to operate the microgrid with a minimum operating cost.
The power mix generation has a great impact on the cross-country relationships. The authors in [9] presented a set of policy recommendations for the market design of a future European electricity system. They incorporate the dominant share of RESs in line with the stated targets of the European government. Moreover, their analysis covered the interconnection, ESS, distribution generation and network tariffs. In [10], the authors focused on the effects of electricity market on the dynamics of France and Germany. The impact of German solar and wind power on both market power and prices in the French wholesale market is estimated. The deployment of RESs heavily and directly effects the power as well as the market prices. The integration of RESs has significant impacts on the power price dynamics of the cross-border by reducing the prices and the level of market power. It has been widely accepted that the integration of RESs in the microgrid is a classical solution to the market power problem. However, their deployment is costly and difficult. Since the RESs account for a large share in the spot market. Hence, any change in the spot market affects the market power. In [11], the authors focused on the impacts of high penetration of RESs in the grid. They have identified the problem that the integration of RESs often indirectly increases the market power fostering congestion problem. Hence, it is not suitable to fully rely on the RESs due to their intermittent nature and energy is exchanged from utility grid in different times of a day. Moreover, the impact of RES on the utility is a different issue which needs to be tackled.
In [12], authors propose a hybrid algorithm for power generation scheduling of traditional generators, RES, battery storage and electric vehicle (EV). Furthermore, a microgrid connected system is presented in [13] for controlling distributed energy resources (DERs). They present an improved ABC (IABC) algorithm to perform the required operation. In [14], a system is presented for microgrids which reduces the net emission and generation cost. However, they did not consider any mechanism to reduce the PAR. In [15], a robust optimization method is suggested for the optimal flow of microgrid power. In [16], the authors designed a fuzzy logic–based energy managing system for a grid-connected microgrid of a residential area. Due to high complexity of fuzzy rules, fuzzy logic-based solutions are not capable of incorporating real-time dynamics of an energy management system (EMS). The authors in [17] modeled and verified a supervisory EMS by formulating the invariants for possible mode change in a microgrid system. Furthermore, the work presented in [18], introduced a mixed integer linear programming (MILP) model. It helps to schedule loads at the premises of consumer. However, the authors did not consider the integration of RESs which can further help to achieve their desired objectives. In [19], a home EMS is proposed. However, the operating cost of energy supply resources is calculated. The authors in [20], presented an energy management controller using three heuristic techniques to minimize the energy consumption and maximize user comfort. Their proposed model also integrates RESs; however, the operating and maintenance cost of RES is calculated. The authors in [21] proposed an energy management strategy for microgrid using enhanced bee colony optimization technique. They aim at minimizing the operating cost of microgrid. Here, we noticed that the load demand curve has more load on high peak hours as compared to the load on low peak hours. This means that no DSM strategy is implemented at consumers’ end, which needs to be considered. The authors in [22] presented a microgrid model which integrated photovoltaic (PV) panel, energy storage system (ESS) to manage the load of a building. In our previous work [23], we have proposed an EMS for a residential area. However, there is a need to further optimize energy consumption and generation patterns.
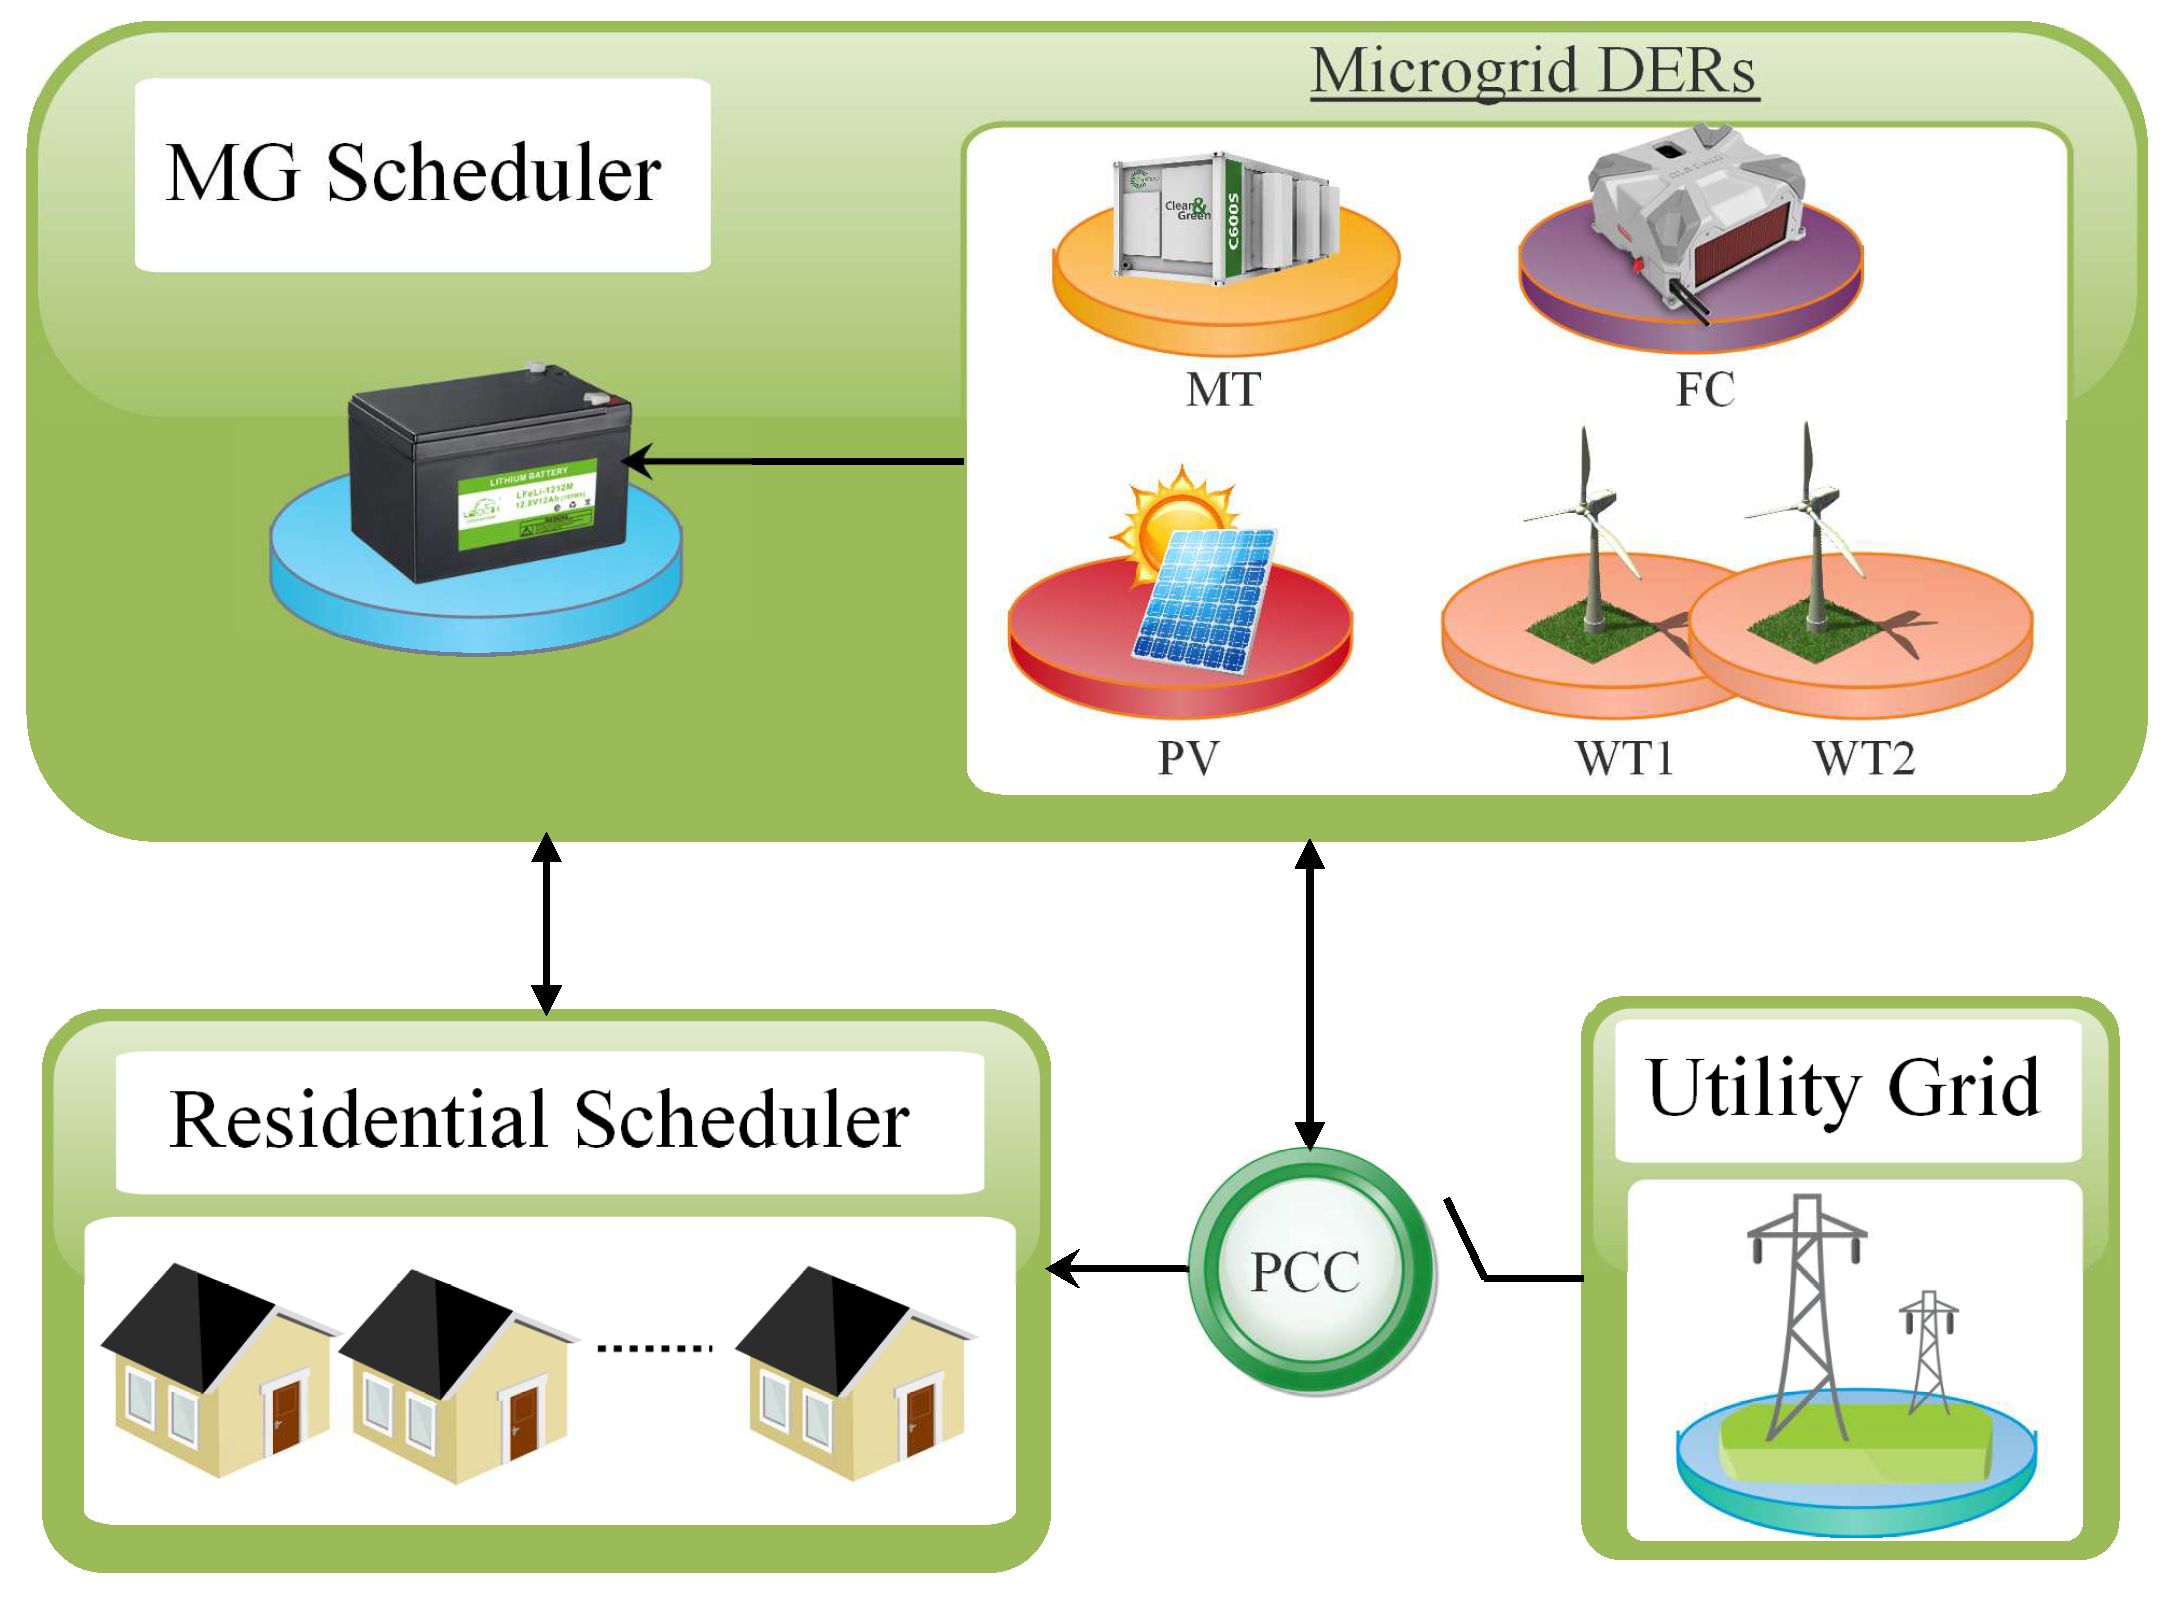
Moreover, to the best of our knowledge, none of the research works consider to schedule the load at the consumption as well as generation side at the same time which plays an important role in reducing the peak load and electricity generation and consumption costs. Considering the aforementioned limitations, we mainly focus on managing the energy sources of microgrid. As illustrated in Figure 1, the microgrid helps to locally provide energy to satisfy the load demand of a residential area. The residential area considered in our work consists of ‘n’ number of homes with fixed and shiftable appliances. The energy consumption of each home varies with respect to the factors such as residents’ living habits, electrical appliances and the type of household. In our work, the ESS is being charged when the surplus energy is available and discharged when the DGs cannot generate enough power to satisfy consumers’ demand. We prioritize to fulfill load demand using microgrid, and in case it fails to satisfy the overall load demand, the remaining load demand is satisfied through buying electricity from the main grid. In case, when microgrid produces more energy than the required at a specific time interval, the excessive power is sold back to the main grid.
In this paper, the electricity load at consumers side is optimized using binary bat (BBat) algorithm and binary FPA (BFPA). We have also proposed a novel algorithm and named it as improved BBat (iBBat) algorithm. The BBat algorithm is influenced by the echolocation nature of bats which helps to search the feasible search space. To strengthen the population evolution and the optimization of control parameters, we improve the BBat algorithm by comparing it with BFPA. The BBat has the advantage of quick convergence and easy implementation, but the quick convergence may lead to the lack of accuracy of solutions in high dimension search spaces [24]. We know that the energy management of residential area and the microgrid is a complex problem with multiple constraints. In the iBBat algorithm, we embed the self-adaptive and repulsive factor [21] in the flying behavior of the bats which increases the search efficiency and accuracy of solutions in high dimensions. The proposed algorithm helps to efficiently schedule the appliances of a residential area and the DGs of a microgrid in a way to reduce the operating cost. The effectiveness of the proposed algorithm is proved by comparing its performance with BBat [24] and BFPA [25]. The contributions of this paper are as follows:
  • In this paper, we have scheduled the energy consumption and generation using BFPA and BBat algorithms. We have also proposed iBBat algorithm for efficient scheduling of energy consumption at consumers’ side and as well as generation at microgrid side.
  • The operating cost of energy generators at grid side is reduced along with the energy consumption cost at users’ side. Moreover, PAR of load demand from main grid is also reduced.
  • The scheduling results of BFPA, BBAT and our proposed iBBAT are compared and depicted in simulation section of this paper.
The rest of the paper is organized as follows. Section 2 elaborates the mathematical modeling. The system methodology is discussed in Section 3. In Section 4, the proposed algorithm is discussed. Section 5 contains results and discussions. Section 6 concludes the work.

2. Mathematical Modeling

The proposed system is formulated to acquire the schedules of smart appliances, DERs and ESS to economically satisfy the consumers’ demand. For this purpose, we present the mathematical formulation in the following section:

2.1. Power Consumption Peak Minimization

We have formulated the DSM using the peak shaving technique. This technique helps to trim the peaks and shift load to low peak hours.
y 1 = min ( t = 1 T L D ( t ) )
L D ( t ) λ t h t { 1 , 2 , 3 , , T }
t α t t β
ς s a , ς f a ϵ [ 1 , 0 ]
The objective function is given in Equation (1a) which minimizes the maximum load demand L D at each time interval ‘t’. The first constraint represents that the load limit in a time interval should not exceed a specified threshold λ t h . However, the constraints (1c) and (1d) show the schedulable time limit and ON/OFF status of fixed ς f a and shiftable ς s a appliances.

2.2. Operating Cost Minimization: Grid-Connected Mode

The function which minimizes the operational cost of the microgrid is given in Equation (2) [14]
y 2 = min t = 1 T { i = 1 N G [ s v i ( t ) · P g e n , i ( t ) ( B g e n , i ( t ) + M c , i ) ] · · · + S g e n , i . s v i + j = 1 N E S [ P s t , j ( t ) · B s t , j ( t ) ] + P u ( t ) · B u ( t ) }
L D ( t ) = i = 1 N G P g e n , i ( t ) + j = 1 N E S P s t , j ( t ) + P u ( t )
P g e n , i m i n P g e n , i ( t ) P g e n , i m a x
P e x m i n P e x ( t ) P e x m a x
η C P ( t ) B m a x c h
P ( t ) η D B m a x d i s
In Equation (2a), s v i denotes the state vector demonstrating ON/OFF state of DGs and S g e n , i represents the Startup/Shutdown cost of i t h generator. However, the maintenance cost of the DGs is represented by M c , i . The constraint (2b) represents the power balance between the demand and the supply. The right side of this equation denotes the power generated from DGs P g e n , i , storage system P s t , j and the utility grid P u . The minimum P g e n m i n and maximum power generation P g e n m a x of generators and the power exchange P e x between the microgrid and the utility is represented by the constraints (2c) and (2d), respectively. The constraints (2e) and (2f) represent the charging B m a x c h and discharging B m a x d i s states of the ESS.

2.3. Operating Cost Minimization: Islanded Mode

In island mode, the total operating cost includes: the cost of power generation, maintenance and start up/shut down cost of DERs irrespective of the power exchange between microgrid and utility [14].
y 3 = min t = 1 T { i = 1 N G [ s v i ( t ) · P g e n , i ( t ) ( B g e n , i ( t ) + M c , i ) ] · · · + S g e n , i . s v i + j = 1 N E S [ P s t , j ( t ) · B s t , j ( t ) ] }
L D ( t ) = i = 1 N G P g e n , i ( t ) + j = 1 N E S P s t , j ( t )
P e x ( t ) = 0

3. System Methodology

In this section, an efficient strategy to optimize energy consumption and generation patterns of considered premises of users and a microgrid, respectively, is addressed as illustrated in Figure 1. The core idea behind this strategy is to reduce the power consumption peaks. The system model mainly constitutes three main parts, which includes residential scheduler, MG scheduler and the main utility grid. The residential scheduler is responsible to control and optimize the load demand of the energy consumers for all premises. However, MG scheduler schedules the DERs of the microgrid in response to the load demand received at time ‘t’. With the help of the point of common coupling (PCC), the microgrid and the utility can exchange the power to fulfill the load demand. The surplus power of microgrid is sold back to the grid using current pricing rates. The microgrid can operate in two modes: grid-connected mode and islanded mode. Moreover, when the grid condition is jeopardized or when electricity is not provided in isolated regions, the microgrid will change its optimization strategy accordingly and operate in the islanded mode. In the islanded mode, the scheduler focuses on providing a stable power supply to the residents while considering the economic criteria. The power from the microgrid is generated in response to the consumers’ demand. Due to operating independent of the utility grid, a dedicated energy resource is required to assure continuous power supply. Due to the irregular nature of RESs, the micro turbine (MT) and FC are more prioritized to provide a reliable power supply. It defines constraints both to work with their maximum capacities for ensuring a continuous power supply. The microgrid scheduler acquires the ON/OFF state of the DG sources in a way to minimize the operating cost. The rest of the DERs are turned on by the scheduler depending on the load in that specific time interval. Table 1 represents the comparison of our proposed work with the existing work from the literature.

3.1. Microgrid Components

To manage energy, the mathematical models of MT, fuel cell (FC), PV and ESS are essential [21].

3.1.1. Modeling of the WT

A wind turbine (WT) helps to generate energy from RESs. The wind energy is extracted and converted into mechanical power. The WT power P W T is generated using the following equation [21]:
P W T = 1 2 v W T 3 C p ( λ , θ ) ρ A W T
In this equation, the variable v W T represents the speed of the WT, C p ( λ , θ ) represents the co-efficient of the WT with respect to the tip ratio and pitch angles of the WT’s blades.

3.1.2. Modeling of the PV

With the help of PVs, light can be converted into electricity employing semi-conducting materials. The power of PV can be calculated as follows [21]:
P P V ( t ) = A P V × η P V × G R ( t ) .
In Equation (5), P P V ( t ) represents the power generated by the PV at time ‘t’. The area of PV array is represented by A P V , where η P V represents the efficiency of PV and G R ( t ) represents the intensity of global radiations at time ‘t’.

3.1.3. Modeling of the MT

The MT is a DG, which constantly generates power. The power generation of the MT at time ‘t’ P M T ( t ) depends on the fuel cost, which can be calculated using Equation (6) [21].
F ( P M T ( t ) ) = a P M T 2 ( t ) + b P M T ( t ) + c

3.1.4. Modeling of the FC

Due to the fact that RESs produce energy from natural sources, the nature of such generation units is intermittent. FC technology overcomes this limitation of RES by generating energy through oxygen and hydrogen. The power generated by FC P F C can be calculated using Equation (7) [26]:
P F C = V F C × I F C
Here, V F C and I F C denote the voltage and current generated by the FC, respectively.

3.1.5. Modeling of ESS

When the energy generated by the DGs exceeds the load demand, it is reserved in the ESS. The stored energy is used during times, when energy generation is insufficient to meet the load demand. The maximum charge and discharge rates of the ESS are defined as B m a x c h = P C S s m a x and B m a x d i s = P D S s m a x . However, the reserved energy is represented as follows [21]:
  • If the ESS is charging, then aggregated capacity S s at time ‘t’:
    S s ( t + 1 ) = S s ( t ) η C P ( t ) t
    where P(t) is the output power of ESS at time ‘t’. η C denotes the charging efficiency of the ESS.
  • If the ESS is discharging, then the aggregated capacity at time ‘t’ is calculated as:
    S s ( t + 1 ) = S s ( t ) P ( t ) t η D
    η D represents the discharging efficiency of the ESS.
The minimum and maximum limits of distributed generation resources are given in Table 2.

3.2. Microgrid Modes

The viable operating modes of the microgrid are islanded/isolated mode and grid-connected mode [27].

3.2.1. Grid-Connected Mode

In a grid-connected mode, the microgrid works in connection with the utility grid. This mode provides support to continuously exchange power between the microgrid and the utility, either it is insufficient or surplus power. The point which enables the connection between microgrid and utility grid is called the PCC.

3.2.2. Island Mode

In islanded mode, the microgrid works independent of the main grid and the control of microgrid becomes more intricate. Generally, the microgrid works in this mode when a fault occurs in the main grid or when maintenance is required on the grid side. It is also suitable for the regions, which are not connected to a centralized power supply due to their geographical position. Nevertheless, to avoid fluctuation in power generation; a reliable source is needed, which assures continuous power supply to fulfill the load demand.

3.3. DSM Strategy for Residential Area

As discussed earlier, ten homes are considered in a residential area. The load demand of each user premises depends on several factors such as type of household, living habits and electrical appliances. We have categorized appliances of each home into two types: fixed appliances ( f a ) and shiftable appliances ( s a ). The length of operation time (LOT) of fixed appliances cannot be altered. The state of an appliance f a ϱ is represented by 1 or 0. ς f a represents the power rating of fixed appliances. The parameters of fixed appliances are given in Table 3. Equation (10) shows the total energy consumed by the fixed appliances E f in a day [20].
E f = t = 1 T ( f a ϵ F f a ϱ · ς f a ( t ) )
However, the LOT of shiftable appliances can be shifted to any time without changing their load profile. The states of shiftable appliances s a ϱ are represented by 1 and 0. The consumer decides the starting and ending time ‘t’, where t ϵ [ t α , t β ] . ς s a represents the power rating of shiftable appliances. The parameters of shiftable appliances are given in Table 3. Equation (11) shows the total energy consumed by shiftable appliances in a day [20].
E s = t = 1 T ( s a ϵ S s a ϱ · ς s a ( t ) )
All the system components and their respective information given in this section are very essential to achieve the desired objectives.

4. The Binary Bat Algorithm

The heuristic algorithm bat has been influenced by the echolocation nature of the bats. The capability of echolocation enables the bat to find their prey even in the darkness [24]. Each bat in the search space is encoded with a velocity vt and location xt at the th iteration. The location of the bats can be considered to be a solution vector to an identified problem, where the current best solution is achieved during each iterative of the search process. The original bat algorithm was coined to solve the problems, which are continuous in nature. However, there was not a possible way to directly apply it to binary problems. To make it applicable to binary problems, the authors in [28] introduce a transfer function (TF) which maps the velocity values to the probability value and in turn, it updates the locations. The TF permits bats to move in a binary search space.
In the BBA, a bat updates its velocity, position and frequency vector in each iteration as follows:
V i ( t + 1 ) = V i ( t ) + ( X i G b e s t ) F i
X i ( t + 1 ) = X i ( t ) + V i ( t + 1 )
F i = F m i n + ( F m a x F m i n ) β
In Equation (12), Gbest represents the optimal solution obtained, and F i represents the frequency of the ith bat which is updated in every iteration. To convert the process of search in a continuous search space to a binary search space; a TF is used, which is given below.
V ( v i k ( t ) ) = 2 π a r c t a n ( π 2 V i k ( t ) )
x i k ( t + 1 ) = ( x i k ( t ) ) 1 I f r a n d < V ( v i k ( t + 1 ) ) x i k ( t ) I f r a n d V ( v i k ( t + 1 ) )
In Equation (15), v i k ( t ) represents the velocity of the ith bat at tth iteration in the dth dimension, where x i k ( t ) represents the position of the bat at tth iteration in the dth dimension and ( x i k ( t ) ) 1 indicates the compliment of x i k ( t ) . The TF permits the bats to move in a binary search space.

The iBBat Algorithm

The classical bat algorithm has been successfully used for many optimization problems such as continuous optimization in engineering designs, scheduling, classification, clustering and data mining. This algorithm is very flexible and easy to implement. It converges very quickly in a very initial stage by switching from exploration to the exploitation stage, and then the convergence rate slows down. It may also lead to lack of accuracy of solutions because it switches very quickly from exploration to the exploitation stage. To avoid the rapid convergence in computations, we introduce the self-adaptive and repulsive factor, which improves the behavior of each bat globally. This factor will help the bats to increase the possibility of accuracy of solutions in high dimensions, which leads to the overall efficiency of the algorithm.
In the iBBat, we introduce a self-adaptive and repulsive factor to improve the global search potential of BBat algorithm. This element helps the bats to fly over the parts of the search space, where they can find profitable information. To enlarge the neglected search space, the authors in [21] have introduced an interference factor ‘ δ ’ in Equation (17).
δ = 1 , I f r a n d p 1 , e l s e
Calculating the δ , initially we consider the value of p = 0.6. If the value of p is greater than the rand, a reverse search will be performed as given in Equation (17), where the value of p lies in the range [0.1,0.9]. The value of δ is recorded, and the value of p (based on δ ) is adjusted according to the value of the fitness function in each iteration. In iBBat, the flying space of bats is enlarged by including the δ in the flying behavior of bats. Hence, Equation (13) becomes:
X i ( t + 1 ) = X i ( t ) δ + V i ( t + 1 )
The TF is used correspondingly as done in the BBat. The searching procedure of self-adaptive and repulsive factor is given in Algorithm 1. Meanwhile, the proposed algorithm is described in Algorithm 2.
Algorithm 1 Searching procedure of δ
 1:
If Min.Fitness ( x i k ) comes from δ = 1 .
 2:
p=p+0.1.
 3:
If p p m a x then p = p m a x and ip=ip+1.
 4:
else ip=0.
 5:
If i p = i p m a x then p=0.6 and ip=0.
 6:
If Min.Fitness ( x i k ) comes from δ = 1 .
 7:
p=p-0.1.
 8:
If p p m a x then p = p m i n and ip=ip+1.
 9:
else ip=0.
10:
If i p = i p m a x then p=0.6 and ip=0.
11:
end
Algorithm 2 The pseudocode of iBBA
 1:
Initialize the bat population x i .
 2:
Initialize the pulse frequency F i .
 3:
Define the loudness A i and pulse rate r i .
 4:
While (t<max. iterations)
 5:
Update frequency and velocities.
 6:
Update position using Equation (18).
 7:
Calculate TF using Equation (15).
 8:
Update position using Equation (16).
 9:
If (rand)> r i ).
10:
Select Gbest.
11:
Change a few dimensions of position vector with a few dimensions of Gbest.
12:
endif
13:
Generate a new solution by flying randomly.
14:
If(rand < A i & f ( x i ) < Gbest) )
15:
Accept the new solution.
16:
Increase r i and reduce A i
17:
end if
18:
Rank the bats and find the current Gbest.
19:
end

5. Results and Discussions

To validate the results of proposed strategy, we have performed simulations in MATLAB. As discussed earlier that in this work, we have considered 10 smart homes. Every home is equipped with shiftable and fixed appliances. Each consumer can alter their energy usage in compliance to the electricity rate at time ‘t’. On the other hand, the microgrid is composed of WTs, a FC, MT, a PV and an ESS as given in Figure 1. The performance of the proposed strategy has been evaluated in grid-connected and islanded modes of microgrid. Moreover, we have considered a time period of 24 h in this work. The data of PV and WT is acquired from [14,29], respectively and their forecasted output power is given in Table 4 and Table 5. The price of the open market is taken from [14].
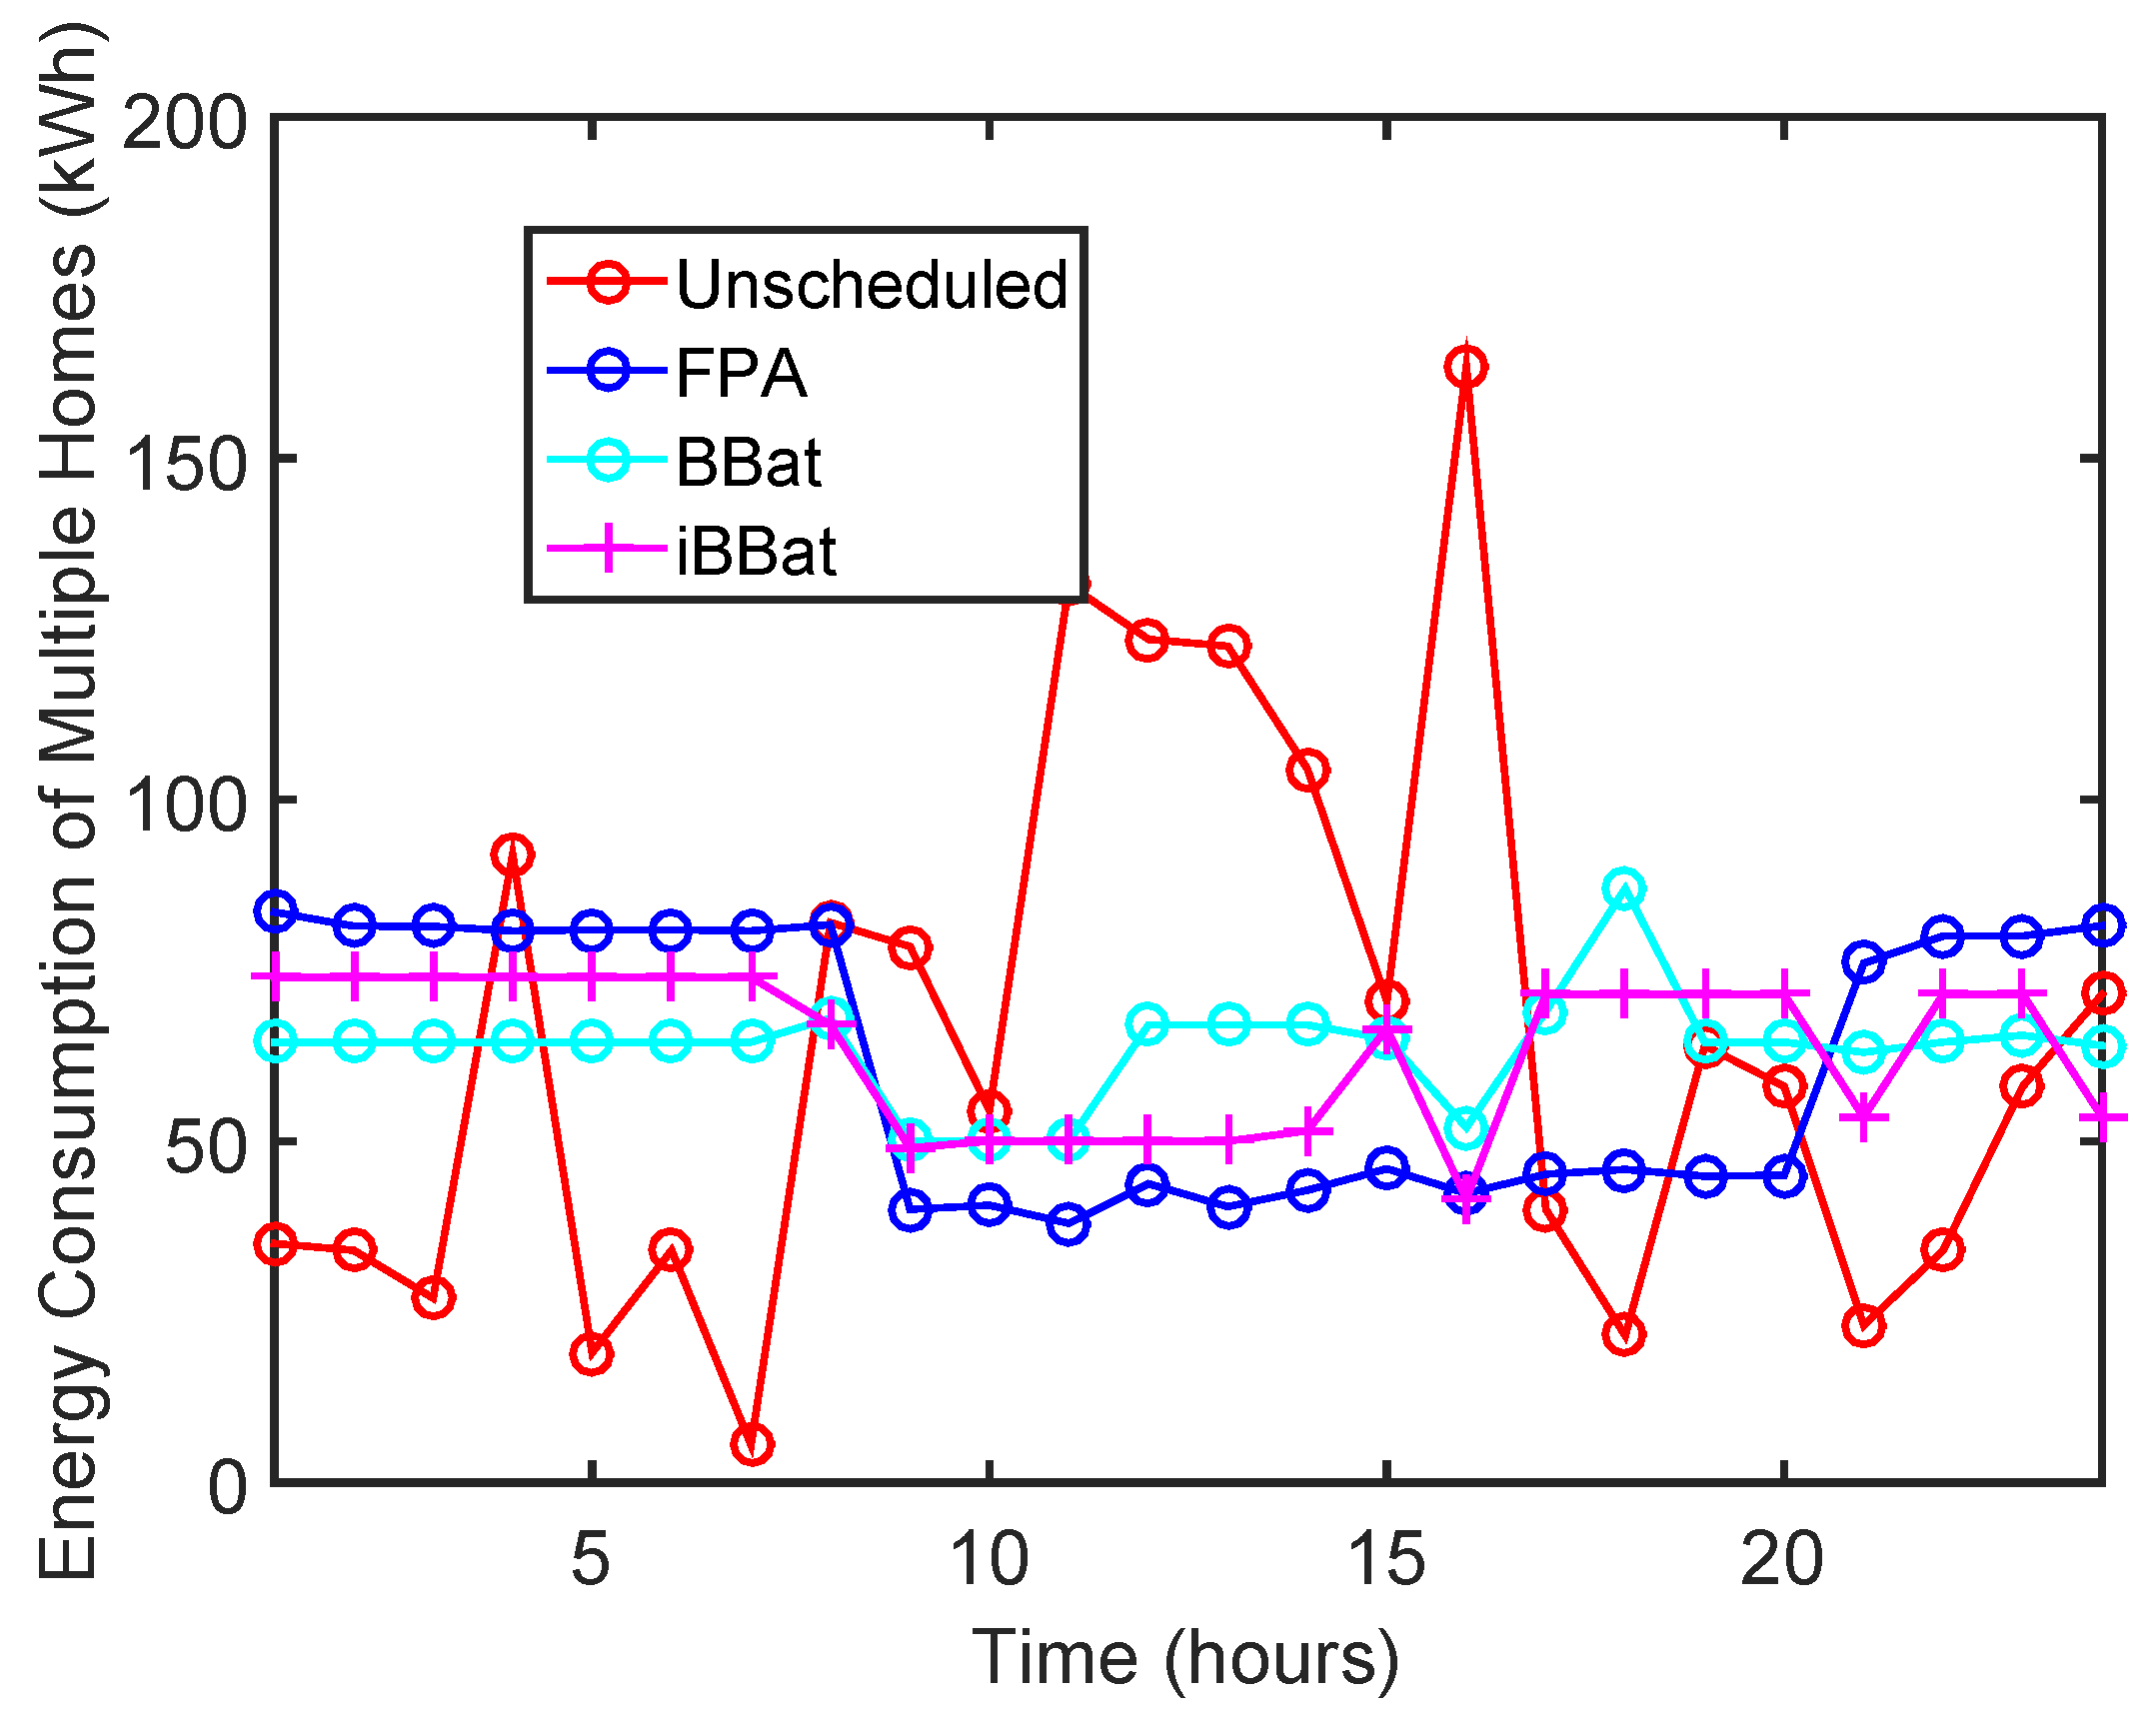
The load demand of each hour of a residential area has been shown in Figure 2. We have used the BFPA, BBat and our proposed technique iBBat to optimally schedule the consumption pattern of a user. As shown in Figure 2, the time duration from 9 a.m.–5 p.m. is considered to be high peak hours because of the high energy consumption. Due to high load demand in these hours, the electricity price is also high. Hence, the high peak hour load is shifted towards the low peak hours, because the electricity cost at these hours is considerably low as compared to the rest of the time slots. Employing this strategy, the power consumption peak is significantly shaved, which consequently results in a uniformly distributed load curve during the day. Moreover, the figure clearly shows that iBBat has reduced the peaks as compared to BFPA and BBat which helps to reduce PAR which the utility favours.
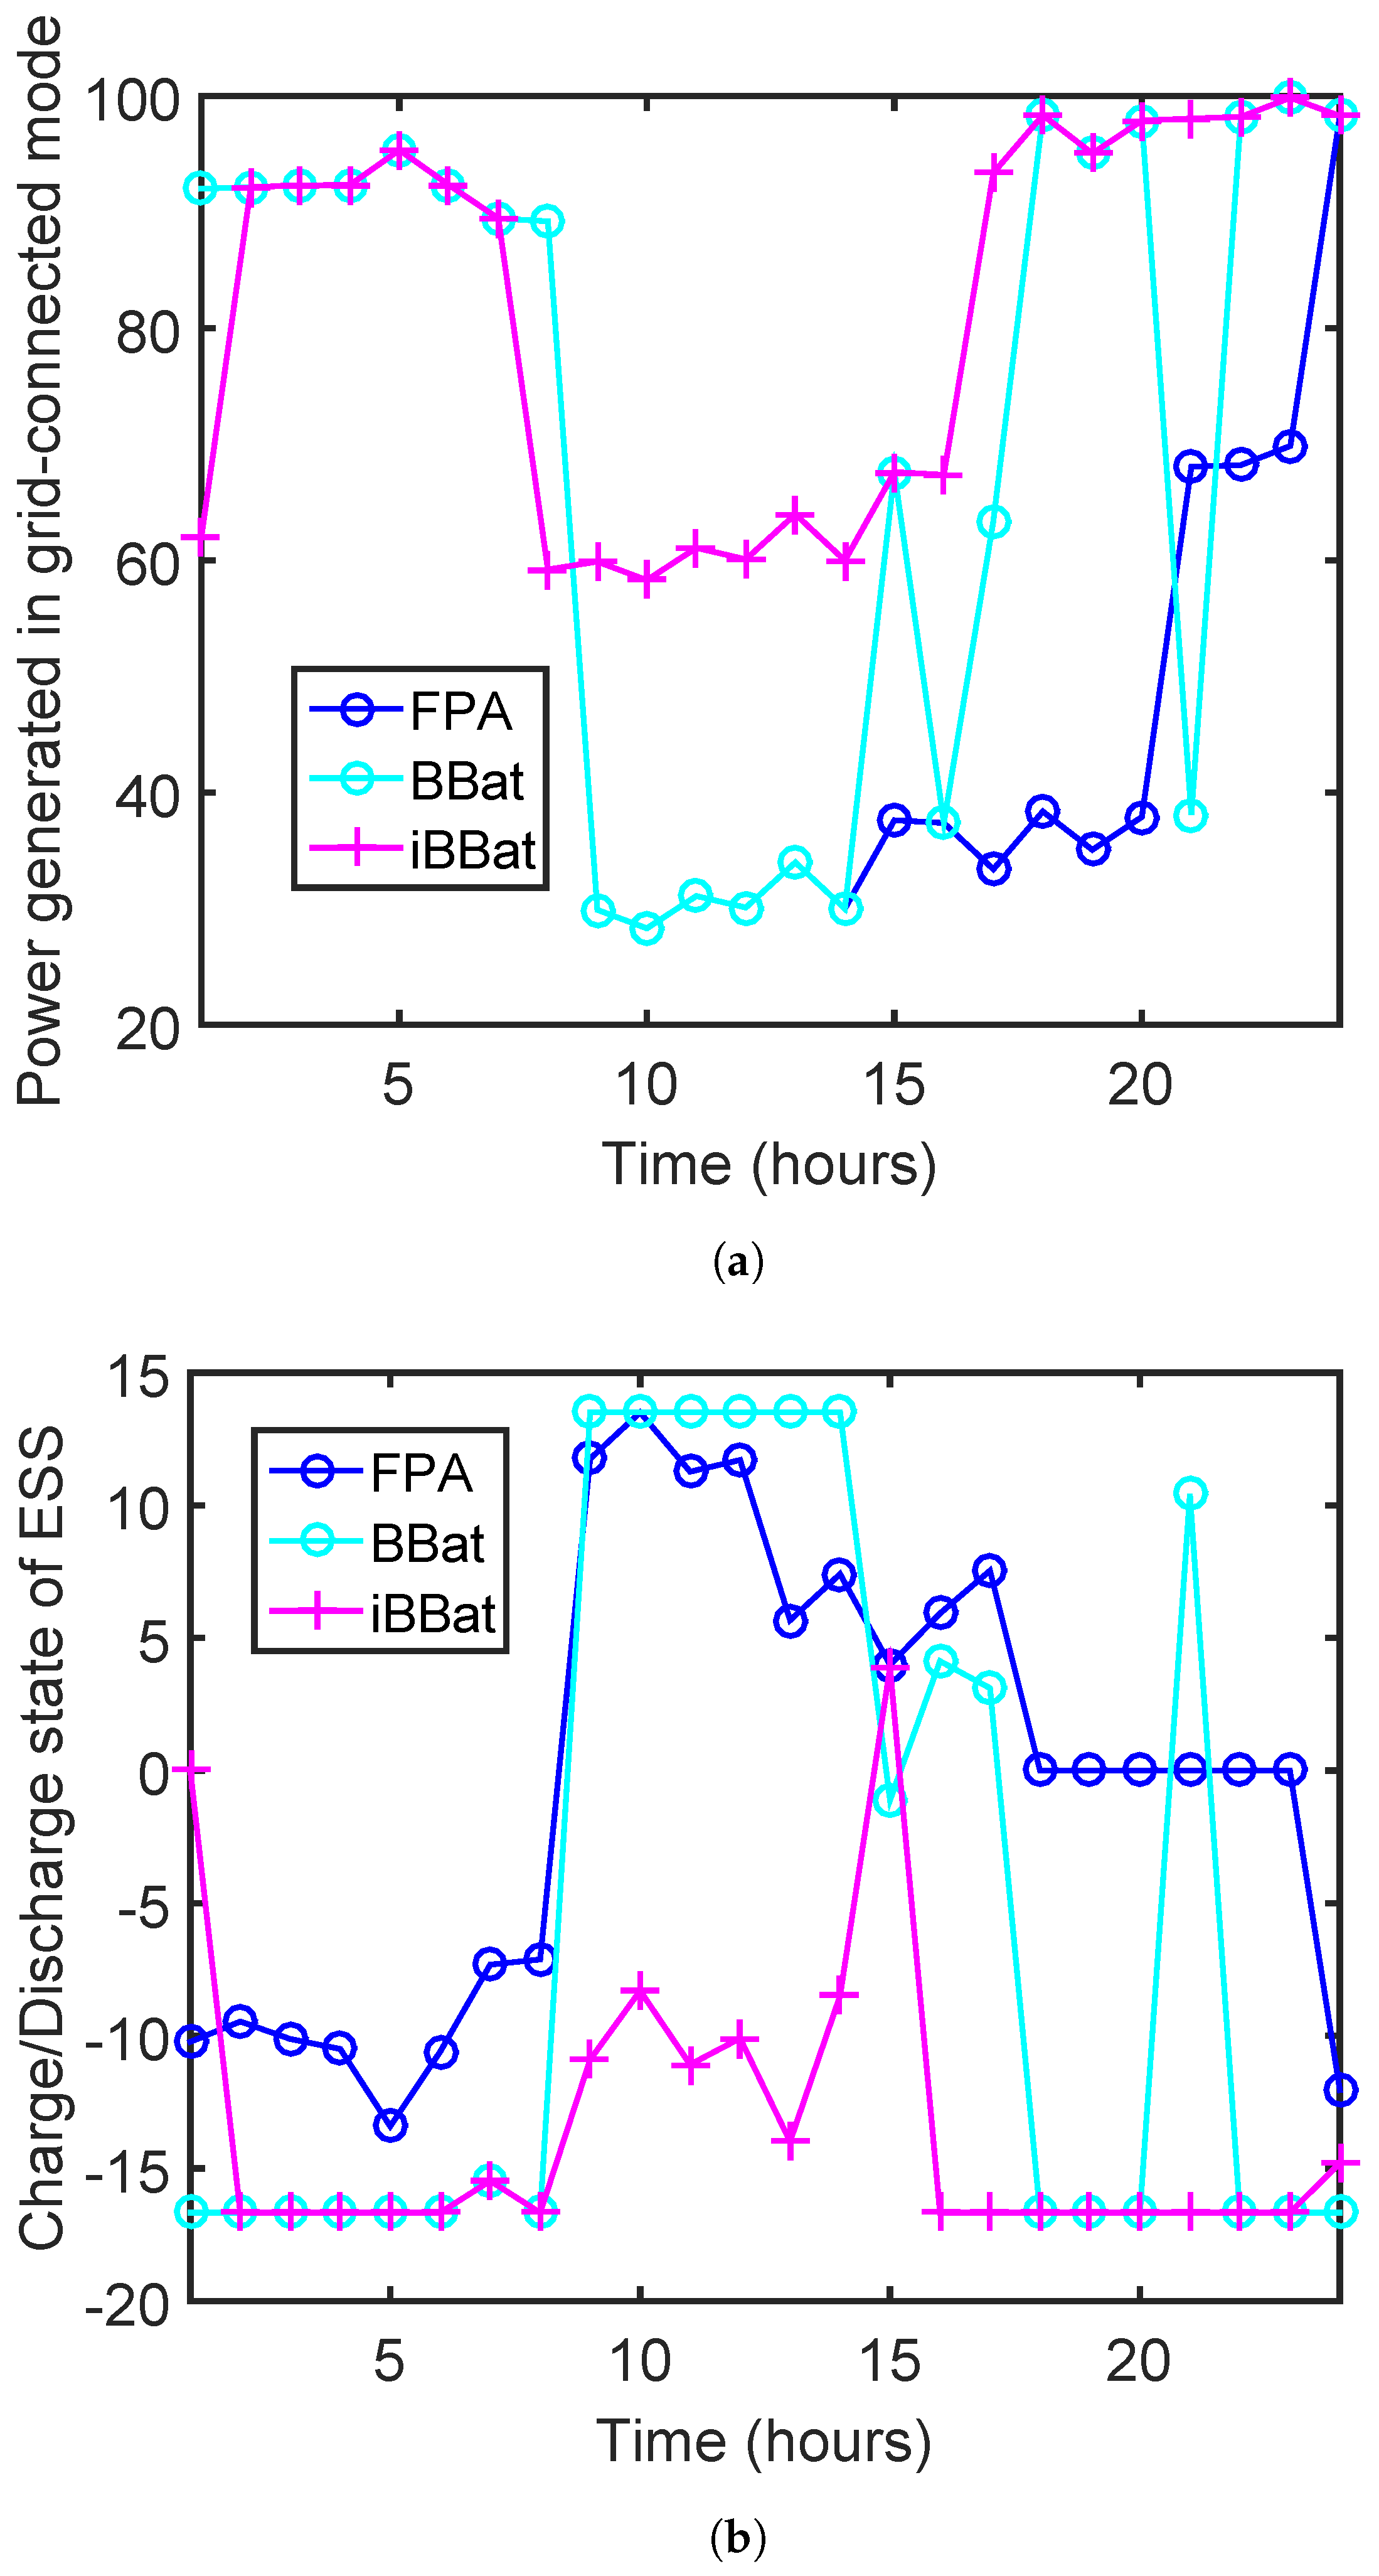
Consequently, the DERs of the microgrid are scheduled by the microgrid scheduler using the techniques that have been used to obtain the optimized consumption patterns of appliances at a home. Figure 3a shows the results in the grid-connected mode. To minimize the operating cost, we have acquired the ON/OFF states of the DERs through scheduling in the grid-connected mode. In this mode, the microgrid scheduler gives high priority to generate energy from RESs because of their eco-friendly nature and low cost of bids. The microgrid scheduler checks if the consumer’s load demand is less at a particular time ’t’ than the microgrid generated power, then the surplus power is used to charge the ESS considering its constraints given in Equations (8) and (9). The charging/discharging states of the ESS are shown in Figure 3b. In this figure, the charging states of ESS are represented by the positive values, while the negative values represent the discharging states of the ESS to meet the consumers’ demand. Otherwise, the surplus power is sold to the main grid. However, in cases when the consumer demand is more than the power generated by the microgrid, then ESS stored power is used to fulfill the load demand at that specific time slot. Still, if the discharge rate of the ESS is less than the required power, then the remaining load demand is satisfied through buying power from the main grid. Table 6 shows bids of DERs considered in this research work [14]. These bids represent the cost at which MT, PV, FC, WTs and ESS generate power on the hourly bases.
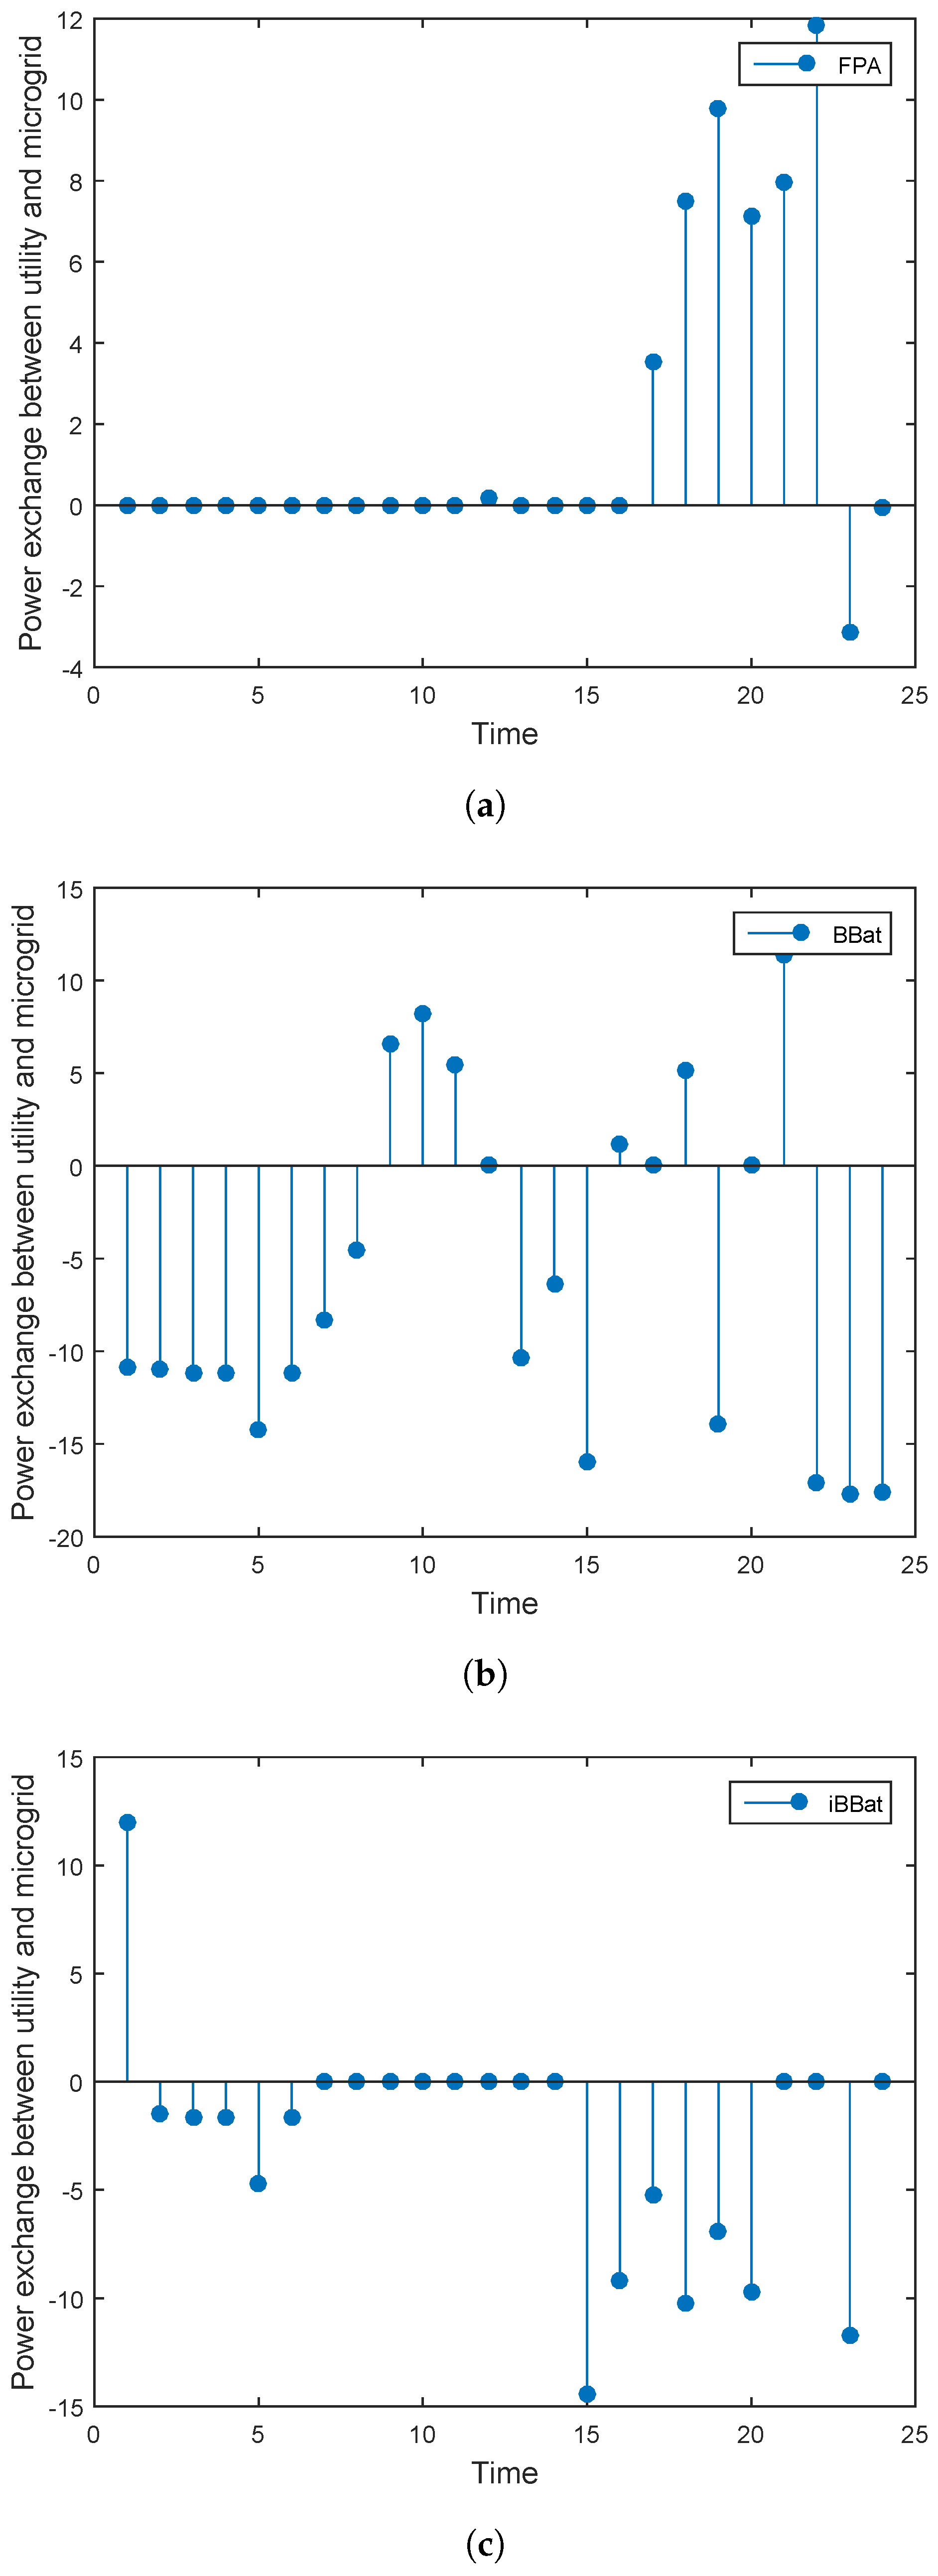
The power exchange between the microgrid and the utility is shown in the Figure 4a–c. Positive stems in these figures illustrate the amount of power bought from the utility grid. The DSM strategy implemented in this research has affected the power exchange. Since the DSM enables consumers to shift their load to low peak hours, less energy is bought from the utility grid in high peak hours. Hence, during low peak hours, the energy bought from the main grid is more as compared to the energy bought from the main grid during high peak hours. Thus, the price of electricity is low in these hours which helps to reduce the overall operating cost. Another observation is that using iBBat the power is bought in only one hour from the utility grid, while in rest of the hours; either the power generated by the DGs is enough or the surplus power is sold back to the utility. At each time slot, the microgrid sells the surplus power at the cost of bids generated by the utility. Hence, the operating cost of the microgrid is further reduced.
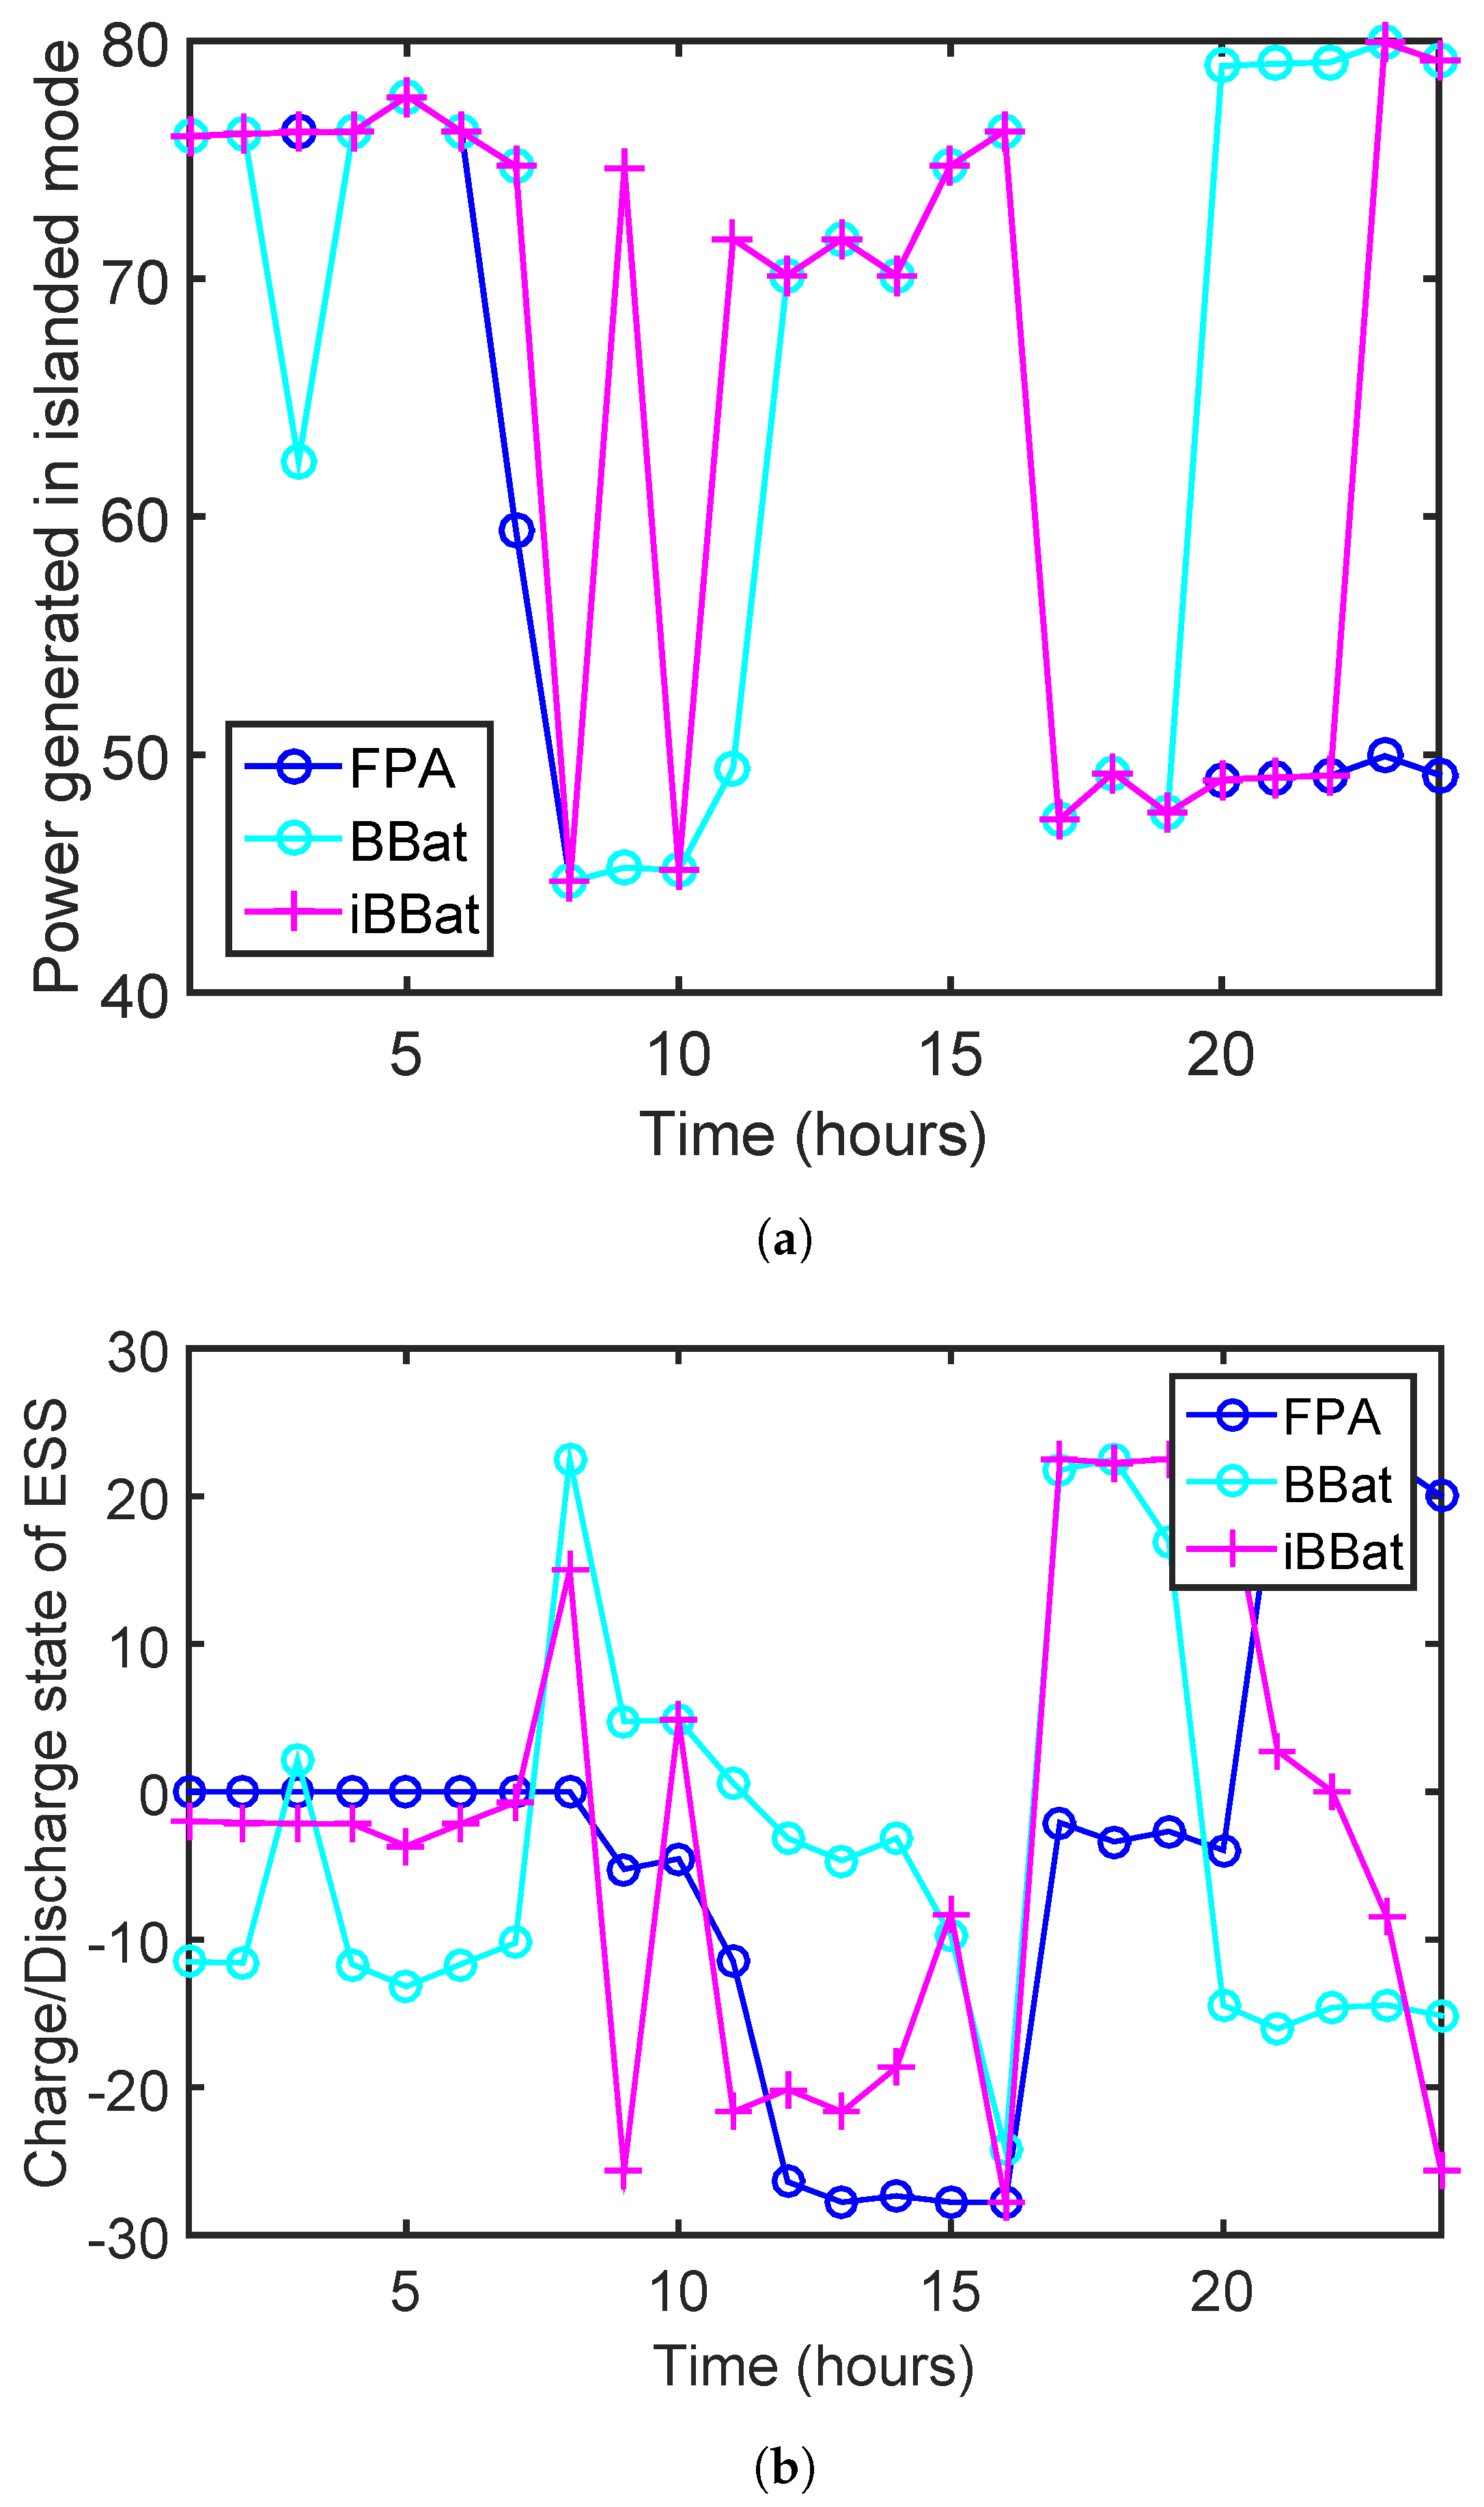
When a microgrid operates in the islanded mode, it focuses on both the economic criteria by providing a stable power supply to the residents. As discussed earlier, the microgrid energy is generated in response to the consumers’ demand. Since, the grid does not communicate to the microgrid in this mode, hence, a dedicated energy resource is required to assure power supply. Because of the irregular nature of RES, the MT and FC are more prioritized to provide a reliable power supply. It defines constraints both to work with their maximum capacities to ensure a continuous power supply. The microgrid scheduler acquires the ON/OFF state of DG sources in such a way to minimize the operating cost. The rest of the DERs are turned on by the scheduler depending on the load in that specific time interval. Figure 5a demonstrates the cumulative behavior of the microgrid resources in the islanded mode to balance the demand and the supply. It is worth mentioning that if the demand of the consumer at any time ’t’ is greater than the supply, then the remaining load is curtailed. To overcome this limitation in this mode, we have enlarged the capacity and charge/discharge rates of the ESS to ensure the power supply, which is enough in the absence of utility grid and to minimize the rate of load shedding.
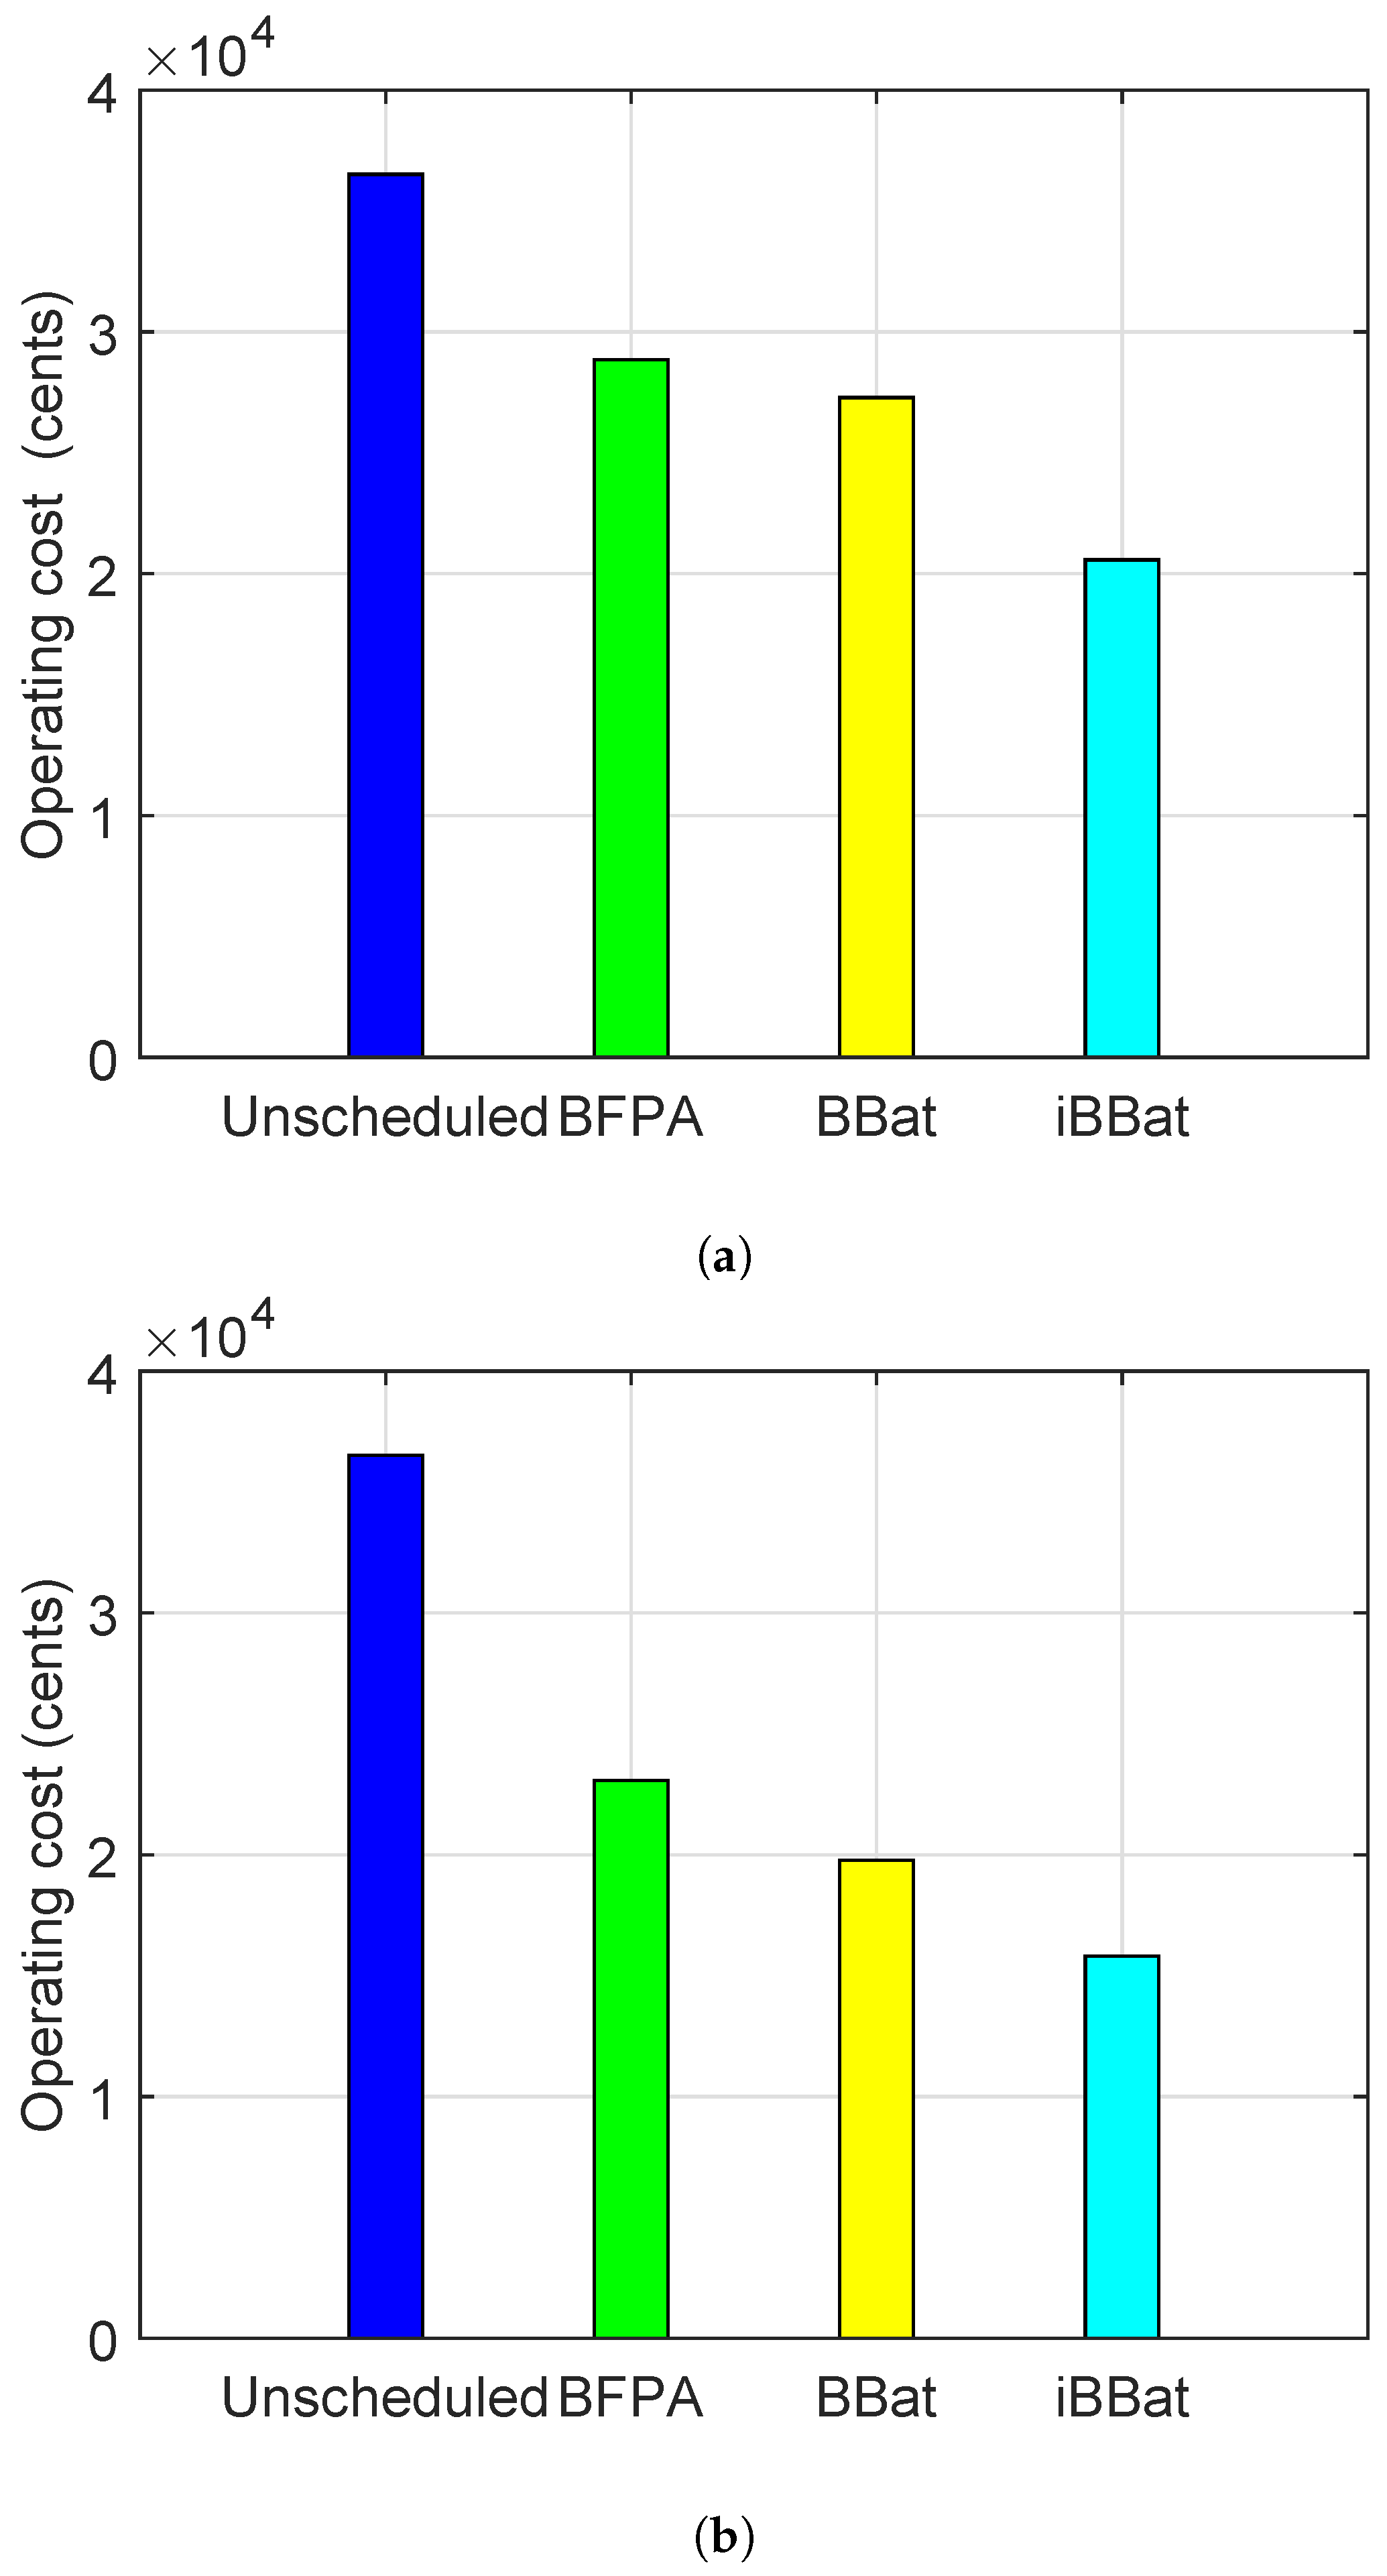
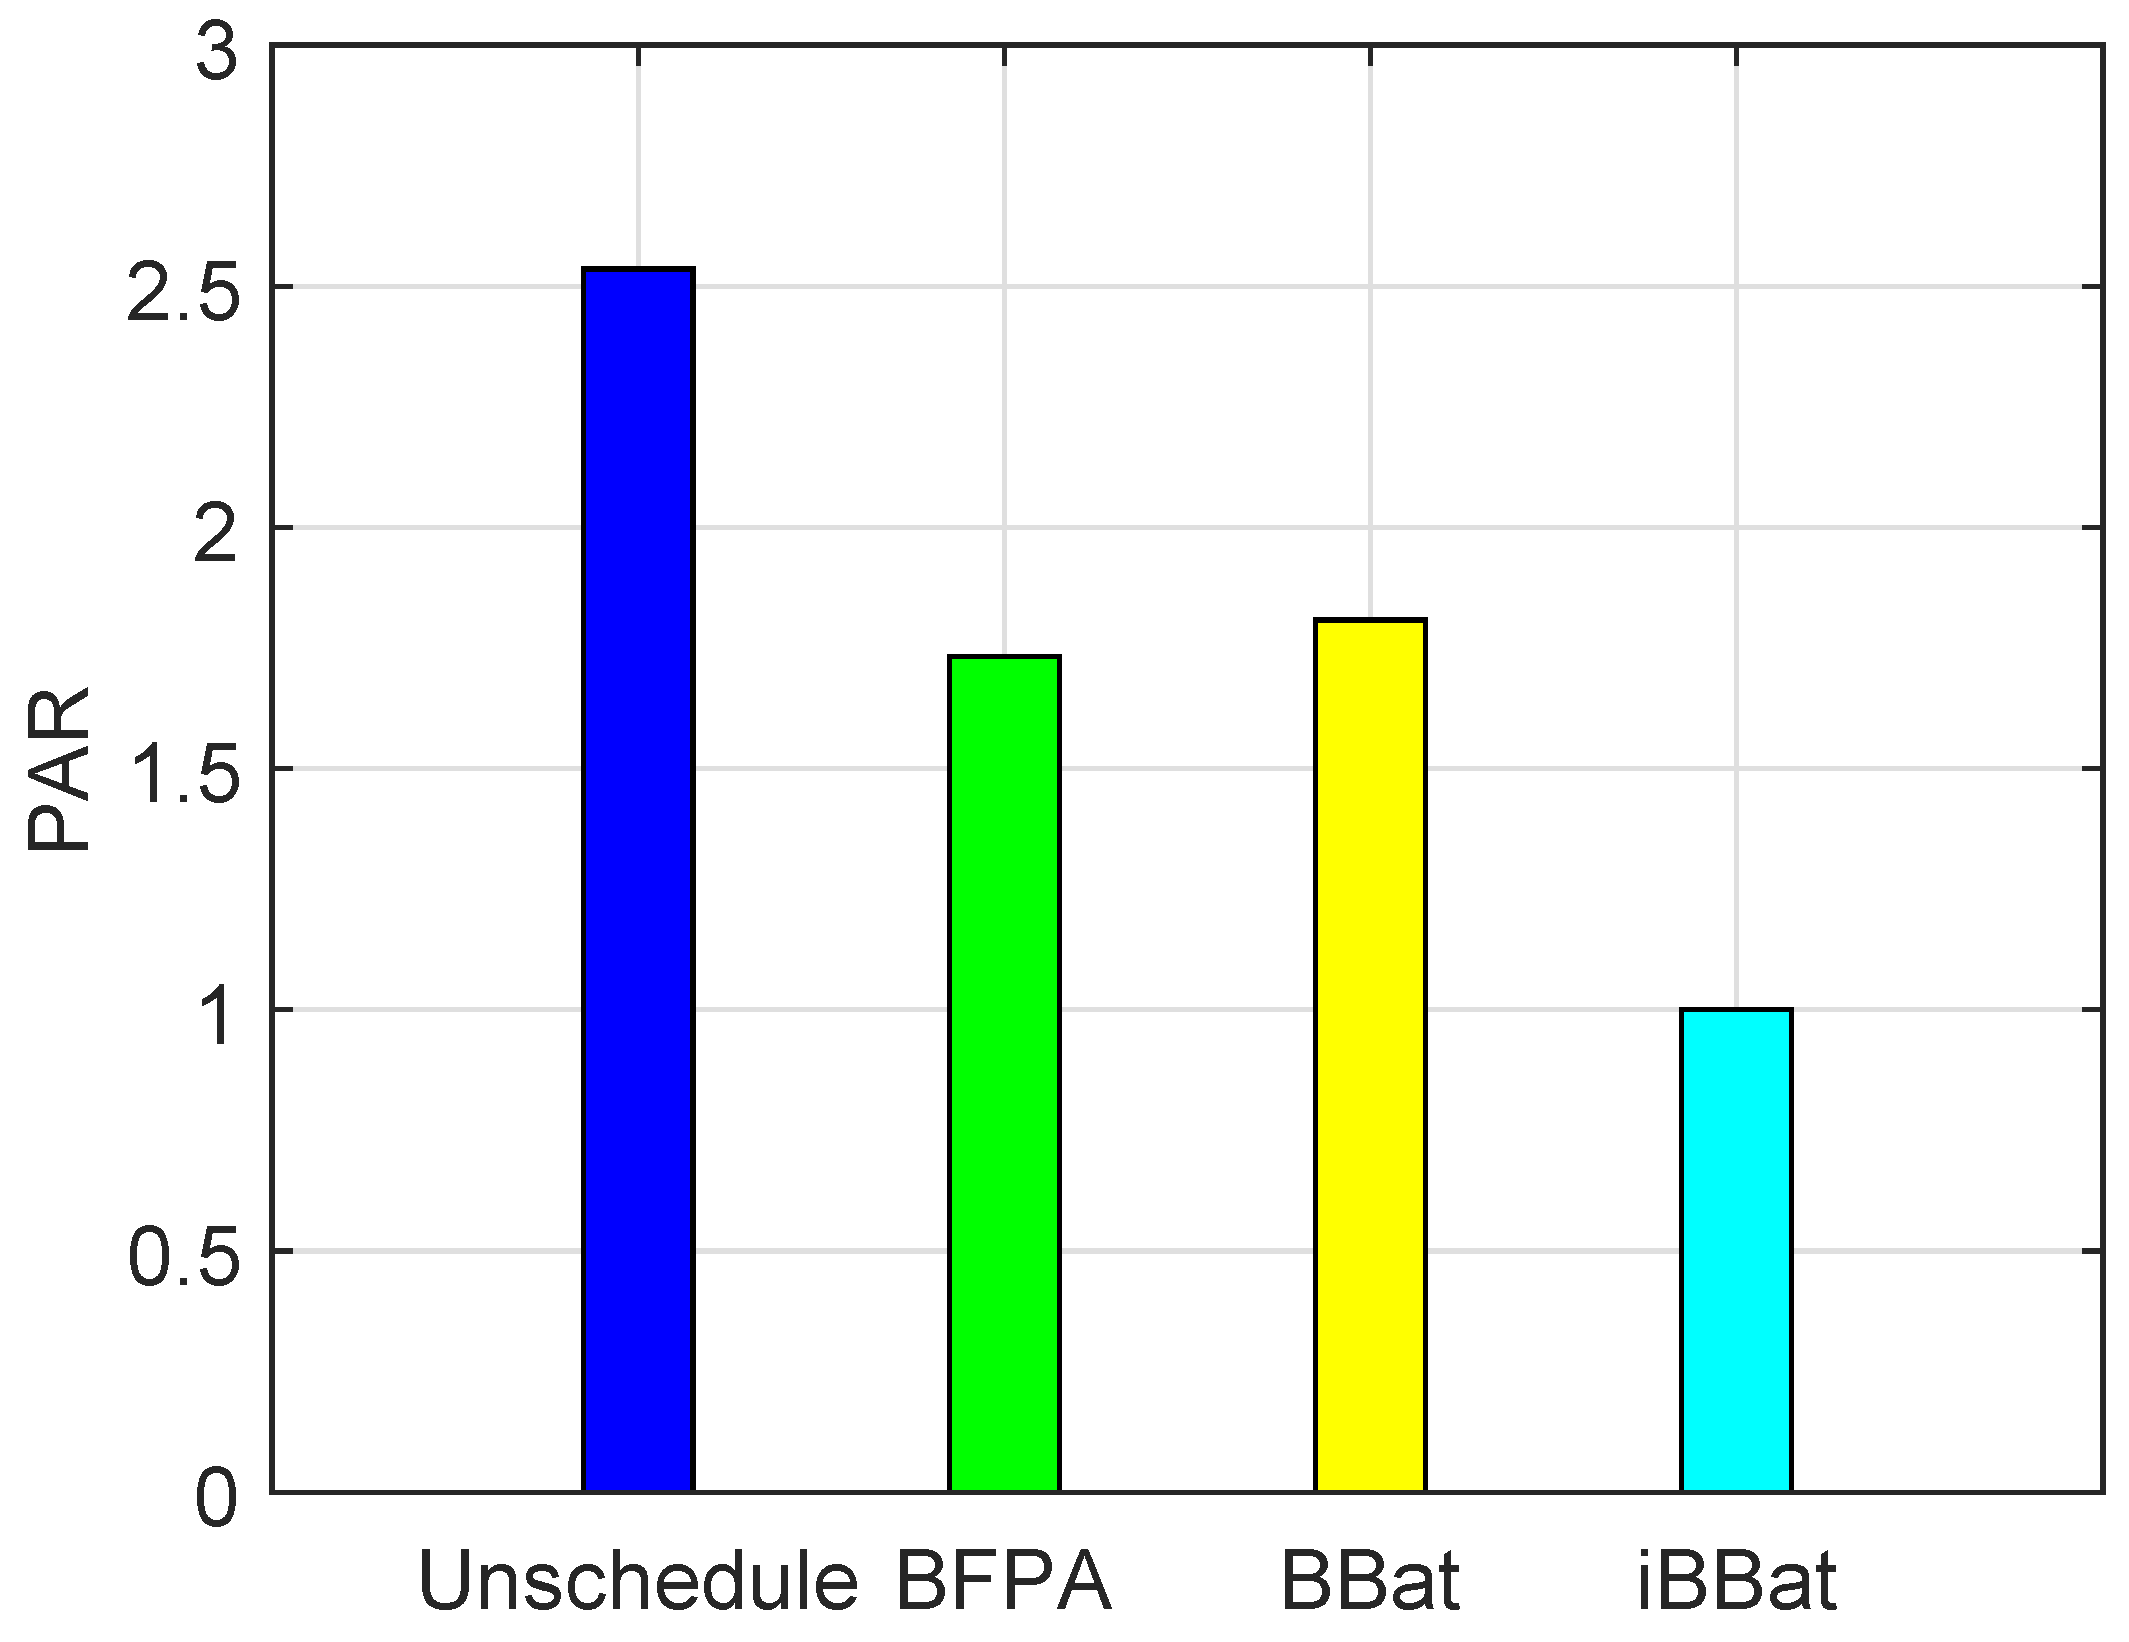
Figure 6a,b represents the overall operating cost of microgrid in the aforementioned modes. It is clear from the Figure 6a that BBat has reduced the operating cost of DG sources in the grid-connected mode involving the cost of power exchange between microgrid and utility grid as compared to BFPA, where the iBBat has significantly reduced the operating cost as compared to BFPA and BBat. Figure 6b illustrates the operating cost of microgrid in the islanded mode. It is clear from the results that iBBat has significantly reduced the operating cost of microgrid as compared to BFPA and BBat. The results given in Figure 7 represent the PAR of utility. It shows that there is a trade-off in the PAR and operating cost using BFPA. Because when cost is increased, then PAR is also increased. However, the iBBat has reduced the PAR as compared to the PAR reduced by BFPA and BBat.

6. Conclusions

In this research work, we have proposed an improved swarm intelligent optimization algorithm to enhance the operations of microgrid for improving the economy and the environmental energy efficiency. The proposed algorithm is of great significance to balance consumers’ demands and energy supply. In this regard, we have considered a residential area in this work and scheduled the load demand of each smart home. At each smart home, DSM strategy is implemented which helps to shave the overall peak of power consumption. For this purpose, an optimization technique, iBBat is introduced in this research work. To achieve our objectives, the DERs of a microgrid use the same optimization technique for scheduling. Moreover, the use of power from main grid is also reduced by the integration of the microgrid in our work, which consequently helps to reduce the PAR. Furthermore, the operating cost of microgrid is calculated in both of the considered modes of microgrid. The results show a significant reduction in the operating cost and PAR using iBBat as compared to the operating cost and PAR using BFPA and BBat algorithm. The operating cost in the grid-connected mode has been reduced to 25% and 23% using iBBat as compared to the operating cost generated using BFPA and BBat, respectively. However, in the islanded mode, the operating cost using iBBat has been reduced to 31% and 20% as compared to the operating cost calculated using BFPA and BBat, respectively. In future, we will improve the performance of our system by considering the parameters of user comfort and its effects on the electricity prices. Moreover, we have planned to incorporate the concept of coordination among multiple microgrids to further optimize the grid system and to reduce the greenhouse gas emission.
Author Contributions

All authors discussed and agreed the idea of the research. S.A., N.J. and T.A.A. performed simulations and wrote the discussion. A.H., Z.W. and A.A. did literature analysis and mathematical modeling. S.A. and N.J. contributed in original draft preparation. T.A.A. and A.H. helped in reviewing and editing.

Funding

This research received no external funding.

Conflicts of Interest

The authors declare no conflict of interest.

Nomenclature

Variables
P W T Mechanical power extracted from the wind [kW]
ρ Density of air [kg/m 3 ]
A W T Area covered by the WT
C p Co-efficient of WT
λ Tip speed ratio of WT
θ Pitch angle of WT’s blades
P P V ( t ) Power generated by PV at time ‘t’
A P V PV array area [w/m 2 ]
η P V PV efficiency
G R ( t ) Intensity of global radiation at time ‘t’
P M T ( t ) Power generation of MT at time ‘t’
P F C ( t ) Power generation of FC at time ‘t’
I F C Current generated by FC
V F C Voltage of FC
P C Maximum portion of capacity added to storage at time ‘t’
t Scheduling interval
S s Aggregate capacity of storage
η C Charging efficiency
η D Discharging efficiency
W h o u r l y Hourly discharge energy of ESS
P m i n Minimum power of DG sources
P m a x Maximum power of DG sources
f a Fixed appliance
f a ϱ , s a ϱ Power rating of fixed and shiftable appliances
E f Energy consumption of fixed appliances
ς f a The ON/OFF status of fixed appliances
s a Shiftable appliance
Power rating of shiftable appliances
E s Energy consumption of shiftable appliances
ς s a The ON/OFF status of shiftable appliances
t α , t β Starting and ending time of shiftable appliances
L D Load demand of consumer
λ t h Load threshold
N G No. of generators
P g e n , i ( t ) Power generation of ith DG at time ‘t’
N E S No. of storage device
P s t , j Power storage of jth device
P u ( t ) Power bought/sold from/to utility at time ‘t’
B g e n , i ( t ) Bids of ith DG
M c , i Maintenance cost of ith DG
s v i State vector demonstrating ON/OFF state of DGs
S g e n , i Startup/Shutdown cost of ith generator
B u ( t ) Bid of utility at time ‘t’
B s t , j ( t ) Bid of storage device at time ‘t’
P g e n , i m i n Minimum power generation of ith DG
P g e n , i m a x Maximum power generation of ith DG
P e x Power exchange between microgrid and utility
P e x m i n Exchange of power between microgrid and main grid
P e x m a x Maximum exchange of power between microgrid and main grid
v i Particle velocity
x i j Position of particle
P b e s t Personal best position found by the particle
P g Best position of particle among the entire population.
AcronymsFull Form
ABCArtificial bee colony
BBatbinary bat
BFPABinary flower pollination algorithm
DERDistributed energy resource
DGDistributed generators
DSMDemand side management
EMSEnergy management system
ESSEnergy storage systems
EVElectric vehicle
FCFuel cell
FPAFlower pollination algorithm
IABCImproved artificial bee colony
iBBatImproved binary bat
MILPMixed integer linear programming
MTMicro turbine
N-RESsNon-renewable energy sources
PARPeak-to-average ratio
PCCPoint of common coupling
PVPhotovoltaic
RESsRenewable energy sources
WTWind turbine

References

  1. Tayab, U.B.; Roslan, M.A.B.; Hwai, L.J.; Kashif, M. A review of droop control techniques for microgrid. Renew. Sustain. Energy Rev. 2017, 76, 717–727. [Google Scholar] [CrossRef]
  2. Global Greenhouse Gas Emissions Data. Available online: https://www.epa.gov/ghgemissions/global-greenhouse-gas-emissions-data (accessed on 6 April 2017).
  3. Lombardi, P.; Sokolnikova, T.; Suslov, K.; Voropai, N.; Styczynski, Z.A. Isolated power system in Russia: A chance for renewable energies. Renew. Energy 2016, 90, 532–541. [Google Scholar] [CrossRef]
  4. Bahmani-Firouzi, B.; Azizipanah-Abarghooee, R. Optimal sizing of battery energy storage for micro-grid operation management using a new improved bat algorithm. Int. J. Electr. Power Energy Syst. 2014, 56, 42–54. [Google Scholar] [CrossRef]
  5. Abbasi, B.Z.; Javaid, S.; Bibi, S.; Khan, M.; Malik, M.N.; Butt, A.A.; Javaid, N. Demand side management in smart grid by using flower pollination algorithm and genetic algorithm. In International Conference on P2P, Parallel, Grid, Cloud and Internet Computing; Springer: Cham, Switzerland, 2017; pp. 424–436. [Google Scholar]
  6. Zhang, J.; Wu, Y.; Guo, Y.; Wang, B.; Wang, H.; Liu, H. A hybrid harmony search algorithm with differential evolution for day-ahead scheduling problem of a microgrid with consideration of power flow constraints. Appl. Energy 2016, 183, 791–804. [Google Scholar] [CrossRef]
  7. Rasheed, M.B.; Javaid, N.; Ahmad, A.; Awais, M.; Khan, Z.A.; Qasim, U.; Alrajeh, N. Priority and delay constrained demand side management in real-time price environment with renewable energy source. Int. J. Energy Res. 2016, 40, 2002–2021. [Google Scholar] [CrossRef]
  8. Sukumar, S.; Mokhlis, H.; Mekhilef, S.; Naidu, K.; Karimi, M. Mix-mode energy management strategy and battery sizing for economic operation of grid-tied microgrid. Energy 2017, 118, 1322–1333. [Google Scholar] [CrossRef]
  9. Newbery, D.; Pollitt, M.G.; Ritz, R.A.; Strielkowski, W. Market design for a high-renewables European electricity system. Renew. Sustain. Energy Rev. 2018, 91, 695–707. [Google Scholar] [CrossRef]
  10. Pham, T. Do German renewable energy resources affect prices and mitigate market power in the French electricity market? Appl. Econ. 2019, 51, 5829–5841. [Google Scholar] [CrossRef]
  11. Bigerna, S.; Bollino, C.A.; Polinori, P. Renewable energy and market power in the Italian electricity market. Energy J. 2016, 37, 123–145. [Google Scholar] [CrossRef]
  12. Reddy, S.S.; Park, J.Y.; Jung, C.M. Optimal operation of microgrid using hybrid differential evolution and harmony search algorithm. Front. Energy 2016, 10, 355–362. [Google Scholar] [CrossRef]
  13. Roy, K.; Mandal, K.K.; Mandal, A.C. Modeling and managing of micro grid connected system using improved artificial bee colony algorithm. Int. J. Electr. Power Energy Syst. 2016, 75, 50–58. [Google Scholar] [CrossRef]
  14. Motevasel, M.; Seifi, A.R. Expert energy management of a micro-grid considering wind energy uncertainty. Energy Convers. Manag. 2014, 83, 58–72. [Google Scholar] [CrossRef]
  15. Hu, W.; Wang, P.; Gooi, H.B. Toward optimal energy management of microgrids via robust two-stage optimization. IEEE Trans. Smart Grid 2018, 9, 1161–1174. [Google Scholar] [CrossRef]
  16. Arcos-Aviles, D.; Pascual, J.; Marroyo, L.; Sanchis, P.; Guinjoan, F. Fuzzy logic-based energy management system design for residential grid-connected microgrids. IEEE Trans. Smart Grid 2018, 9, 530–543. [Google Scholar] [CrossRef]
  17. Sugumar, G.; Selvamuthukumaran, R.; Novak, M.; Dragicevic, T. Supervisory Energy-Management Systems for Microgrids: Modeling and Formal Verification. IEEE Ind. Electron. Mag. 2019, 13, 26–37. [Google Scholar] [CrossRef]
  18. Zhang, D.; Evangelisti, S.; Lettieri, P.; Papageorgiou, L.G. Economic and environmental scheduling of smart homes with microgrid: DER operation and electrical tasks. Energy Convers. Manag. 2016, 110, 113–124. [Google Scholar] [CrossRef]
  19. Li, W.; Logenthiran, T.; Woo, W.L. Intelligent multi-agent system for smart home energy management. In Proceedings of the 2015 IEEE Innovative Smart Grid Technologies-Asia (ISGT ASIA), Bangkok, Thailand, 3–6 November 2015; pp. 1–6. [Google Scholar]
  20. Rahim, S.; Javaid, N.; Ahmad, A.; Khan, S.A.; Khan, Z.A.; Alrajeh, N.; Qasim, U. Exploiting heuristic algorithms to efficiently utilize energy management controllers with renewable energy sources. Energy Build. 2016, 129, 452–470. [Google Scholar] [CrossRef]
  21. Lin, W.-M.; Tu, C.-S.; Tsai, M.-T. Energy management strategy for microgrids by using enhanced bee colony optimization. Energies 2015, 9, 5. [Google Scholar] [CrossRef]
  22. Galvan, L.; Navarro, J.M.; Galvan, E.; Carrasco, J.M.; Alcantara, A. Optimal Scheduling of Energy Storage Using A New Priority-Based Smart Grid Control Method. Energies 2019, 12, 579. [Google Scholar] [CrossRef]
  23. Abid, S.; Zafar, A.; Khalid, R.; Javaid, S.; Qasim, U.; Khan, Z.A.; Javaid, N. Managing energy in smart homes using binary particle swarm optimization. In Conference on Complex, Intelligent, and Software Intensive Systems; Springer: Cham, Switzerland, 2017; pp. 189–196. [Google Scholar]
  24. Fister, I.; Yang, X.-S.; Fong, S.; Zhuang, Y. Bat algorithm: Recent advances. In Proceedings of the 2014 IEEE 15th International Symposium on Computational Intelligence and Informatics (CINTI), Budapest, Hungary, 19–21 November 2014; pp. 163–167. [Google Scholar]
  25. Rodrigues, D.; Yang, X.-S.; de Souza, A.N.; Papa, J.P. Binary flower pollination algorithm and its application to feature selection. In Recent Advances in Swarm Intelligence and Evolutionary Computation; Springer: Cham, Switzerland, 2015; pp. 85–100. [Google Scholar]
  26. Azri, M.; Mubin, A.N.A.; Ibrahim, Z.; Rahim, N.A.; Raihan, S.R.S. MATHEMATICAL MODELLING FOR PROTON EXCHANGE MEMBRANE FUEL CELL (PEMFC). J. Theor. Appl. Inf. Technol. 2016, 86, 409. [Google Scholar]
  27. Rajesh, K.S.; Dash, S.S.; Rajagopal, R.; Sridhar, R. A review on control of ac microgrid. Renew. Sustain. Energy Rev. 2017, 71, 814–819. [Google Scholar] [CrossRef]
  28. Mirjalili, S.; Mirjalili, S.M.; Yang, X.-S. Binary bat algorithm. Neural Comput. Appl. 2014, 25, 663–681. [Google Scholar] [CrossRef]
  29. Chen, C.; Duan, S.; Cai, T.; Liu, B.; Hu, G. Smart energy management system for optimal microgrid economic operation. IET Renew. Power Gener. 2011, 5, 258–267. [Google Scholar] [CrossRef]
Figure 1. The proposed energy management strategy for viable microgrid modes.
Electronics 08 01442 g001
Figure 2. Energy consumption patterns of a residential area.
Electronics 08 01442 g002
Figure 3. Grid-connected modes: (a) Power generated by DGs, (b) Charge/Discharge state of ESS.
Electronics 08 01442 g003
Figure 4. Two modes: power exchange between utility and microgrid using (a) BFPA (b) BBat (c) iBBat.
Electronics 08 01442 g004
Figure 5. Two islanded modes: (a) power generated by DGs. (b) charge/discharge state of ESS.
Electronics 08 01442 g005
Figure 6. Two modes: operating cost in the (a) grid-connected mode (b) islanded mode.
Electronics 08 01442 g006
Figure 7. PAR of utility grid.
Electronics 08 01442 g007
Table 1. Comparison of the system model with existing work in the literature.
AuthorsDSM StrategyPower Generation SchedulingMicrogrid Modes
Motevasel et al. [14] Grid-Connected
Zhang et al. [18] Grid-Connected
Lin et al. [21] Grid-connected & Islanded Modes
Galvan et al. [22] Grid-Connected
Samia et al. [23] Grid-Connected
Proposed workGrid-Connected & Islanded Modes
Table 2. Parameters of installed generation sources.
Sources P min (kWh) P max (kWh)Start Up/Shut Down Cost (Cents/kWh)
MT103010.7
FC53013.8
PV0200
WT10200
WT20200
ESS−15150
Table 3. Parameters of appliances.
Shiftable Appliance t α t β s a ϱ (kWh)Fixed Appliances f a ϱ (kWh)
Washing Machine390.5Fridge0.4
Cloth Dryer4104Light0.1
Dish Washer6231.5Kettle3
EV1243Toaster1.8
Air Conditioner191.8Television0.15
Lawn Mower5101.4
Vacuum Cleaner7120.7
Microwave Oven16221.7
Table 4. Power generated by PV in kWh.
Time (hours)123456789101112
P P V 00000000.10.62810
Time (hours)131415161718192021222324
P P V 1188510.1000000
Table 5. Power generated by WT in kWh.
Time (hours)123456789101112
P W T 16.0116.116.216.217.916.214.714.614.713.211.710.2
Time (hours)131415161718192021222324
P W T 11.710.214.81616.21918191919.22019.2
Table 6. Bids of DG sources (Cents/kWh).
HourMTFCPVWT1WT2ESS
18.2312.7702.12.111.92
28.2312.7701.71.711.92
38.3112.8501.251.2512.69
48.3112.901.11.113.46
58.3812.8505.15.114.23
68.3812.9208.58.515.0
78.4612.9209.19.115.77
88.5413.06.46111116.08
98.6213.086.54141416.62
108.6213.156.6214.314.316.77
118.9213.236.6915.015.017.31
129.013.156.7715.515.517.69
138.8513.086.6213.713.716.92
148.8513.086.5413.513.516.0
158.8513.086.4613.213.215.38
169.013.156.3811.411.415.0
179.0813.316.3811.011.015.23
189.1513.316.629.259.2515.0
199.0813.3809.19.114.62
208.8513.3108.38.314.62
218.6213.1503.33.314.31
228.4613.0802.52.513.85
238.3813.002.12.113.46
248.3112.8501.71.712.69