Article

Automated Low-Cost Photogrammetric Acquisition of 3D Models from Small Form-Factor Artefacts

1
Department of Engineering, Manchester Metropolitan University, Manchester M1 5GD, UK
2
School of Computing and Mathematics, Keele University, Staffordshire ST5 5BG, UK
3
Institut für Archäologische Wissenschaften, Goethe-Universität, D-60629 Frankfurt, Germany
4
School of Computer Science, University of Nottingham Ningbo China, Ningbo 315100, China
*
Author to whom correspondence should be addressed.
Electronics 2019, 8(12), 1441; https://doi.org/10.3390/electronics8121441
Submission received: 10 November 2019 / Revised: 22 November 2019 / Accepted: 26 November 2019 / Published: 1 December 2019
(This article belongs to the Section Computer Science & Engineering)

Abstract

:
The photogrammetric acquisition of 3D object models can be achieved by Structure from Motion (SfM) computation of photographs taken from multiple viewpoints. All-around 3D models of small artefacts with complex geometry can be difficult to acquire photogrammetrically and the precision of the acquired models can be diminished by the generic application of automated photogrammetric workflows. In this paper, we present two versions of a complete rotary photogrammetric system and an automated workflow for all-around, precise, reliable and low-cost acquisitions of large numbers of small artefacts, together with consideration of the visual quality of the model textures. The acquisition systems comprise a turntable and (i) a computer and digital camera or (ii) a smartphone designed to be ultra-low cost (less than $150). Experimental results are presented which demonstrate an acquisition precision of less than 40 μ m using a 12.2 Megapixel digital camera and less than 80 μ m using an 8 Megapixel smartphone. The novel contribution of this work centres on the design of an automated solution that achieves high-precision, photographically textured 3D acquisitions at a fraction of the cost of currently available systems. This could significantly benefit the digitisation efforts of collectors, curators and archaeologists as well as the wider population.

1. Introduction

In recent years, the loss, damage and destruction of cultural artefacts in the Middle East has captured worldwide attention [1] and has motivated digital preservation and virtual conservation efforts. For example, Rekrei (formerly Project Mosul) [2] and The Million Image Database Project [3] are projects that collect and curate photographs to digitally preserve heritage and to create 3D models of current, lost, or at risk heritage.
The inspiration for the work presented here was the challenge of resourcing 3D models for the Virtual Cuneiform Tablet Reconstruction Project [4,5,6]. Cuneiform is one of the earliest known systems of writing. Emerging from a simple system of pictograms some five thousand years ago, the script evolved into a sophisticated writing system for communication in several languages. Cuneiform signs were formed with wedge-shaped impressions in hand-held clay tablets. It was the original portable information technology, and it remained in use for over three thousand years in Mesopotamia, the region in and around modern day Iraq and Syria.
Excavated cuneiform tablets are typically fragmented and their reconstruction poses a puzzle of considerable complexity [7]. The puzzle’s “pieces” are small complex 3D forms (the dimensions of 8000 catalogued tablets extracted from the Cuneiform Digital Library Initiative (CDLI) database [8] had an average width and length of 4.3 and 5.1 cm, respectively [9]), they belong to an unknown number of complete or incomplete tablets, and they are distributed within and between museum collections worldwide.
Many thousands of inscribed cuneiform tablet fragments have been excavated in the last 200 years; the largest collections include those of the British Museum in London, the Penn Museum in Philadelphia, the Iraq Museum in Baghdad, and the Louvre in Paris. Virtual reconstruction of the tablets obviates issues such as geographical distance as well as practical issues concerning the necessarily limited accessibility and the physical fragility of the fragments [10]. It also makes possible the use of computer-automated matching tools [11].
A significant challenge in the virtual reconstruction of fragmented artefacts is the acquisition of the virtual artefacts themselves [12]. Conventional laser scanners and structured light scanners are costly and not easily portable. In addition, the scanning process can be labour intensive, requiring training and skills in order to acquire partial 3D models from multiple viewpoints before manually ‘stitching’ the parts together to form a complete 3D mesh. Similar problems affect the usability of ‘dome’ techniques such as Photometric Stereo [13,14] that can only acquire a single hemisphere at a time.
The potential of photogrammetric acquisition for digital heritage is well-established [15]. Ahmadabadian et al. [16] demonstrated that, with sufficient numbers of photographs and robust calibration procedures, precisions comparable to laser scans can be achieved. However, photogrammetric acquisition of ‘problematic’ artefacts such as small form-factor objects with challenging texture, optical properties or complex geometry can be achieved but requires “high attention and experience” to image acquisition [17]. In addition, even with the highest quality images, generic unadapted application of automated photogrammetric workflows can diminish the quality of the 3D model [18].
In multi-viewpoint photogrammetric acquisition [19], sets of photographs are obtained by moving a camera around an object as illustrated in Figure 1A. This ensures that the lighting conditions remain constant and that there are no changes to background features that could confuse the reconstruction processing. In the rotary photogrammetric approach proposed here, the camera is fixed on a tripod and the object is rotated by a turntable as shown in Figure 1B. Lighting conditions are kept constant by the use of a diffuse, overhead, central light source and background features are eliminated by the use of a matt, monochrome tabletop cover.
It is impossible to completely reconstruct an artefact from a single set of photographs gathered using a turntable because there will be no information about the underside of the object. The conventional solution is to take several scans with the object in different orientations and then to merge the resulting models to form a single 3D mesh using a point-cloud registration technique such as the iterative closest point algorithm [20]. This works well for non-textured models, but, when texture mapping is applied, the appearance can be unsatisfactory. In areas where the meshes from two or more different partial models intersect, the texture can have a ‘patchy’ appearance due to the different illuminations of each viewpoint and, at the boundaries of each partial model, ‘seams’ can be observed for the same reason [21]. An automated solution to this problem that integrates point-cloud registration, meshing, and texture mapping processes is described in this paper.
The rotary photogrammetric acquisition method and the camera and smartphone versions of the system are described in Section 2, and the signal processing workflow is described in Section 2.4. Experimental results evaluating the precision of the system are presented in Section 3.

2. Material and Methods

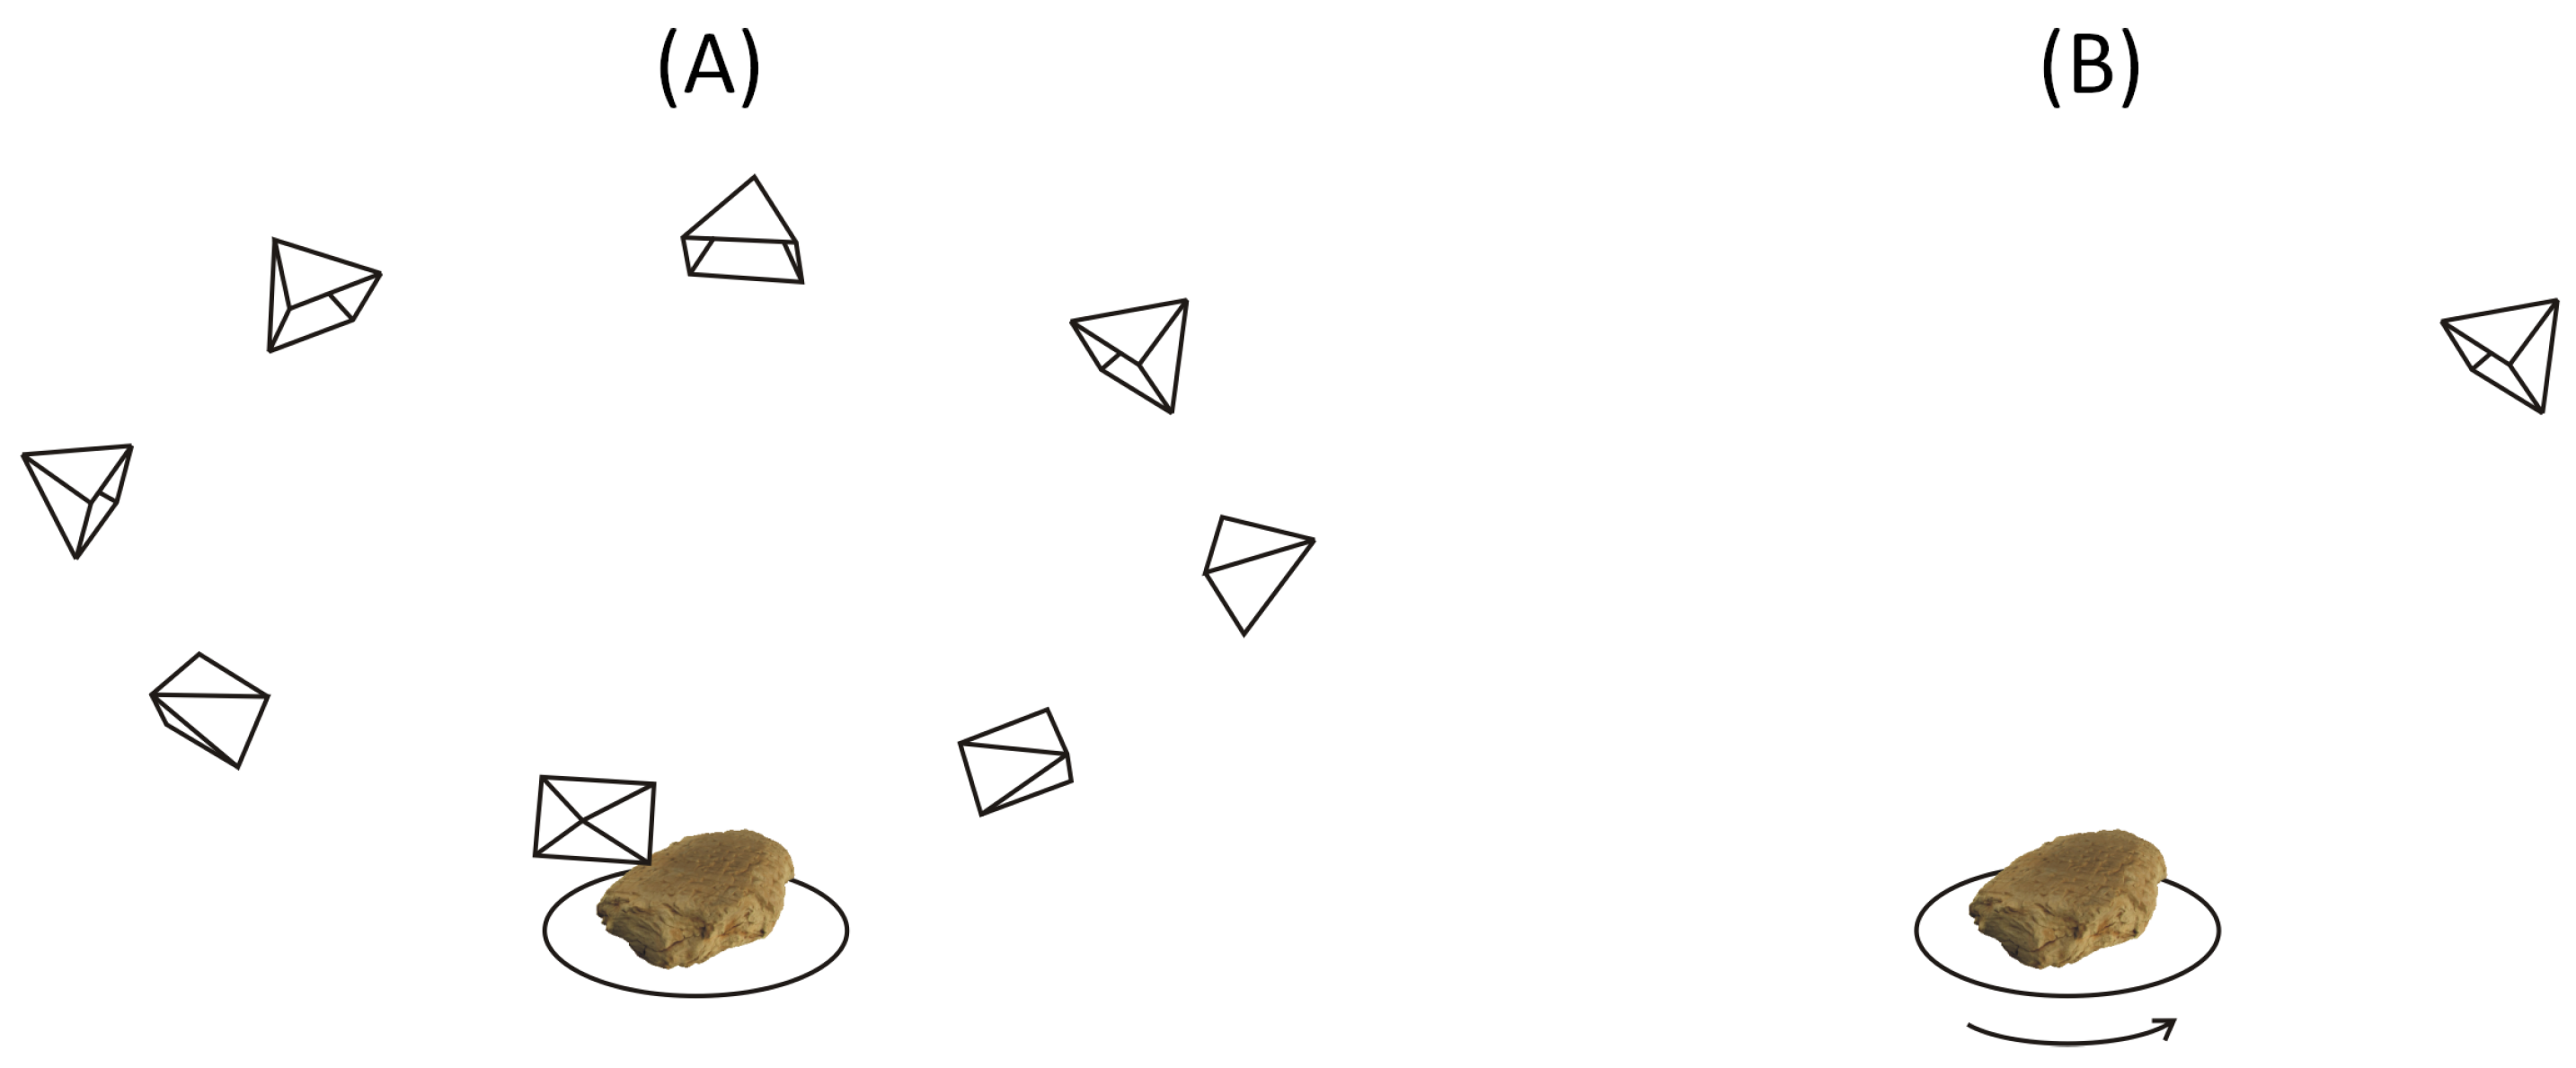
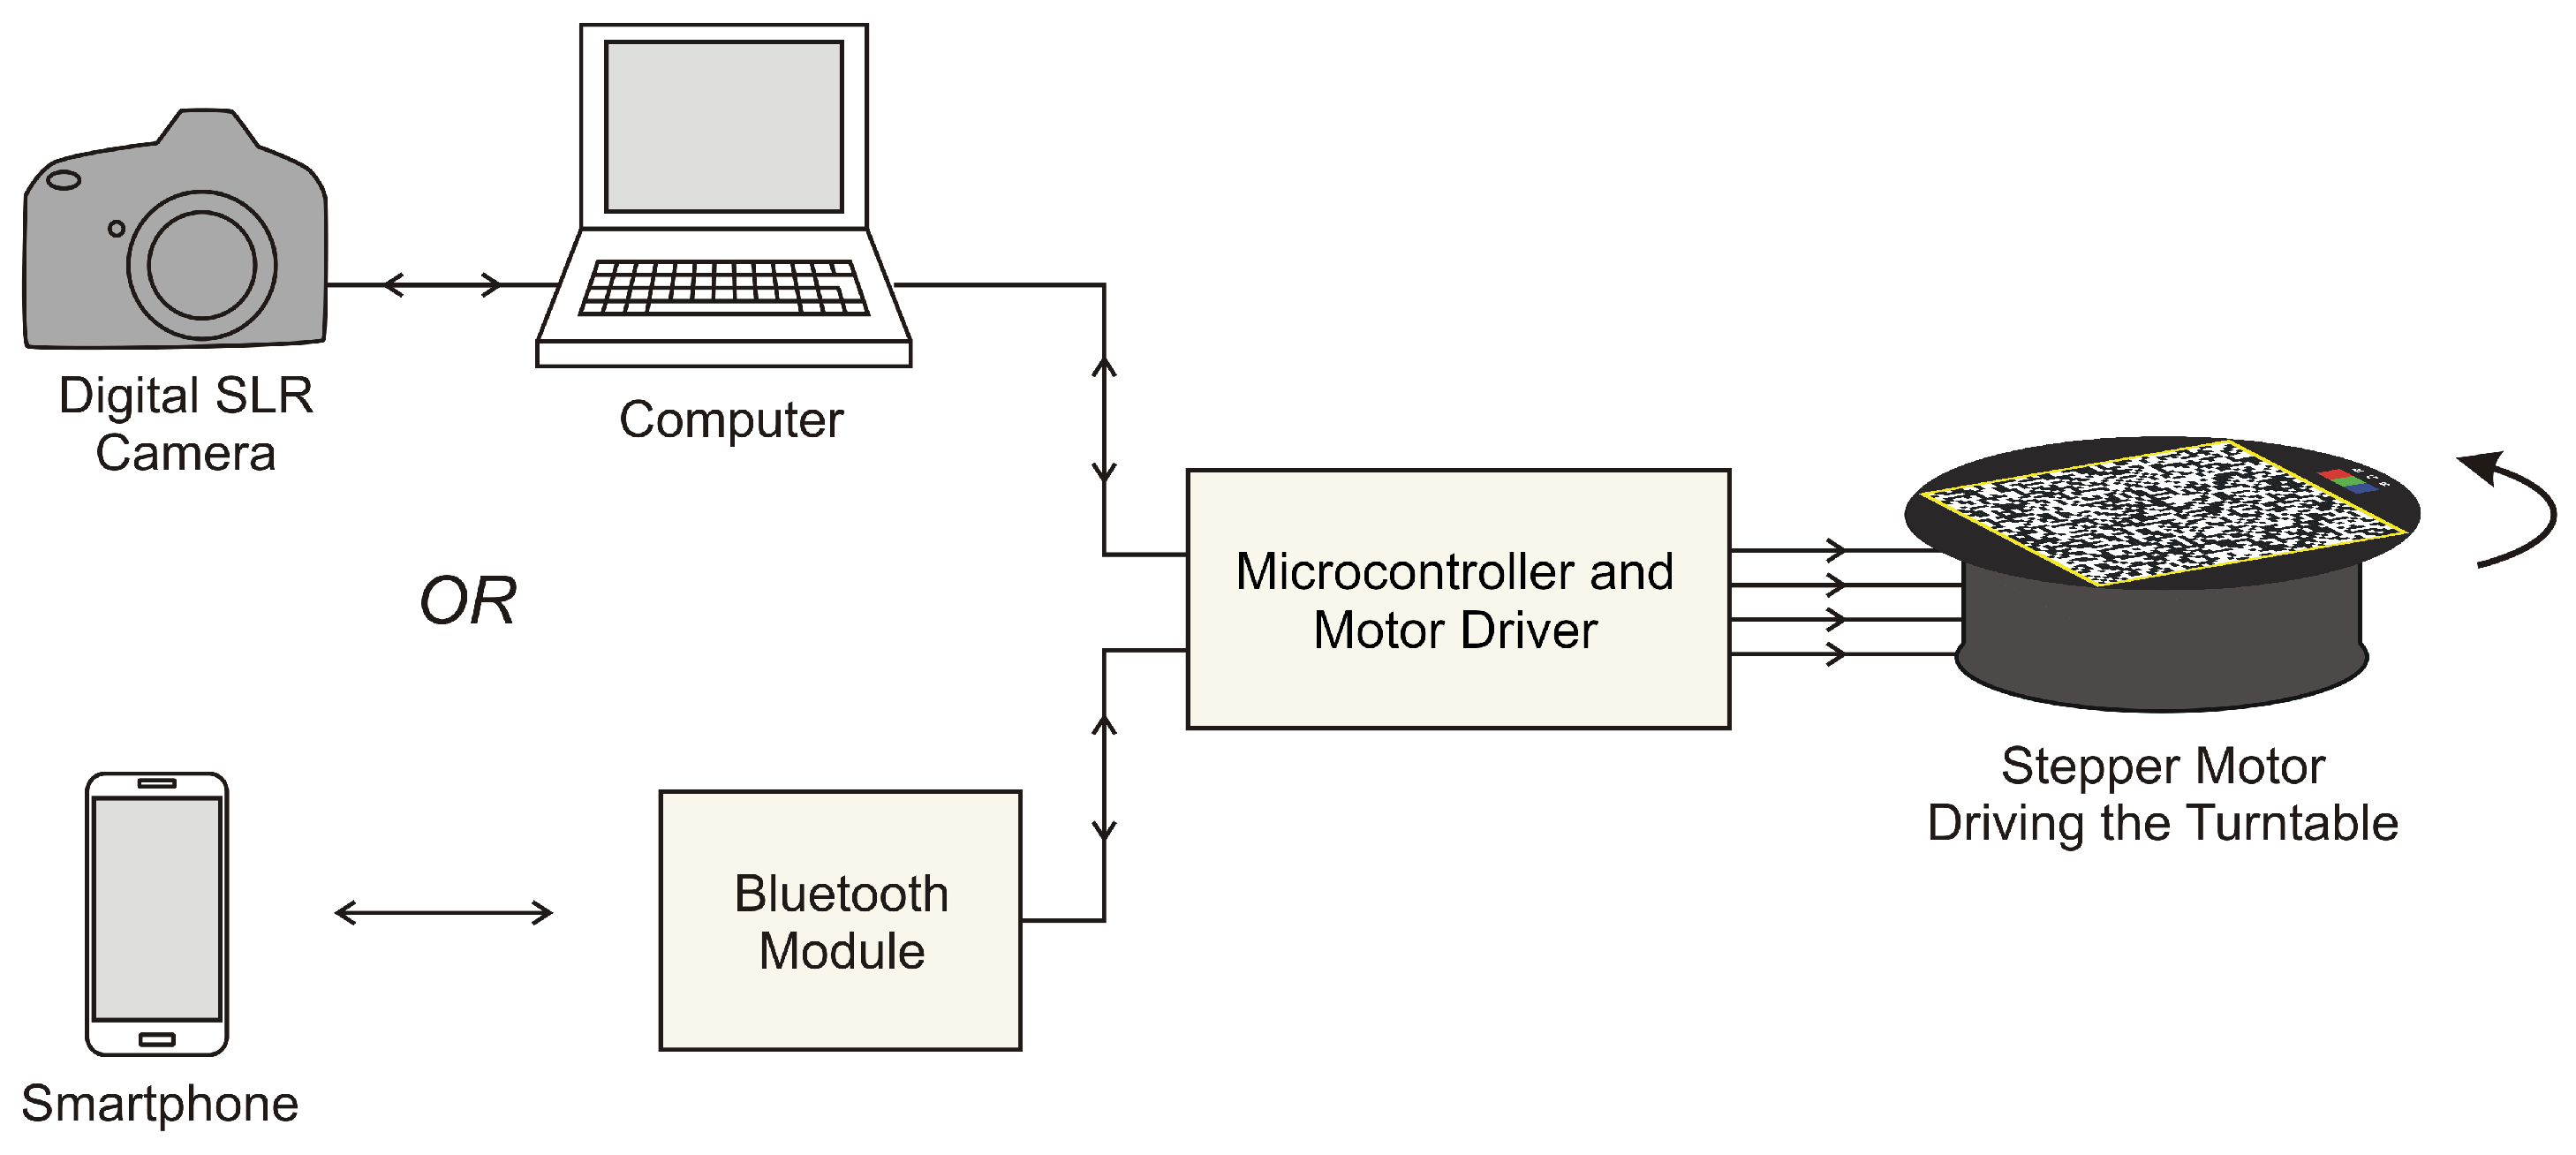
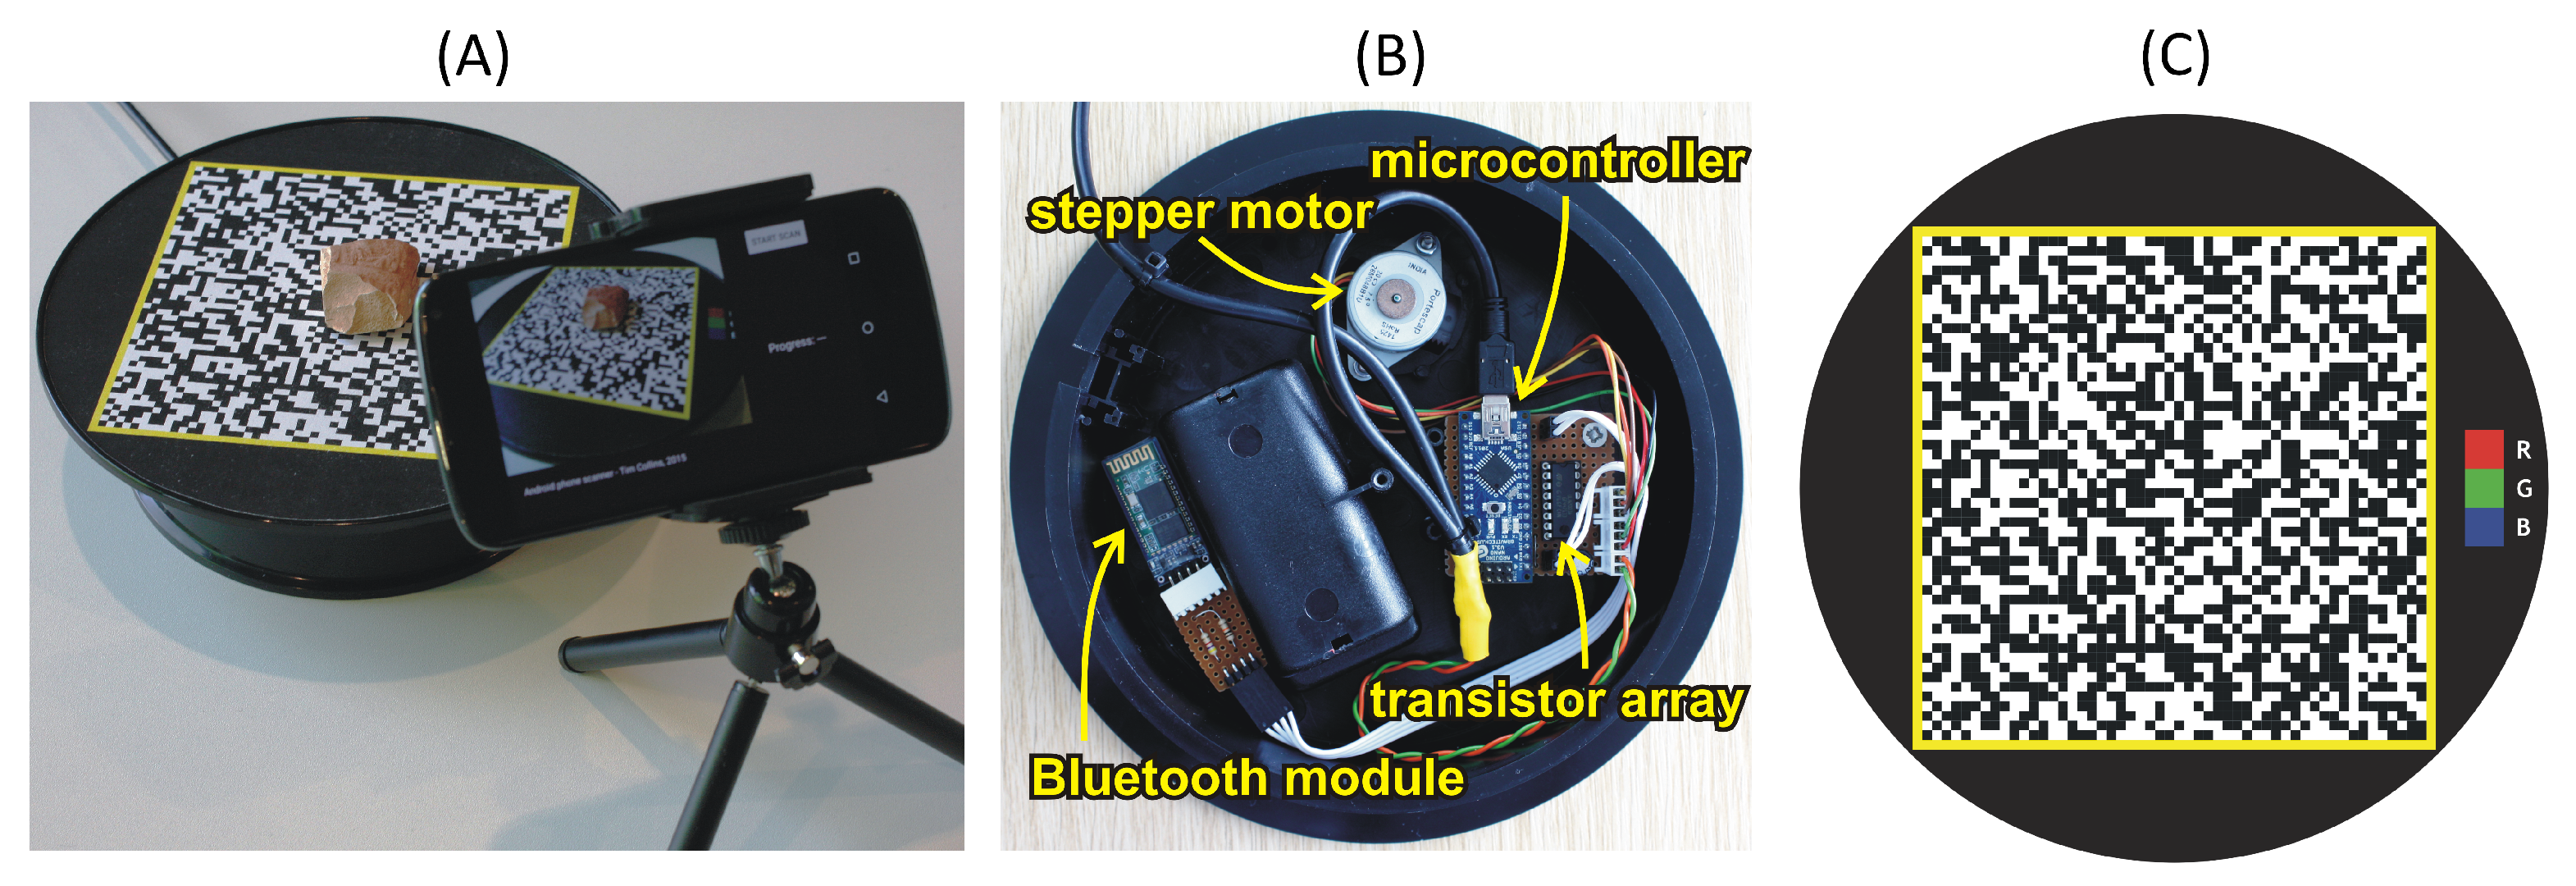
2.1. Rotary Acquisition System

A block diagram of the acquisition systems is shown in Figure 2 and photographs of the complete smartphone version are shown in Figure 3. The motivation for the development of the smartphone system version was the achievement of an ultra-low-cost system; the complete acquisition system, including a suitable smartphone, can be assembled for less than $150. The use of smartphones for photogrammetric acquisition has been widely reported for a range of object scales from large rock formations [22] down to close-range acquisitions, for example, prosthetic socket interiors [23].
The rotating platform is an adapted turntable 200 mm in diameter, originally intended for use in jewellers’ shop window displays. It contains a small motor that drives a pinion gear connected by a reducing gear to a larger gear moulded into the underside of the rotating top surface. In order to control the rotation more precisely, the original 1.5 V DC motor was replaced by a 5 V stepper motor. New control electronics were added inside the turntable base and power supplied via a USB connection.
As shown in the block diagram in Figure 2, a microcontroller receives instructions from either a computer via a USB serial link or a smartphone via a Bluetooth receiver module. An Arduino Nano [24] was used for the central microcontroller module, chosen for its small size, low cost and built-in USB serial adapter used for programming the microcontroller and also communicating with the computer to synchronise the motor and camera. A Bluetooth module was added to provide wireless serial communications with the smartphone. The firmware was designed to respond to commands from either the Bluetooth module or the USB port allowing either smartphone or computer control with a single unit. Four of the digital input/output ports of the microcontroller were used to drive the stepper motor via a ULN2003A Darlington transistor array [25].
Application software running on either the computer or smartphone synchronises the turntable motion and the camera trigger. In the case of the smartphone, the phone’s own built-in camera is used, whilst for the computer a Digital Single Lens Reflex (DSLR) camera is used, although any compatible high-resolution digital camera would suffice. The computer used in the prototype system was a Windows 10 laptop.
Without a known datum, the scale of a photogrammetrically acquired model is arbitrary [16]. Unlike other similar systems (e.g., Nicolae et al. [17] and Porter et al. [26]), a pseudo-random calibration pattern is adhered to the top surface of the turntable for the automated calibration of the reconstructed 3D model: a process described in Section 2.4.1.

2.2. Acquisition Software
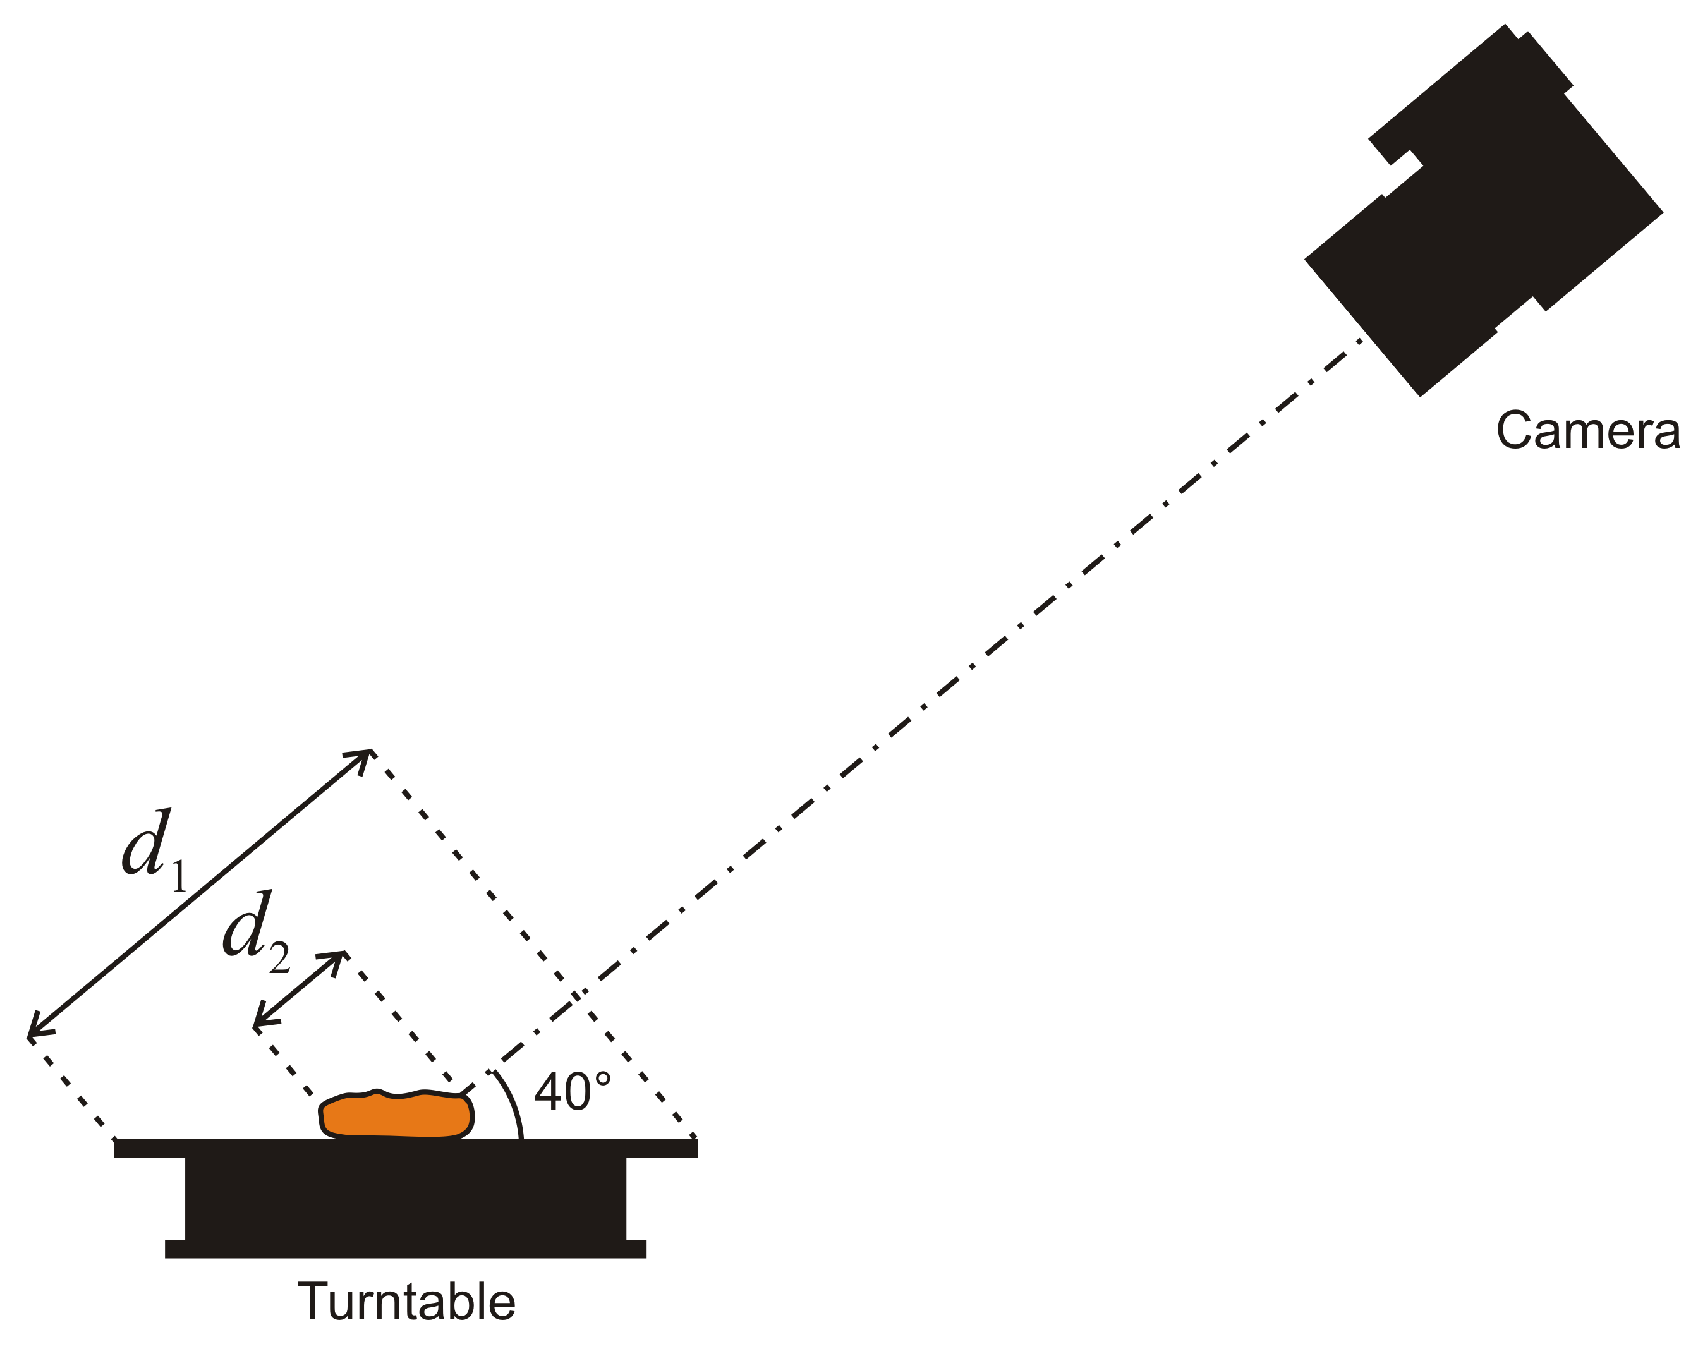
For computer control, acquisition software was developed to perform three main tasks: triggering the turntable controller, triggering the digital camera shutter, and storing and indexing the images. The camera used in our experiments was a Canon (Tokyo, Japan) DSLR camera controlled, via USB, using the Canon Digital Camera Software Development Kit [27] which provisions control of the camera’s settings, remote shutter release, and direct download of captured photographs to the computer. An application using the Canon SDK was developed to manage the acquisition process.
Smartphone control required a similar acquisition application to be developed using the Android Studio Integrated Development Environment (IDE) (Version 2.2, Google LLC, Mountain View, CA, USA) [28]. The only significant differences were that the Android app uses the smartphone’s integrated camera and communication with the turntable controller is via a wireless Bluetooth link.
For both computer and smartphone acquisitions, a complete set of 36 photographs taken at 10° intervals (derived empirically) can be performed by a single user request. In order to manage the data filing, an artefact ID is provided by the user. Successive acquisitions of the same object are stored in a series of sub-directories contained within a directory with the ID as its name. At the end of the acquisition process, the photographs are ready for photogrammetric reconstruction processing.

2.3. Photography

Although the system has been conceived to require minimal photographic expertise, there are some issues concerning camera parameters to consider.

2.3.1. Depth-of-Field

Macro photography typically suffers from limited depth-of-field due to the short subject distances relative to focal length of the camera lens. In order to fill the image frame whilst maintaining focus over the entire target area of the calibration plate, the measures available are to reduce the aperture setting to a level where the depth-of-field is acceptable or to raise the camera elevation so that the required depth-of-field reduces.
When using the DSLR camera with a 50 mm macro lens at f / 22 aperture, the camera elevation was approximately 40° and the object-to-camera distance was 550 mm. Assuming a circle of confusion of 20 μ m , and applying the calculations detailed by Kraus [29], the depth-of-field would be 98 mm. Referring to Figure 4, the width of the calibration pattern is 130 mm, which, when viewed at a 40° angle, reduces to a depth of d 1 = 130 cos ( 40 ° ) = 100 . This would suggest that the depth-of-field is barely adequate for this application, especially given that the f / 22 aperture would be expected to introduce diffraction blurring of approximately 10 μ m [29]. However, given that the average dimensions of the objects of interest are 43 mm by 51 mm [9], giving d 2 50 cos ( 40 ° ) = 38 , the depth-of-field has proven to be sufficient in all practical cases.
When using the smartphone camera, the aperture was fixed at f / 2.4 . The focal length of the lens was 4.6 mm and the sensor size is 6.4 mm. At an object-to-camera distance of 250 mm and assuming a circle of confusion of 3 μ m , the depth-of-field is reduced to 42 mm. This is inadequate for larger cuneiform tablet fragments and leads to a degradation in the reconstruction precision for smartphone acquired photographs (see Section 3).

2.3.2. Lighting

Photogrammetric reconstruction relies on the matching of features between pairs of photographs. It is essential that the features remain consistent when the object is rotated requiring lighting conditions that are constant with rotational angle. For this reason, it is usually recommended that uniform, diffuse illumination is used [30], which is ideal for objects with colour variations on their surface. The clay composition of cuneiform tablets, however, is relatively homogeneous and, when photographed under isotropic lighting, they appear to be featureless. Our compromise solution was to illuminate the object using an LED desk lamp approximately 200 mm above the centre of the turntable. At the f / 22 aperture described previously, this required a shutter speed of no more than 1/4 s at ISO 200.
This illumination geometry ensured there would be no rotational variation of lighting but that the features formed by the broken edges and cuneiform wedges would be clearly visible with good contrast. This does give rise to the problem that varying levels of illumination results in areas of light and shade in the surface that can then be subsequently ‘baked’ into the 3D model’s texture [19]. Steps to diminish this effect are described in Section 2.4.6.

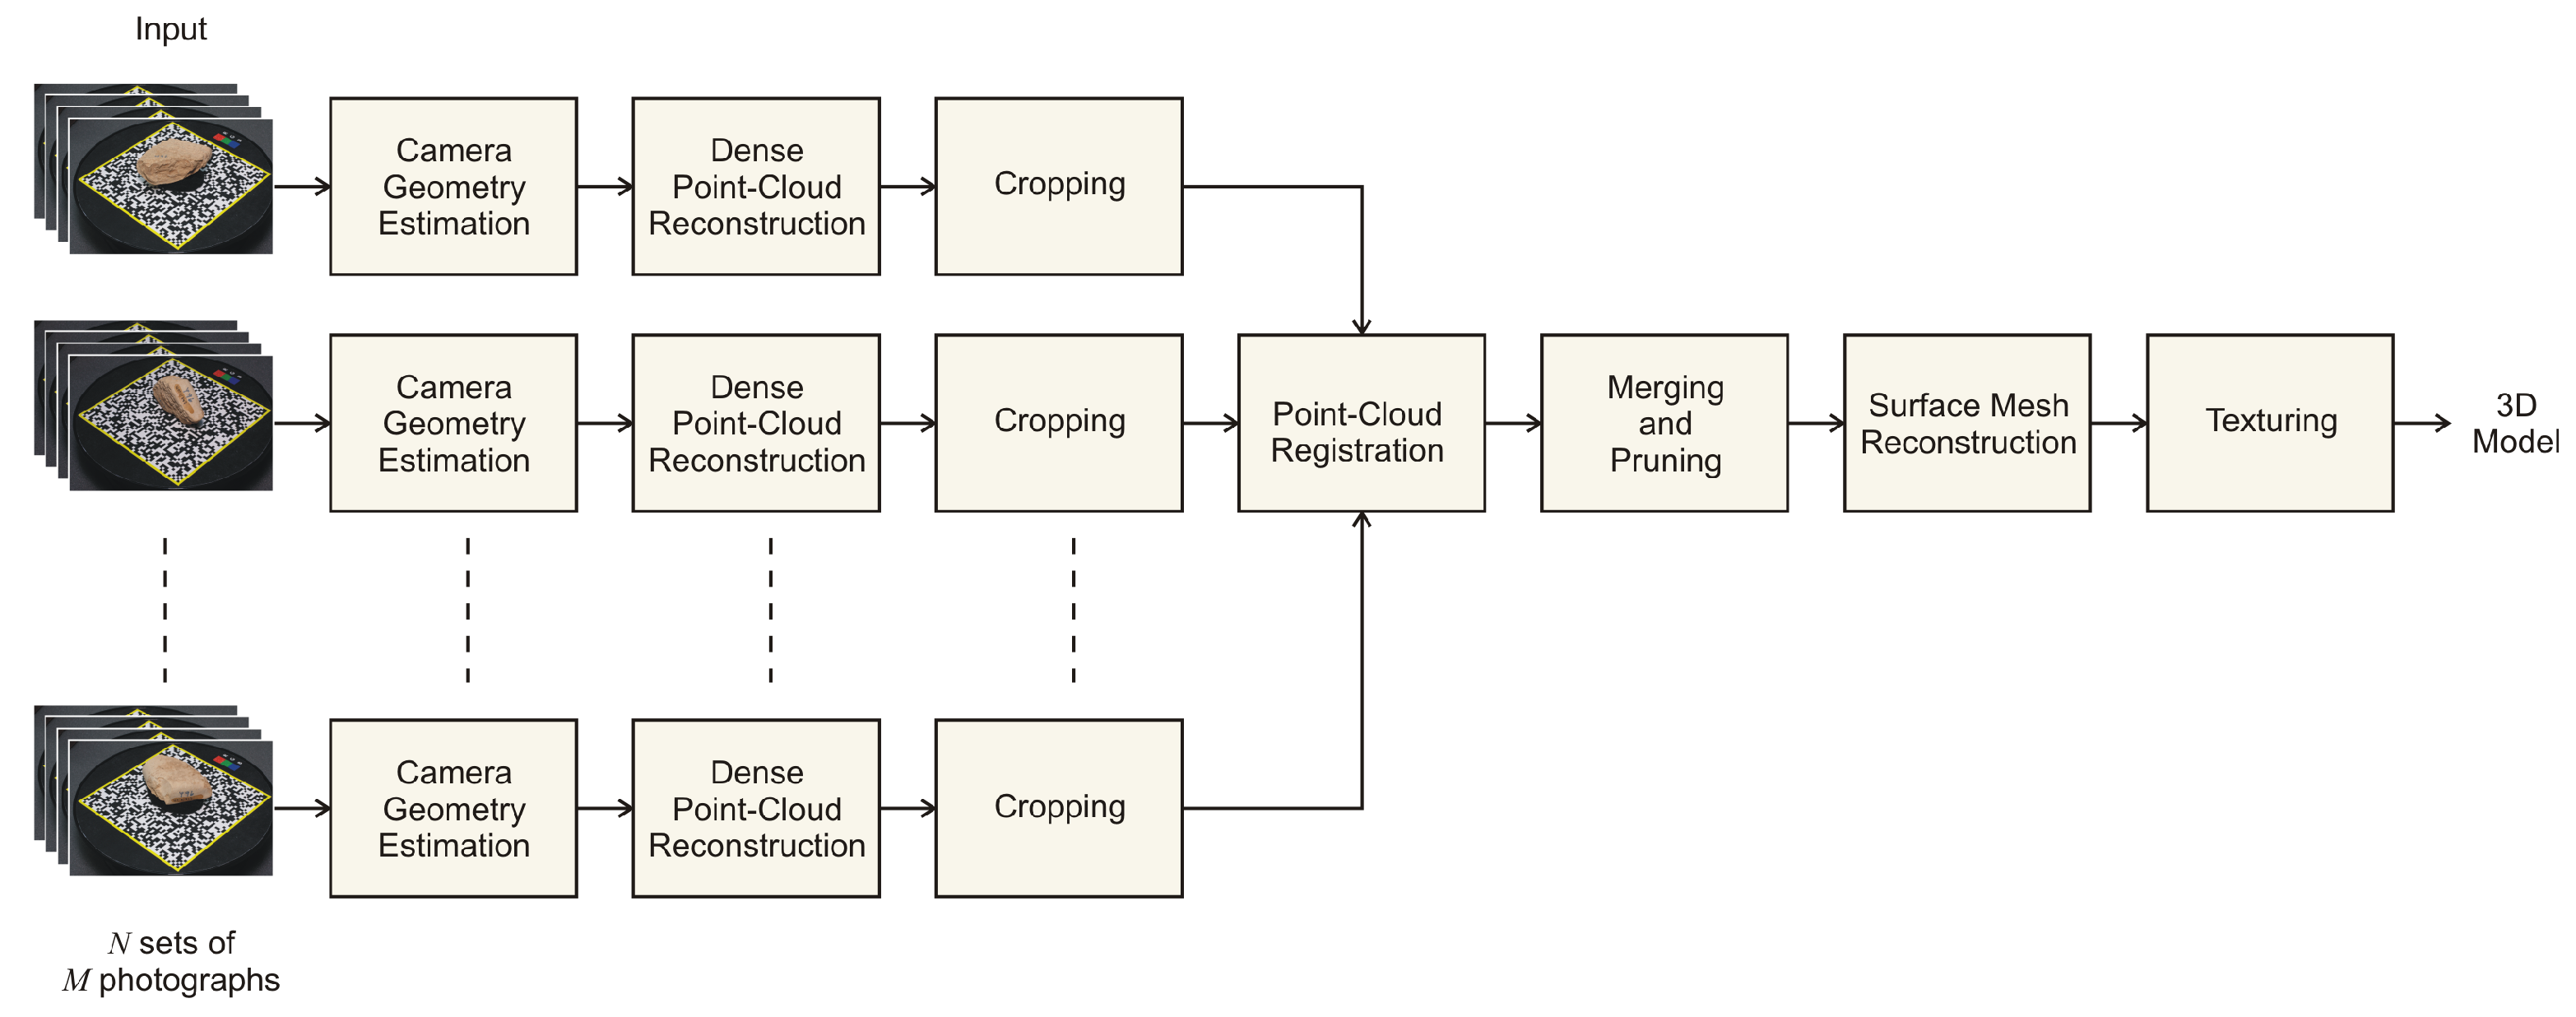
2.4. Image Processing

Transforming the sets of photographs into the resulting 3D models consists of several processes as illustrated in the block diagram in Figure 5. During acquisition, M photographs are taken for each of N artefact orientations. The subsequent processing produces a photographically textured, high-precision 3D model using a completely automatic and unsupervised workflow as described in the following sections.

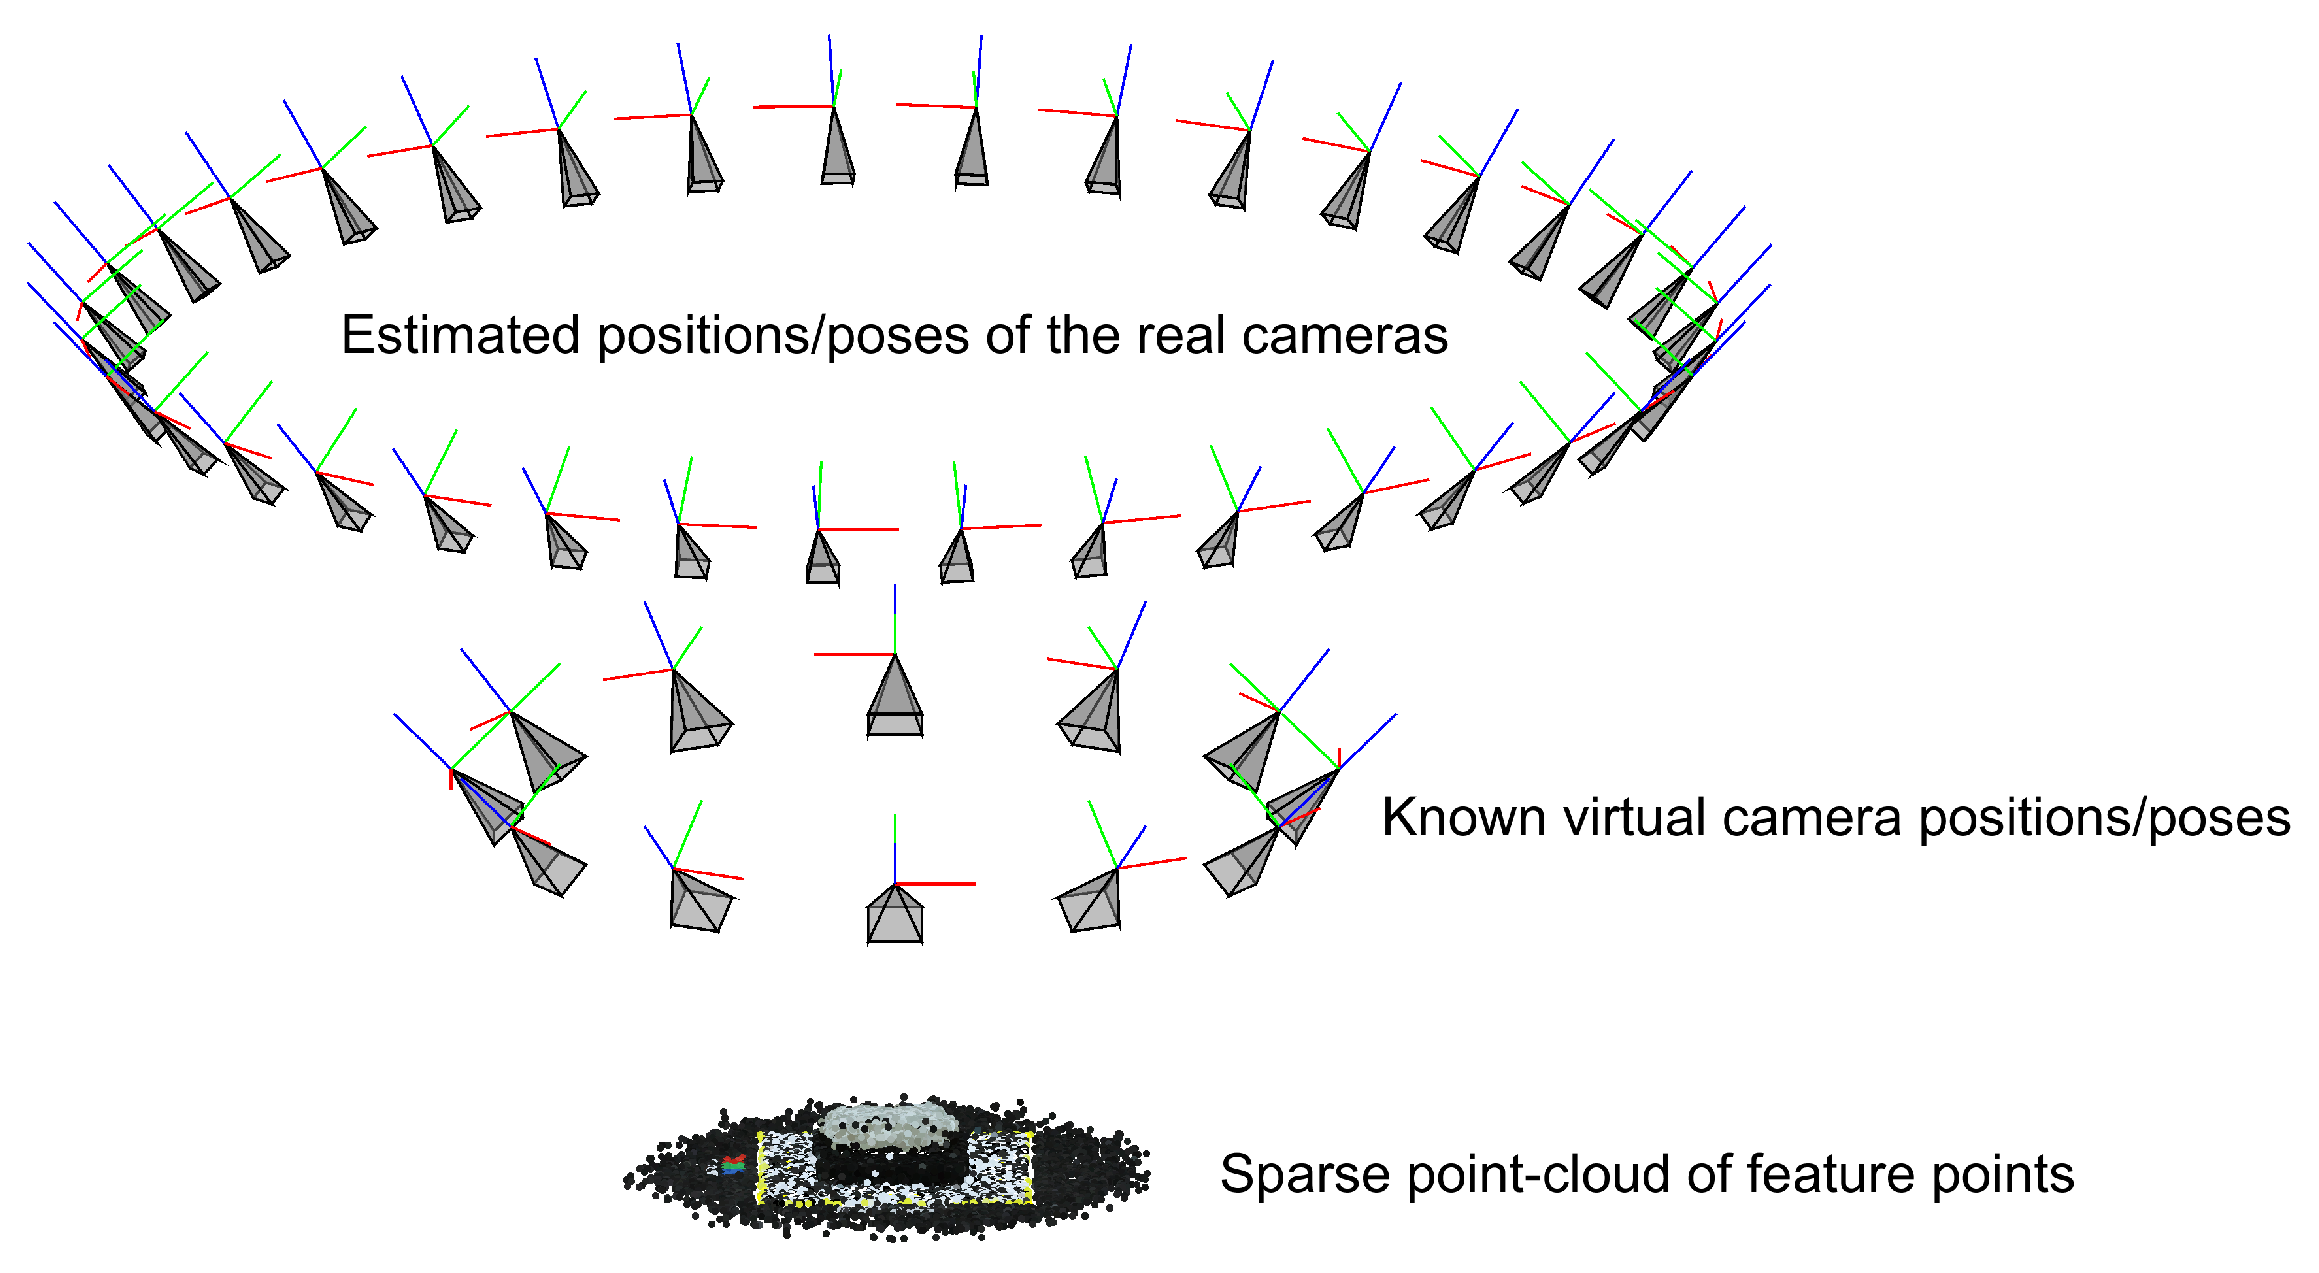
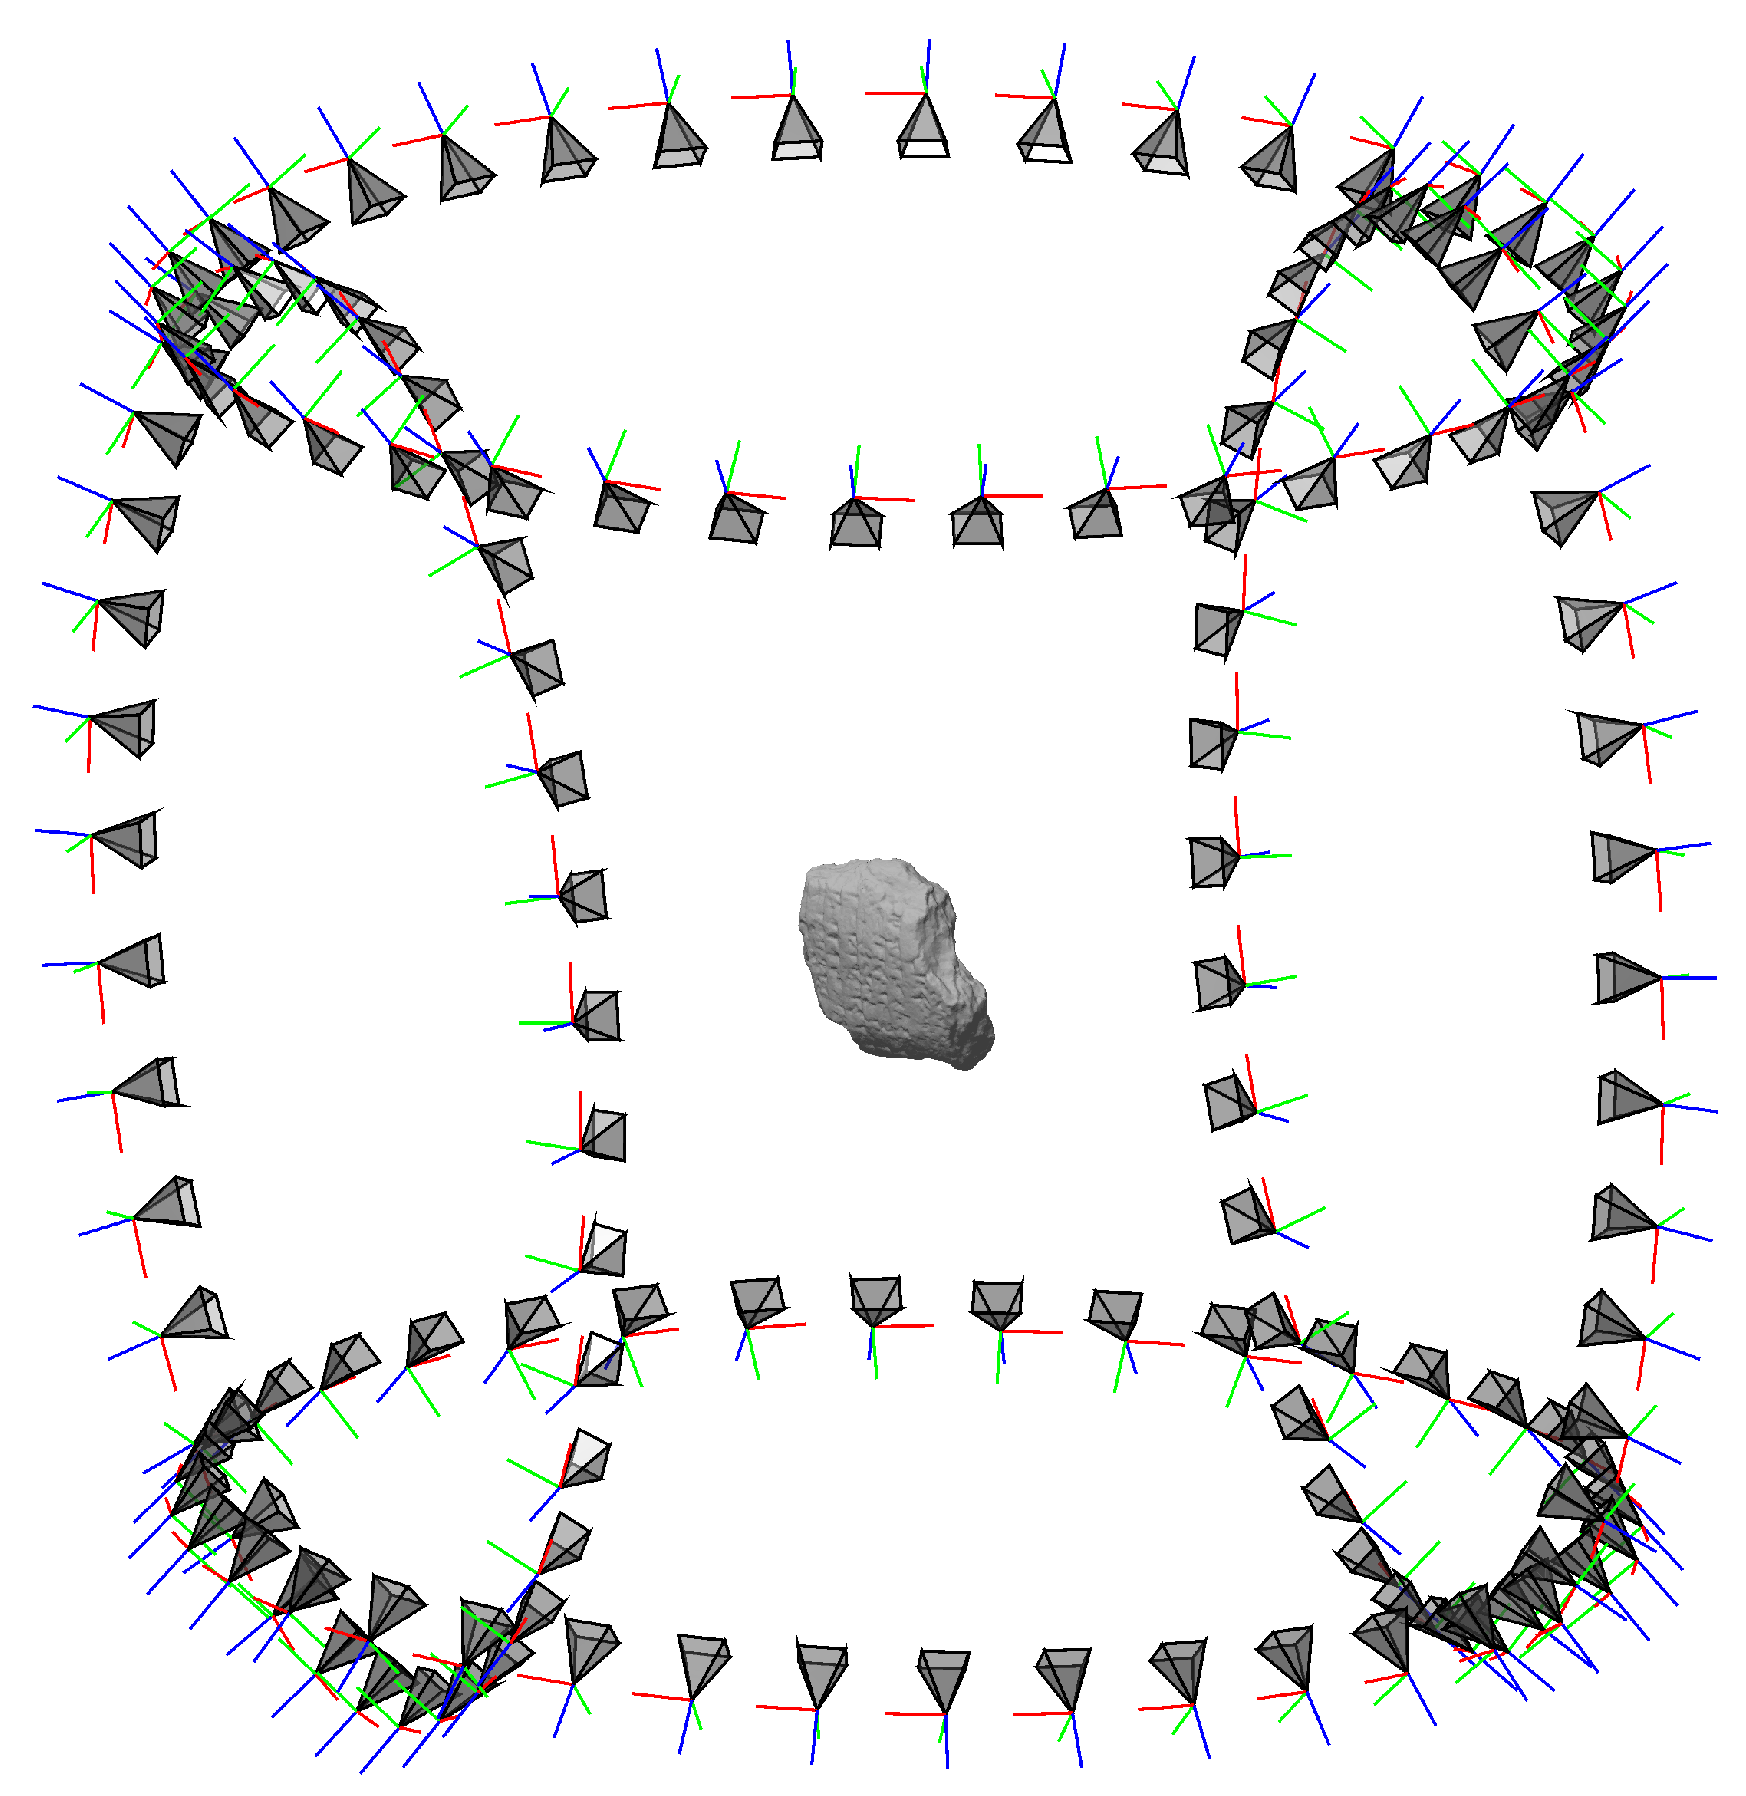
2.4.1. Camera Properties and Geometry Estimation

A Scale-Invariant Feature Transform (SIFT) [31] followed by bundle adjustment [32] using the implementation by Wu et al. [33] is used to generate estimates of the cameras’ parameters and geometries. In the absence of calibrated metric cameras, the estimated camera positions have an arbitrary scale factor. A conventional solution is to include additional coded targets and/or scale bars in the image scene. In our workflow, automatic calibration is achieved by adding a sequence of virtual reference ‘photographs’ to each of the image sets. The reference ‘photographs’ are actually artificially generated replicas of the calibration plate, shown in Figure 3C, rendered using a sequence of viewpoints comparable to typical camera viewpoints. A sequence of twelve images rendered at 30° rotational intervals, all from a 45° elevation, was empirically found to work well. SIFT feature points are extracted and matched for this set of images prior to processing the ‘real’ photographs.
The camera geometry estimation process uses a well-established workflow [33], beginning by extracting the SIFT features of the real set of photographs and matching them with the existing calibration model. Bundle adjustment refines the estimated parameters of the unknown cameras whilst keeping the virtual camera positions, poses and intrinsic parameters fixed at their known, exact values (see Figure 6). By estimating the real camera positions relative to a static, calibrated set of feature points, the correct scale factors are automatically ensured. The final stage of this process is the removal of the virtual photographs from the image set prior to dense point-cloud reconstruction using only the real photographs and the corresponding calibrated camera parameter estimates. Using this approach, the discrete coded targets, conventionally used for calibration, are substituted by a single extended coded target filling most of the image scene that is not occupied by the object being acquired itself. This gives robust auto-calibration results and works with objects of many shapes and sizes. The complete geometry estimation workflow was implemented using code from Wu et al. [33] combined with customised code written in a combination of C++ and Matlab. A Windows batch script was used to automate the process.

2.4.2. Dense Point-Cloud Reconstruction

The open source Clustering Views for Multi-View Stereo (CMVS) algorithm [34,35] is used to reconstruct a dense 3D point-cloud from each set of photographs. The point density (typically between 100 and 300 points per square millimetre) is sufficient to resolve the features of the impressed cuneiform script and has proven more than adequate for the purpose of matching fragmented tablets [11]. There are other dense point-cloud reconstruction applications available, but CMVS was chosen for our application because it is free, has a well-documented command line interface making it easily automated, and produced comparable results, in our tests, to commonly recommended alternatives such as Photoscan by Agisoft (St. Petersburg, Russia) [36]. No modifications were made to the CMVS algorithm.

2.4.3. Cropping

Cropping is the removal of unwanted points that do not form part of the object being acquired—mostly points representing the turntable and calibration pattern and any supporting material used to stabilise the object during the acquisition. A dark coloured supporting foam material was chosen to contrast with the much lighter colour of the cuneiform fragments so that it could be automatically identified and removed. The calibration model used during bundle adjustment lies on the z = 0 plane, so most of the extraneous points lie outside an axis-aligned bounding box with an x and y extent equal to the size of the calibration pattern and a z extent from the maximum z-coordinate in the point-cloud down to a few millimetres above the turntable surface. The actual lower z-limit used is derived by progressively calculating the average luminosity of points in millimetre-by-millimetre slices starting at z = 2   mm above the turntable and increasing z until an average luminosity threshold is exceeded. By this process, the dark-coloured supporting material is automatically removed from the artefact’s point-cloud.

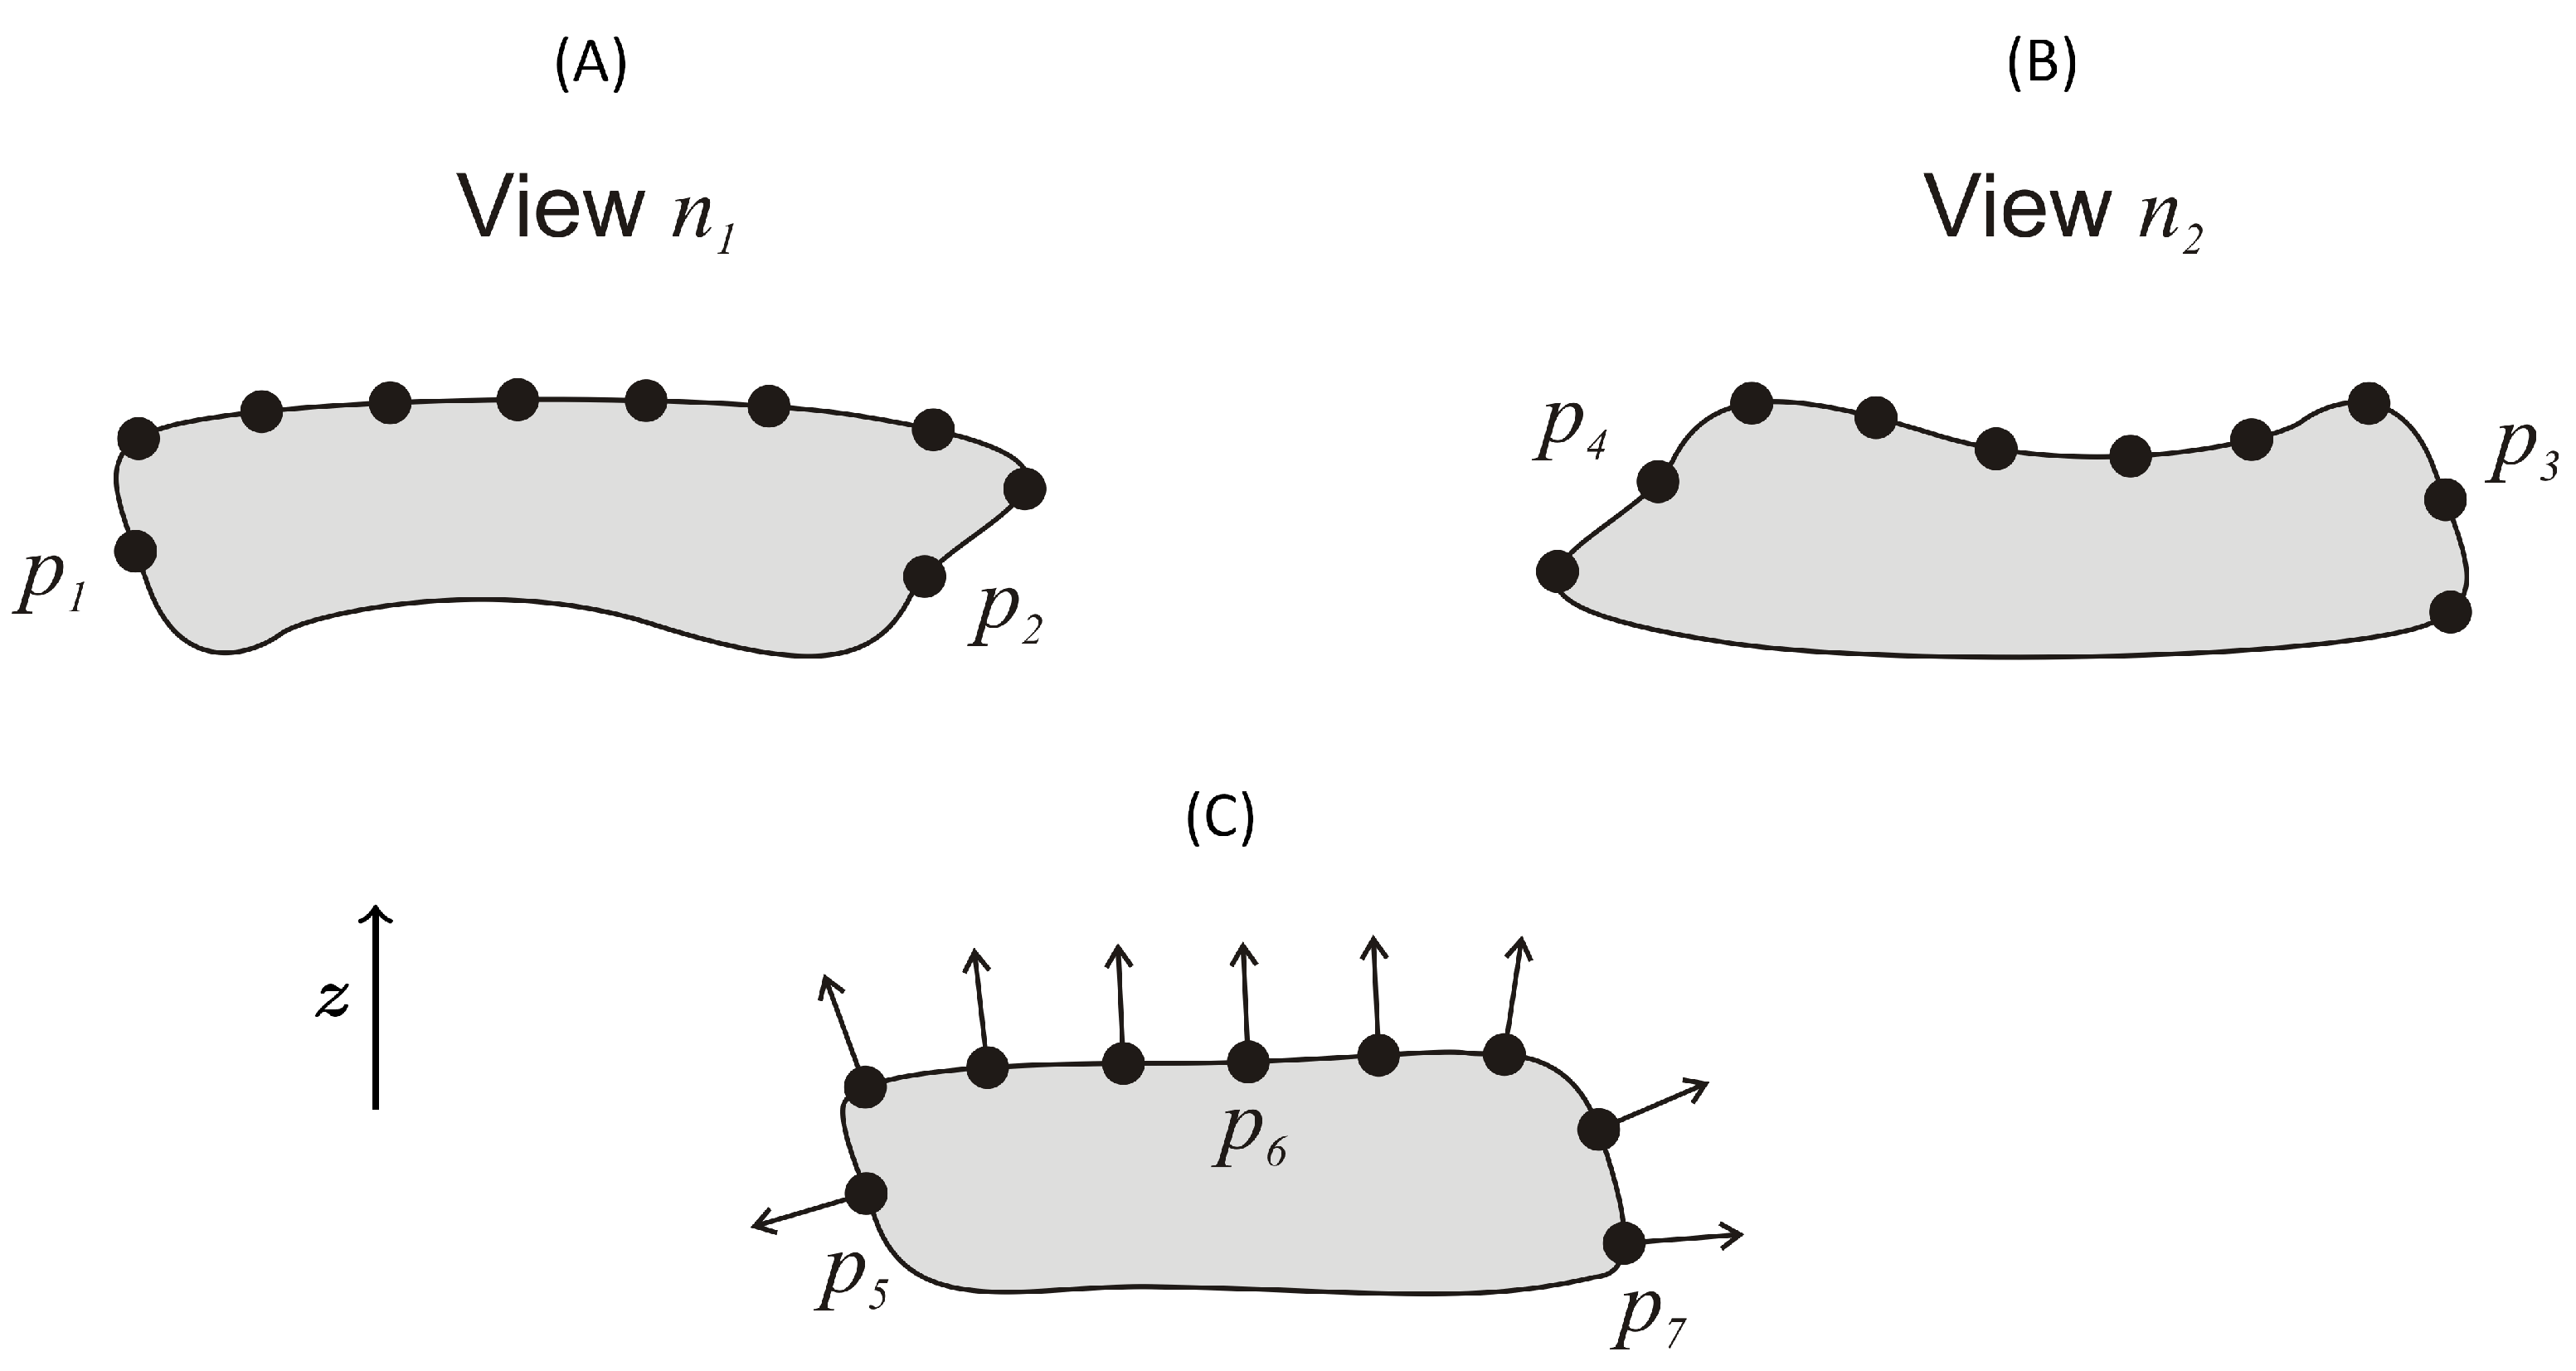
2.4.4. Point-Cloud Registration

After photogrammetric point-cloud reconstruction has been applied to each set of M photographs, a set of N three-dimensional calibrated point-clouds have been generated. The process of merging the N partial models is one of point-cloud registration: matching the overlapping regions of the point-clouds from pairs of partial models. Point-cloud registration is performed in two stages:
  • Automatic coarse alignment of point-clouds using the Super 4PCS algorithm [37],
  • Fine alignment using a Weighted Iterative Closest Point (W-ICP) algorithm.
Super 4PCS is a reliable and efficient open-source algorithm for achieving coarse alignment between point-clouds in an automatic, unsupervised process. The algorithm described by Mellado et al. [37] is used without modification.
Fine alignment is a modified version of the well-established ICP algorithm [38]. In the conventional algorithm, in order to orient one point-cloud, P, so that it matches another point-cloud, Q, an error function of the following form is minimised:
e k = i A k p i q j 2 ,
where p i is the i-th member of the point-cloud P, A k is the current estimate of the optimal rigid transform matrix, and q j is the j-th member of the fixed, reference point-cloud Q; j is chosen to select the closest point in the cloud to p i . At each iteration of the process, the point-cloud correspondences are re-estimated and a new transform, A k , calculated to minimise the error function.
The ICP algorithm in this form works under the assumption that all points in both point-clouds are equally precisely estimated, which, in our application, is not necessarily the case. Figure 7A,B illustrate the problem, showing two partial models of an object acquired from different viewpoints. Assuming view n 1 was photographed using a typical camera elevation of around 40°, the points p 1 and p 2 would have been photographed from a very shallow grazing angle and would be poorly illuminated by the overhead light source. As a result, their photogrammetric reconstruction would not have been as precise as the other points illustrated in the model. From viewpoint n 2 (the same object turned over), the corresponding points p 3 and p 4 would be better illuminated and in better view from the camera and, so, would be more precisely reconstructed.
If the expected precision of each point can be estimated, their relative importance in the point-cloud registration process can be weighted accordingly. In addition, after registration, the overlapping regions can be automatically ‘cleaned-up’ by eliminating unreliable points where a better close-by alternative can be found in another partial model.
As part of the dense point-cloud reconstruction process, each point is associated with a surface normal vector. The vertical (z) components of the correspondingly rotated normal vectors form a good first estimate of the potential reliability of each point. Figure 7C illustrates this concept. Points such as p 5 with poor expected precision can be identified by the negative vertical (z) component of the normal vector (i.e., the normal points downwards). Points along the top of the object, such as p 6 , would all be expected to have good precision and can be identified by their large, positive z components. The only exceptions to this rule are found near the base of the object, e.g., point p 7 . In this area, shadowing can cause such poor reconstruction that the normal vector itself can be imprecise. These points can be identified by their z coordinate relative to the bottom of the cropped object. These criteria are combined to form a single confidence metric for each point:
c ( p i ) = 1 2 ( n z + 1 ) ( 1 e z / λ ) ,
where n z is the z component of the point’s normal vector and z is the point’s z coordinate in millimetres relative to the cropping height used in the previous section. The constant, λ , sets the height-range of the subset of points near the base that are expected to be less precise; a value of approximately 1 mm has been found to work well in practice. An example illustrating the use of this confidence metric is shown in Figure 8. Points on the top, upward facing surface of the object have confidence values close to the maximum whilst those near the bottom show a confidence close to zero. The sides of the object show varying confidence values according to the inclination of the surface. A comparison of Figure 8A,B shows that the regions around the sides of the object that were poorly lit or whose view was obscured do, correctly, receive correspondingly lower confidence values.
In order to make use of the confidence values, a modified Weighted ICP (W-ICP) algorithm is used. This algorithm is the same as conventional ICP except that the error function from Equation (1) is modified to be:
e k = i A k p i q j 2 c ( p i ) c ( q j ) ,
i.e., the contribution of each point-to-point distance is weighted by the product of the confidence values of each point in the pair. This ensures that the most precisely estimated points contribute most to the error function and will, therefore, be registered most precisely.
After the last iteration, each pair of points is combined to form a single interpolated point using the same confidence values. Given a pair of points p i and q j , the resulting interpolated point, r i , in the merged point-cloud would be:
r i = c ( p i ) A K p i + c ( q j ) q j c ( p i ) + c ( q j ) .
This merging operation helps to ensure that no ‘seams’ remain at the edges of the original point-clouds resulting from imprecise unpruned points.

2.4.5. Meshing

Following the point-cloud registration and merging operations described above, the points require connecting to form a surface mesh before texturing can be applied. Poisson surface reconstruction [39] was used for this stage and was chosen for its relative simplicity and reliability. Some care is needed to avoid loss of detail on inscribed surfaces. We found that an octree depth of 14 gave a good compromise, retaining the detail of the inscriptions with a tractable computational complexity.

2.4.6. Texturing

The texturing process refers back to the original sets of photographs and the camera position information calculated during the sparse point-cloud reconstruction to determine the detailed appearance (i.e., texture) of each face of the mesh. Meshlab [40] provides relatively easy-to-use parameterisation and texturing processing suitable for this task providing the camera locations can be imported in the correct format. This is a more complex task than in the conventional single-scan photogrammetry workflow [41] because the merging process will have reoriented the component parts of the mesh, requiring the camera positions to be moved accordingly.
The starting point of the process is the set of camera locations estimated by the bundle adjustment processing of VisualSFM [42]. The position of the m-th camera during the n-th partial acquisition can be expressed in the form of a single 4-by-4 view-matrix, V mn .
As a result of the point cloud registration stage, each of the N partial meshes has been transformed from the location assumed by the bundle adjustment process. As a result, before texturing, the mesh must also be transformed by a model-matrix, M n , which is the inverse of the optimal transform calculated during point-cloud registration for the n-th partial acquisition. Thus, the rotation and translation of the m-th camera during the n-th partial acquisition is expressed by the model-view-matrix, V mn M n . An example of the resulting ensemble of camera positions is illustrated in Figure 9.
Having correctly repositioned and reoriented the cameras, Meshlab is able to parameterise and texture the mesh producing the final 3D model. Figure 10 shows an example of a completed reconstruction.

3. Performance Evaluation

An obvious approach to determine the precision and resolution of a 3D acquisition system is to test its performance with geometrically simple calibration objects of known dimensions (e.g., cubes or spheres [43]). The difference between the resulting point-cloud and the calibration object can then be calculated. However, for photogrammetric systems, the acquisition process relies on the detection of multiple feature points on the object surface. Smooth, regular geometric shapes lack the features needed for precise reconstruction. Strategies have been developed to compensate for a lack of features [17,44] but would introduce unnecessary uncertainty to this comparison process.
Our approach was to use 3D printed replicas of cuneiform tablet fragments and to compare the 3D models produced by the rotary acquisition system to those produced by a high resolution 3D scanner. The replicas used were made from high-resolution laser scans of cuneiform tablet fragments and were fabricated using stereolithography 3D printing at a resolution of 10 μ m . The scanner used was a Ceramill Map300 3D dental-scanner (Amann Girrbach AG, Austria), chosen for its rated precision of less than 20 μ m . These scans were used as the ground-truth data for evaluating the 3D acquisition precision of the photogrammetric system.
Two 3D printed fragment replicas were photographed using the rotary acquisition system described in Section 2 from three viewpoints each and the point-clouds were reconstructed using the processing outlined. Each fragment was photographed using a Canon EOS 450D 12.2 mega pixel digital SLR camera and a Google Nexus 4 Android smartphone (Google LLC, Mountain View, CA, USA and LG Electronics, Seoul, South Korea) with a built-in 8 mega pixel camera. For comparison purposes, scans were also taken using a commercial 3D structured light scanner, the DAVID-SLS-2 system (DAVID Vision Systems GmbH, Koblenz, Germany) [45]. Such 3D scanners project patterns of light onto the object surface and estimate the shape of the object from the distortions of the patterns observed by a camera viewing from a different angle to the projector.

4. Results and Discussion

Figure 11 shows photographs of the two 3D prints during acquisition and the resulting 3D models. After reconstruction of each 3D model, a comparison was made with the high-resolution scanned model. The root-mean-squared (RMS) error between the vertices in the model’s surface mesh and the corresponding closest points on the surface mesh of the high-resolution scan was calculated using the CloudCompare 3D processing application [46]; the results are summarised in Table 1.
The experimental results presented in Table 1 show an improved precision for the DSLR camera compared with the smartphone. This was anticipated given the improvement in image resolution (12.2 Megapixel DSLR vs. 8 Megapixel smartphone), the greater depth of field (see Section 2.3.1) and the superior optics of the 50 mm macro lens used by the DSLR compared with the built-in 5 mm lens of the smartphone camera. Nevertheless, both are comparable with the performance achieved by the structured light scanner and both compare favourably with the 100 μ m errors reported in similar applications with much more expensive laser scanning equipment [47].
Both the DSLR camera and smartphone photogrammetry systems have been used for the scanning of cuneiform tablet fragments at the British Museum. Tablet fragments including the fragment shown in Figure 10 have been acquired from the collection of tablets excavated at Ur which is thought to contain many matching but unjoined fragments. Our ambition is to assist reconstruction by identifying virtual joins. An example of a close-fitting virtual join between two fragments acquired from the Ur collection using this system is shown in Figure 12—the closeness of the fit between the fragments is only possible with high precision models such as those provided by the system.
The fragments shown in Figure 12 have been made available in an online interaction [48] with an interface designed to support joining and study tasks [49]. The acquisition system has also been used in the virtual joining of two tablet fragments from the third tablet of the Old Babylonian version of the Atrahasis epic [50,51,52]. The physical tablet fragments are separated by 1000 km: one in the British Museum in London and the other in the Musée d’Art et d’Histoire in Geneva.
One area that has not been a focus of this work has been processing time. The total processing time of the workflow is typically between 2 and 4 h depending on the computer and GPU specification, the number of viewpoints used, and the size of the physical object. Most of this processing time is taken by the CMVS dense point-cloud algorithm, the point-cloud registration used to join partial scans from different viewpoints, and the photographic texturing. The fully automated workflow allows processing to be offloaded to resources such as high performance computing clusters or cloud computing services meaning the long processing time does not impede the throughput of acquisitions of large numbers of artefacts.
There is scope for further work toward the optimisation of operating conditions with the aim of improving heuristic estimates of parameters such as the number of photographs taken and the relative positioning of camera and lighting. There is also scope for further work toward refinements in texture processing. Currently, rendered artefact textures have subjectively pleasing photo-realistic appearances, but, under certain conditions, there can be a discrepancy between the colour of some regions and the actual albedo of the real artefact. For example, an artefact region photographed only whilst partially lit will appear darker in its virtual form. With appropriate calibration and knowledge of the lighting conditions, these discrepancies can be predicted and corrected giving an improved photo-realistic appearance. Hopefully, there will be further efforts toward the realisation of low-cost, high-definition, 3D acquisition systems, ideally through open source initiatives.

5. Conclusions

The rotary photogrammetric acquisition systems presented in this paper are very low-cost but high performance solutions for the 3D acquisition of small form-factor objects. The workflow innovations presented enable automation of the acquisition and reconstruction processes such that no user intervention is required after the photographs are acquired. Experimental testing of the 3D acquisition precision has shown the performance using the 12.2 Megapixel DSLR camera to be better than a commercial 3D scanner. Models created using this system have been successfully used to join fragmented tablets automatically, thereby demonstrating the application of this system for the automatic reconstruction of fragmented cuneiform tablets.

Author Contributions

Conceptualisation, T.C., S.I.W., E.G., and E.C.; methodology, T.C.; software, T.C.; validation, T.C., S.I.W. and E.G.; formal analysis, T.C.; investigation, T.C. and S.I.W.; resources, T.C. and S.I.W.; data curation T.C., S.I.W., and E.G.; writing—original draft preparation, T.C., S.I.W., E.G., and E.C.; writing—review and editing, T.C., S.I.W., E.G., and E.C.; visualisation, T.C. and S.I.W.; project administration, T.C., S.I.W., E.G., and E.C.

Funding

This research received no external funding.

Acknowledgments

The cuneiform tablet fragments presented in Figure 8, Figure 10 and Figure 12 are held on a study loan at the British Museum. The authors would like to thank the Trustees of the British Museum for permission to access the fragments and would also like to thank Birger Helgestad, Mathilde Touillon-Ricci and Jonathan Taylor for their assistance which has made this work possible. The scanned tablets depicted in Figure 11 are W 18349 and Wy 777, published with the kind permission of the German Archaeological Institute, Berlin. The 3D printed models were produced using data from the 3D scanner of the Heidelberg Graduate School of Mathematical and Computational Methods for the Sciences at the Interdisciplinary Centre for Scientific Computing, Heidelberg University, and we would like to thank Sonja Speck, Hubert Mara and Susanne Krömker. The authors would also like to thank David Rowan of Birmingham Museum and Art Gallery, UK for providing valuable insights into the techniques and processes of artefact photography during the testing phase of system development. The structured light scanning and comparisons described in Section 3 were performed with the assistance of Laurence Hanes at the University of Birmingham. The high resolution 3D scanning used for comparison when testing the acquisition precision was performed by Gregg Clutton from the Dental Technology Team at Manchester Metropolitan University whom we would also like to thank.

Conflicts of Interest

The authors declare no conflict of interest.

References

  1. United Nations. General Assembly Resolution 69/281: Saving the Cultural Heritage of Iraq. 2015. Available online: http://www.un.org/en/ga/69/resolutions.shtml (accessed on 26 November 2019).
  2. Vincent, M.L.; Gutierrez, M.F.; Coughenour, C.; Manuel, V.; Bendicho, L.M.; Remondino, F.; Fritsch, D. Crowd-Sourcing the 3D Digital Reconstructions of Lost Cultural Heritage. In Proceedings of the 2015 Digital Heritage, Granada, Spain, 28 September–2 October 2015; Volume 1, pp. 171–172. [Google Scholar] [CrossRef]
  3. IDA. The Million Image Database Project, The Institute for Digital Archaeology. 2015. Available online: http://digitalarchaeology.org.uk/projects/ (accessed on 26 November 2019).
  4. VCTR. Virtual Cuneiform Tablet Reconstruction Project. 2016. Available online: http://virtualcuneiform.org/ (accessed on 26 November 2019).
  5. Gehlken, E.; Collins, T.; Woolley, S.I.; Hanes, L.; Lewis, A.; Hernandez-Munoz, L.; Ch’ng, E. From Uruk to Ur: Automated Matching of Virtual Tablet Fragments. In Proceedings of the 62nd Rencontre Assyriologique Internationale, Philadelphia, PA, USA, 11–15 July 2016. [Google Scholar]
  6. Ch’ng, E.; Woolley, S.I.; Gehlken, E.; Lewis, A.; Hernandez-Munoz, L.; Collins, T. The Development of a Collaborative Virtual Environment for 3D Reconstruction of Cuneiform Tablets. In Proceedings of the International Conference on Virtual Systems & Multimedia (VSMM), Hong Kong, China, 9–12 December 2014; pp. 35–42. [Google Scholar] [CrossRef]
  7. Ch’ng, E.; Lewis, A.; Gehlken, R.E.; Woolley, S.I. A Theoretical Framework for Stigmergetic Reconstruction of Ancient Text. In Visual Heritage in the Digital Age; Springer-Verlag: London, UK, 2013; pp. 43–65. [Google Scholar]
  8. CDLI. Cuneiform Digital Library Initiative. 2019. Available online: http://cdli.ucla.edu/ (accessed on 26 November 2019).
  9. Lewis, A.; Ch’ng, E. A Photogrammetric Analysis of Cuneiform Tablets for the Purpose of Digital Reconstruction. Int. J. Herit. Digit. Era 2012, 1, 49–53. [Google Scholar] [CrossRef]
  10. Woolley, S.I.; Flowers, N.J.; Arvanitis, T.N.; Livingstone, A.; Davis, T.R.; Ellison, J. 3D Capture, Representation and Manipulation of Cuneiform Tablets. In Proceedings SPIE (Three Dimensional Image Capture and Applications IV); SPIE: Bellingham, WA, USA, 2001; Volume 4298, pp. 103–110. Available online: https://www.spiedigitallibrary.org/conference-proceedings-of-SPIE/4298 (accessed on 26 November 2019).
  11. Collins, T.; Woolley, S.I.; Lewis, A.; Hernandez-Munoz, L.; Ch’ng, E.; Gehlken, E. Computer-Assisted Reconstruction of Virtual Fragmented Cuneiform Tablets. In Proceedings of the International Conference on Virtual Systems & Multimedia (VSMM), Hong Kong, China, 9–12 December 2014; pp. 9–12. [Google Scholar] [CrossRef]
  12. Willis, A.R.; Cooper, D.B. Computational Reconstruction of Ancient Artifacts. IEEE Signal Process. Mag. 2008, 25, 65–83. [Google Scholar] [CrossRef]
  13. Pevar, A.; Verswyvel, L.; Stam Georgoulis, N.C.; Proesmans, M.; Van Gool, L. Real-Time Photometric Stereo. In Proceedings of the 55th Photogrammetric Week, Stuttgart, Germany, 7–11 September 2015; pp. 185–206. Available online: https://core.ac.uk/download/pdf/34653128.pdf (accessed on 26 November 2019).
  14. MacDonald, L.; Toschi, I.; Nocerino, E.; Hess, M.; Remondino, F.; Robson, S. Accuracy of 3D Reconstruction in an Illumination Dome. Int. Arch. Photogramm. Remote Sens. Spat. Inf. Sci. 2016, 41, 69–76. Available online: https://discovery.ucl.ac.uk/id/eprint/1503889/1/isprs-archives-XLI-B5-69-2016.pdf (accessed on 26 November 2019). [CrossRef]
  15. Boehler, W.; Marbs, A. 3D Scanning and Photogrammetry for Heritage Recording: A Comparison. In Proceedings of the 12th International Conference on Geoinformatics, Gävle, Sweden, 7–9 June 2004; pp. 291–298. Available online: http://citeseerx.ist.psu.edu/viewdoc/download?doi=10.1.1.452.3508&rep=rep1&type=pdf (accessed on 26 November 2019).
  16. Ahmadabadian, A.H.; Robson, S.; Boehm, J.; Shortis, M.; Wenzel, K.; Fritsch, D. A Comparison of Dense Matching Algorithms for Scaled Surface Reconstruction Using Stereo Camera Rigs. ISPRS J. Photogramm. Remote Sens. 2013, 78, 157–167. [Google Scholar] [CrossRef]
  17. Nicolae, C.; Nocerino, E.; Menna, F.; Remondino, F. Photogrammetry Applied to Problematic Artefacts. Int. Arch. Photogramm. Remote Sens. Spat. Inf. Sci. 2014, 40, 451–456. [Google Scholar] [CrossRef]
  18. Remondino, F.; Pizzo, S.D.; Kersten, T.P.; Troisi, S. Low-Cost and Open-Source Solutions for Automated Image Orientation—A Critical Overview. In Progress in Cultural Heritage Preservation, EuroMed 2012; Lecture Notes in Computer Science; Springer: Berlin/Heidelberg, Germany, 2012; Volume 7616, pp. 40–54. Available online: https://link.springer.com/chapter/10.1007/978-3-642-34234-9_5 (accessed on 26 November 2019).
  19. Bourke, P. Automated 3D Model Reconstruction From Photographs. In Proceedings of the International Conference on Virtual Systems & Multimedia (VSMM), Hong Kong, China, 9–12 December 2014; pp. 21–24. [Google Scholar] [CrossRef]
  20. Besl, P.J.; McKay, N.D. A Method for Registration of 3D Shapes. IEEE Trans. Pattern Anal. Mach. Intell. 1992, 14, 239–256. [Google Scholar] [CrossRef]
  21. Lempitsky, V.; Ivanov, D. Seamless Mosaicing of Image-Based Texture Maps. In Proceedings of the IEEE Conference on Computer Vision and Pattern Recognition, Minneapolis, MN, USA, 17–22 June 2007; pp. 1–6. [Google Scholar] [CrossRef]
  22. Dabove, P.; Grasso, N.; Piras, M. Smartphone-Based Photogrammetry for the 3D Modeling of a Geomorphological Structure. Appl. Sci. 2019, 9, 3884. [Google Scholar] [CrossRef]
  23. Hernandez, A.; Lemaire, E. A Smartphone Photogrammetry Method for Digitizing Prosthetic Socket Interiors. Prosthetics Orthot. Int. 2017, 41, 210–214. [Google Scholar] [CrossRef]
  24. Arduino. Arduino Nano. 2015. Available online: https://www.arduino.cc/en/Main/arduinoBoardNano (accessed on 26 November 2019).
  25. Texas Instruments. ULN200x, ULQ200x High-Voltage, High-Current Darlington Transistor Arrays. 1976. Available online: http://www.ti.com/lit/ds/symlink/uln2003a.pdf (accessed on 26 November 2019).
  26. Porter, S.T.; Roussel, M.; Soressi, M. A Simple Photogrammetry Rig for the Reliable Creation of 3D Artifact Models in the Field. Adv. Archaeol. Pract. 2016, 4, 71–86. [Google Scholar] [CrossRef]
  27. Canon. Canon Digital Camera Software Developers’ Kit. 2014. Available online: https://developercommunity.usa.canon.com/canon (accessed on 26 November 2019).
  28. Google Inc. Android Studio IDE. 2014. Available online: https://developer.android.com/sdk (accessed on 26 November 2019).
  29. Kraus, K. Photogrammetry: Geometry From Images and Laser Scans; Walter de Gruyter: Berlin, Germany, 2007. [Google Scholar]
  30. James, M.R.; Robson, S. Straightforward Reconstruction of 3D Surfaces and Topography With a Camera: Accuracy and Geoscience Application. J. Geophys. Res. Earth Surf. 2012, 117. [Google Scholar] [CrossRef]
  31. Lowe, D.G. Object Recognition From Local Scale-Invariant Features. In Proceedings of the IEEE International Conference on Computer Vision, Kerkyra, Greece, 20–27 September 1999; Volume 2, pp. 1150–1157. [Google Scholar]
  32. Triggs, B.; McLauchlan, P.F.; Hartley, R.I.; Fitzgibbon, A.W. Bundle Adjustment: A Modern Synthesis. In Vision Algorithms: Theory and Practice; Springer: Berlin/Heidelberg, Germany, 2000; pp. 298–372. [Google Scholar]
  33. Wu, C.; Agarwal, S.; Curless, B.; Seitz, S.M. Multicore Bundle Adjustment. In Proceedings of the IEEE Conference on Computer Vision and Pattern Recognition (CVPR), Providence, RI, USA, 20–25 June 2011; pp. 3057–3064. [Google Scholar] [CrossRef]
  34. Furukawa, Y.; Ponce, J. Accurate, Dense, and Robust Multi-View Stereopsis. IEEE Trans. Pattern Anal. Mach. Intell. 2010, 32, 1362–1376. [Google Scholar] [CrossRef] [PubMed]
  35. Furukawa, Y.; Curless, B.; Seitz, S.M.; Szeliski, R. Towards Internet-Scale Multi-View Stereo. In Proceedings of the IEEE Conference on Computer Vision and Pattern Recognition (CVPR), San Francisco, CA, USA, 13–18 June 2010; pp. 1434–1441. [Google Scholar]
  36. Agisoft. Agisoft Photoscan. 2016. Available online: http://www.agisoft.com/ (accessed on 26 November 2019).
  37. Mellado, N.; Aiger, D.; Mitra, N.J. Super 4PCS Fast Global Pointcloud Registration via Smart Indexing. In Proceedings of the Computer Graphics Forum, Cardiff, UK, 9–11 July 2014; Volume 33, pp. 205–215. [Google Scholar] [CrossRef]
  38. Chen, Y.; Medioni, G. Object Modeling by Registration of Multiple Range Images. In Proceedings of the IEEE International Conference on Robotics and Automation, Sacramento, CA, USA, 9–11 April 1991; Volume 3, pp. 2724–2729. [Google Scholar] [CrossRef]
  39. Kazhdan, M.; Bolitho, M.; Hoppe, H. Poisson Surface Reconstruction. In Proceedings of the Fourth Eurographics Symposium on Geometry Processing, Cagliari, Italy, 26–28 June 2006; Volume 7. [Google Scholar]
  40. Cignoni, P.; Callieri, M.; Corsini, M.; Dellepiane, M.; Ganovelli, F.; Ranzuglia, G. MeshLab: An Open-Source Mesh Processing Tool. In Proceedings of the Eurographics Italian Chapter Conference, Salerno, Italy, 2008; pp. 129–136. Available online: https://dblp.org/db/conf/egItaly/egItaly2008 (accessed on 26 November 2019).
  41. Falkingham, P.L. Generating a Photogrammetric Model Using Visual SFM, and Post-Processing With Meshlab; Technical Report; Brown University: Providence, RI, USA, 2013. [Google Scholar]
  42. Wu, C. VisualSFM: A Visual Structure from Motion System. 2012. Available online: http://ccwu.me/vsfm/ (accessed on 26 November 2019).
  43. Boehler, W.; Vicent, M.B.; Marbs, A. Investigating Laser Scanner Accuracy. Int. Arch. Photogramm. Remote Sens. Spat. Inf. Sci. 2003, 34, 696–701. [Google Scholar]
  44. Koutsoudis, A.; Ioannakis, G.; Vidmar, B.; Arnaoutoglou, F.; Chamzas, C. Using Noise Function-Based Patterns to Enhance Photogrammetric 3D Reconstruction Performance of Featureless Surfaces. J. Cult. Herit. 2015, 16, 664–670. [Google Scholar] [CrossRef]
  45. DAVID Group. DAVID-SLS-2. 2015. Available online: http://www.david-3d.com/en/products/sls-2 (accessed on 26 November 2019).
  46. Girardeau-Montaut, D. CloudCompare. 2003. Available online: http://www.cloudcompare.org/ (accessed on 26 November 2019).
  47. Hess, M.; Robson, S.; Serpico, M.; Amati, G.; Pridden, I.; Nelson, T. Developing 3D Imaging Programmes–Workflow and Quality Control. J. Comput. Cult. Herit. 2015, 9. [Google Scholar] [CrossRef]
  48. Collins, T.; Woolley, S.I.; Ch’ng, E.; Hernandez-Munoz, L.; Gehlken, E.; Nash, D.; Lewis, A.; Hanes, L. A Virtual 3D Cuneiform Tablet Reconstruction Interaction. In Proceedings of the 31st British Computer Society Human Computer Interaction Conference, Sunderland, UK, 3–6 July 2017; p. 73. [Google Scholar]
  49. Woolley, S.I.; Ch’ng, E.; Hernandez-Munoz, L.; Gehlken, E.; Collins, T.; Nash, D.; Lewis, A.; Hanes, L. A Collaborative Artefact Reconstruction Environment. In Proceedings of the 31st British Computer Society Human Computer Interaction Conference, Sunderland, UK, 3–6 July 2017; BCS Learning & Development Ltd.: Sunderland, UK, 2017; p. 53. [Google Scholar]
  50. Gehlken, E.; Collins, T.; Woolley, S.I.; Hanes, L.; Lewis, A.; Hernandez-Munoz, L.; Ch’ng, E. Searching the Past in the Future—Joining Cuneiform Tablet Fragments in Virtual Collections. In Proceedings of the 63rd Rencontre Assyriologique Internationale, Marburg, Germany, 24–28 July 2017. [Google Scholar]
  51. Collins, T.; Woolley, S.; Gehlken, E.; Ch’ng, E. Computational Aspects of Model Acquisition and Join Geometry for the Virtual Reconstruction of the Atrahasis Cuneiform Tablet. In Proceedings of the International Conference on Virtual Systems & Multimedia (VSMM), Dublin, Ireland, 31 October–4 November 2017; pp. 1–6. [Google Scholar] [CrossRef] [Green Version]
  52. Woolley, S.; Gehlken, E.; Ch’ng, E.; Collins, T. Virtual Archaeology: How We Achieved the First, Long-Distance Reconstruction of a Cultural Artefact. The Conversation, Art and Culture. 2018. Available online: https://theconversation.com/virtual-archaeology-how-we-achieved-the-first-long-distance-reconstruction-of-a-cultural-artefact-91725 (accessed on 26 November 2019).
Figure 1. (A) multi-viewpoint camera approach for photogrammetric acquisition of a fixed artefact; (B) the rotary photogrammetric approach, achieving the same image set with a fixed camera and moving turntable.
Electronics 08 01441 g001
Figure 2. Block diagram of the hardware components of the rotary acquisition system.
Electronics 08 01441 g002
Figure 3. (A) the turntable and smartphone acquisition app in use, (B) inside the turntable base, (C) the 130 × 130 mm calibration pattern on the turntable platter.
Electronics 08 01441 g003
Figure 4. Side view of the camera geometry illustrating the depth-of-field required for focusing over the entire depth of the turntable (depth-of-field, d 1 ), and over just the depth of the artefact (depth-of-field, d 2 ).
Electronics 08 01441 g004
Figure 5. Block diagram of the signal processing workflow (in the experiments presented in this paper M = 36 and N = 3 or 4).
Electronics 08 01441 g005
Figure 6. Results from the estimation of camera properties and geometry. Estimated camera positions and poses are shown for the real and virtual/reference cameras. The sparse point-cloud formed from the feature points used for matching is visible at the bottom of the figure.
Electronics 08 01441 g006
Figure 7. Example cross-section of two point-clouds, (A) n 1 and (B) n 2 acquired from the same object. Due to the camera and lighting geometry, points p 1 and p 2 would not be expected to have been estimated with the same precision as points p 3 and p 4 . (C) surface normals used to estimate point-cloud precision. Point p 5 has a normal vector with a negative vertical component indicating a poor expected precision. Point p 6 has a large, positive vertical component indicating good expected precision. Point p 7 has a positive vertical component; however, its proximity to the base of the object indicates the point, as well as the estimation of its normal vector, may be imprecise nonetheless.
Electronics 08 01441 g007
Figure 8. (A) a reconstructed dense point cloud acquired from a cuneiform tablet fragment (U 30056) after the automated cropping process; (B) the corresponding confidence metric of each point.
Electronics 08 01441 g008
Figure 9. Camera positions and orientations estimated from four sets of 36 photographs ( M = 4 , N = 36 ). The complete textured model is shown in Figure 10.
Electronics 08 01441 g009
Figure 10. Obverse, reverse, and side views of a completed cuneiform fragment model (U 30080) acquired using the system with the DSLR camera.
Electronics 08 01441 g010
Figure 11. (Ai) and (Bi) are photographs of the two 3D printed cuneiform tablet fragment facsimiles (created from scans of W 18349 and Wy 777) used to test the acquisition precision. (Aii) and (Bii) are 3D models created using the rotary acquisition system with the DSLR camera. (Aiii) and (Biii) are 3D models created using the rotary acquisition system with the smartphone system. (Aiv) and (Biv) are 3D models created using the DAVID-SLS-2 structured light scanner.
Electronics 08 01441 g011
Figure 12. Visualisations of a pair of cuneiform tablet fragments, (A) UET 6/748 and (B) UET 6/759, automatically joined in virtual form with the result shown in (C). The 3D models were acquired using the rotary photogrammetric acquisition system using the DSLR camera.
Electronics 08 01441 g012
Table 1. Quantitative results comparing acquisition precision.
Acquisition DeviceFragment AFragment B
Figure 11(Ai)Figure 11(Bi)
RMS ErrorRMS Error
Rotary Photogrammetric Acquisition (DSLR Camera) 37.7 μ m 39.4 μ m
Rotary Photogrammetric Acquisition (Smartphone Camera) 77.2 μ m 61.9 μ m
DAVID-SLS-2 49.5 μ m 46.1 μ m

