Article

A CNN Based Automated Activity and Food Recognition Using Wearable Sensor for Preventive Healthcare

1
Electronic Engineering Department, QUEST Campus Larkana, Larkana 77150, Pakistan
2
Department of Electrical Engineering, Bahria University, Karachi 75260, Pakistan
3
IBA Community College Naushahro Feroze, Sukkur IBA University, Sindh 65200, Pakistan
4
College of Information and Communication Engineering, Sungkyunkwan University, Suwon 16419, Korea
*
Author to whom correspondence should be addressed.
Electronics 2019, 8(12), 1425; https://doi.org/10.3390/electronics8121425
Submission received: 12 November 2019 / Revised: 25 November 2019 / Accepted: 27 November 2019 / Published: 29 November 2019
(This article belongs to the Special Issue Human Computer Interaction and Its Future)

Abstract

:
Recent developments in the field of preventive healthcare have received considerable attention due to the effective management of various chronic diseases including diabetes, heart stroke, obesity, and cancer. Various automated systems are being used for activity and food recognition in preventive healthcare. The automated systems lack sophisticated segmentation techniques and contain multiple sensors, which are inconvenient to be worn in real-life settings. To monitor activity and food together, our work presents a novel wearable system that employs the motion sensors in a smartwatch together with a piezoelectric sensor embedded in a necklace. The motion sensor generates distinct patterns for eight different physical activities including eating activity. The piezoelectric sensor generates different signal patterns for six different food types as the ingestion of each food is different from the others owing to their different characteristics: hardness, crunchiness, and tackiness. For effective representation of the signal patterns of the activities and foods, we employ dynamic segmentation. A novel algorithm called event similarity search (ESS) is developed to choose a segment with dynamic length, which represents signal patterns with different complexities equally well. Amplitude-based features and spectrogram-generated images from the segments of activity and food are fed to convolutional neural network (CNN)-based activity and food recognition networks, respectively. Extensive experimentation showed that the proposed system performs better than the state of the art methods for recognizing eight activity types and six food categories with an accuracy of 94.3% and 91.9% using support vector machine (SVM) and CNN, respectively.

1. Introduction

The physical activity level of Americans has been observed as very low despite the continuous rise in chronic diet-related diseases [1]. Medical studies suggest that people need physical activity and a balanced diet to live a healthy life and it also reduces the risk of numerous fatal diseases [2]. Significant resources have been invested in research to develop effective medical treatments and drugs to lower the impact of various diseases such as obesity, diabetes, cancer, cardiovascular, bone diseases, etc. To minimize the effect of chronic diseases, technology-based preventive healthcare methods have attracted the attention of practitioners. The widespread development of accurate wearable sensing technology has offered a great platform for healthcare methods. The unique features of skin-inspired sensors, such as flexibility, stretchability, elasticity, biocompatibility, and communication to smart devices, the multifunctional sensors could be conformally and seamlessly attached onto the human body for sensitive monitoring [3,4].
There are several key factors that can minimize the risk of diet-related diseases, especially obesity, if they are properly managed, for example avoiding late-night food and sedentary behavior [5]. Obesity is defined as an unhealthy medical complication in which a person carries excessive fat in the body [6]. Obesity or overweight is the source of many diseases and about half of American adults of all ages are obese [2]. Medical cost associated with controlling obesity was $147 billion in 2008 [7] and the World Health Organization rated obesity as the fifth major cause of deaths worldwide [8]. Energy balancing is an important factor in weight management. The imbalance between energy consumed and energy spent is reflected in weight gain [9]. There are many people who do not control their habit of unscheduled eating and they have low levels of physical activity due to staying more in a sedentary state, which contributes to obesity [10].
An automated system is therefore needed for monitoring the obesity related factors, such as physical activities and food contents. The system should have the ability to provide feedback to participants about the ingested food types and the physical activities performed on each day. Thus, the system can assist the users to eat low energy foods such as fruits and vegetables over high-energy or calorie-dense foods, so as to maintain the ratio of energy consumed and energy expenditure. Currently, significant research has been carried out in the field of physical activity recognition. Some researchers employed wearable sensors [11,12,13,14,15,16,17,18] while others used video sensors [19,20,21] for activity recognition. Wearable sensor-based studies require multiple sensors placed on different body parts to recognize physical activities [12,13]. The design of wearables restricts the movement of the subjects due to wired connections. On the contrary, video sensor-based systems do not require subjects to wear uncomfortable wearable sensors [19,20,21]. However, video sensor-based systems also suffer from limitations such as particular spaces equipped with camera, which restrict the subjects’ movements. Moreover, brightness conditions can also degrade the accuracy of such systems.
Similar to the above studies on physical activity recognition, there have been attempts to design non-invasive food recognition systems that can recognize different food types [22,23,24,25,26,27,28]. The authors of [29] employed various sensors such as a microphone, camera, gyroscope, strain gauge, piezoelectric sensor, and weight scale for food recognition. The microphone has been widely used in food recognition [22,23,24,25] as it gives better accuracy than other sensors. Microphone-based food recognition systems have limitations such as audio sensing fails to classify soft food types due to background noise [26]. Therefore, microphone-based systems require additional sensors to classify broad food categories and to minimize the effect of environmental noise. Although some prior studies have performed well for food recognition in challenging environments [26,27,28], they have not addressed the problem of the activity recognition.
The challenges present in existing activity and food recognition systems motivated us to design a system that can not only recognize physical activities but also can classify food categories. To the best of our knowledge, no one has proposed a system for combined recognition of activity and food yet. In this paper, we present an automated monitoring system that can assist individuals in keeping an eye on their daily routine and diet. Our designed system is based on a smartwatch and a necklace, which can achieve the goal of recognizing physical activities as well as food categories simultaneously. The contributions of our research are best explained in four aspects.
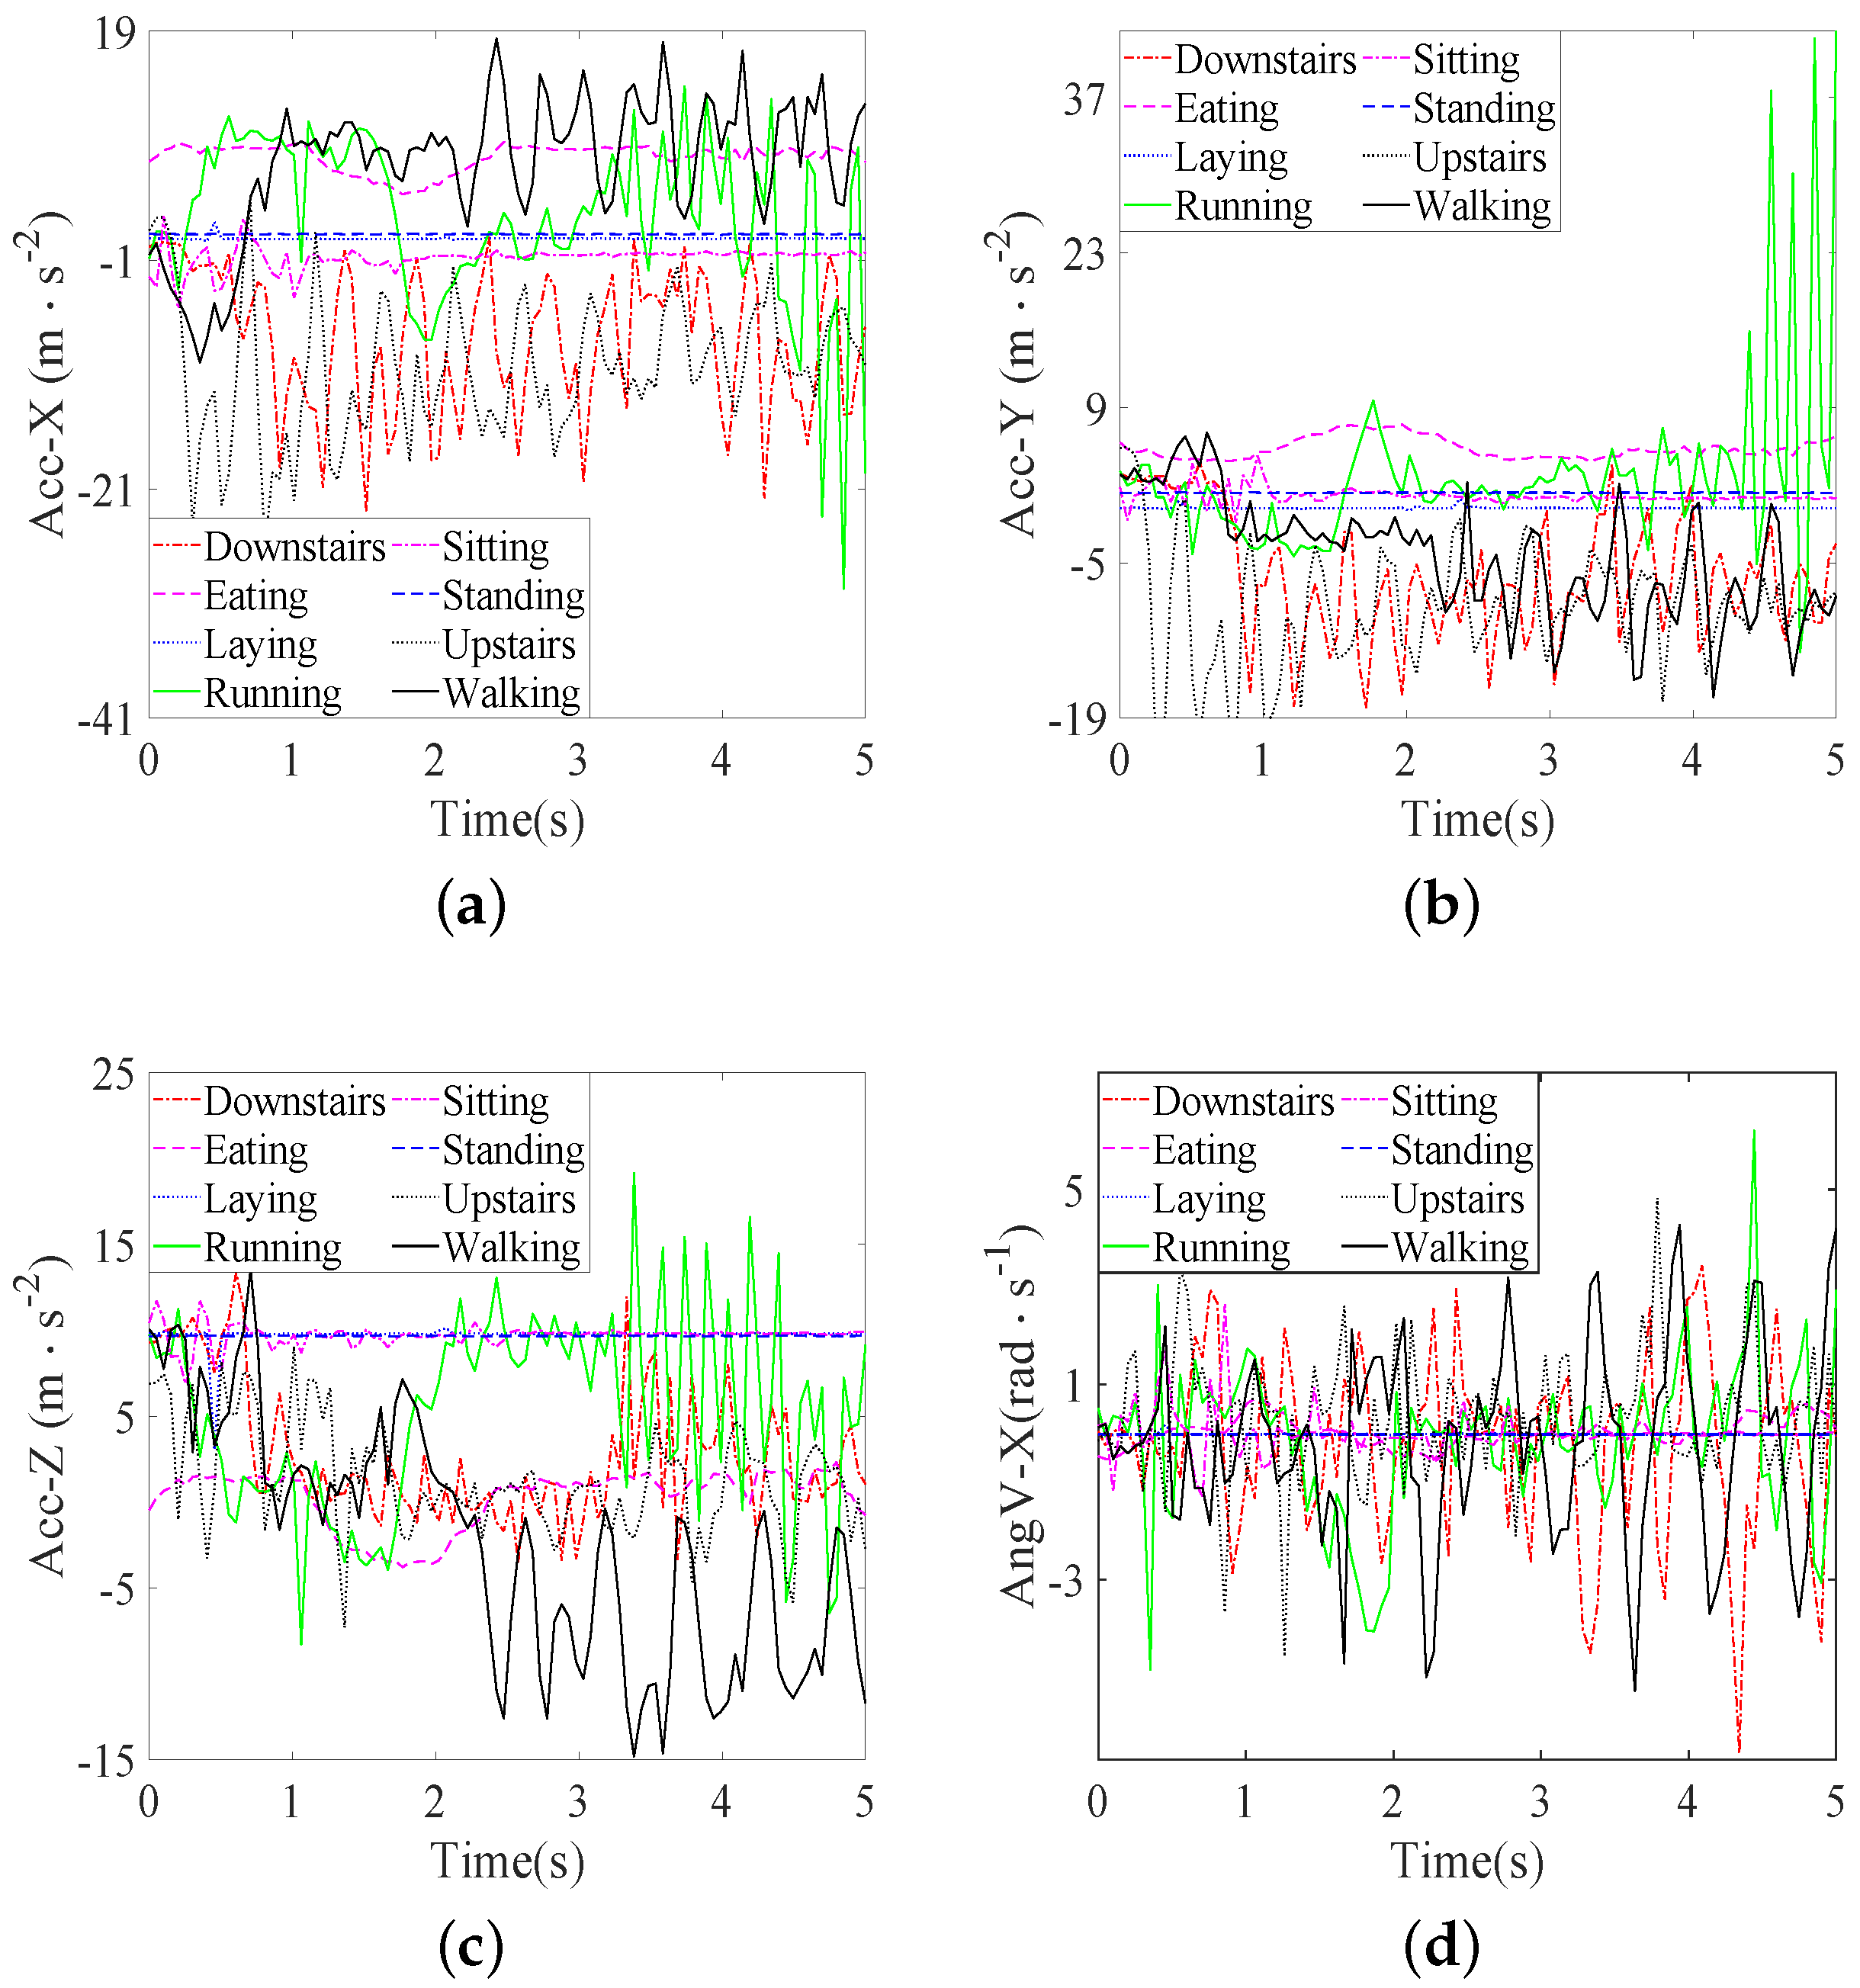
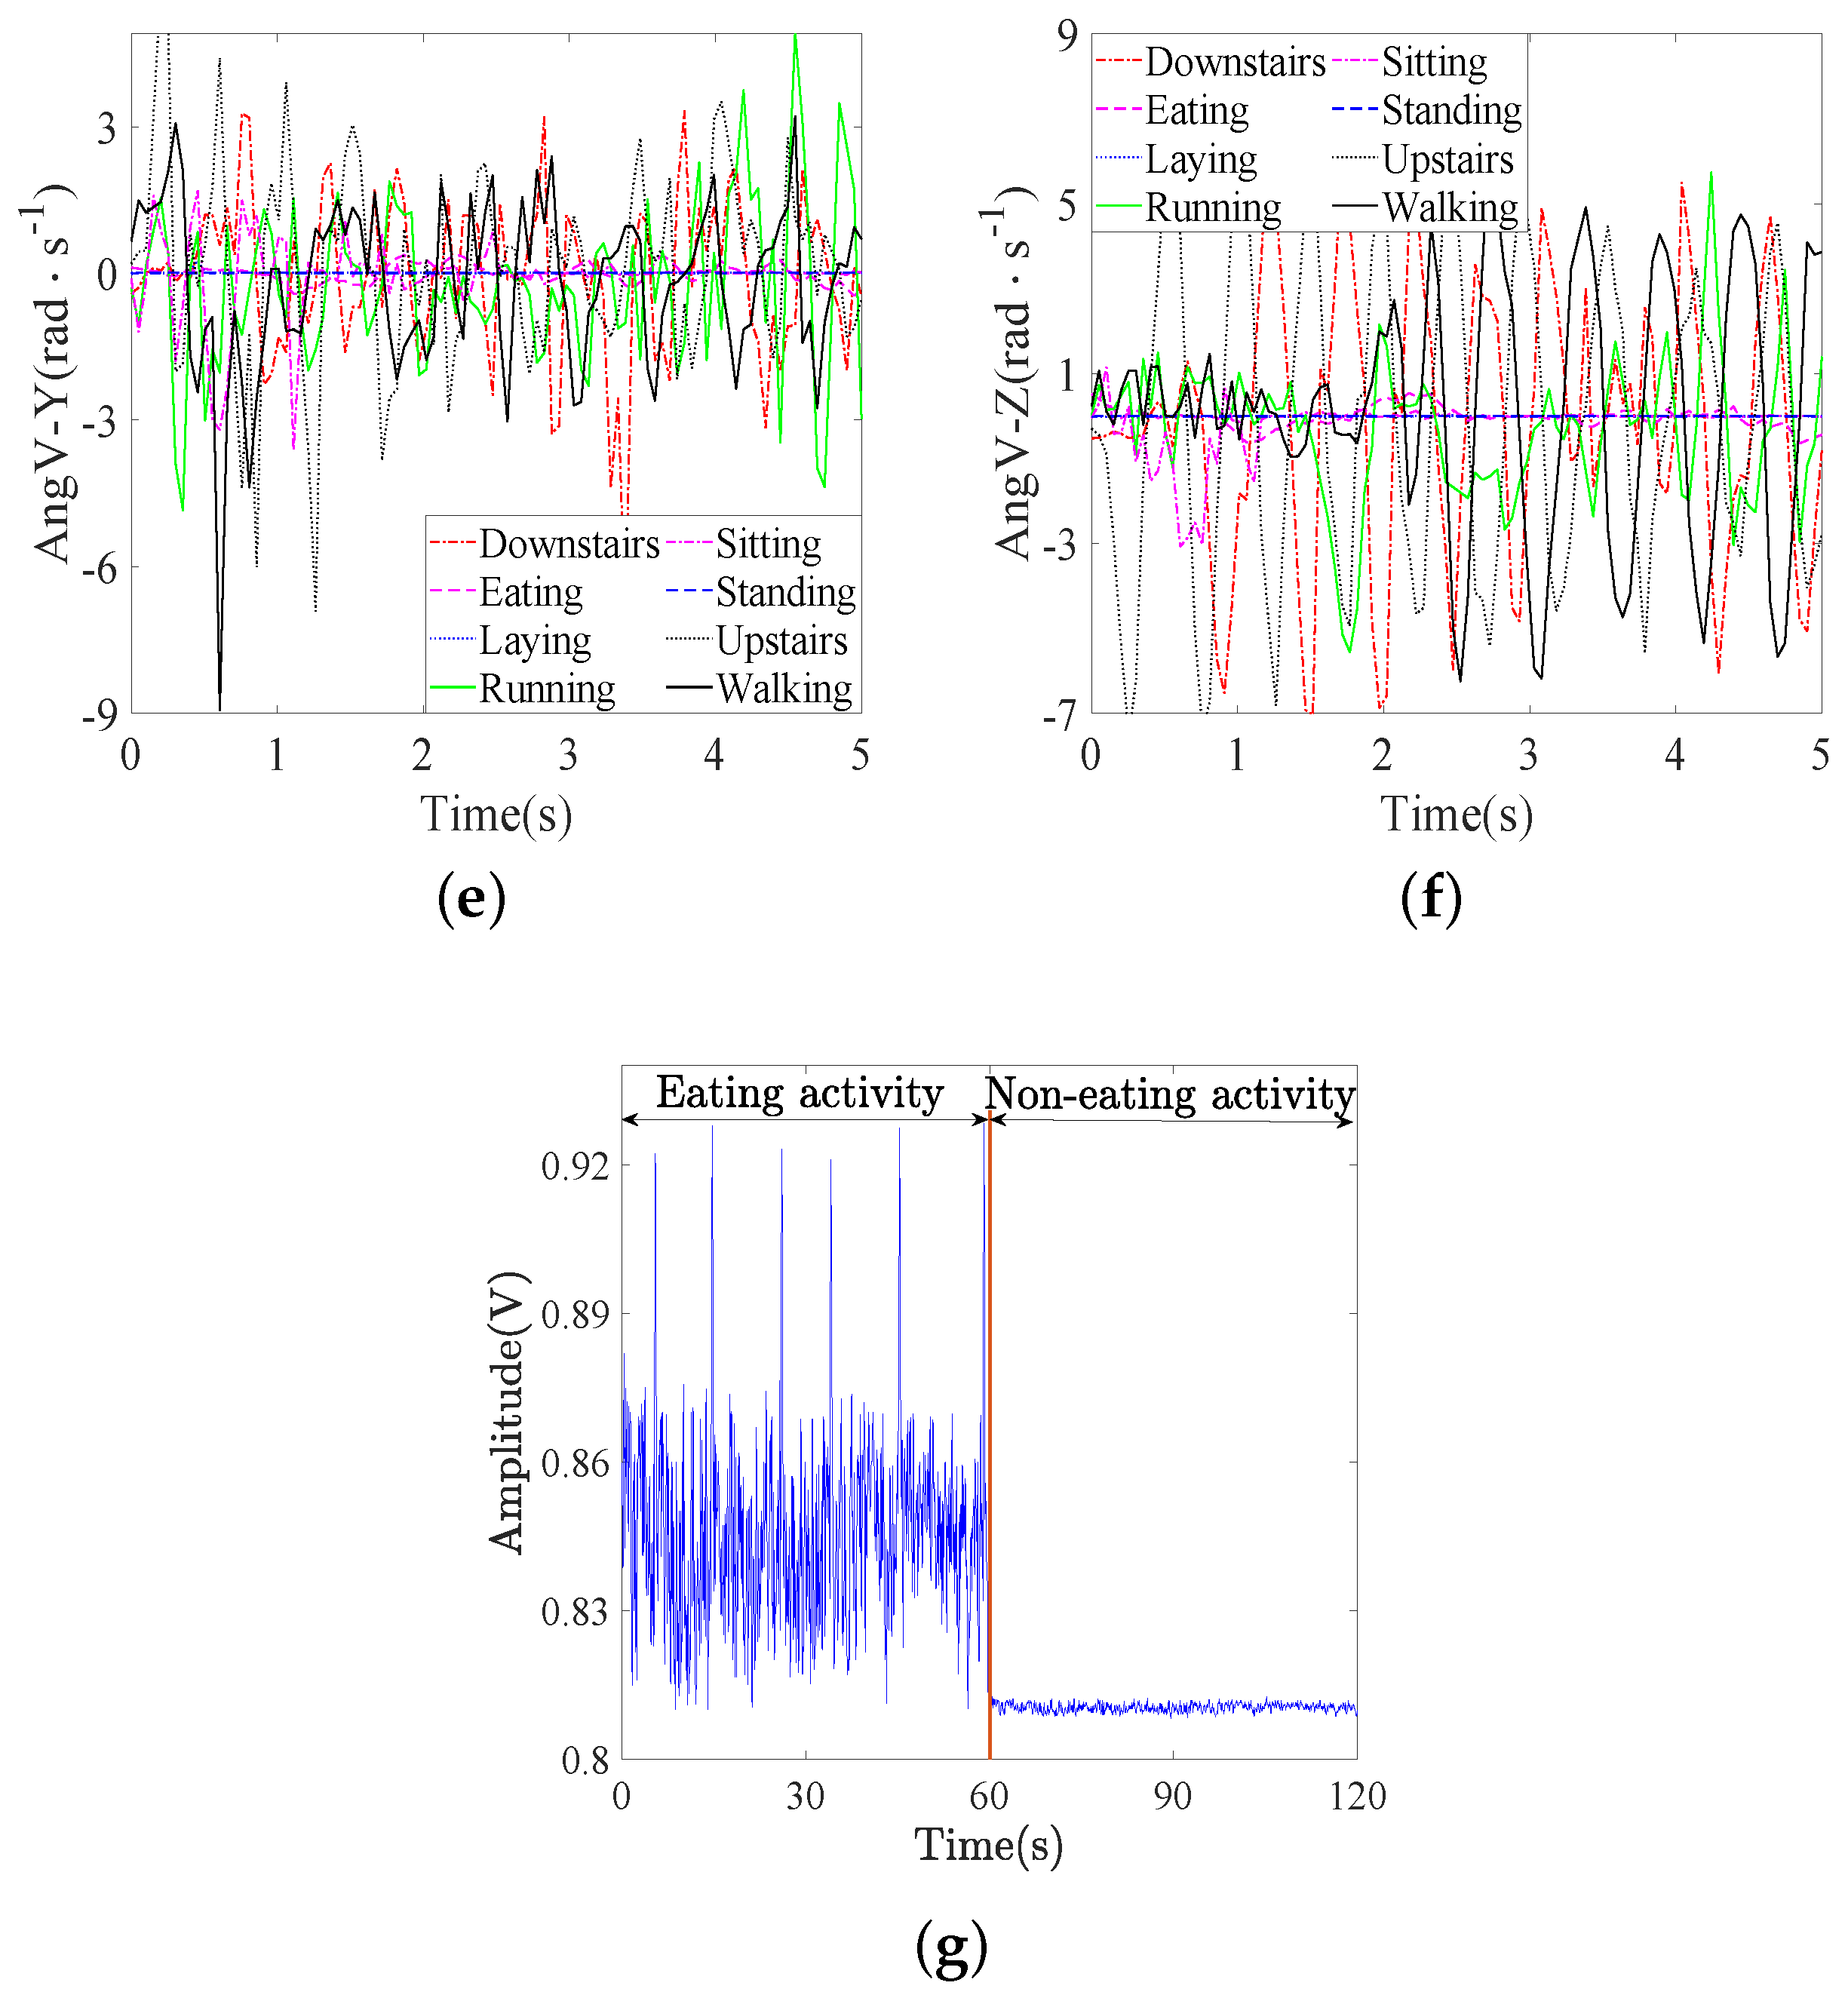
  • First, we employ the motion sensors of a smartwatch and a piezoelectric sensor with a stretchable necklace to develop an automated system for monitoring the activities and food types. The motion sensors generate distinct patterns for the eight physical activities. Likewise, the piezoelectric sensor produces different patterns for ingestion of six food categories.
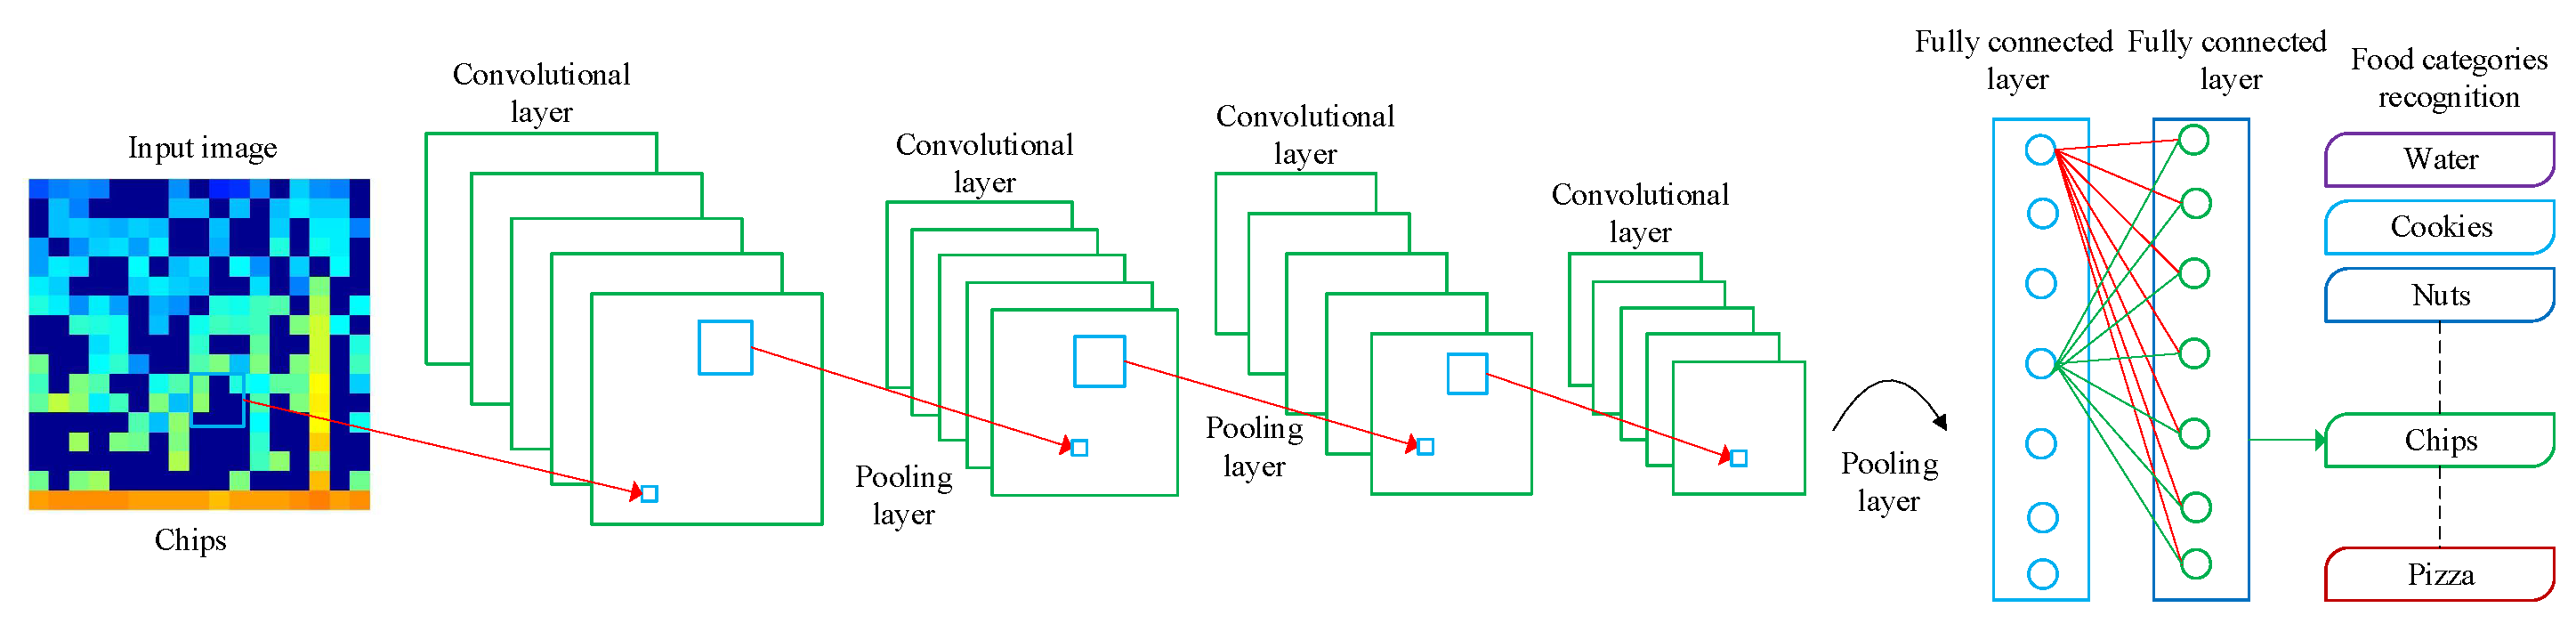
  • Second, our food recognition approach based on CNN accurately classifies spectrogram-generated images of six food categories in real-life settings.
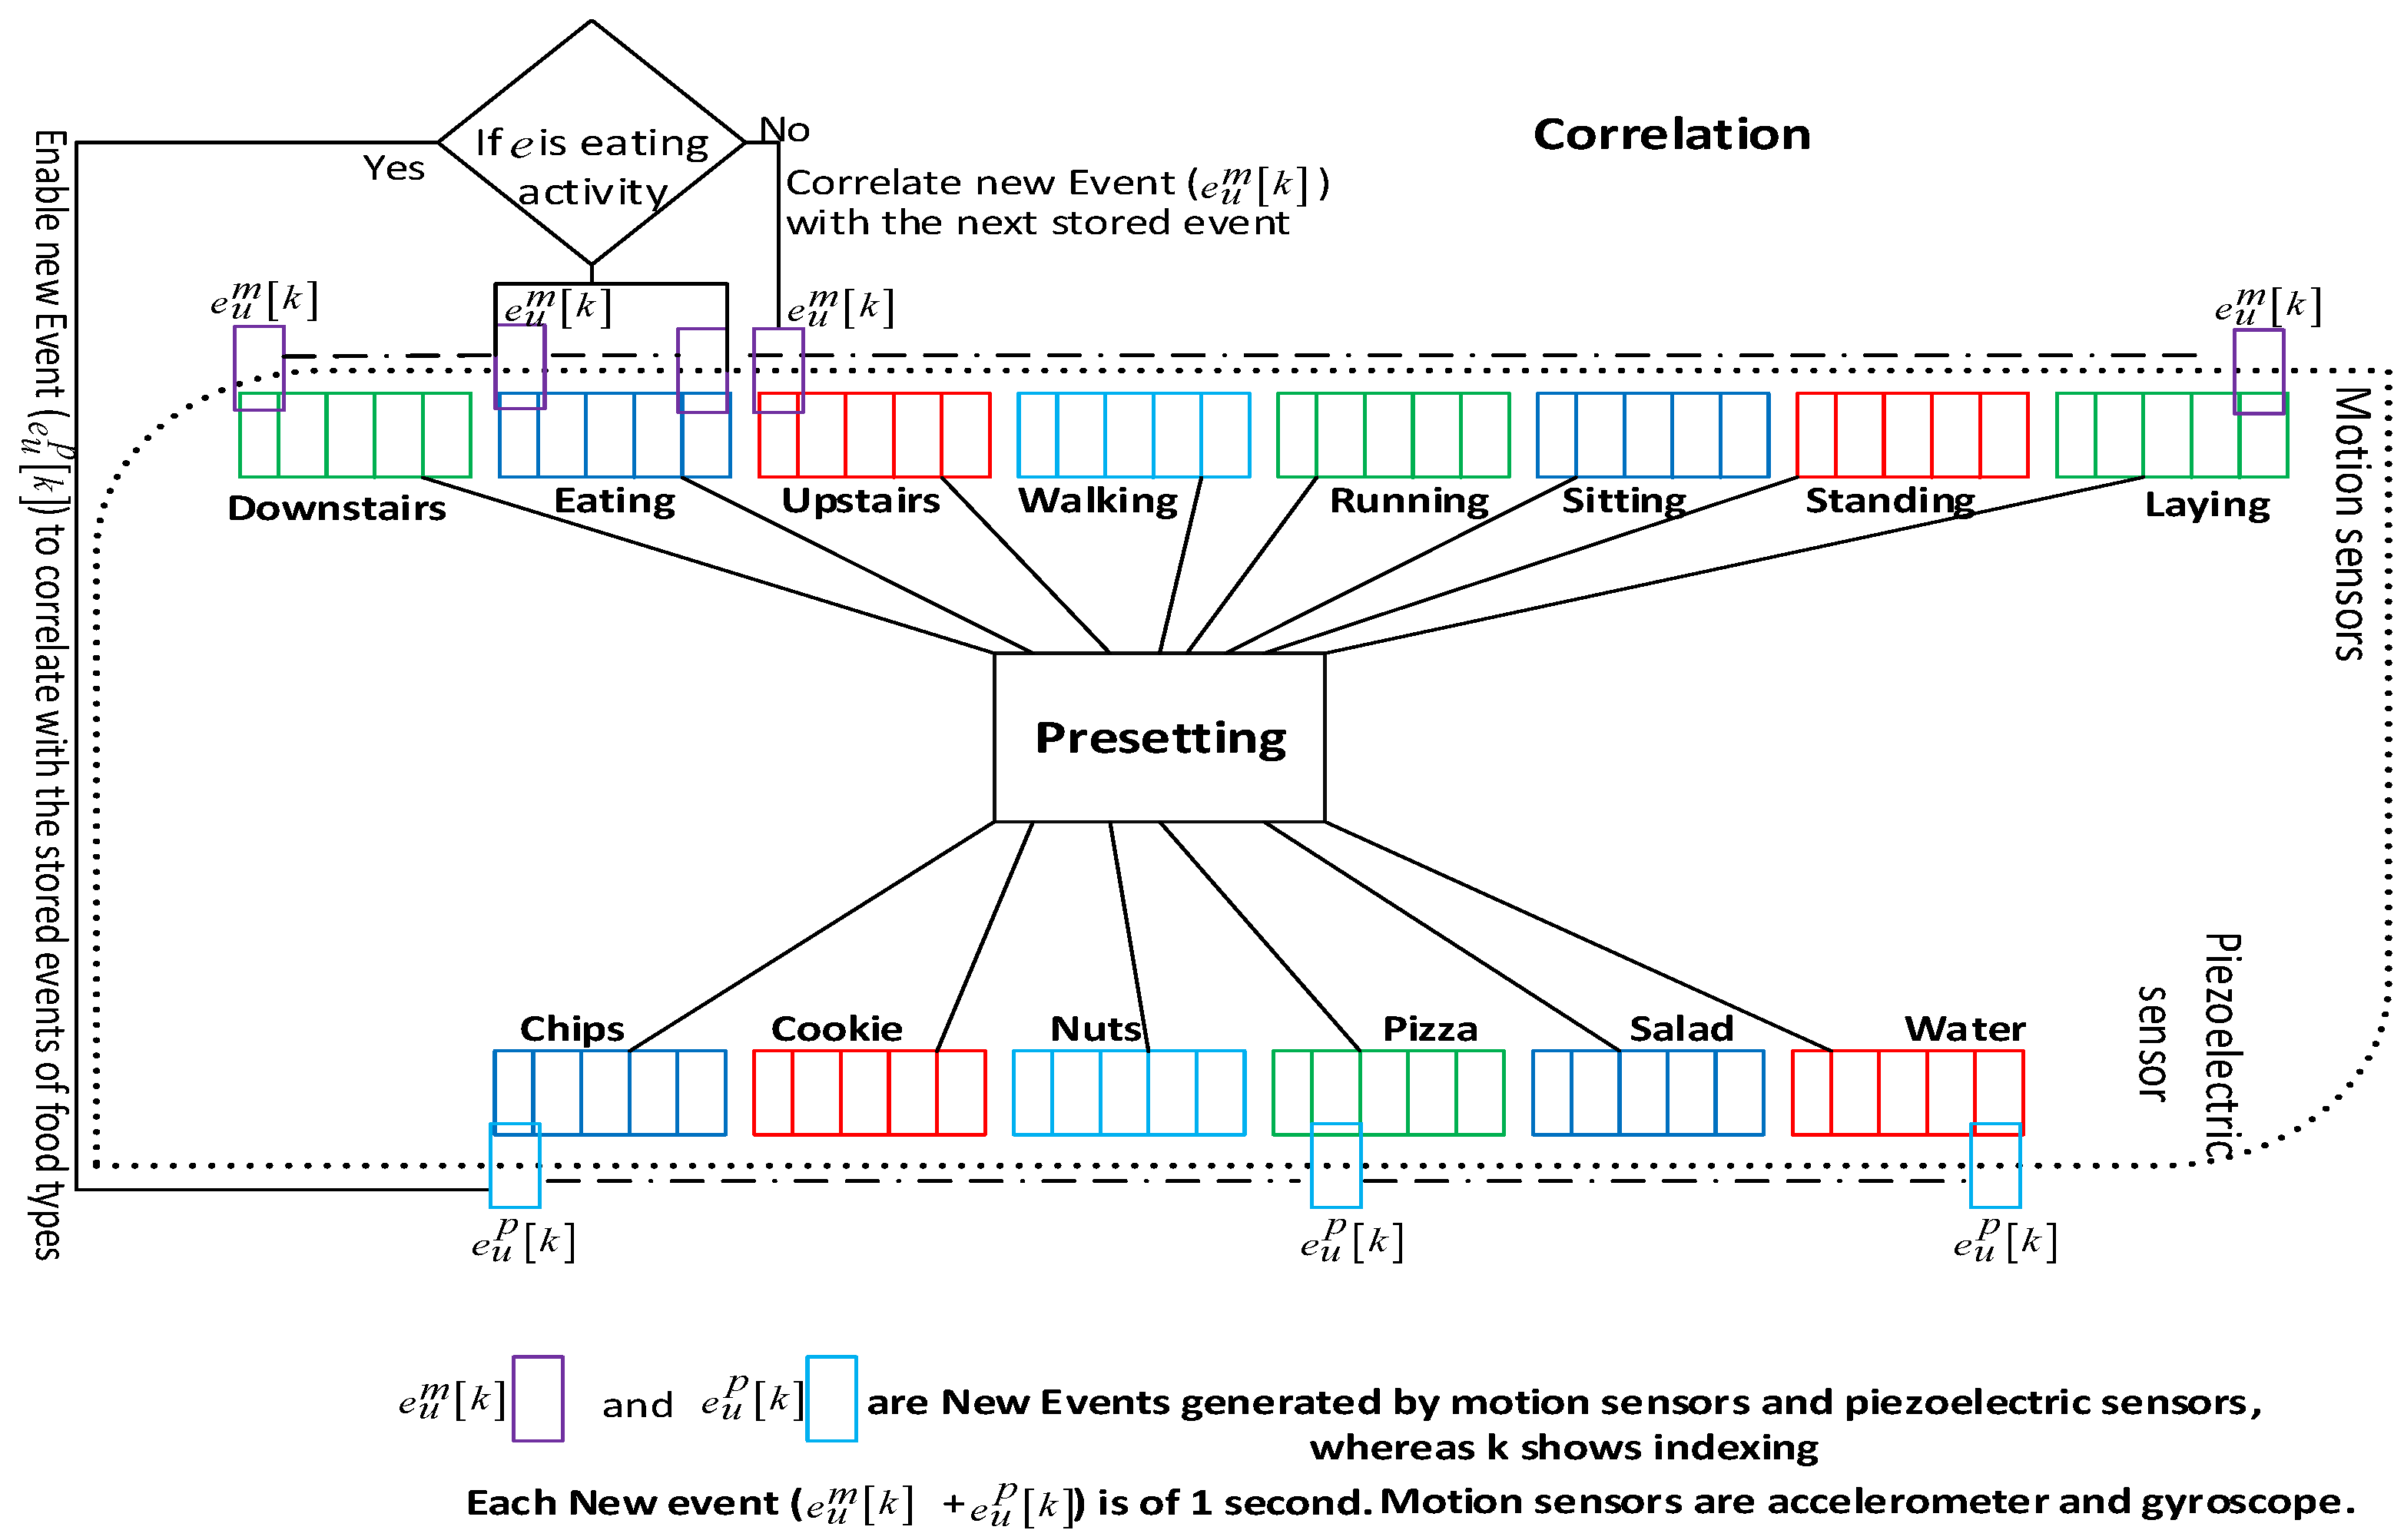
  • Third, we propose a new algorithm named as event similarity search (ESS) that helps in the annotation of experimental data automatically. We choose a segment with dynamic length, which represents signal patterns with different complexities equally well.
  • Fourth, our employed wearable sensors have better user-experience because their design does not limit the natural movements of the subjects and does not interfere with the subjects’ respiration process.
The rest of this paper is organized as follows. Previous studies related to activity and diet monitoring are discussed in Section 2. Section 3 describes the experiment process, proposed system architecture in addition to signal segmentation. Features extraction and selection along with the classification of the activities and the food categories are explained in Section 4. In Section 5, we present experimental results and discuss system performance for the activities and food recognition. The paper concludes with potential plans for the future in Section 6.

2. Related Work

In this section, we present the related work for physical activities and food activity recognition. Then, we review the conventional neural network (CNN).

2.1. Physical Activities

During the last decade, there have been numerous studies presented in the field of physical activity recognition using wearable and video sensors [12]. Much of the work on activity recognition relies on computer vision [30]. Computer vision does not perform well in wearable domain owing to occlusion and variations in lightning conditions. Therefore, non-visual sensors, such as accelerometers and gyroscope, have been employed in the analysis of activity and body posture [11,12,13,14,15,16,17,18]. Prior to smart devices, multiple sensors were attached to the body of the subject for the recognition task [12,13]. Attaching multiple sensors was reported as cumbersome and uncomfortable [31]. However, measuring the activity of the user has become easy owing to sensor-embedded smart devices.
One-dimensional CNN was used previously for recognizing human activities from data of triaxial accelerometer [11]. The accelerometer data were transformed into one-dimensional vector magnitude data that were used for training the CNN. The method proposed in [11] attained an accuracy of 92.71%. Although the authors used a complex CNN algorithm, the performance of the algorithm degraded due to limitations such as small sampling frequency and a small set of activities. Google developed an API for recognition of physical activities, such as running, riding a bicycle, walking, and being stationary [16]. The data were gathered using the sensors present in the smartphones of users. The performance of Google API is poor when one activity is sandwiched into other activity, for example running is preceded and succeeded by walking. The main reason for the poor performance of the API is static segmentation. Static segmentation fails to separate patterns of activities from each other if some part of the signal pattern of activity is embedded into the signal pattern of another activity.
An Internet of Things (IoT)-based physical activities recognition system was designed to remotely monitor crucial symptoms related to the condition of chronic heart patients [17]. The system using learning algorithms inferred health of patient within four physical activities (lie, sit, walk, and run) and time spent on the activities. The idea of monitoring activities in the context of healthcare is of importance but the system was employed on a small portion of the population and included a small set of activities. A deep architecture consisting of convolution-temporal layers was designed to predict attributes that favorably represent signal segments for recognition of human activities [18]. The network was deployed for identification of the activities encountered the limitations, such as computational complexity and complex error-prone attributes. For example, moving left and right foot in forward direction is considered as walking, but the aforementioned actions could also be used for running [18].
There is one well-known study based on visual sensors for human activity recognition [19]. In this study, the authors presented an activity recognition system based on multi-fused features, which recognized activities from depth map sequences [19]. The designed system divided human depth outlines into parts and obtained human skeleton joint using temporal human motion and spatiotemporal human body information, respectively. Four skeleton joint features and one body shape feature were concatenated by using spatiotemporal multi-faced features. Hidden Markov model (HMM) was trained on the selected multi-fused features and then recognized the activities [19].

2.2. Dietary Behavior

Previous dietary monitoring methods are mainly divided into two broad categories: manual and automated methods. Manual methods of food intake monitoring are based on food frequency questionnaires (FFQ) and dietary recall [32,33,34]. These methods require daily food intake lists in a special format and expert dietitians to help subjects recall their intake of foods during the past 24 h. It is hard for individuals to remember the contents and amount of foods all the time. Dependence of manual procedures on self-reporting often leads to under-reporting of consumption, non-compliance and discontinued use over a long time. Although a questionnaire-based approach is inexpensive, it is erroneous because of incomplete food lists, poor user compliance, errors in recording frequency, and errors in recording the serving size.
As manual methods of meal intake rely on 24 h-recall and questionnaires [32,33,34] were subjective and unreliable, an alternative new approach, automated food intake monitoring, has been developed to investigate monitoring of food intake amount and identification of food type. For alleviating the problems present in manual methods, different researchers [23,24,25,27,28,35,36,37,38,39,40,41] have developed automated non-invasive food monitoring methods using different sensors to collect physiological signals relating to the eating activity. Amft et al. [35] integrated surface electromyography (SEMG) and a microphone in collar-like fabric to detect and classify swallow during eating and drinking. They obtained a recognition rate of 73–75% for volume and viscosity classification of the swallow.
A study based on inertial sensors, microphones, and surface electromyography (EMG) was designed to identify dietary activity events [37]. The authors used the sensors to monitor arm and trunk movements, while chewing and swallowing sounds were used for recognition of dietary activity. They detected the four arm movements and two food groups with a recall of 80–90% and a precision of 50–64% using chewing sound.
Bi et al. developed embedded hardware named as AutoDietary for food intake recognition, which consists of a throat microphone and a smartphone application [23]. A throat microphone is worn on the neck of the subject for collecting acoustic signals non-invasively while eating any food. AutoDietary classifies seven food categories in addition to the binary classes of solid and liquid with an accuracy of 84.9% and 99.7%. AutoDietary has performed well in classifying the broad range of categories with enough accuracy in the laboratory setting. However, the accuracy of such a system based on the microphone can drastically decrease in the real environment because surrounding noise can interfere with the sound of food intake. Alshurafa et al. also designed a wearable system for nutrition monitoring that was in the form of necklace embedded with a piezoelectric sensor for detecting skin motion in lower trachea during ingestion [28]. Their method classifies foods in few classes such as solid and liquid, hot and cold, and hard and soft using statistical features collected from spectrogram.
Kalantarian et al. introduced a low-cost necklace embedded with a piezoelectric sensor that helps recognize water, potato chips, and sandwich foods through generating unique voltage patterns according to skin movements of a user’s neck [27]. The wearable system of [27] has attained accuracies of 85.3%, 81.4%, and 84.5% for chips, water, and sandwich, respectively. Selected food categories in their experiment were not representing a broad range of foods. Besides, the accuracy of their method is low as they smoothed out an important pattern of chewing. The authors of [25] evaluated eating behavior with a new modality of the smartwatch as a smartwatch has higher user acceptance. They used the smartwatch’s built-in microphone to record and detect chews and swallows. Unlike the work in [24,27,28], the authors did not filter out chewing patterns and therefore their system performed classification with an F-measure of 94.5%. Although the smartwatch-based system has attained high food recognition performance in laboratory settings, its performance is expected to decrease in the real environment due to surrounding noise.
A dining table embedded with a scale [39] or covered with textile pressure sensors [40] can be deployed to weigh food continuously. The tables can be configured to compute gram changes in different areas [40]. This method is typically used in a fixed environment. The camera-based approach captures a picture of intake before and after eating [41]. It requires a trained observer who can constantly estimate the quantity of food eaten by the subjects. The accuracy of camera-based approach can be affected if the view of the camera is not aligned to the food plate and lighting condition. The systems based on table and camera are not practical in daily life because such systems are immovable and fixed to a particular location. The conventional approaches have limitations and do not consider activity and food recognition together.

2.3. Preliminary of CNN

A CNN is a deep learning algorithm which is widely applied for solving the complex problems using images as input. CNN assigns importance to various aspects or objects in the image through hand-engineered filters and is able to learn to classify images of different categories. A CNN requires much lower computation as compared to other classification algorithms [42]. CNNs are extremely good at detecting patterns in images, for example recognizing objects, faces, and scenes [43]. Main applications of CNN in the area of computer vision is self-driving vehicles [44] and face-recognition [45]. CNN models automatically extract the features and henceforth produce state-of-the-art recognition results [46]. Different CNN models are designed with layer counts ranging from tens to hundreds, which learn to extract different features of an image. Filters with different resolutions are applied to each training image and their convolved output is propagated as the input to the next layer. Each layer of a CNN carries a different count of neurons. A connectivity pattern of neurons in the human brain and organization of the visual cortex inspired the researchers to envision the present architecture of a CNN. Individual neurons respond to stimuli only in a restricted region of the visual field known as the receptive field. The collected fields overlap to cover the entire visual area. The researchers designed the filters with different resolutions after gaining inspiration from the neurons in the human brain. The filters in initial layers detect basic features, such as edges and brightness, and complex features are found by the last layers.
There are five main layers in the CNN model: convolutional (conv), activation, pooling, fully-connected (FC), and softmax layer. The conv layer contains a set of convolutional filters, each of which activates certain features from the images. The filters in each conv layer hold the local features of the input image, such as edges, blobs, shapes, etc. The activation layer, also known as a rectified linear unit (ReLU), activates the particular neuron after computing a nonlinear function of the input. Pooling layer reduces the number of parameters by decreasing the spatial size of the input or the network. The FC layer, identical to hidden layers of the traditional neural networks, represents important composite and aggregated features or information from all the convolutional layers appeared before it. Softmax layer normalizes the predictions and enables the network to generate the outputs as probabilities. Cross-entropy loss is also measured at a softmax layer. The mathematical representation of the main five layers of the CNN is given by Equation (1) [47].
Convolutional layer:
g j l = x i l 1 ( s , t ) ω i j l = σ = n 1 n 1 ν = n 2 n 2 x i l 1 ( s σ , t ν ) ω i j l ( σ , ν )
Activation or ReLU layer:
x j l = m a x ( 0 , i M j g j l + b j l )
Pooling layer:
x j l + 1 = f p ( β j l + 1 ( x j l ) + b j l + 1 )
Fully-connected layer:
x L 1 = f c ( β L 1 x L 2 + b L 1 )
Softmax layer:
z d = e o d c = 1 C e o c e x d L 1 c = 1 C e x c L 1
An image with three channels (i.e., RGB colors) is fed into the CNN, in which input passes sequentially through a series of the layers. The layer could be a convolutional, activation, pooling, fully connected, or a loss layer. The i feature maps ( x i l 1 ) of the previous layer are convolved with jth learnable filter ( ω i j l ) present in the current or lth convolutional layer, which outputs jth new feature map ( x j l ) after applying activation or ReLU function. This tells us the new feature map of present layer l depends on feature maps in the previous layer l 1 . The CNN employs cross entropy loss ( Υ ) to determine the deviation between actual distribution and the distribution produced by the model [48]. Υ is computed using Equation (2).
Υ ( y , z ) = d y d log ( z d )
For backpropagation, the partial derivative of cross entropy loss Υ is computed with respect to outputs o of the previous fully connected layer as given in Equation (3).
Υ o d = c y c log ( z c ) z c × z c o d = c y c 1 z c × z c o d = y d ( 1 z d ) c d y c 1 z c ( z c · z d ) = y d ( 1 z d ) + c d y c · z d = y d + y d z d + c d y c · z d = z d ( y d + c d y c ) y d Υ o d = z d y d y d + c d y c = 1
The computed partial derivative value of Υ is backpropagated to previous layers in order to tune the learnable filters of CNN, and thus backpropagation technique minimizes the recognition error.
Different architectures of CNN, such as ZF Net, GoogleNet, AlexNet, and ResNet, have been presented. We chose the pretrained AlexNet model [49] and employed transfer learning strategy to develop the food recognition model. The transfer learning technique provides a convenient way to implement deep learning without requiring complex computation, training time, and a huge dataset. The employed neural network, which has 60 million parameters and 0.65 million neurons, contains five conv layers followed by activation, pooling, and three FC layers with a final softmax layer. Dropout technique is used to regularize the model and thus enables the model to avoid overfitting.

3. Proposed System Architecture and Methods

In this section, we first present the system architecture. Then, we discuss the experiment protocol and event similarity search algorithm.

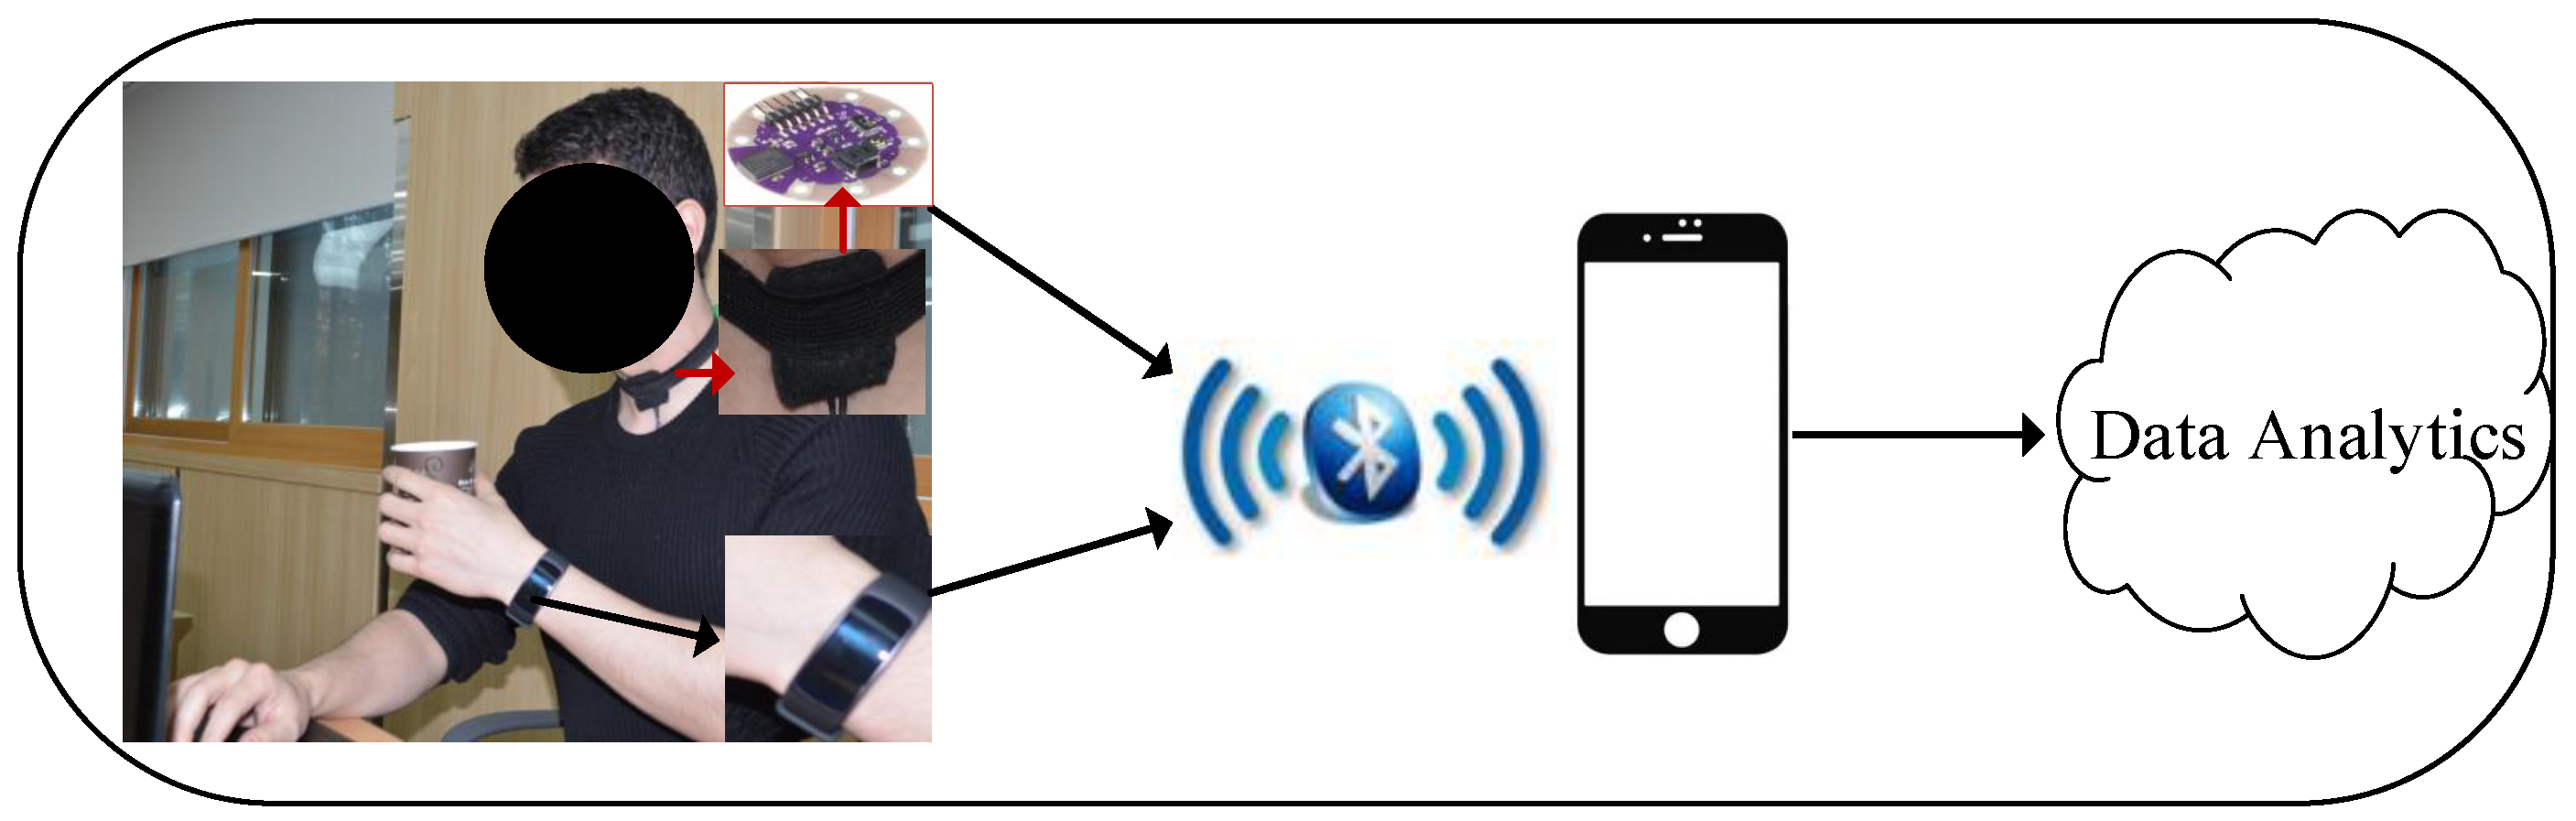
3.1. System Architecture

Our system consists of a smartwatch (Samsung gear fit2), a piezoelectric sensor (LDT0-028K) embedded in a necklace along with a LilyPad Simblee microcontroller and an application (App) running on a smartphone (developed on Tizen studio platform). The LDT0-028K sensor comprising of a 28 μ m thick piezoelectric PVDF polymer film laminated to a 0.125 mm polyester substrate and fitted with two crimped contacts. One end of the piezoelectric sensor is connected to the general-purpose input/output (GPIO) pin of the simblee microcontroller, which has a built-in analog to digital converters (ADCs), and the other end of the sensor is grounded. The sensor produces voltages within standard CMOS input voltage ranges when deflected directly. The sensor can operate under thermal conditions ranging from 0 to 85 °C. The LDT0-028K is available with additional masses at the tip that reduces the resonant frequency but can also increase the sensitivity of the device. In the configuration without an additional mass at the tip, the sensor has a sensitivity of approximately 50 mV/g at baseline and 1.4  V/g at resonance [50]. We utilized a smartwatch (Samsung gear fit2), which consist of STMicroelectronics LSM6DS2 sensor, featuring a 3D accelerometer and a 3D gyroscope [51]. The sensor requires a voltage between 1.71 V and 3.6 V, with smart FIFO up to 8 kbyte based on features set. The sensor performs at 1.25  mA (up to 1.6  kHz ODR) in high performance mode and enables always-on low-power features for an optimal motion experience. The sensor is used for applications of indoor navigation, IoT and connected devices, intelligent power saving for handheld devices, vibration monitoring and compensation, and 6D orientation detection.
The wearable sensors employed in this work perform the data collection and wireless data transmission to a smartphone. Body acceleration and angular movement were recorded with motion sensors present in the smartwatch. Neck skin movements were captured by a piezoelectric sensor embedded into the necklace. The smartwatch and the necklace communicate with the app running on the smartphone through Bluetooth, as shown in Figure 1. The app transmits the received data to a cloud server for data analytics at a sampling frequency ( Φ ) of 20 samples/second.
Data stored in cloud server are processed offline in MATLAB2017b. The architecture of the proposed wearable sensors system is shown in Figure 1. The signals of the piezoelectric sensor and motion sensors during different activities are shown in Figure 2.

3.2. Experimentation Protocol

We recruited 20 test subjects (6 females and 14 males, average age 32.5 ± 11.34 years, average body mass index (BMI) 27.42 ± 7.1 kg/m2) to analyze our proposed system in a realtime environment. Each subject signed a consent form prior to the experiment and their rights were protected following the declaration of Helsinki. Subjects were healthy, could perform physical activities freely, and did not suffer from any disease which would impact their ingesting any food. The activities performed by the subjects were (A): Downstairs (1); eating (2); upstairs (3); walking (4); running (5); sitting (6); standing (7); abd laying (8). Eating activity (E) was further sub-divided into the following six categories of food (E): chips (21); cookie (22); nuts (23); pizza (24); salad (25); and water (26). Each activity and food class was assigned a label (i), which was used later. Each subject participated in the experiment three times. Subjects had to perform all activities and eat two food categories of their own choice in each visit. Three visits by each subject constituted a total of sixty visits for analyzing proposed study. Subjects followed a protocol during each visit, which started with 1 min speaking, 1 min talking on the phone, performing all the activities, and ended with eating two food categories of choice. Each subject performed the activity in Set A twice without any restriction of a time limit. For eating activity, subjects chose two types of food of their own choice from Set E. The motion sensors of the smartwatch continuously monitored for any sign of activities listed in A, whereas the necklace sensor listened exclusively for the eating activity (E).
All activities performed by the subjects illustrated the daily-life activities. The participants were allowed to run or walk at their natural speed. Food categories consumed by the individuals were representative of food items that may be ingested in a meal or as a snack. There was no restriction on the subjects’ body movement throughout the experimentation.

3.3. Event Similarity Search Algorithm

We developed and applied a new technique of the signal segmentation named as Event Similarity Search (ESS) (See Algorithm 1). We divided the input data into 20 samples/mini-segments. Each mini-segment is defined as an “event” (e). The motion sensors generate distinct signals for a different set of the activities and the piezoelectric sensor generates unique ingestion patterns for the food categories.
The signals belonging to different classes are grouped into different clusters using ESS. The signals of accelerometer and gyroscope are denoted by α x , α y , α z and β x , β y , β z in x-, y- and z-axes, respectively. The notation γ represents the signal of the piezoelectric sensor. All sources of signals are indexed by (q). ESS is a two-step approach. 1. Presetting: While activity is being performed, the first 5 e l i , q s of the input data for each activity are saved and defined as a reference segment ( S r i , q [ l ] ) which creates a dictionary (D) as given by Equations (4a) and (4b). 2. Correlation: ESS tries to identify the activity being performed by correlating every input e κ q with S r i , q [ l ] from the dictionary D. If an  e κ q correlates with an S r i , q [ l ] , then ESS identifies the particular activity being performed, as shown in Equation (5). The events with almost no correlation are considered as noise and, hence, discarded.
D = S r i , q [ l ] i ψ & l { 1 , 2 , , 5 } & q { 1 , 2 , , 7 }
S r i , q [ l ] = e l i , q i ψ & l { 1 , 2 , , 5 } & q { 1 , 2 , , 7 }
r κ = C o r r e κ q , D r θ i e κ q S r i , q [ l ] = 1 e k i , q S j i q
O ψ = S j i i ψ & j N
S j i = e k i , q i ψ & q { 1 , 2 , , 7 } & k { 1 , 2 , , 5 }
where ψ equals {A or E}, r θ i is correlation threshold value, r κ is correlation coefficient computed between the events e l i , q in S r i , q [ l ] of D, and e κ q contains all sources of signals q and is acquired in κ th second.
The working principle of an ESS approach is shown in Figure 3. This approach of signal segmentation requires only a segment of each physical activity and food category. Each already saved segment consists of five events. Therefore, five events of motion sensors signal for eight different activities and five events of the piezoelectric sensor for six food categories are saved in Presetting stage. ESS correlated each remaining unlabeled event containing motion sensors signal with each already saved segment (i.e., motion sensors signal) of different activities. The label is assigned to an unlabeled event based on an outcome of its correlation with the saved segments of the activities. An unlabeled event ( e u ) attains a vote if it is correlated to the event of the segment of particular activity higher than the reference threshold (i.e., r θ ). This way, e u is correlated to the segment of each activity five times. We set an odd number of events in each segment of the activities because these events help to annotate the e u with a particular label. The annotation is done based on majority voting results of correlation between e u and the already saved segments of the activities. Thus, all e u s of data carrying information about the activities are annotated. An e u annotated with eating activity triggers the annotation process for the e u of piezoelectric sensor signal because food categories are sub-classes of eating activity. Similar to the annotation of the activities data, all e u s of the data carrying piezoelectric sensor signals for food categories are annotated.
Algorithm 1 Event similarity search algorithm.
 1:
Input: α x , α y , α z , β x , β y , β z , γ ; k = 1 ; i ψ ; λ : C l a s s T y p e
 2:
/* Presetting */
 3:
for   i = 1 t o i n do
 4:
   for   l = 1 t o τ ( τ =5seconds data) do
 5:
   S r i , 1 [ l ] , S r i , 2 [ l ] , S r i , 3 [ l ] e l i , 1 , e l i , 2 , e l i , 3 Φ ( { α x , α y , α z } , l )
 6:
   S r i , 4 [ l ] , S r i , 5 [ l ] , S r i , 6 [ l ] e l i , 4 , e l i , 5 , e l i , 6 Φ ( { β x , β y , β z } , l )
 7:
   S r i , 7 [ l ] e l i , 7 Φ ( { γ } , l )
 8:
   end for
 9:
end for
10:
/* Correlation */
11:
for κ = 1 t o t m a x do
12:
    e κ 1 , e κ 2 , e κ 3 Φ ( { α x } , κ ) , Φ ( { α y } , κ ) , Φ ( { α z } , κ )
13:
    e κ 4 , e κ 5 , e κ 6 Φ ( { β x } , κ ) , Φ ( { β y } , κ ) , Φ ( { β z } , κ )
14:
    e κ 7 Φ ( { γ } , κ ) ;
15:
    [ A L a b e l , e k A L a b e l , q ] = E v e n t L a b e l ( e , S r [ l ] , q = [ 1 : 6 ] , κ , A , k ); q: for activities
16:
   if ( A L a b e l = = e a t i n g ) then
17:
   [ F L a b e l , e k F L a b e l , q ] = E v e n t L a b e l ( e , S r [ l ] , q = [ 7 ] , κ , E , k ); q: for foods
18:
   end if
19:
end for
20:
Function   E v e n t L a b e l ( e , S r [ l ] , q , κ , λ , E I )
21:
for  λ = 1 t o λ n ( λ n =all classes) do
22:
      r κ = C o r r ( e κ q , S r λ , q [ l ] ) r θ λ e κ q λ V λ ++; q ; l
23:
   if   ( V λ 3 ) then
24:
  return [ λ , e E I λ , q ] e k λ , q e κ λ , q e κ q λ ; ( E I : E v e n t I n d e x )
25:
   end if
26:
end for
27:
EndFunction
We annotated the experimental data event-wise because we were trying to solve the concept of interleaved or complex patterns. An activity or a food eating pattern can be simple or complex. A simple pattern consists of a repetitive behavior for a long period of time, whereas a complex pattern is defined as a unique behavior that is distinct from its succeeding and preceding patterns. It is possible in real-life settings that the participants running initially start walking for a while, and then start running again. Walking is sandwiched between running activity. A simple, fixed sliding window can easily represent a simple pattern [26,27,28] but fails to identify a complex or interleaved pattern. Thus, ESS approach performs equally well for simple patterns and complex patterns of the activities and the food categories.
We combined the annotated events in the form of segments. We set the length of the segment to dynamic as the activities performed by the individuals occur with different durations. Each segment consists of a minimum of three events and a maximum five events. We chose the dynamic length of the segments in order to represent short and long patterns equally. At the end of an activity, ESS has arranged all e k i , q s of the input data into dynamic segments ( S j i s) with varying lengths of 3–5 e k i , q s, where each e k i , q has the same activity label. Finally, all the S j i s are organized into observational data O ψ as given by Equations (6a) and (6b). We solved two challenges of signal segmentation using ESS which could not be overcome using contemporary static signal segmentation approaches [26,27,28]. First, ESS assisted in automatic labeling of all the e u s and avoided the trivial approach of manual labeling. Second, it helped in grouping the patterns of the signals with different complexities. Since a complex pattern occurs for a short span of time, it is impractical to use a fixed length window and a long segment. To extract the complex pattern, dynamic S j i is chosen with a variable length of 3–5 e k i , q s. This dynamic value of varying length is chosen after exploring the segment length in the range of 1 to 10.

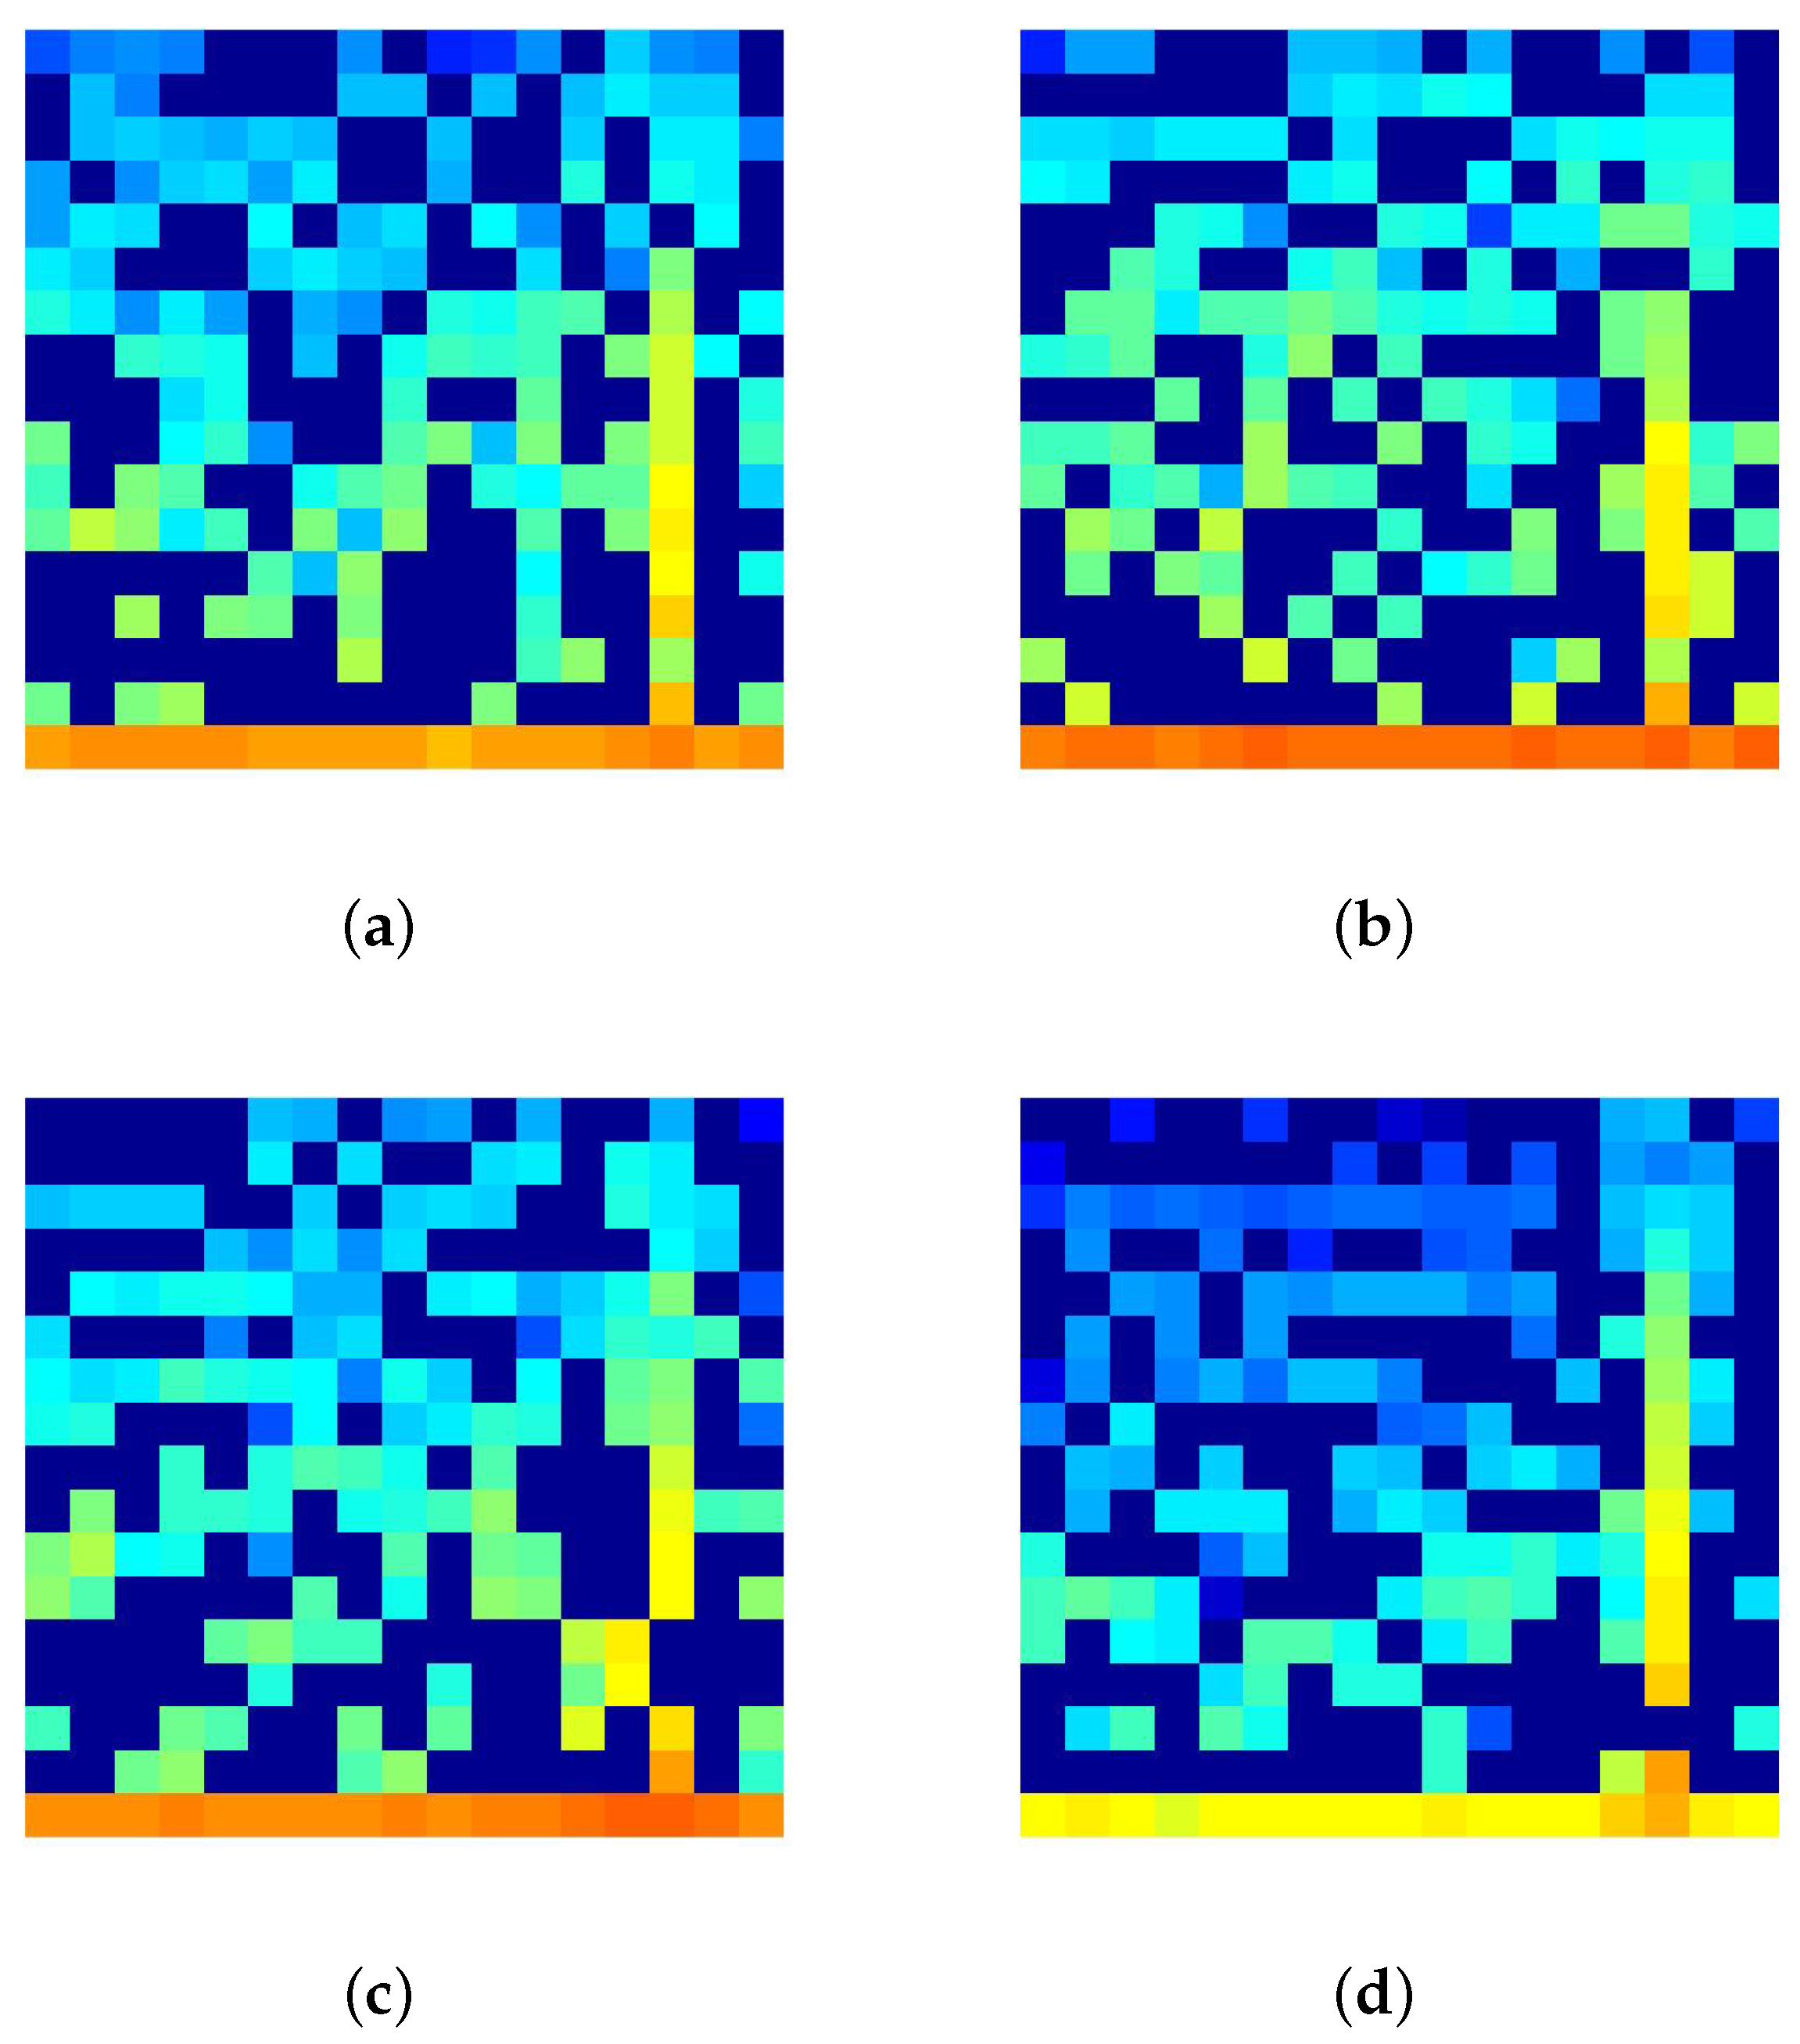
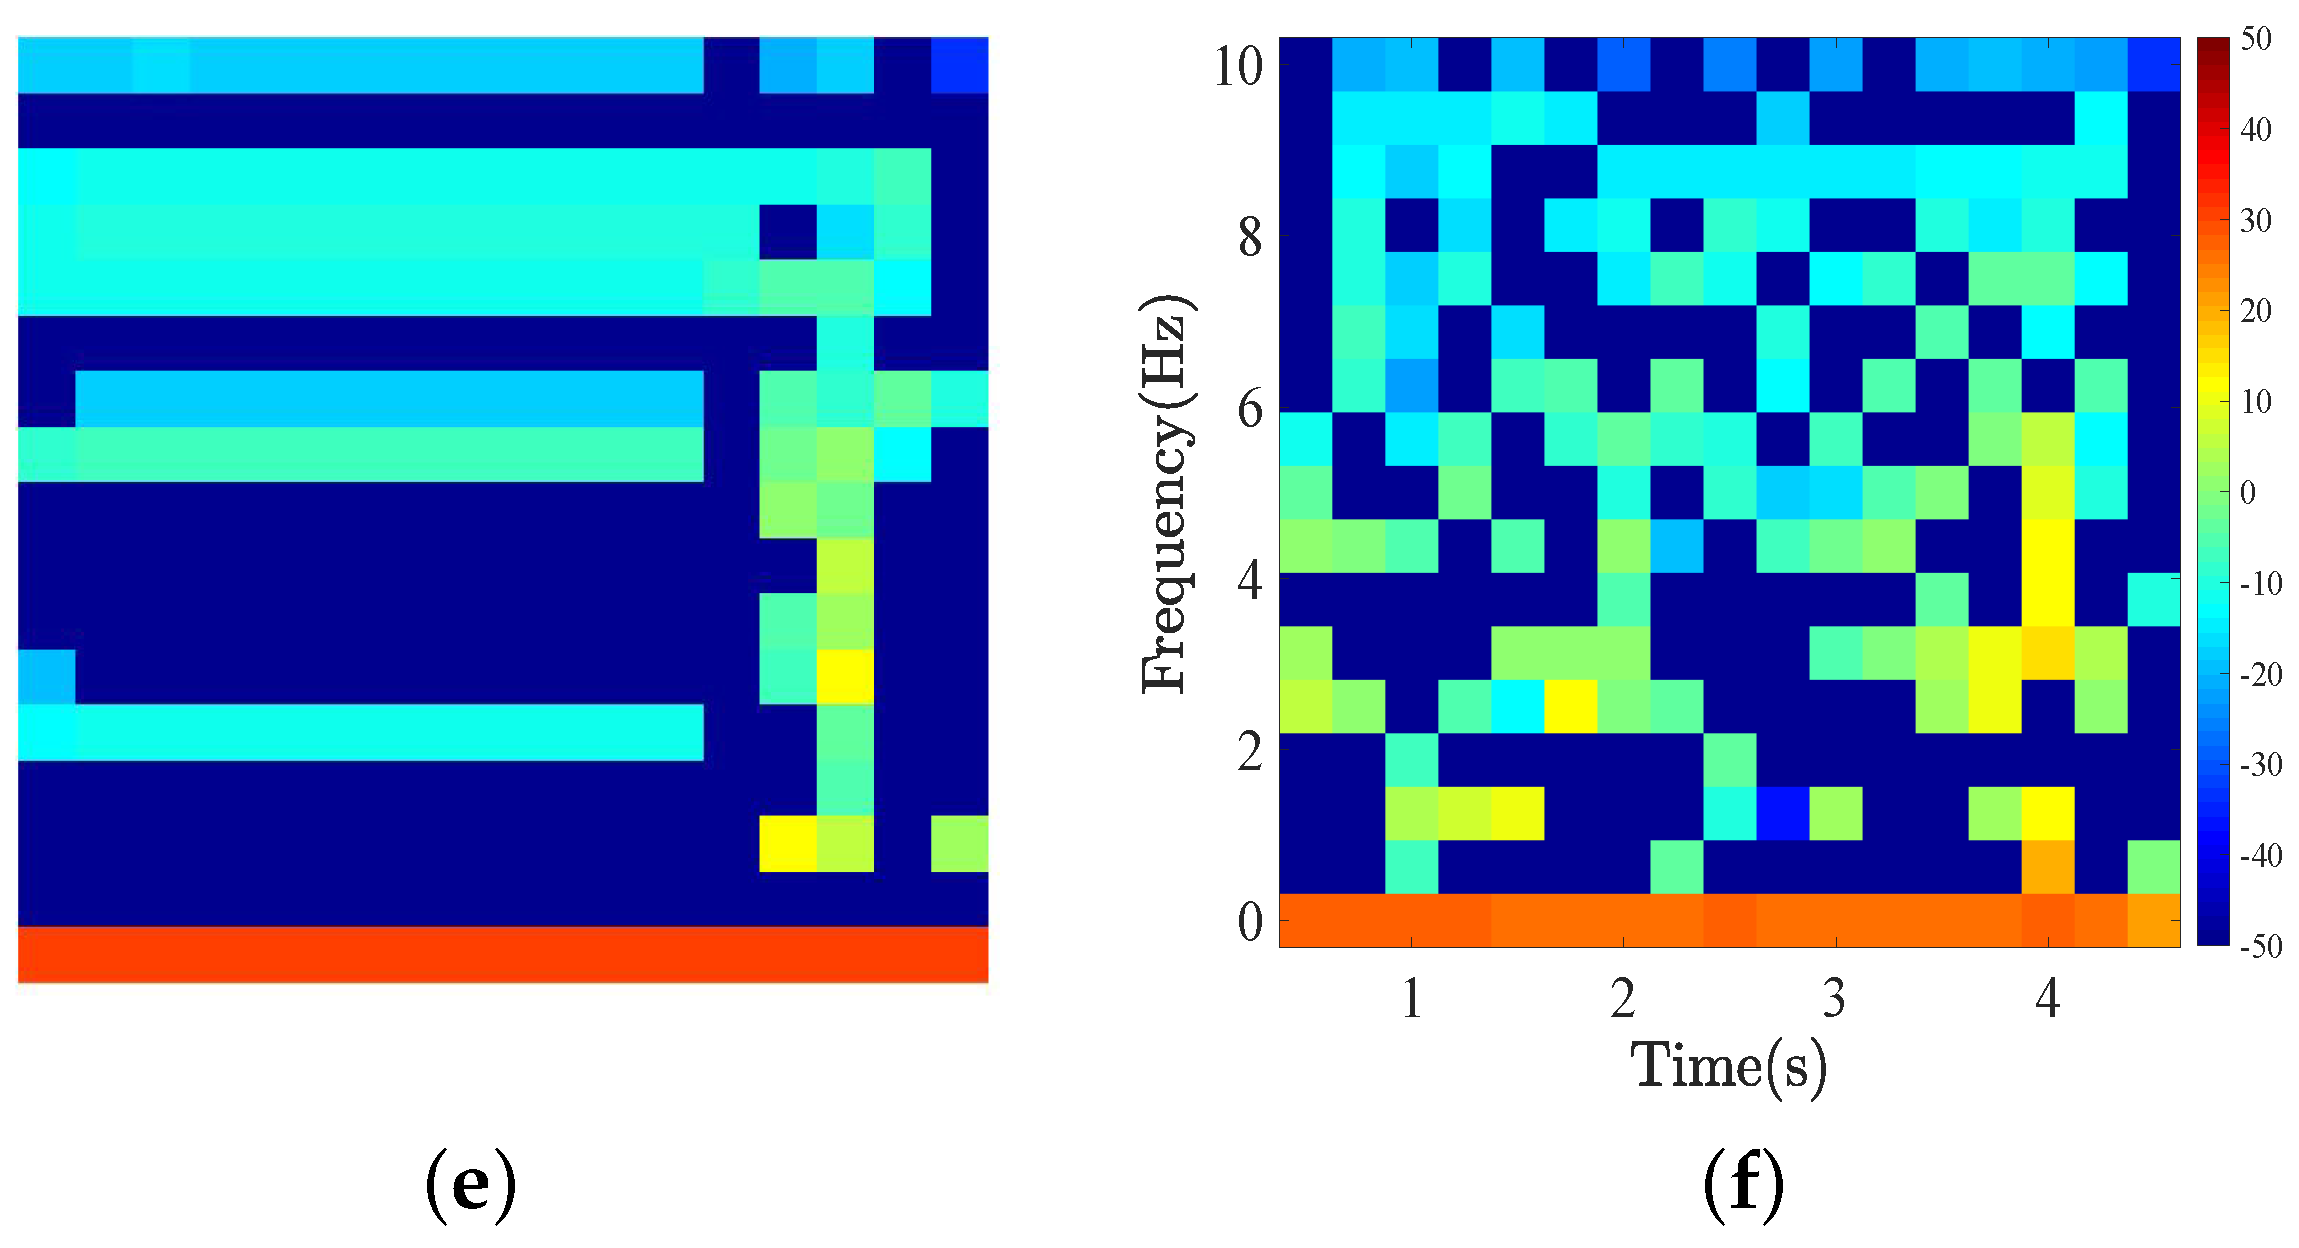
4. Features and Classification

In this section, we explain the procedure of feature extraction and select most discriminant features to train the activity recognition model. Moreover, we discuss the computation of spectrogram-generated images for the segments of food types, which are then used for training the food recognition model.

4.1. Features Extraction and Selection

The distinct patterns were generated by the sensors of the smartwatch according to the activity performed by the individuals (see Figure 2a–f). It can be seen that the patterns of most of the activities are unique. For example, running has a higher acceleration and velocity magnitude than other activities in all of the axes. On the contrary, stationary activities such as laying, sitting, and standing have smaller acceleration and velocity magnitudes. The motion sensors generate higher amplitude signals for dynamic (walking/running) activities versus static (standing/sitting) activities. Different amplitudes of generated signals form distinct patterns for dynamic and static activities, as illustrated in Figure 2. Statistical features extracted from the distinct patterns are fed into the classifier to associate the patterns to a particular activity class. Since features play the main role in the recognition of activities, they need to characterize the patterns effectively without carrying redundant information. The amplitude-based features are extracted from each segment of O A data for training the activity model. Those features are the arithmetic mean, standard deviation, inter-quartile range, kurtosis, geometric mean, median, maximum, range, skewness, the energy of a signal, waveform length, entropy, RMS, and ratio of RMS to maximum. Forward features selection (FFS) or filter method is applied to the computed features to reduce redundancy and to avoid overfitting [28]. The Top 8 features selected using FFS are fed into a quadratic SVM to develop the activity recognition model.
Different food categories require different force amount to break the food during ingestion because each food type has different levels of hardness, tackiness, and crunchiness. Therefore, the piezoelectric sensor embedded in the necklace generates distinct patterns of signals for each food category. Actually, the neck moves differently while ingestion (i.e., chewing and swallowing) of each food type. The piezoelectric sensor translates different movements of the neck skin by generating unique signal patterns because the neck skin for different food types applies a different amount of force over the necklace. We computed the spectrogram using the squared magnitude of the short-time Fourier transform ( S T F T ) for each segment (i.e., S j i ) of O E data using Equation (7).
S T F T { s f [ n ] } ( m , ω ) = S f ( m , ω ) = n = s f [ n ] ω [ n m ] e j ω n
where s f denotes the segment of O E in Equation (7). We convert the spectrogram generated for each segment into RGB-images (see Figure 4). The necklace sensor generates a high amplitude varying signal at the occurrence of eating activity and remains silent during other activities (See Figure 2g).

4.2. Activity and Food Classification

The activity recognition model was trained and evaluated using a 10-fold cross-validation technique with leave-one-subject-out. We employed a supervised machine learning algorithm of quadratic SVM to recognize the physical activities based on body acceleration ( α ) and angular velocity ( β ). This technique of the training of allowed every subject to be used once in the model validation and the final result is the average of the 10 validation results. The Top 8 features with the most discriminatory information about the patterns of the activities were fed into the classifier to determine the class of each segment of O A data. As discussed in the next section, quadratic SVM achieved a high recognition score the over eight physical activities.
For food recognition model, we exploited transfer learning of a pre-trained deep learning model of AlexNet [49] to recognize food categories from the spectrogram generated images (See Figure 5). We trained Alexnet and then evaluated it using 10-fold cross-validation with leave-one-subject-out technique. The deep learning-based method extracted features automatically from the spectrogram generated images of the necklace signal. The extracted features represent the ingestion patterns of food categories efficiently because Alexnet extracted them at different resolutions of the image. Thus, spectrogram-generated images of all the food categories were classified with high accuracy using Alexnet (See Figure 6b).

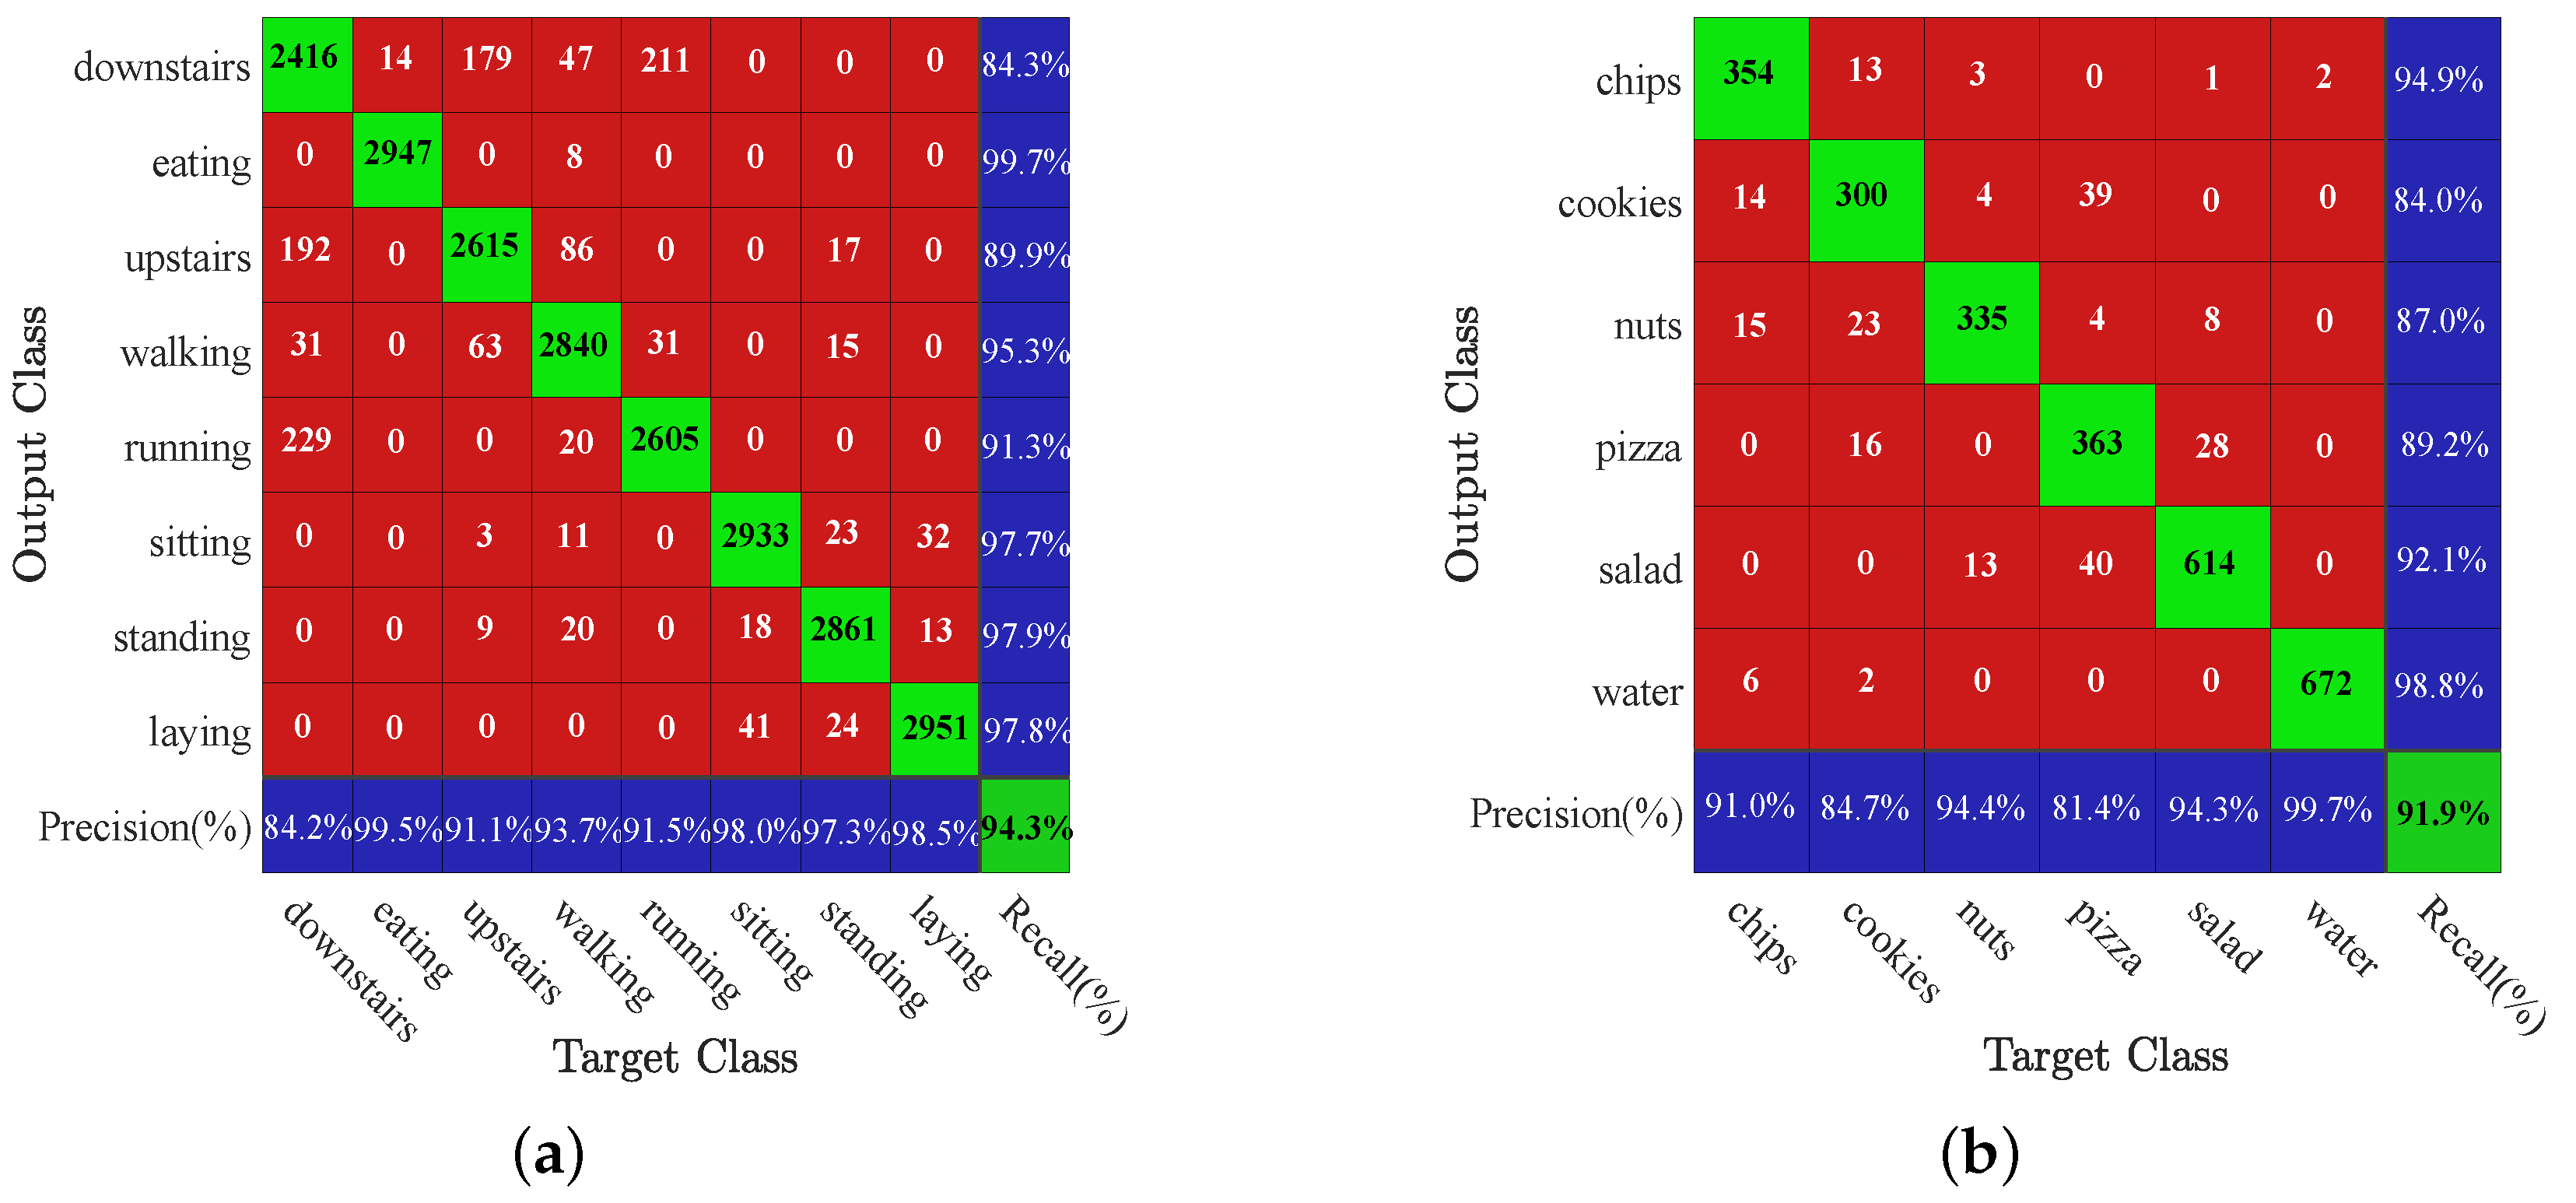
5. Results and Discussion

Figure 6 shows the recognition performance of our proposed system using SVM and CNN. It is observed is Figure 6a that eating is recognized with higher accuracy than other activities because of forearm movement while eating causes the sensors to generate a distinct pattern (see Figure 6a). Downstairs attained the lowest accuracy and most of its segments are incorrectly classified as the physical movement involved for running and going downstairs is related to some extent. For example, the gravitational force accelerates the movement of subjects by applying a force downward when they perform a downstairs activity. The walking speed is increased when the subjects go downstairs owing to the natural phenomenon of gravity. Therefore, there is a possibility that the participants while performing a downstairs activity prefer natural movement (i.e., increased speed) rather than applying anti-force to cancel the effect of force pulling downward. For food classes, Alexnet recognized water with the highest accuracy and cookie with the lowest accuracy (see Figure 6b). Being a liquid, ingestion pattern of water is quite different from other food classes, whereas cookie might have exhibited a pattern resembling those of other classes.
Our food recognition model based on Alexnet performs better than prior state-of-the-art studies [26,27,28] because our study has extracted efficient features automatically from the spectrogram generated images. The extracted features carry discriminant information for food categories. Therefore, our food recognition model has achieved high accuracy of 91.9%. Prior studies [26,27,28] employed fixed static signal segmentation approaches which may fail for signal patterns with varying complexities. On the contrary, we employed a segment of dynamic length r to effectively represent the activities with different complexities. Our study based on SVM and Alexnet has recognized the activities and food categories with high accuracy of 94.3% and 91.9%, respectively. Moreover, we annotated the experimental data automatically and avoided manual labeling, which is labor-intensive and prone to human error. The proposed activity and food recognition system outperforms all previous state-of-the-art activity or food recognition systems detailed in Table 1.
We analyzed the usability test of the necklace by conducting the survey based on the user experience. The survey we conducted considered our designed necklace in terms of size, comfortability, and usage in real-life settings. Most participants in our experiments are comfortable with the stretchable necklace-type sensor. The worn sensorized necklace does not cause any discomfort or pain. The presented motion sensors of the smartwatch are easier to wear than wearing multiple sensors on different body parts [11,12,13,14]. Nowadays, the smartwatch is commonly available and equipped with motion sensors. The design of smartwatch makes it ideal for monitoring the activities of the individuals. It is a very simple intuition that people feel more comfortable wearing a smartwatch than wearing any medical device. Moreover, a smartwatch is the preferred choice of the subjects in real-life settings. The proposed physical activities recognition system based on the sensors of a smartwatch is better than previous studies based on video sensing [19,20,21] because our study does not require special spaces equipped with cameras. Henceforth, our proposed system does not restrict the natural movement of the subjects. Additionally, the performance of the proposed system for activity recognition does not degrade due to lighting conditions.

6. Conclusions and Future Work

We propose a novel wearable system for recognition of activity and food classes using the motion sensors of a smartwatch and a piezoelectric embedded in a necklace. This work exploited amplitude-based features and spectrogram-generated images to develop activity and food recognition models. Our proposed system recognized eight different activities and six classes of food with an accuracy of 94.3% and 91.9% using SVM and CNN, respectively.
The number of subjects, the variety of food classes, and the activities chosen for this work is limited. We will extend the number of subjects, food classes, and activities in future work. In the future study, we also aim to include other physiological parameters such as sleep duration, stress, etc., which have a relationship with obesity.

Author Contributions

Conceptualization, G.H. and M.L.M.; methodology, G.H. and M.S.J.; software, G.H.; validation, G.H., K.J., and M.L.M.; formal analysis, G.H.; investigation, M.K.M.; resources, K.J.; data curation, G.H.; writing—original draft preparation, G.H.; writing—review and editing, M.L.M. and M.K.M.; and visualization, K.J. and M.S.J.

Funding

This research received no external funding.

Conflicts of Interest

The authors declare no conflict of interest.

References

  1. U.S. Department of Health and Human Services; U.S. Department of Agriculture. 2015–2020 Dietary Guidelines for Americans, 8th ed.; December 2015. Available online: https://health.gov/dietaryguidelines/2015/guidelines/ (accessed on 28 August 2019).
  2. Sazonov, E.S.; Schuckers, S.A.C.; Lopez-Meyer, P.; Makeyev, O.; Melanson, E.L.; Neuman, M.R.; Hill, J.O. Toward Objective Monitoring of Ingestive Behavior in Free-living Population. Obesity 2009, 17, 1971–1975. [Google Scholar] [CrossRef] [PubMed]
  3. Xu, K.; Lu, Y.; Takei, K. Multifunctional Skin-Inspired Flexible Sensor Systems for Wearable Electronics. Adv. Mater. Technol. 2019, 4, 1800628–1800652. [Google Scholar] [CrossRef]
  4. Xu, K.; Lu, Y.; Honda, S.; Arie, T.; Akitaa, S.; Takei, K. Highly Stable Kirigami-Structured Stretchable Strain Sensors for Perdurable Wearable Electronics. J. Mater. Chem. C 2019, 7, 9609–9617. [Google Scholar] [CrossRef]
  5. Sazonov, E.S.; Fontana, J.M. A sensor system for automatic detection of food intake through non-invasive monitoring of chewing. IEEE Sens. J. 2012, 12, 1340–1348. [Google Scholar] [CrossRef] [PubMed]
  6. Farooq, M.; Fontana, J.M.; Sazonov, E. A novel approach for food intake detection using electroglottography. Physiol. Meas. 2014, 35, 739. [Google Scholar] [CrossRef] [PubMed]
  7. Centers for Disease Control and Prevention. Adult Obesity Facts. 2014. Available online: http://www.cdc.gov/obesity/data/adult.html (accessed on 15 September 2019).
  8. World Health Organization. Obesity and Overweight. 2012. Available online: http://www.who.int/mediacentre/factsheets/fs311/en (accessed on 20 October 2019).
  9. Fontana, J.M.; Higgins, J.A.; Schuckers, S.C.; Bellisle, F.; Pan, Z.; Melanson, E.L.; Neuman, M.R.; Sazonov, E. Energy intake estimation from counts of chews and swallows. Appetite 2015, 85, 14–21. [Google Scholar] [CrossRef] [PubMed]
  10. Bray, G.A. How Do We Get Fat? An Epidemiological and Metabolic Approach. In The Metabolic Syndrome and Obesity; Humana Press: Totowa, NJ, USA, 2007; pp. 31–66. [Google Scholar]
  11. Lee, S.M.; Yoon, S.M.; Cho, H. Human activity recognition from accelerometer data using Convolutional Neural Network. In Proceedings of the IEEE Big Data and Smart Computing (BigComp), Jeju, Korea, 13–16 February 2017; pp. 131–134. [Google Scholar]
  12. Lara, O.D.; Labrador, M.A. A survey on human activity recognition using wearable sensors. IEEE Commun. Surv. Tutor. 2013, 15, 1192–1209. [Google Scholar] [CrossRef]
  13. Yang, A.Y.; Iyengar, S.; Sastry, S.; Bajcsy, R.; Kuryloski, P.; Jafari, R. Distributed segmentation and classification of human actions using a wearable motion sensor network. In Proceedings of the IEEE Computer Society Conference on Computer Vision and Pattern Recognition Workshops, Anchorage, AK, USA, 23–28 June 2008; pp. 1–8. [Google Scholar]
  14. Ward, J.A.; Lukowicz, P.; Troster, G.; Starner, T.E. Activity recognition of assembly tasks using body-worn microphones and accelerometers. IEEE Trans. Pattern Anal. Mach. Intell. 2006, 28, 1553–1567. [Google Scholar] [CrossRef]
  15. Veltink, P.H.; Bussmann, H.B.J.; Vries, W.D.; Martens, W.L.J.; Lummel, R.C.V. Detection of Static and Dynamic Activities Using Uniaxial Accelerometers. IEEE Trans. Rehabil. Eng. 1996, 4, 375–386. [Google Scholar] [CrossRef]
  16. Google APIs for Android: ActivityRecognitionAPI. Available online: https://developers.google.com/android/reference/com/google/android/gms/location/ActivityRecognitionApi (accessed on 11 October 2019).
  17. Rodriguez, C.; Castro, D.M.; Coral, W.; Cabra, J.L.; Velasquez, N.; Colorado, J.; Mendez, D.; Trujillo, L.C. IoT system for human activity recognition using BioHarness 3 and smartphone. In Proceedings of the International Conference on Future Networks and Distributed Systems, Cambridge, UK, 19–20 July 2017. [Google Scholar]
  18. Rueda, F.M.; Gernot, A.F. Learning Attribute Representation for Human Activity Recognition. In Proceedings of the 24th International Conference on Pattern Recognition (ICPR), Beijing, China, 20–24 August 2018. [Google Scholar]
  19. Jalal, A.; Kim, Y.H.; Kim, Y.J.; Kamal, S.; Kim, D. Robust human activity recognition from depth video using spatiotemporal multi-fused features. Pattern Recognit. 2017, 61, 295–308. [Google Scholar] [CrossRef]
  20. Chang, J.Y.; Shyu, J.J.; Cho, C.W. Fuzzy rule inference based human activity recognition. In Proceedings of the IEEE Control Applications, (CCA) & Intelligent Control, (ISIC), St. Petersburg, Russia, 8–10 July 2009; pp. 211–215. [Google Scholar]
  21. Farhadi, A.; Tabrizi, M.K. Learning to recognize activities from the wrong view point. In Proceedings of the European Conference on Computer Vision; Springer: Berlin, Germany, 2008; pp. 154–166. [Google Scholar]
  22. Amft, O.; Kusserow, M.; Troster, G. Bite weight prediction from acoustic recognition of chewing. IEEE Trans. Biomed. Eng. 2009, 56, 1663–1672. [Google Scholar] [CrossRef] [PubMed]
  23. Bi, Y.; Lv, M.; Song, C.; Xu, W.; Guan, N.; Yi, W. Autodietary: A wearable acoustic sensor system for food intake recognition in daily life. IEEE Sens. J. 2016, 16, 806–816. [Google Scholar] [CrossRef]
  24. Kalantarian, H.; Mortazavi, B.; Alshurafa, N.; Sideris, C.; Le, T.; Sarrafzadeh, M. A comparison of piezoelectric-based inertial sensing and audio-based detection of swallows. Obes. Med. 2016, 1, 6–14. [Google Scholar] [CrossRef]
  25. Kalantarian, H.; Sarrafzadeh, M. Audio-based detection and evaluation of eating behavior using the smartwatch platform. Comput. Biol. 2015, 65, 1–9. [Google Scholar] [CrossRef]
  26. Hussain, G.; Javed, K.; Cho, J.; Yi, J. Food intake detection and classification using a necklace-type piezoelectric wearable sensor system. IEICE Trans. Inf. Syst. 2018, 101, 2795–2807. [Google Scholar] [CrossRef]
  27. Kalantarian, H.; Alshurafa, N.; Le, T.; Sarrafzadeh, M. Monitoring eating habits using a piezoelectric sensor-based necklace. Comput. Biol. Med. 2015, 58, 46–55. [Google Scholar] [CrossRef]
  28. Alshurafa, N.; Kalantarian, H.; Pourhomayoun, M.; Liu, J.J.; Sarin, S.; Shahbazi, B.; Sarrafzadeh, M. Recognition of nutrition intake using time-frequency decomposition in a wearable necklace using a piezoelectric sensor. IEEE Sens. J. 2015, 15, 3909–3916. [Google Scholar] [CrossRef]
  29. Tamura, T.; Kimura, Y. Review of monitoring devices for food intake. CICSJ Bull. 2016, 34, 73–79. [Google Scholar]
  30. Starner, T.; Schiele, B.; Pentland, A. Visual Contextual Awareness in Wearable Computing. In Proceedings of the IEEE International Symposium on Wearable Computers, Pittsburgh, PA, USA, 19–20 October 1998; pp. 50–57. [Google Scholar]
  31. Khan, A.M.; Lee, Y.K.; Lee, S.Y.; Kim, T.-S. A triaxial accelerometer-based physical-activity recognition via augmented-signal reatures and a hierarchical recognizer. IEEE Trans. Inf. Technol. Biomed. 2010, 14, 1166–1172. [Google Scholar] [CrossRef]
  32. Day, N.; McKeown, N.; Wong, M.; Welch, A.; Bingham, S. Epidemiological assessment of diet: A comparison of a 7-day diary with a food frequency questionnaire using urinary markers of nitrogen, potassium and sodium. Int. J. Epidemiol. Oxf. 2001, 30, 309–317. [Google Scholar] [CrossRef]
  33. Coulston, A.; Boushey, C. Nutrition in the Prevention and Treatment of Disease, 2nd ed.; Academic Press, Elsevier: Cambridge, MA, USA, 2008. [Google Scholar]
  34. Horst, C.H.; Boer, G.L.O.D.; Kromhout, D. Validity of the 24-Hour Recall Method in Infancy: The Leiden Pre-School Children Study. Int. J. Epidemiol. 1988, 17, 217–221. [Google Scholar] [CrossRef] [PubMed]
  35. Amft, O.; Troster, G. Methods for Detection and Classification of Normal Swallowing from Muscle Activation and Sound. In Proceedings of the Pervasive Health Conference and Workshops, IEEE, Innsbruck, Austria, 29 November–1 December 2006; pp. 1–10. [Google Scholar]
  36. Dong, Y.; Scisco, J.; Wilson, M.; Muth, E.; Hoover, A. Detecting Periods of Eating during Free-Living by Tracking Wrist Motion. IEEE J. Biomed. Health Inform. 2014, 18, 1253–1260. [Google Scholar] [CrossRef] [PubMed]
  37. Amft, O.; Tröster, G. Recognition of dietary activity events using on-body sensors. Artif. Intell. Med. 2008, 42, 121–136. [Google Scholar] [CrossRef] [PubMed]
  38. Salley, J.; Hoover, A.; Wilson, M.; Muth, E.R. Comparison between Human and Bite-Based Methods of Estimating Caloric Intake. J. Acad. Nutr. Diet. 2016, 116, 1568–1577. [Google Scholar] [CrossRef] [PubMed]
  39. Mattfeld, R.; Muth, E.; Hoover, A. Measuring the consumption of individual solid and liquid bites using a table embedded scale during unrestricted eating. IEEE J. Biomed. Health Inform. 2016, 21, 1711–1718. [Google Scholar] [CrossRef] [PubMed]
  40. Zhou, B.; Cheng, J.; Sundholm, M.; Reiss, A.; Huang, W.; Amft, O.; Lukowicz, P. Smart Table Surface: A Novel Approach to Pervasive Dining Monitoring. In Proceedings of the IEEE International Conference on Pervasive Computing and Communications, St. Louis, MO, USA, 23–27 March 2015. [Google Scholar]
  41. Yao, N.; Sclabassi, R.J.; Liu, Q.; Sun, M. A video-based algorithm for food intake estimation in the study of obesity. In Proceedings of the IEEE Bioengineering Conference, Long Island, NY, USA, 10–11 March 2007. [Google Scholar]
  42. LeCun, Y.; Bottou, L.; Bengio, Y.; Haffner, P. Gradient-based learning applied to document recognition. Proc. IEEE 1998, 86, 2278–2324. [Google Scholar] [CrossRef]
  43. Cao, W.; Wang, X.; Ming, Z.; Gao, J. A review on neural networks with random weights. Neurocomputing 2018, 275, 278–287. [Google Scholar] [CrossRef]
  44. Niu, J.; Liu, Y.; Guizani, M.; Ouyang, Z. Deep CNN-based Real-time Traffic Light Detector for Self-driving Vehicles. IEEE Trans. Mob. Comput. 2019. [Google Scholar] [CrossRef]
  45. He, R.; Wu, X.; Sun, Z.; Tan, T. Wasserstein cnn: Learning invariant features for nir-vis face recognition. IEEE Trans. Pattern Anal. Mach. Intell. 2018, 41, 1761–1773. [Google Scholar] [CrossRef] [Green Version]
  46. Sun, Y.; Wang, B.; Jin, J.; Wang, X. Deep Convolutional Network Method for Automatic Sleep Stage Classification Based on Neurophysiological Signals. In Proceedings of the 11th International Congress on Image and Signal Processing, BioMedical Engineering and Informatics (CISP-BMEI), Beijing, China, 13–15 October 2018. [Google Scholar]
  47. Caterini, A.L.; Chang, D.E. Deep Neural Networks in a Mathematical Framework; Springer: Cham, Switzerland, 2018. [Google Scholar]
  48. Hussain, M.; Bird, J.J.; Faria, D.R. A Study on CNN Transfer Learning for Image Classification. In Proceedings of the UK Workshop on Computational Intelligence, Nottingham, UK, 5–7 September 2018; Springer: Cham, Switzerland, 2018. [Google Scholar]
  49. Krizhevsky, A.; Sutskever, I.; Hinton, G.E. Imagenet classification with deep convolutional neural networks. In Proceedings of the Advances in Neural Information Processing Systems (NIPS), Lake Tahoe, NV, USA, 3–6 December 2012; pp. 1097–1105. [Google Scholar]
  50. LDT with Crimps Vibration Sensor/Switch. Available online: https://cdn.sparkfun.com/datasheets/Sensors/ForceFlex/LDT_Series.pdf (accessed on 12 November 2019).
  51. Samsung Gear Fit 2 Pro Fitness Band Teardown. Available online: https://www.techinsights.com/blog/samsung-gear-fit-2-pro-fitness-band-teardown (accessed on 10 Novemebr 2019).
Figure 1. Architecture of the activity and food recognition system.
Electronics 08 01425 g001
Figure 2. The signals of accelerometers, gyroscope, and piezoelectric sensor: (ac) acceleration in (xyz) axes; (df) angular velocity in (xyz) axes; and (g) the piezoelectric sensor signal.
Electronics 08 01425 g002aElectronics 08 01425 g002b
Figure 3. Event similarity search algorithm.
Electronics 08 01425 g003
Figure 4. Spectrogram generated images of different food categories: (a) chips; (b) cookies; (c) nuts; (d) salad; (e) water; and (f) pizza.
Electronics 08 01425 g004aElectronics 08 01425 g004b
Figure 5. Pre-trained convolutional neural nNetwork for food recognition.
Electronics 08 01425 g005
Figure 6. Recognition performance of proposed system (a) activity recognition using SVM; and (b) food recognition using CNN.
Electronics 08 01425 g006
Table 1. The comparison of the previous related studies and the proposed study in terms of the recognition performance.
Proposed AlgorithmSensor(s) & (Classes)Accuracy (%)
In [11], the data for human activity collected using the triaxial accelerometer were employed to train one-dimensional CNN. The performance of the designed approach degraded due to the small sampling frequency and a small number of activities.Triaxial accelerometer (3)92.1%
An assembly-related activity was recognized using LDA and HMM based on accelerometer and microphone as signal sources [14]. The model has a generalization problem.Accelerometer and Microphone (9)75.9%
Recently, Google developed an API to recognize four physical activities, such as running, riding a bicycle, walking and stationary [16]. Smartphone sensors were used to gather the data. The developed API encountered the recognition error owing to poor signal segmentation technique.The motion sensors of smartphone (6)89%
A deep learning architecture-based activity recognition system was designed to predict attributes that could represent signal segments relating to physical activities. The model has limitations, such as computational complexity and error-prone attributes [18].Seven inertial measurement units (5)90.8%
The authors designed an embedded hardware system to monitor food intake [23]. The system mainly consists of a throat microphone, which is worn around the neck of participants to collect food-related acoustic signals. The performance of the system drastically decreased as the surrounding noise interferes with the food-related acoustic signals.Throat microphone (7)84.9%
In previous study [24], the performance of two different signal sources (piezoelectric and microphone) was compared for food dietary intake. The maximum accuracy for the microphone and the piezoelectric is 91.3% and 79.4%, respectively. The microphone despite being affected by surrounding noise performs better than the piezoelectric because the signal of the piezoelectric sensor is poorly processed.Microphone and Piezoelectric (3)91.3% and 79.4%
A low-cost necklace embedded with the piezoelectric sensor was developed to monitor food-ingestion of the subjects [27]. The wearable system recognized chips, water, and sandwich with an accuracy of 85.3%, 81.4%, and 84.5%, respectively.Piezoelectric(3)83.7%
A new method using a watch-like configuration of the sensors was presented to detect the periods of eating. The method manually segmented the data and classified eating and non-eating episodes [36].Accelerometer and gyroscope (2)81%
We proposed an activity and food recognition system that consists of the motion sensors in a smartwatch and a piezoelectric sensor. The system employed an event similarity search algorithm, a new technique for dynamic segmentation, to effectively segment the signals of the sensors and automatically annotate the segments. Our proposed system employed SVM and CNN models to accurately recognize the eight activities and six food classes (Proposed System).Accelerometer, gyroscope, and Piezoelectric (8 and 6)94.3% and 91.9%

