1. Introduction
Smartphones and tablets have become very convenient end user devices that can replace several other devices, providing a multitude of multimedia functionalities that are no longer limited to specific people, occupations, or social status. On the other hand, the pervasiveness of smartphones and tablets have transformed them almost into children’s toys, with small children using them mainly to watch videos. The unprecedented availability of new services, new data rates, and applications, with the introduction of 5G, implies that network operators must be prepared and plan their networks according to expected capacity demand. Nevertheless, mobile network operators (MNOs) might not have the chance to exhaustively test the introduction of new services and applications along with any eventual capacity exhaustion that might happen. Therefore, especially considering densities that are expected both on network and subscriber planes, it is complex to analyze both planes’ behavior against the capacity that needs to be guaranteed. 5G’s most prevalent “use-cases” are enhanced mobile broadband (eMBB), ultrareliable and low-latency communications (URLLC), and massive machine type communications (mMTC); this work focuses on eMBB.
Thus, it is of utmost importance that 5G network planning processes start using advanced analytics and focus on subscriber’s behavior towards traffic generation. However, 5G ultra dense networks have other challenges such as low latency requirements, meaning that not only subscribers’ behavior must be considered but also non-human devices, such as the Internet of things (IoT) [
1]. This is where advanced subscriber clustering comes in, which is the basis for defining the research problem in this work—how can capacity planning and even network planning be supported by using knowledge about subscribers? Also, will such knowledge be an enabler in better helping the planning and resource management processes in 5G, as well as in providing deeper insights into subscribers’ traffic consumption habits, resulting in overall service improvement and better radio resource management? This work focuses on human behavior analytics and its impact on mobile network capacity.
Nowadays, advanced data science techniques are becoming mainstream and data analytics has never before been such a focus. Therefore, new data is being generated every day, and mobile networks are not an exception. With 5G and beyond, data from subscribers that characterizes them will increase as never before. Thus, there is a clear advantage of using that data and applying it to develop subscriber-centric clustering on the basis of behavior that will impact very positively on both capacity network planning process and resource management.
Furthermore, from another perspective, it will be shown that there are new types of subscribers using mobile networks, and that potential new clusters can appear when previously not expected. As an example, in this work, we show that in comparison with [
2], simply by having additional data that was not available at the time, changes must be made to the clustering set that characterizes subscribers. Today, subscribers aged from 0 to 12 years old are increasingly using tablets and smartphones to access high capacity demanding services such as video streaming and online cooperative gaming [
3,
4]. Additionally, up until recently, the majority of data on subscribers’ behavior mainly focused on ages starting at 18 years, as this is considered the legal age to respond to surveys, which are the typical instruments used to measure adherence to cellular services [
5,
6,
7,
8,
9]. We, on the other hand, focus on very young age groups, the same area as sociology and psychology studies are currently focusing upon, looking for behavior and mental disorders due to excessive handheld devices usage. In our case, we look at such data from an MNO perspective.
In this paper, our main contribution is twofold: first, we demonstrate the advantage of considering subscriber-centric clustering based on behavior both in terms of capacity network planning process and resource management. Our second main contribution is the definition and characterization of new subscriber clusters comprising subscribers aged from 0 to 12 years old, whereas the majority of studies mainly focus on ages starting at 18 years old. The objective of the current study, extending from our previous study, is how it can be demonstrated that advanced clustering based on behavior can, in fact, be a very useful tool for MNOs and how also, due to behavioral changes, former approaches need to be re-fit, making this an ongoing process. As a result of our objectives, it is shown that parents that have children and let them use their smart devices represent a pattern change in traffic consumption and, therefore, must be considered for analysis. This represents a new cluster of subscribers, and thus new traffic generation capabilities, and as so allows us to present our approach to quantify the impact of new subscriber cluster on network traffic generation and performance, as well the challenges that this represents for MNOs.
2. Subscriber-Centric Clustering
We start by defining the concept of market, which, in cellular networks, consists of existing and potential buyers/consumers of mobile products and services. It is beyond the scope of this work to focus on products (e.g., type of mobile end user device), as our model intends to focus on behavioral aspects of service adoption and its corresponding impacts over cellular networks and capacity planning. It is also beyond this work to explore the several clustering techniques from data science fields of expertise.
The concept of cellular market is defined as a set of mobile services that subscribers are willing to buy in order to satisfy individual needs. Such action can be satisfied through an exchange relationship with the MNO. Such needs can be different and vary according to demographic and behavioral aspects, thus requiring advanced analysis techniques such as subscriber segmentation in order to group them and best tailor and fit the service offering. In that perspective, we propose that advanced segmentation techniques should be applied to subscribers, not only on a post-factum perspective (sell the best service to the subscribers that most treasure it) but on a pre-factum perspective, which will use such information in order to enable different, more optimized, and intelligent cellular planning approaches based on deep knowledge about the subscribers.
Advanced segmentation techniques will go beyond the usage of simple demographic data—which is currently the class of data that is most used—such as age and income. It can even be applied to service characterization but also extended to a higher abstraction level of non-human devices, as long as its traffic generation pattern is known [
10]. Advanced segmentation systems will allow subscriber-centric clustering and provide at least two main advantages: giving MNOs the ability to enhance the quality of service among subscribers that are much more sensitive to it, and also to increase, for example, the average return per user (ARPU) associated with each of the subscriber clusters.
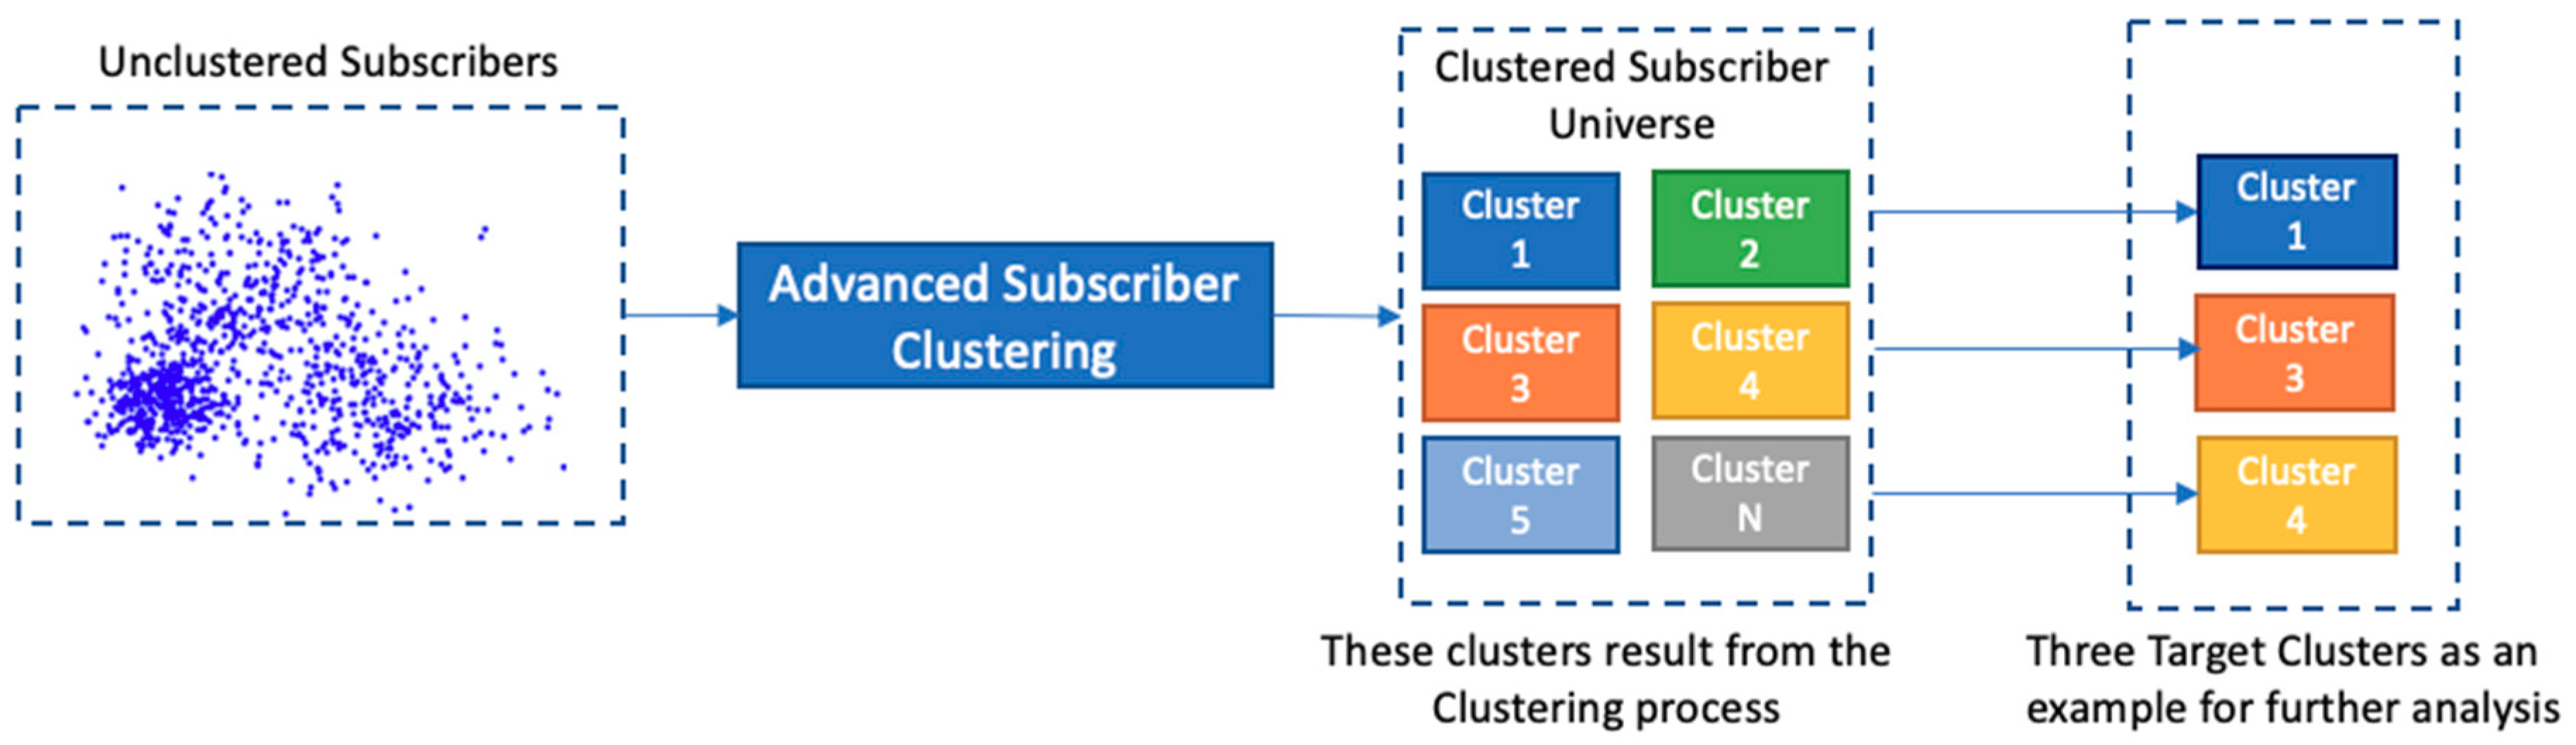
Figure 1 presents the subscriber-centric clustering process proposed in this work, which will be further detailed.
2.1. Subscriber Clustering
Subscriber segmentation or clustering can be referred as the process of splitting the subscriber base, aiming to provide deeper insights into the landscape of the customer market, as seen in
Figure 1. Such a process reveals subscribers’ characteristics that will enable grouping them into clusters that have one or more service or behavior in common. Such processes are known as clustering algorithms. By applying such advanced techniques, the MNO has the ability to proper analyze each group and tailor their planning process or service offering according to the characteristics that mostly define the cluster, as it was performed by [
11] using temporal analysis. The process of advanced clustering is essential and of utmost importance—if clustering is not well performed, the proper definition of a cluster of subscribers is unlikely to be successful, thus misleading the MNO during the analysis and planning processes. This is a process that has not been substantially explored in this area in question, even though there is some previous work [
12,
13] that can be found about techniques to cluster subscribers. As mentioned, the scope of this work is not to propose a novel clustering technique, but to demonstrate how behavioral clustering can be of utmost importance for MNOs, enabling the application of advanced analytics.
2.2. Subscriber Cluster
A subscriber cluster is a subset or a segment that results from the process of subscriber clustering. It is a sub-group or cluster of subscribers that is identified as the result of exercising advanced segmentation techniques and that has similar needs, service, and purchase behavior. In order for an MNO to successfully consider each cluster into its planning process, the cluster needs to have as many characteristics as possible, and, also, from a post-factum perspective, needs to be reachable and accessible as much as possible.
After applying the processes of advanced clustering, each MNO will have a set of clusters that will be fed into the whole network capacity planning process and resource management. In order for the MNO to properly develop its planning process, the clusters need to be characterized as best as possible, especially in terms of size and characteristics, allowing variables such as profitability to become part of the pre-factum process. After having assessed the substantiality and measurability capacities of each cluster, as well as other characteristics that will be further presented on the current work, MNOs will have clusters that are not totally distinguishable, and behavior overlapping is expected to exist with high probability.
All resulting clusters should allow the MNO to distinguish them apart [
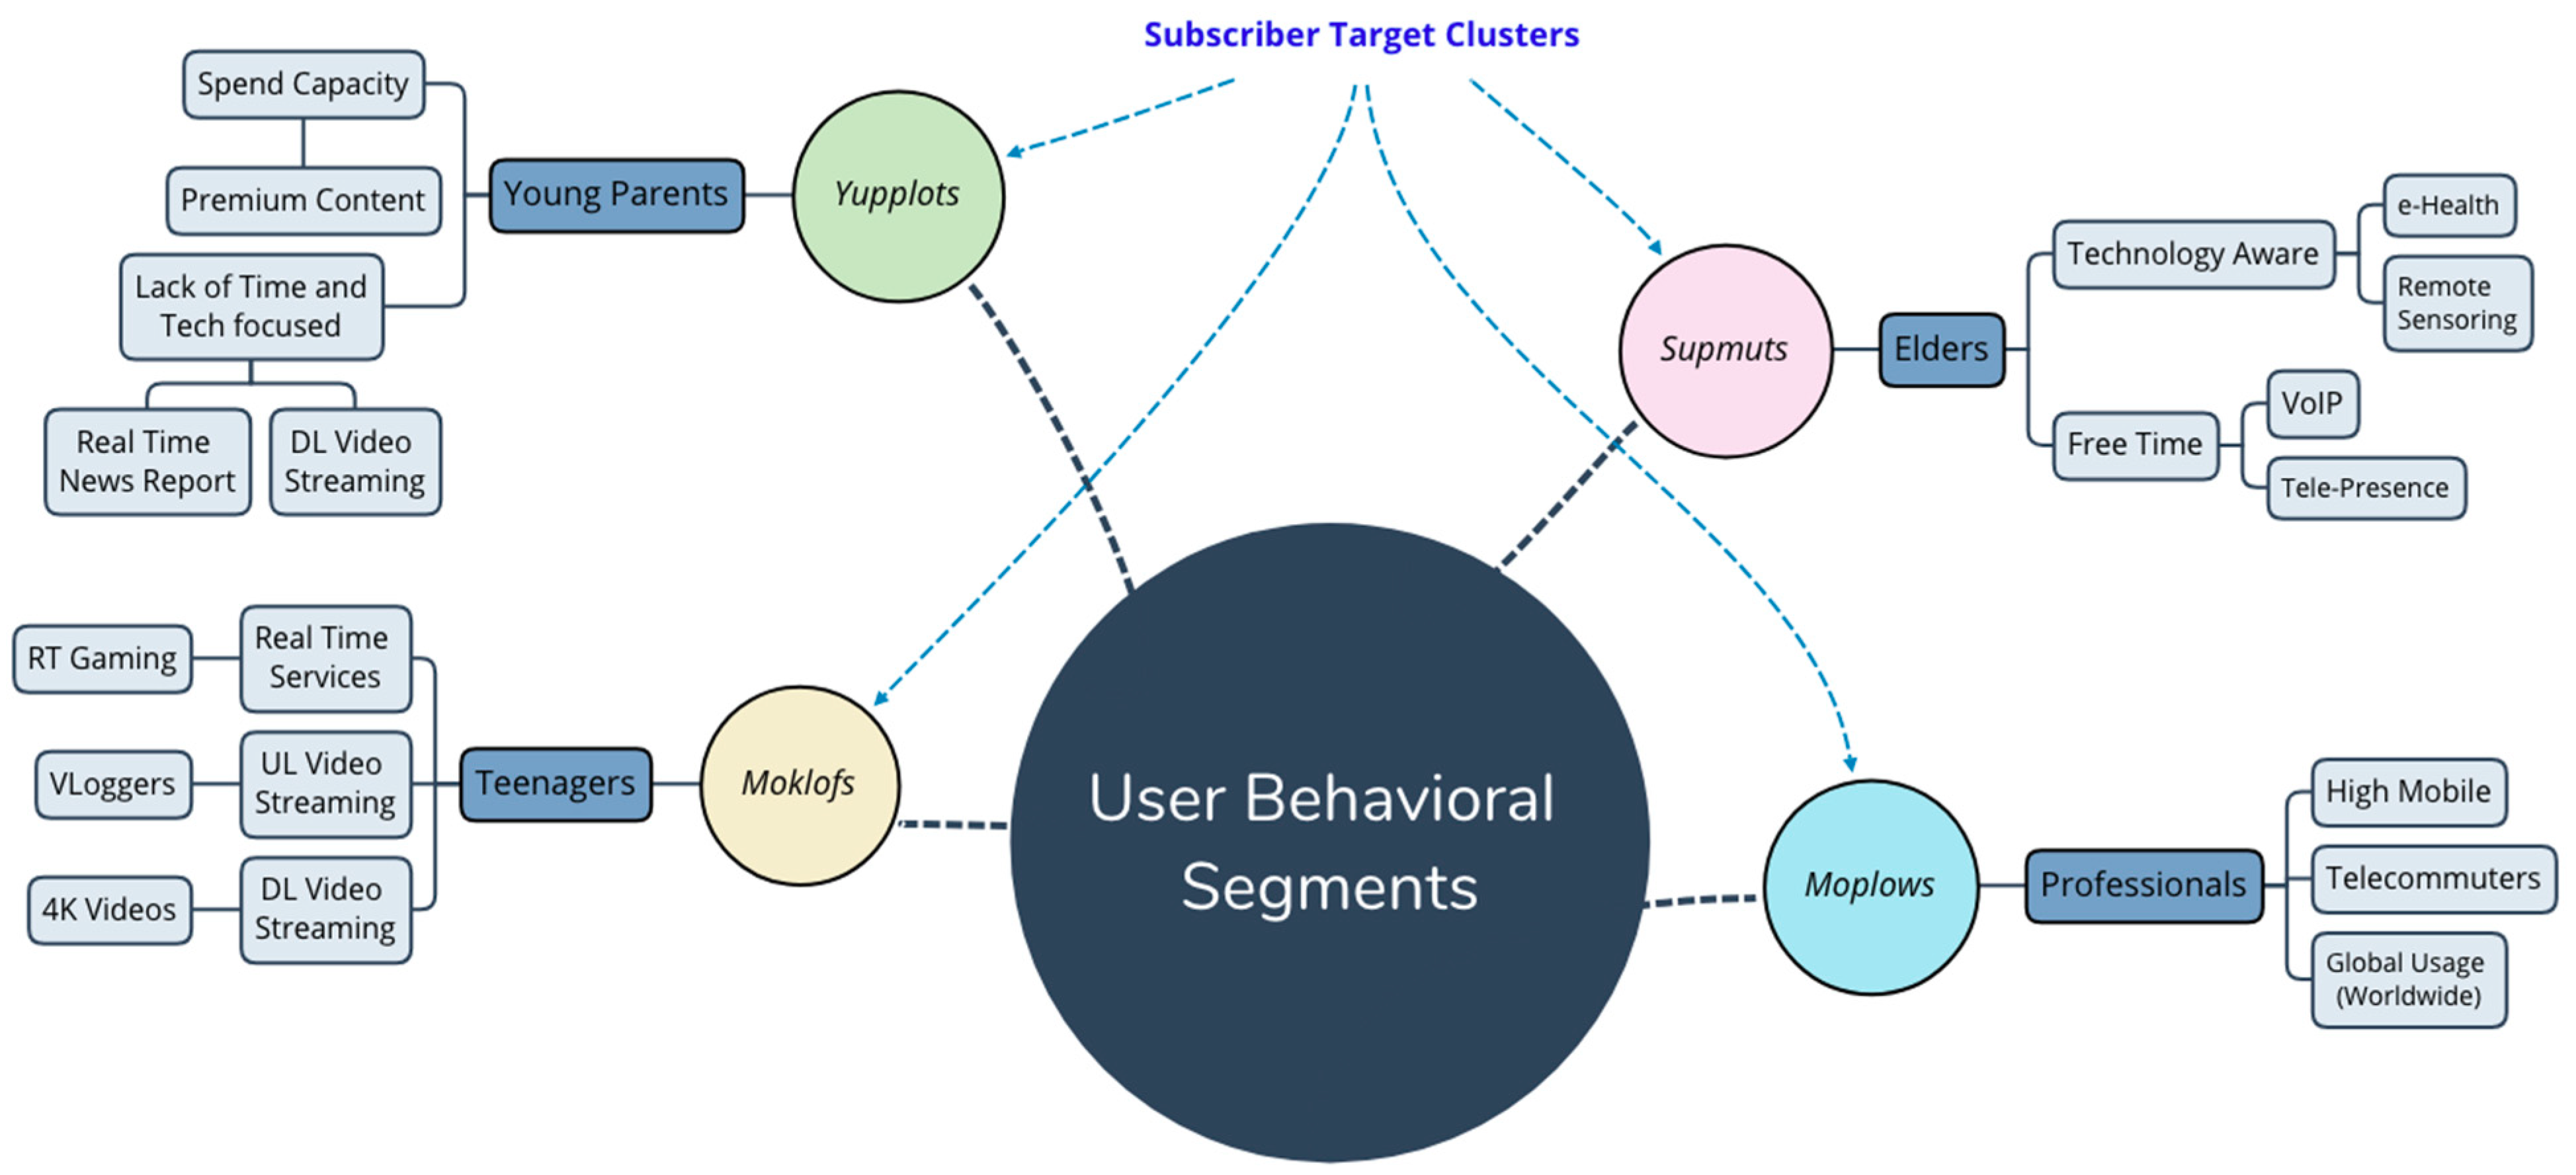
13], allowing it to respond and plan the aspects of the whole network differently. Considering the work previously presented in [
2], the concept of subscriber segments relates to user behavioral segments terminology, as depicted in
Figure 2. These may constitute the main four subscriber clusters this work will extend upon, considering the specifics of 5G and advanced behavior-centric clustering.
2.3. Subscribers Target Cluster
A subscriber target cluster is one of the several clusters that the MNO identifies as being prone to the development of specific planning. For example, a target cluster where video streaming is the most used service will require special attention from the MNO in terms of capacity and network planning, as a consequence. After having applied advanced clustering techniques to their customer base and therefore having a set of clusters identified, the MNO must consider each one of them as a target cluster.
Also, from a post-factum perspective, such a group may become a target group to introduce additional or related services to in order to increase ARPU or, from a quality of experience perspective, should become a target cluster to focus on in order to maximize quality of experience (QoE) and likely reduce the churn probability among such a group’s subscribers.
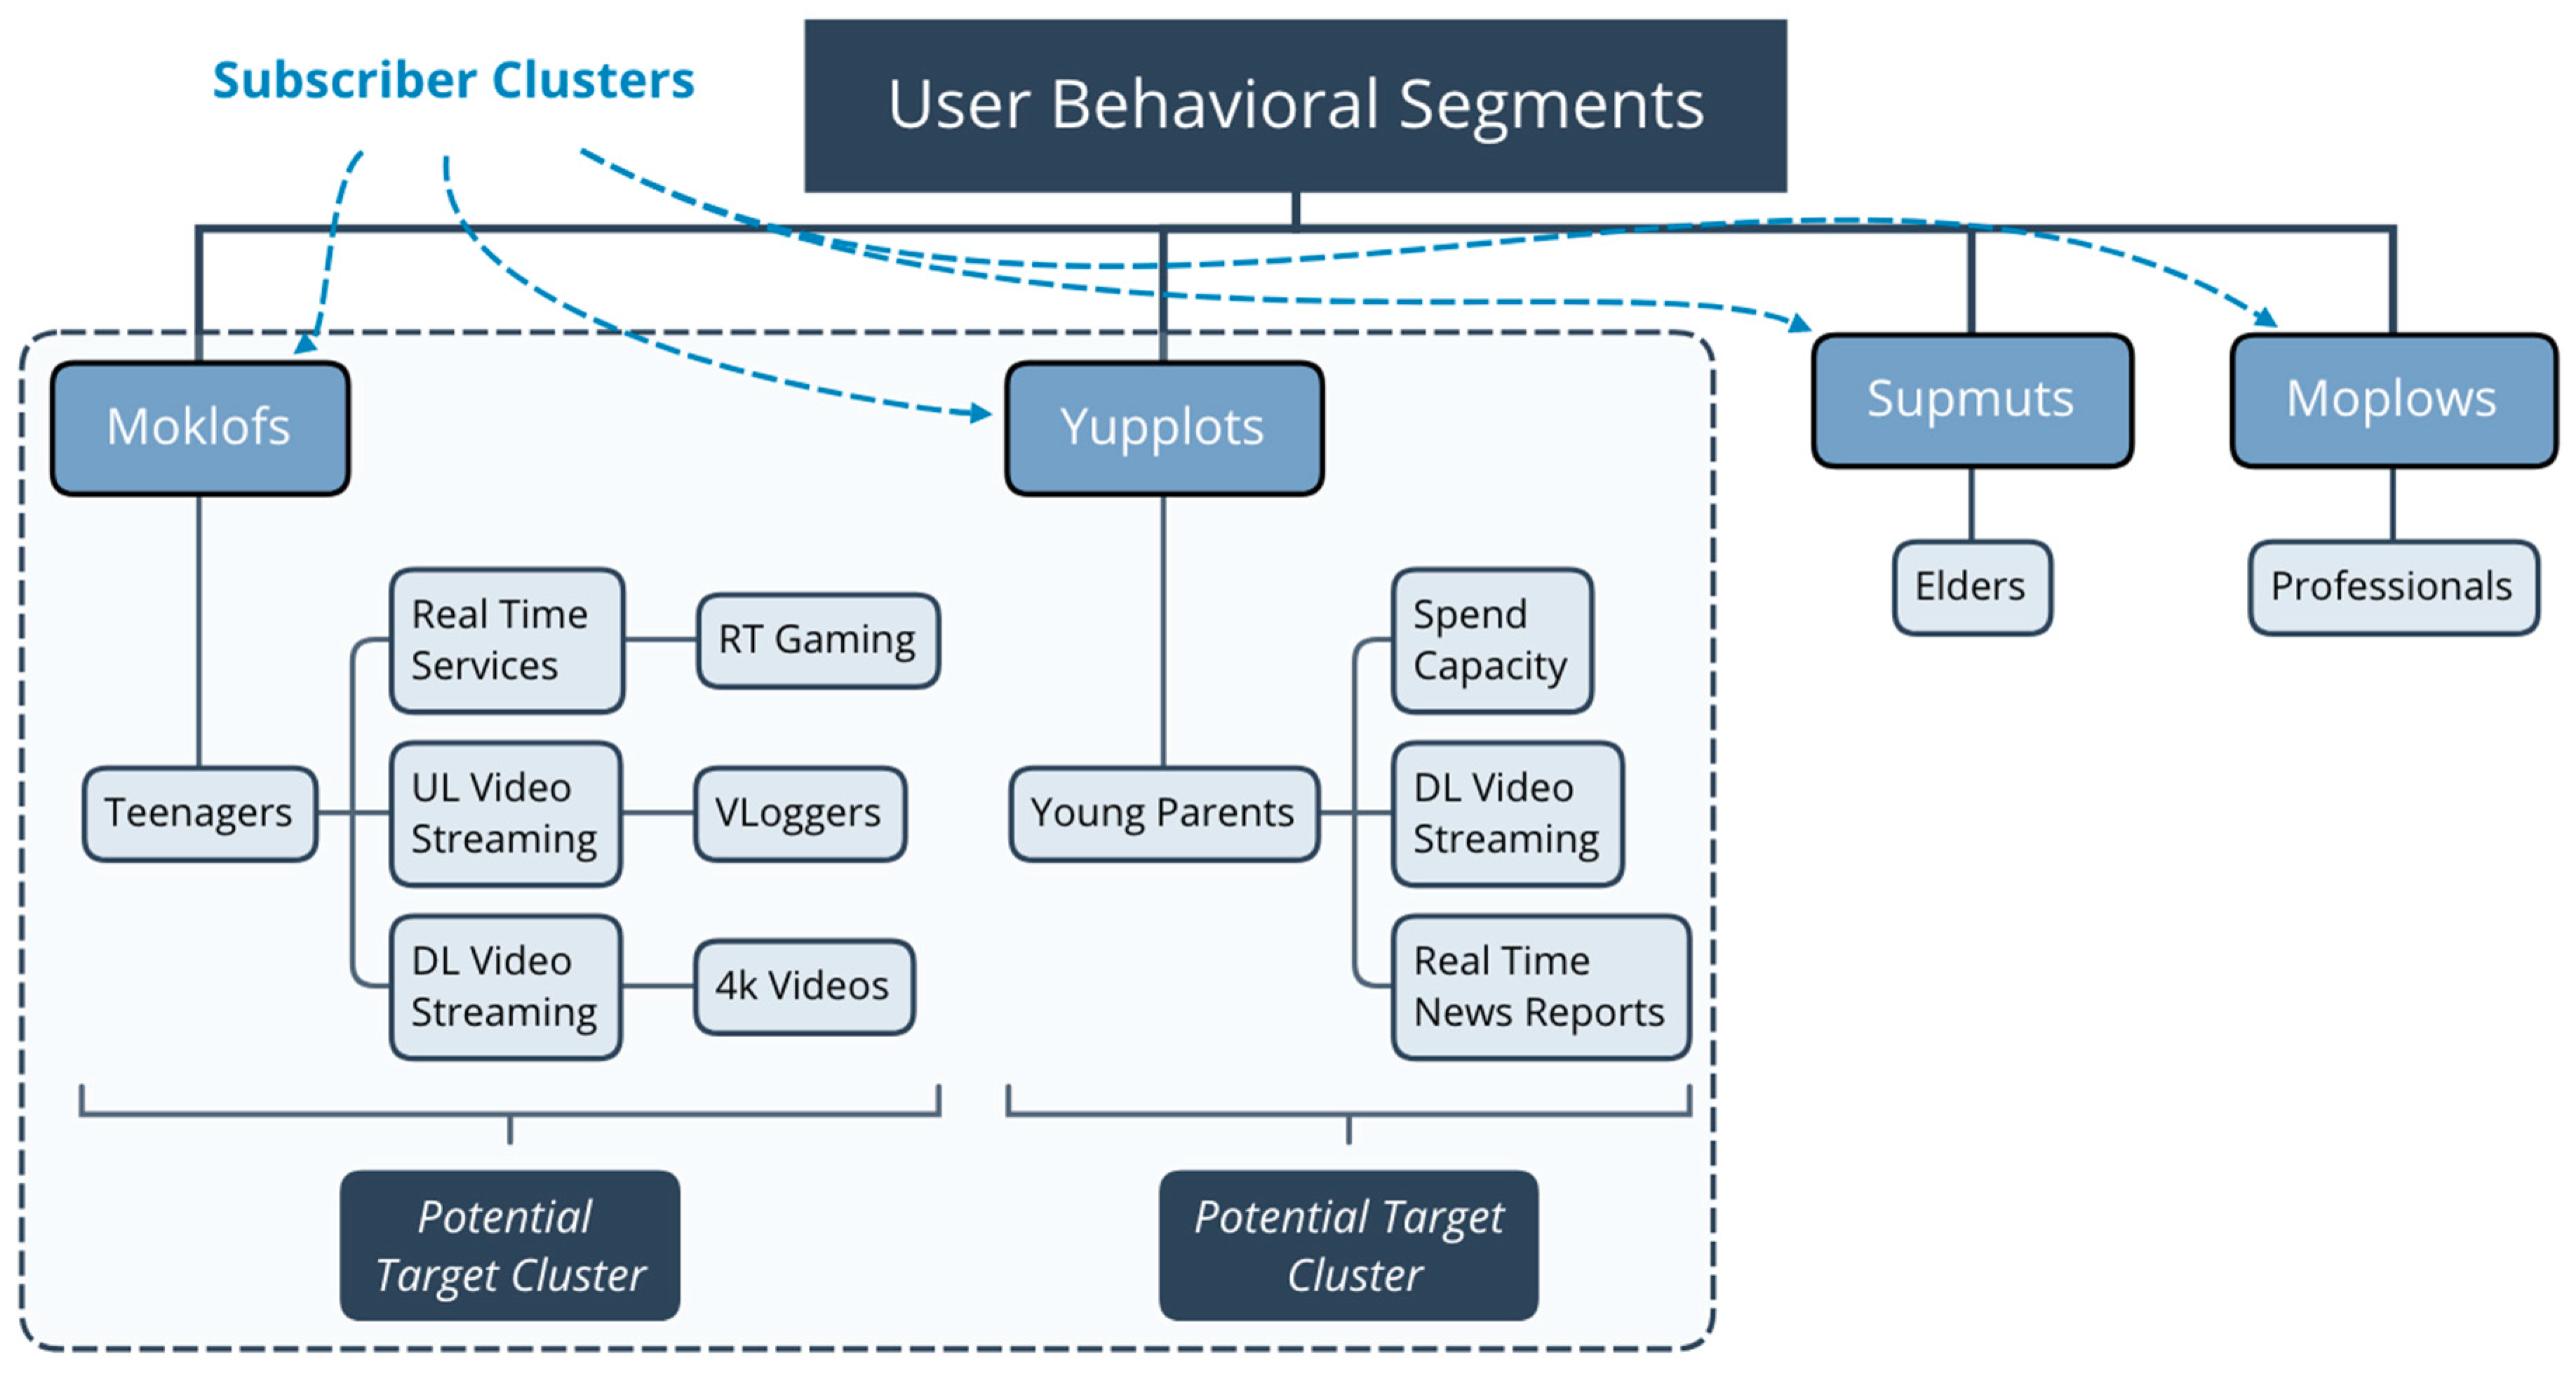
Another interesting example is the introduction of new services. How can an MNO define the best part of its network to deploy the first 5G testbed? Also, which subscribers would be more willing to immediately adhere to the new services? This is an example of how advanced clustering and extracting deep knowledge about customer behavior and characteristics can help an MNO plan to deploy and manage its network. Potential target clusters that can be focused on are represented in
Figure 3, showing where the advanced analytics can extract more information from existing unknowns.
2.4. Expected Benefits of Subscriber-Centric Clustering
From both technical and financial perspectives, by applying the referred technique, a set of benefits can be expected. Subscriber-centric clustering allows more optimized and less costly planning processes for an MNO and overall resource management optimization. This can lead to global reduction of capital expenditure (CAPEX)—investment—and, in particular, operational expenditure (OPEX)—maintenance and support—by having the ability—with the flexibility of 5G and beyond networks—to adapt the network to the changing patterns of the different clusters of subscribers and introduce advanced services due to enhanced resource management capabilities [
14]. The advantages of applying subscriber clustering for financial gain for an MNO can be observed in several reports. Some focus solely on the advantages of service personalization, which is a direct result of applying advanced clustering techniques to subscribers [
15].
From service planning and resource management based on subscribers’ behavior, which is this work’s focus, subscriber-centric clustering allows MNOs to properly plan their network according to deep knowledge from their subscriber’s base and corresponding behavior towards data and service consumption, overall leading to increased capacity requirements. The MNO can focus not only on the technical behavioral aspects of the clusters but also, from an economic perspective, can drive successful campaigns in order to increase the average return per user (ARPU) in several groups, reduce the churn rate in others and optimize sales channels, and, especially, focus on the clusters that contribute most to either planning capacity or profitability.
Thus, MNOs can focus not simply on overall behavior of the subscribers, but also on their future profitability, thus better focusing their resources on the most profitable clusters that, in conjunction with the ability to use software-defined networks (SDN), will for sure contribute to the maximization of resource management at the same time [
16].
Another expected benefit is related to the frequency of such analysis. If performed continuously, or at least very frequently, it enables MNOs to have a fresh look at their customers’ behavior towards service consumption and overall network capacity and adequacy. This leads to an improved understanding of the needs and wants of the subscribers, allowing for identifying lack of network capacity, which in turn enables the concept of intelligent network to rise, adequately complemented with performance and risk key indicators, leading to better overall QoE, quality of service (QoS), and customer satisfaction. From a service perspective, subscriber-centric clustering also allows MNOs to better fit their service offering to the several user groups, considering their consumption patterns and most used services. By doing so, subscribers will gain the notion that the service provided by their MNO network fully matches their needs and, interestingly, such notion can lead the MNO to competitive advantage scenarios compared with others. Some examples of advantages were briefly discussed, but others can surely be derived from subscriber-centric clustering, which can become the distinguishing factor between visionary MNOs in a highly mutable customer market. The following section will focus on some of the parameters that can be considered to perform cluster characterization, which is of utmost importance to properly define the subscribers’ clusters.
3. Cluster-Centric Characterization
As referred to in the previous section, there are several variables that can be considered in order to perform clustering among subscribers. The most important part, however, is that the clusters should be most representative of their subscribers as possible. The ability to split the subscriber base into homogenous clusters each with different sets of behaviors, needs, and desires is fundamental, especially in the network planning phase [
17]. The most common methods found in the literature include demographic, psychographic, transactional, and behavioral segmentation. Despite the focus of this work being behavior, we briefly describe some of the parameters that can be evaluated in each one of these methods.
Geographic segmentation is based on geographical characteristics such as, for instance, place of birth, nationality, home address, and region of interest. Broadly, every geographical parameter associated with the subscriber can be used. Another interesting aspect is to use geo-textual data to feed certain services to subscribers [
18]. Demographic clustering can be performed by looking at subscriber’s information such as age, gender, marital status, and also financial income [
12,
13,
15].
Psychographic clustering uses parameters that are subjective and focused on subscribers’ attitudes and interests. This kind of clustering can be performed together with classical clustering methods, such as demographic, in order to complement the analysis with deeper insights from subscribers’ perspectives.
Transactional clustering usually takes into consideration parameters such as the number of purchased products, financial volume, and number of items purchased, as well as time of the day the purchase occurs. From a cellular planning perspective, such parameters are very important because they will contribute to the identification of one or more clusters of subscribers that buy high-end mobile devices—which have the ability to generate more traffic—or that have more than on device, also contributing to higher levels of traffic capacity needs [
4].
Behavioral clustering is the main focus of this work, which is described in greater detail in the following section and that will further enable the disclosure of subscriber clusters that have not been addressed from a cellular planning perspective and that will be characterized by high capacity demand.
4. Behavioral Clustering
4G has greatly changed users’ behavior towards the usage of mobile services. 5G and beyond networks are expected to produce even bigger changes in subscribers’ behaviors. Behavioral clustering focuses on parameters that can characterize the actions and behavior of subscribers. It is a set of clustering variables with a high degree of uncertainty, especially if the used parameters are not properly fit or the subscribers have erroneous actions that do not allow for pattern extraction. Examples of such parameters are benefits sought from a service or set of services, sense of happiness that a service can provide (e.g., using social networks massively), quality of experience, and spend ability, among others. Behavioral variables are becoming increasingly important as subscribers’ behavior is changing due the usage of mobile networks. This leads to very subjective variables that can be used to cluster yet, at the same time, new service models are enabled over cellular networks (e.g., real-time YouTubers, continuously uploading high amounts of data). Interesting concepts such as revenue per experience thus start to become a reality, and quality of experience becomes more prevalent than quality of service, which can lead to another subset of parameters focusing around the likeliness of a subscriber to re-use certain services in the future. Spend ability is a very interesting parameter that can be used in order for MNOs to prepare service tailoring and introduction, as well as plan a higher capacity area, on the basis of the expected spend capacity of the identified cluster.
Additionally, the ability of knowing which subscribers are more willing to spend on network capacity, a better service or set of services, as well as subscribers that exist, previously unknown to have such ability, illustrates the power of using behavior as a special clustering as opposed to just using the more traditional ones such as simple demographic data.
Behavioral clustering is one of the most powerful clustering techniques due specifically to its ability not only to characterize each subscriber’s behavior but also, when additional data science mechanisms are used, to predict subscribers’ future behavior. Although behavior prediction is out of the scope of this work, it is fair to state that behavioral clustering is a superset of clustering that can use any of the traditional clustering methods’ variables, take them all into consideration, but also having the added value of considering other intrinsic subjective parameters in a combined fashion. All will contribute to the development behavioral models and clusters, allowing MNOs to potentially satisfy all subscribers in the end, as well as developing more adequate intelligent cellular networks.
5. New Subscriber Behavioral Clusters
As mentioned previously, new subscriber behavior clusters can be derived from potential target clusters, as presented below. Such new reality will result in adaptations of the impact model from previous work, shown in
Section 5.2.
5.1. New Behavioral Clusters
The introduced subscriber cluster is derived from demonstrated behavior of children towards the usage of cellular networks and end user devices. A focus on ages between 0 and 12 years old is precisely a range of ages that is usually not considered within the field of network capacity planning. Therefore, it is a 0–12 year-old behavior-based cluster, which is additionally split into three sub-clusters, as presented in
Table 1, on the basis of different observed behavior.
We define toddlers as babies aged 0–2, preschoolers between 3 and 5 years old, and tweens between 8 to 12 years old. We felt the need to split these last two clusters into younger and older individuals due to some overlapping behavior, which is perfectly expectable. Such clustering seems the most appropriate considering several studies [
2,
3,
4,
5,
6,
7,
8,
9]. It is not the focus of this section to cover all subscriber’s segments, but to focus solely on those which we believe are the new user behavioral segments that must be considered, as presented in
Table 1, which will be further explored in the next section.
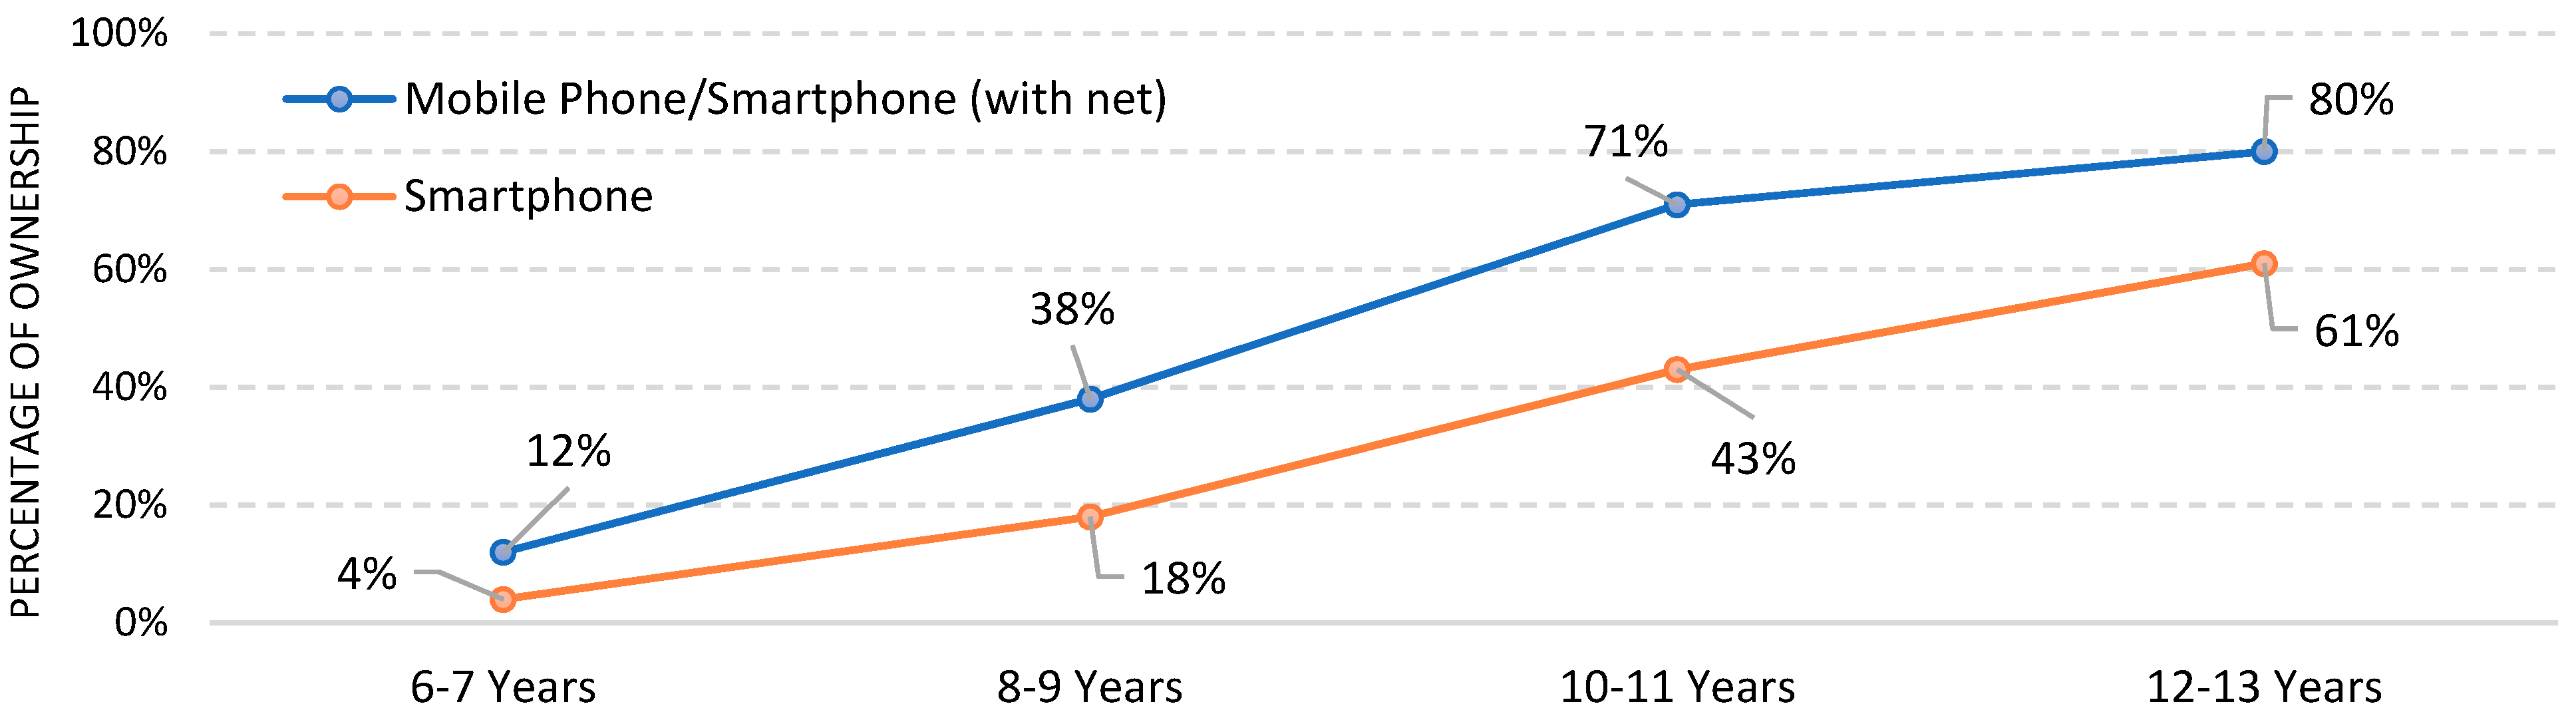
Figure 4 clearly shows that smartphone ownership has been rising among preschoolers [
3]. Pew Research Center has shown that service consumption changes according to age, with Facebook and YouTube being the most prevalent services among adults over smartphones, but, on the other hand, young adults (between 18 to 24 years old) are clearly shifting to a set of platforms depending on their behavioral characteristics [
4]. Another interesting factor that directly characterizes the behavior towards usage of services is the amount of time that each subscriber spends daily on online platforms. In [
4], it was shown that in a group of children aged 3 to 5, almost 85% had and used smartphones to access media. A study focused on mobile usage among young children showed that many parents in the United Kingdom are worried about not effectively monitoring their young children’s usage of handheld devices, with extensive time being spent on such activities, mainly for video watching and educational applications. All of these are high capacity-demanding mobile services that MNOs should be aware of, especially when, as shown in the study, watching online videos is one of the main activities of young children [
19].
In the United States, it can be seen in
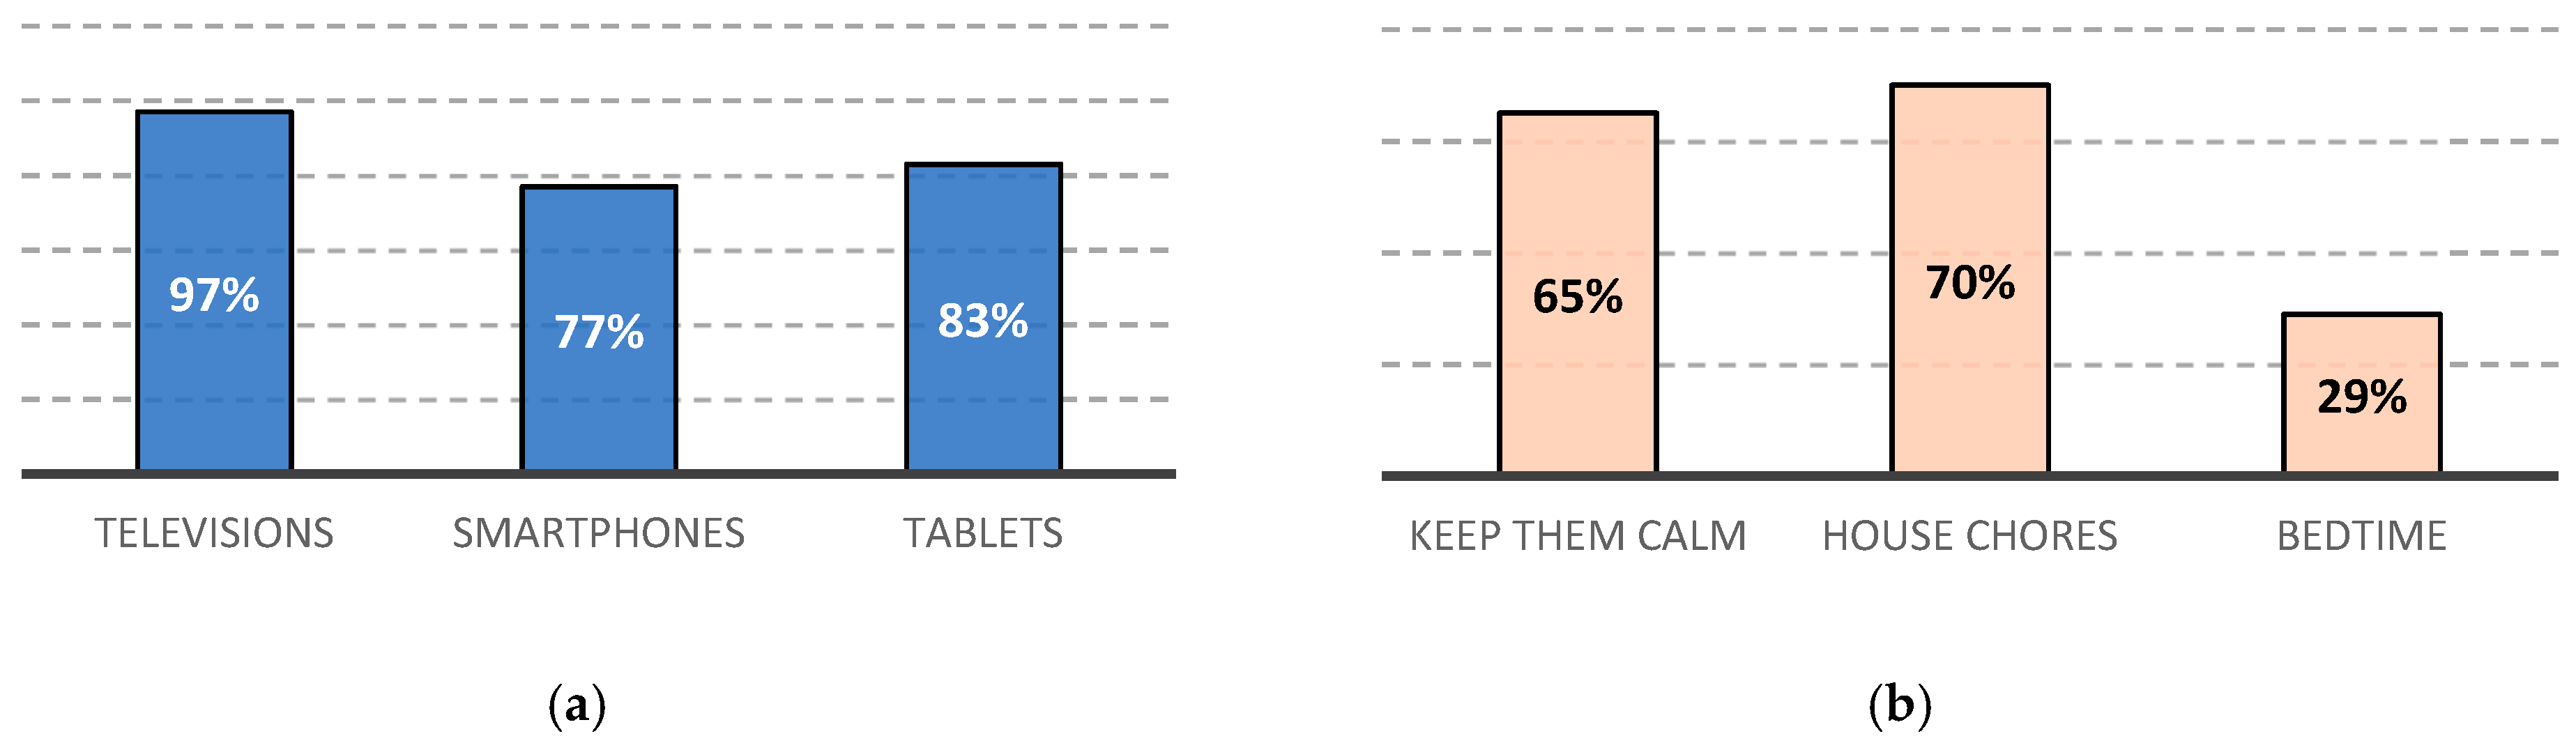
Table 2 that there is a clear behavior towards accessing social networks several times a day, on a clear demonstration that such applications and services are becoming part of subscriber’s life. This is a clear indicator that, when compared with the past, the behavior has changed and that mobile usage is becoming more prevalent and real-time based in order to sustain such habits and needs. The majority of households have a TV, smartphones, and tablets, as depicted in
Figure 5a.
This clearly shows a tendency of three major devices for screen visualization. It was shown that 96.6% of children used mobile devices, in some cases right after turning one year old [
19]. However, most interestingly from a behavioral perspective, is the reason behind such usage at a young age—most parents confessed that they gave smartphones to their children in order to calm them down (65%), which is increasingly becoming a common reason, especially in restaurants to keep children quiet. A total of 29% of parents even assumed that smartphones should be given to children at bedtime in order, once again, to calm them down (
Figure 5b) [
20].
An indirect behavior of parents regarding their children results in a segment of the population, in this case very young children, starting to have access to devices and beginning to generate relevant amounts of traffic (mainly based on video or real-time gaming). Another very relevant aspect is that this group of children started using mobile media before the age of one year old. By the age of two, most children used a device daily and spent relevant screen time on television and mobile devices. Most three- and four-year-olds used devices without any help, in a completely autonomous way. By four years old, most of them had their own device [
17,
19].
In another perspective, reinforcing the statement that these new behavioral clusters must be taken into account is the fact that children between one and nine years old tend to use smartphones repeatedly without separating from the device [
6]. This, once again, constitutes a great source of traffic generation, and capacity demands rise, as usually these users consume streaming services, mainly YouTube videos, on high resolution through their smartphones [
21]. It was also shown that for children under six years old, attending kindergarten and daily care centers, 80% used smartphones and the most preferred usage was precisely watching children’s videos. Once again, the main reason for children using smartphones was to keep them calm or for house chores, as depicted in
Figure 5b adapted from [
19]. However, these are not the only reasons—to amuse them mainly while eating out, which is complemented by meal times at home or during long trips, is also a strong reason [
6,
7]. In [
8], it is shown that for trips higher than 1.5 h, a continuous stream of video or online gaming will be generating a great amount of network traffic.
A recent work has narrowed down the services to only three main groups used by tweens: contacting friends, entertainment, and visiting websites [
21]. A recent survey from AT&T [
22] shows that end user device usage from younger American segments has increased exponentially since 2016—84% of preschoolers and 96% of tweens have their own internet-connected devices, smartphones, tablets, computer, or gaming system, and preschoolers have sole access to their own equipment.
Naturally, these results vary from context and demographic area, but it is not the aim of this work to focus on those differences. Instead, our aim is to show that, in fact, there are user clusters that did not exist in the past and that should now be considered for mobile network planning and capacity quantification.
From a parental perspective, it can be affirmed that parents use their smartphones as a distraction tool or as a reward to their children, once again, revealing high usage of smartphone by children [
19,
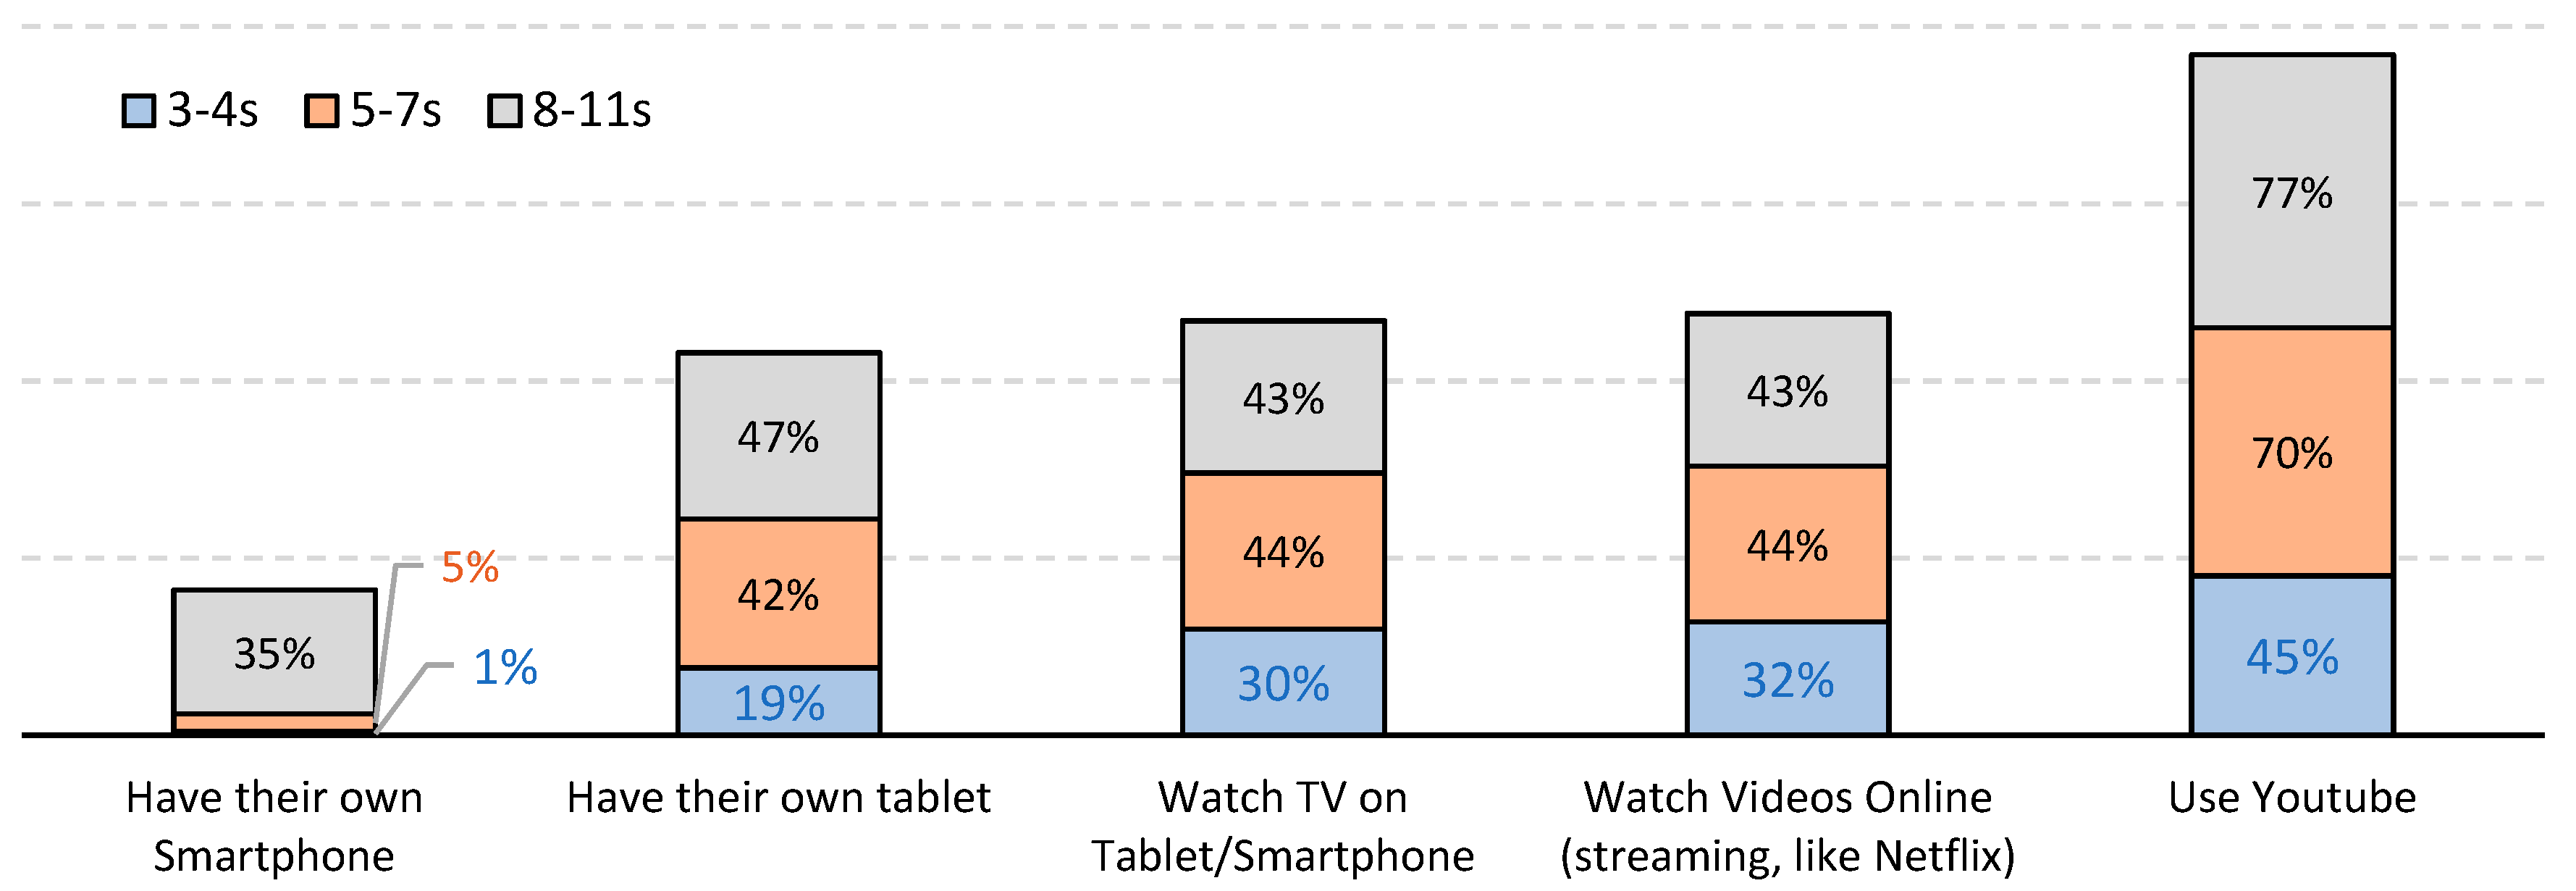
23]. Parents in their twenties, thirties, and above assume the initiative of giving smartphones to their children. Parents in their thirties were the most common. A 2018 report shows that toddlers and young preschoolers use their parents’ smartphone to access their content, whereas older preschoolers and tweens have their own phone. When considering tablets, 19% of toddlers and young preschoolers have their own tablet, as well as 47% of older preschoolers [
8,
24], as depicted on
Figure 6. The report also shows that toddlers might use their parents’ smartphones, but more than that, some might have their own tablet, which typically, for the same content and especially considering the screen size, downloads videos with higher quality, meaning additional traffic generation.
Another relevant fact that contributes even more to premature access to smart devices by younger children is the increasing belief from parents that mediation practices (e.g., content monitoring and time usage restrictions) may minimize negative effects and actually contribute beneficially to enhance or accelerate children’s learning processes [
7,
17,
21,
25]. Such a belief will be reflected as additional challenges for MNOs in terms of capacity and QoS. High traffic-demanding applications remain the main usage of smartphones, ranging from watching TV, to streaming videos (e.g., Netflix), to YouTube. Older preschoolers and tweens are the most demanding, with YouTube usage above 70% on their hand-held devices, mostly for watching videos and listening to music through video clips (
Figure 6).
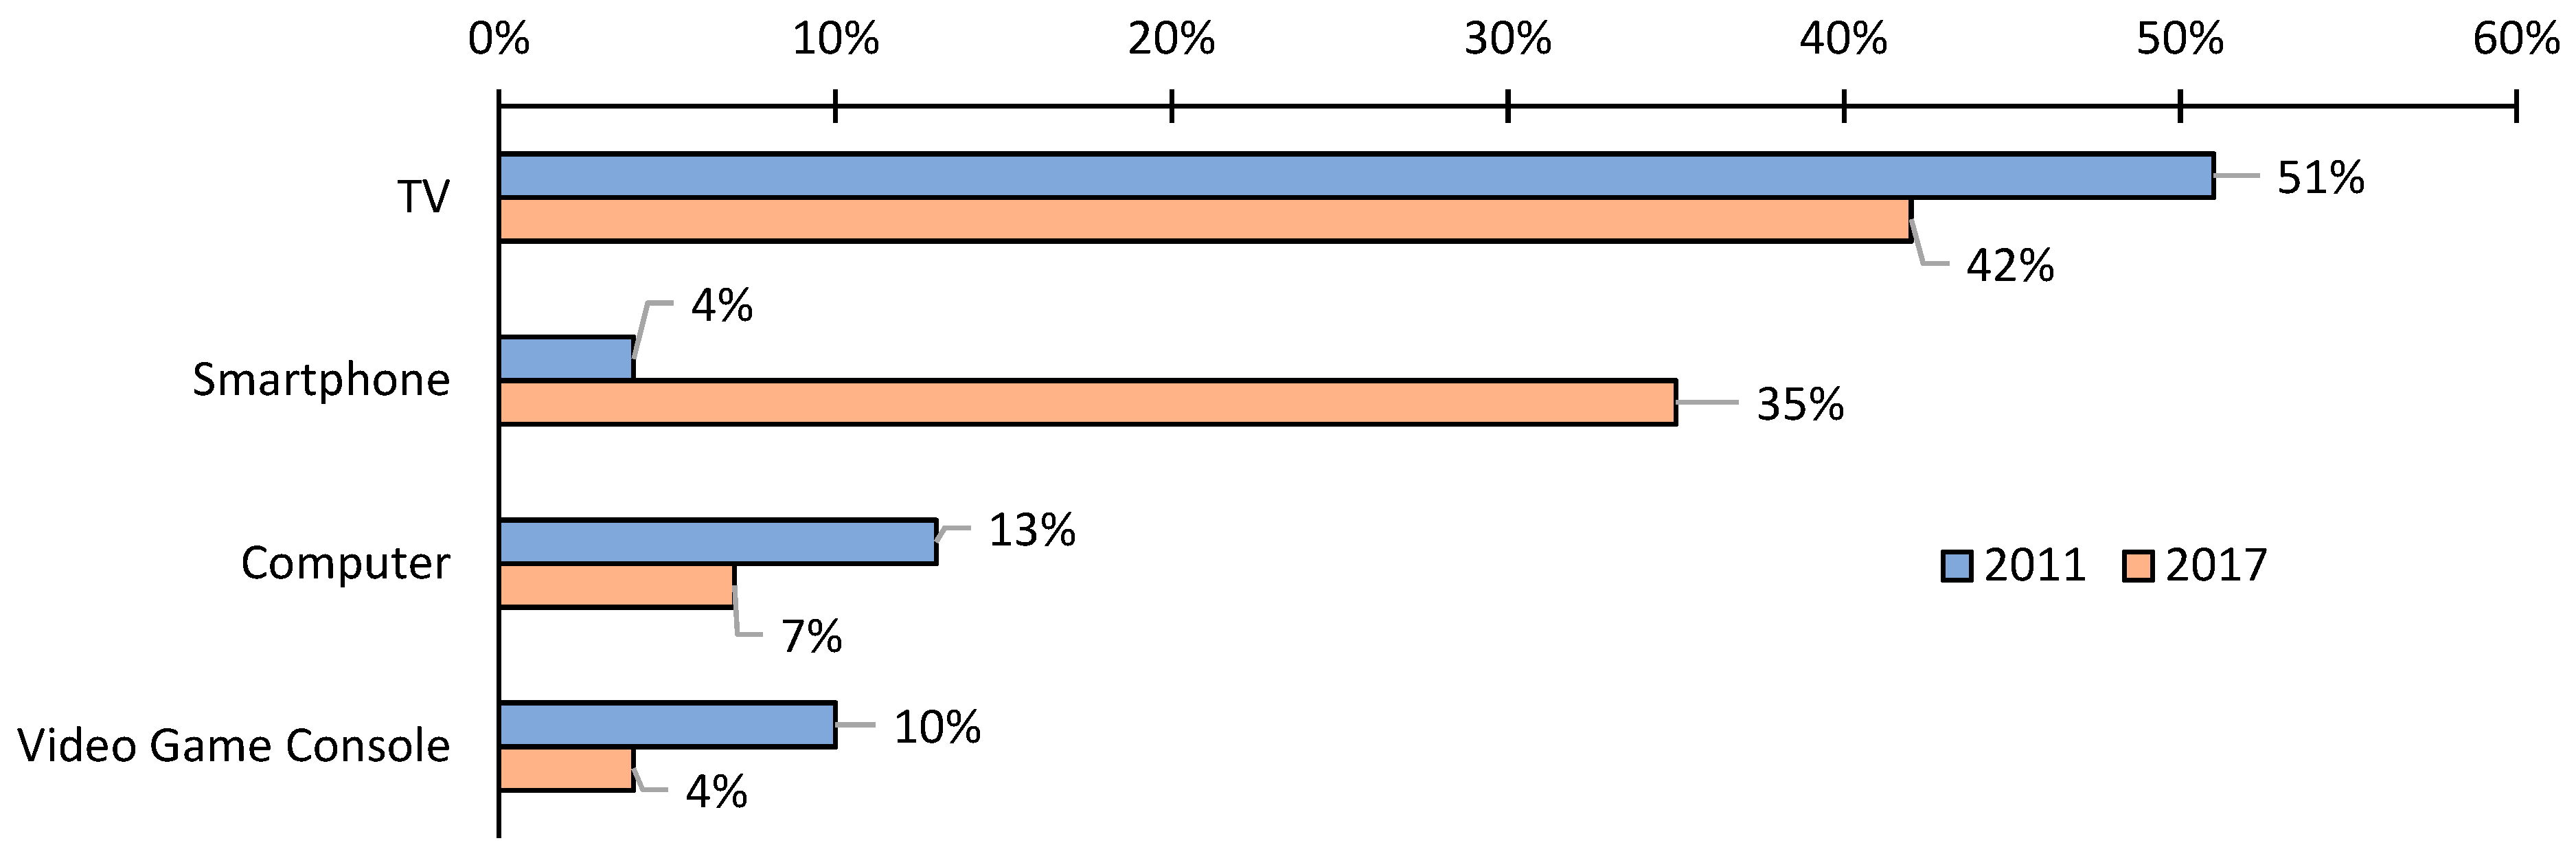
These results also show that YouTube is becoming the viewing platform of choice, with rising popularity particularly among tweens, who are increasingly becoming content generators (
Vloggers, YouTubers). In a long timeframe comparison between 2011 and 2017 and also another between 2014 and 2019, regarding screen usage among toddlers and young preschoolers, it can be seen that TV screen time has been decreasing, and that smartphone usage has risen drastically [
9,
26]. Computer and gaming console usage has also been dropping, clearly supporting the idea that, progressively, the smartphone is replacing those devices (
Figure 7).
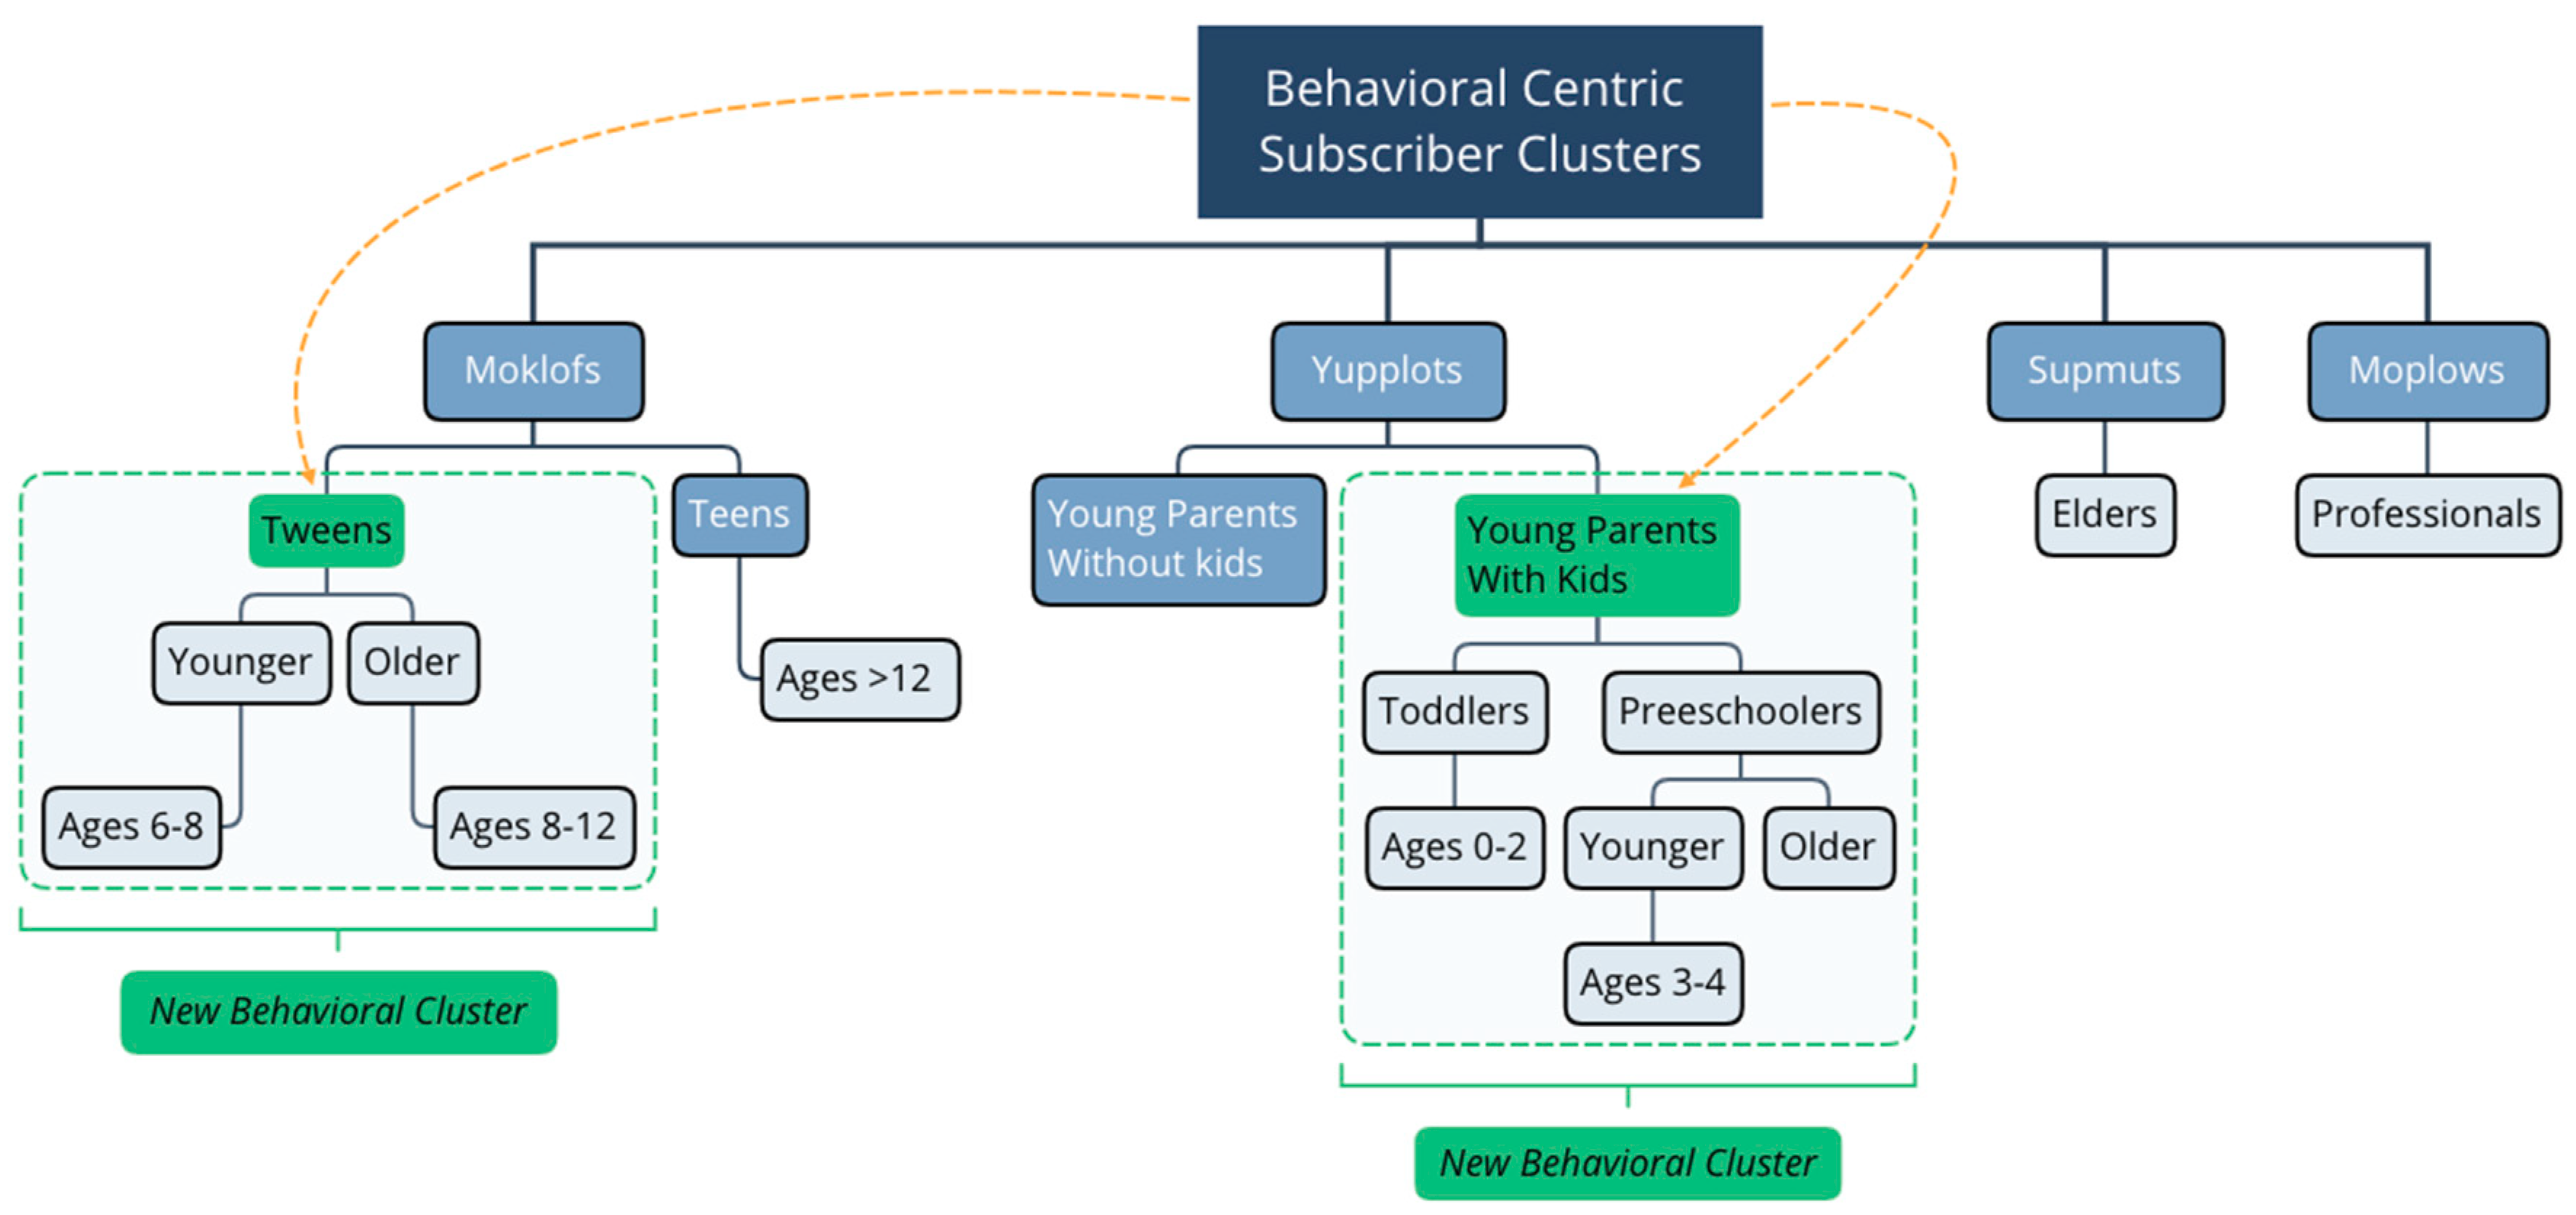
As demonstrated in the previous section, there is a new behavior pattern that will force young parents cluster to be split according to whether they have children or not. Thus, a new behavior cluster appears from Yupplots (young parents with lack of time), accommodating those parents that have young children, either toddlers or preschoolers, allowing them to have access to devices, and thus representing a behavioral change. This is the first result of applying advanced clustering analytics merged to cellular concepts.
Figure 8 shows the result of the proposed extension, with two clusters that became target clusters and, by further using advanced clustering analytics, result in two additional clusters. In the end, there are six subscriber clusters, two of them becoming the target clusters from the perspective of this work (tweens and young parents with children), clearly showing the advantage of performing advanced clustering analytics over existing data. From an impact perspective, both new clusters will contribute differently. The tweens cluster will represent increased capacity need, up to now, only considering ages from 13 onwards. This is considered as a new behavioral cluster because, as was shown in previous sections, the majority of children at age six already own their own device [
17,
19].
5.2. Adaptation of Subscriber-Centric Impact Model
The changes to context and, especially, changes to behavioral clusters, with two additional ones to be considered, must be properly considered in the impact model presented in [
2]. Thus, we present the major changes to the model, which will attest its flexibility, which was one of the major aspects when it was developed. Setting the baseline of services, we consider the most prevalent services for 2020–2022 [
24,
27], as previously presented in
Table 3.
Those services form a T vector representing the traffic share of each S service.
In the elements of the vector,
k represents the
kth service, which ranges from 0 to 7. Such services are then categorized and some of them aggregated considering their similarities, leaving video streaming as the most prevalent, which we, in this work will assume differently—in the previous work we considered eight services, but in this case we will only consider video and non-video services, as represented in
Table 4. Services were treated individually in the previous work, however, in this work, in order to only have two classes (video and non-video), service aggregation had to be performed, as represented in
Table 4 by
X. Such assumption and simplification aim to understand the impact of the new behavioral clusters that mainly have video streaming service usage behavior, which is the main point to demonstrate in this work. This means that, in this case,
k ranges only from 0 to 1. Each of the initial four behavioral clusters were then mapped according to their contribution to the total traffic generated by each of those five classes.
Two periods in time were considered in the previous work, regarding expected total traffic generated by each service:
Y = 2016 and
Y = 2020 and compared the contribution of each behavioral cluster both in 2016 and 2020. Traffic followed a probability distribution function per behavioral cluster as a function of services usage
, where
the usage probability of each of the
kth service and
K is the total number of considered services,
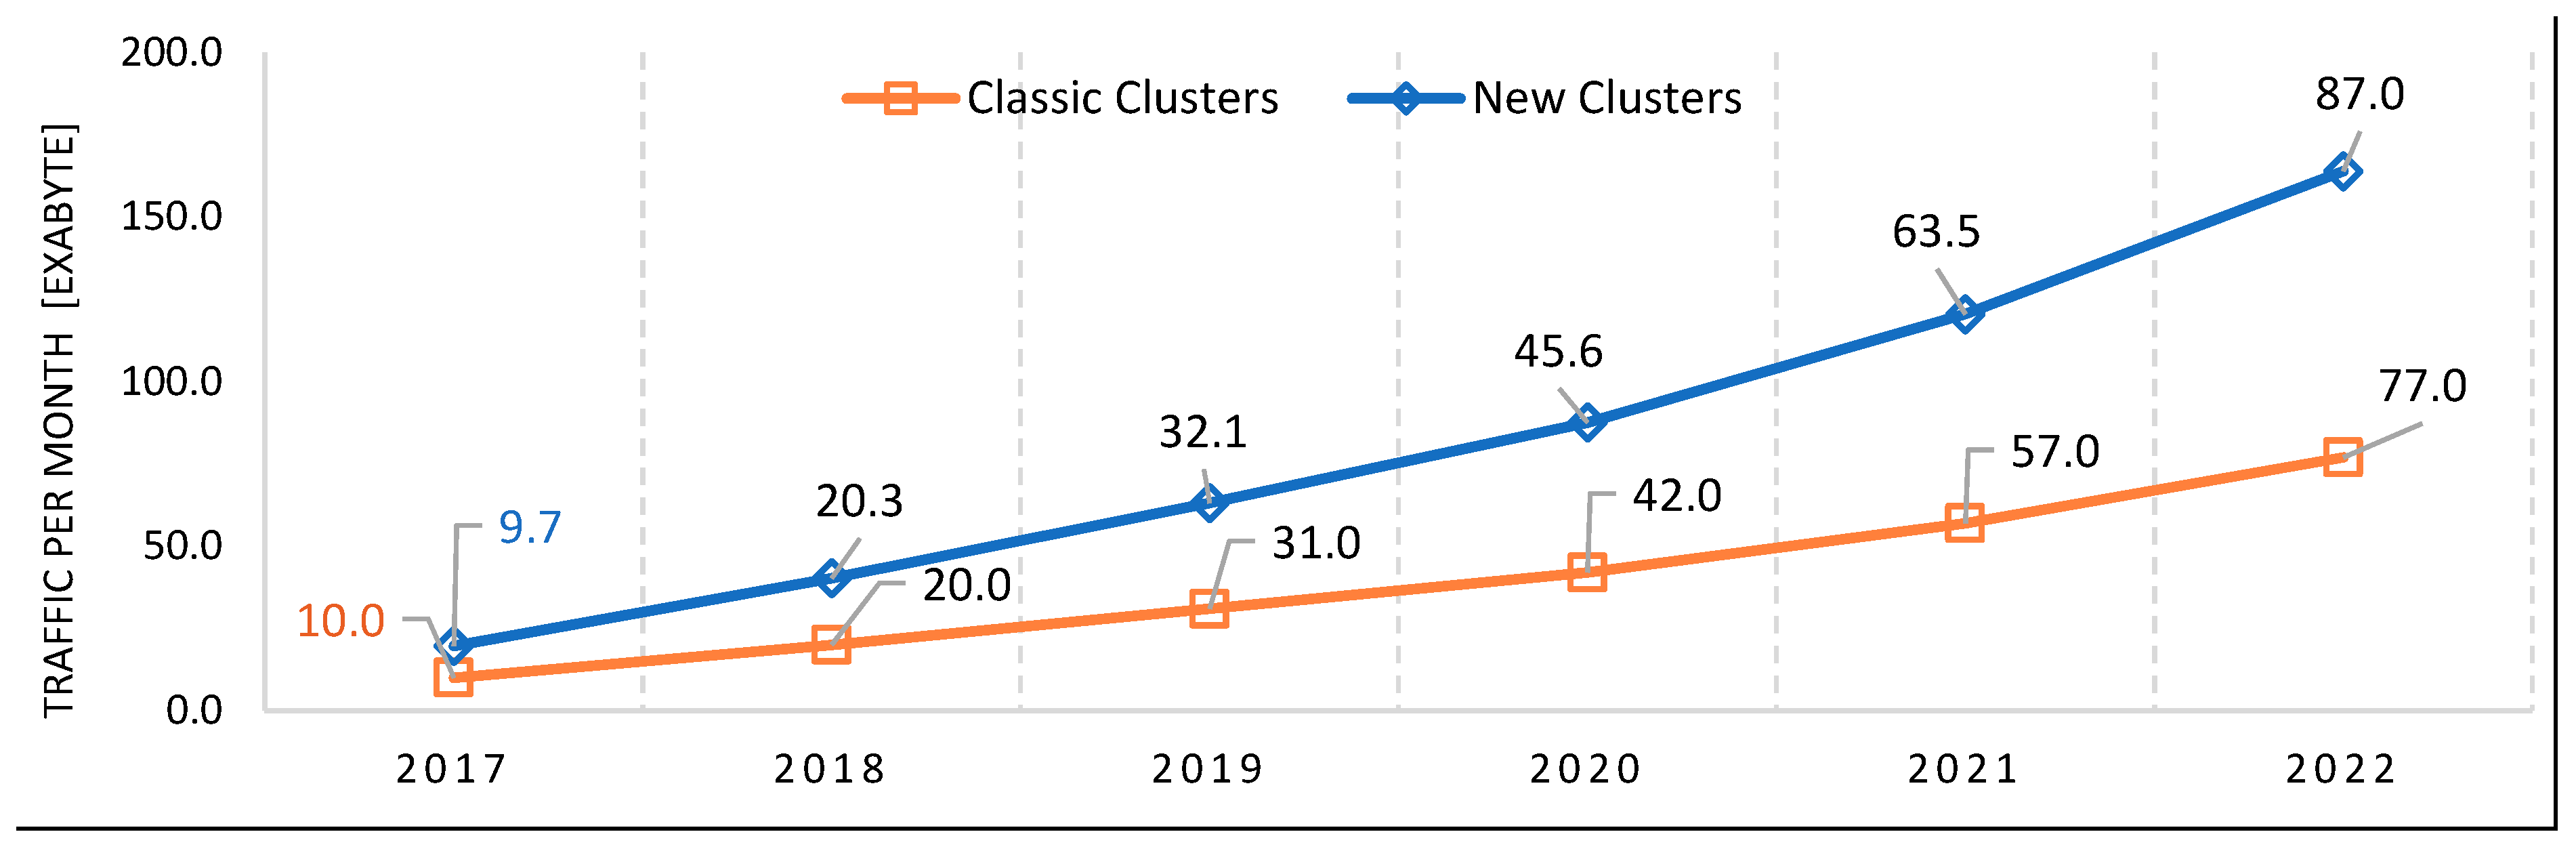
Ss. In this case, we have narrowed down
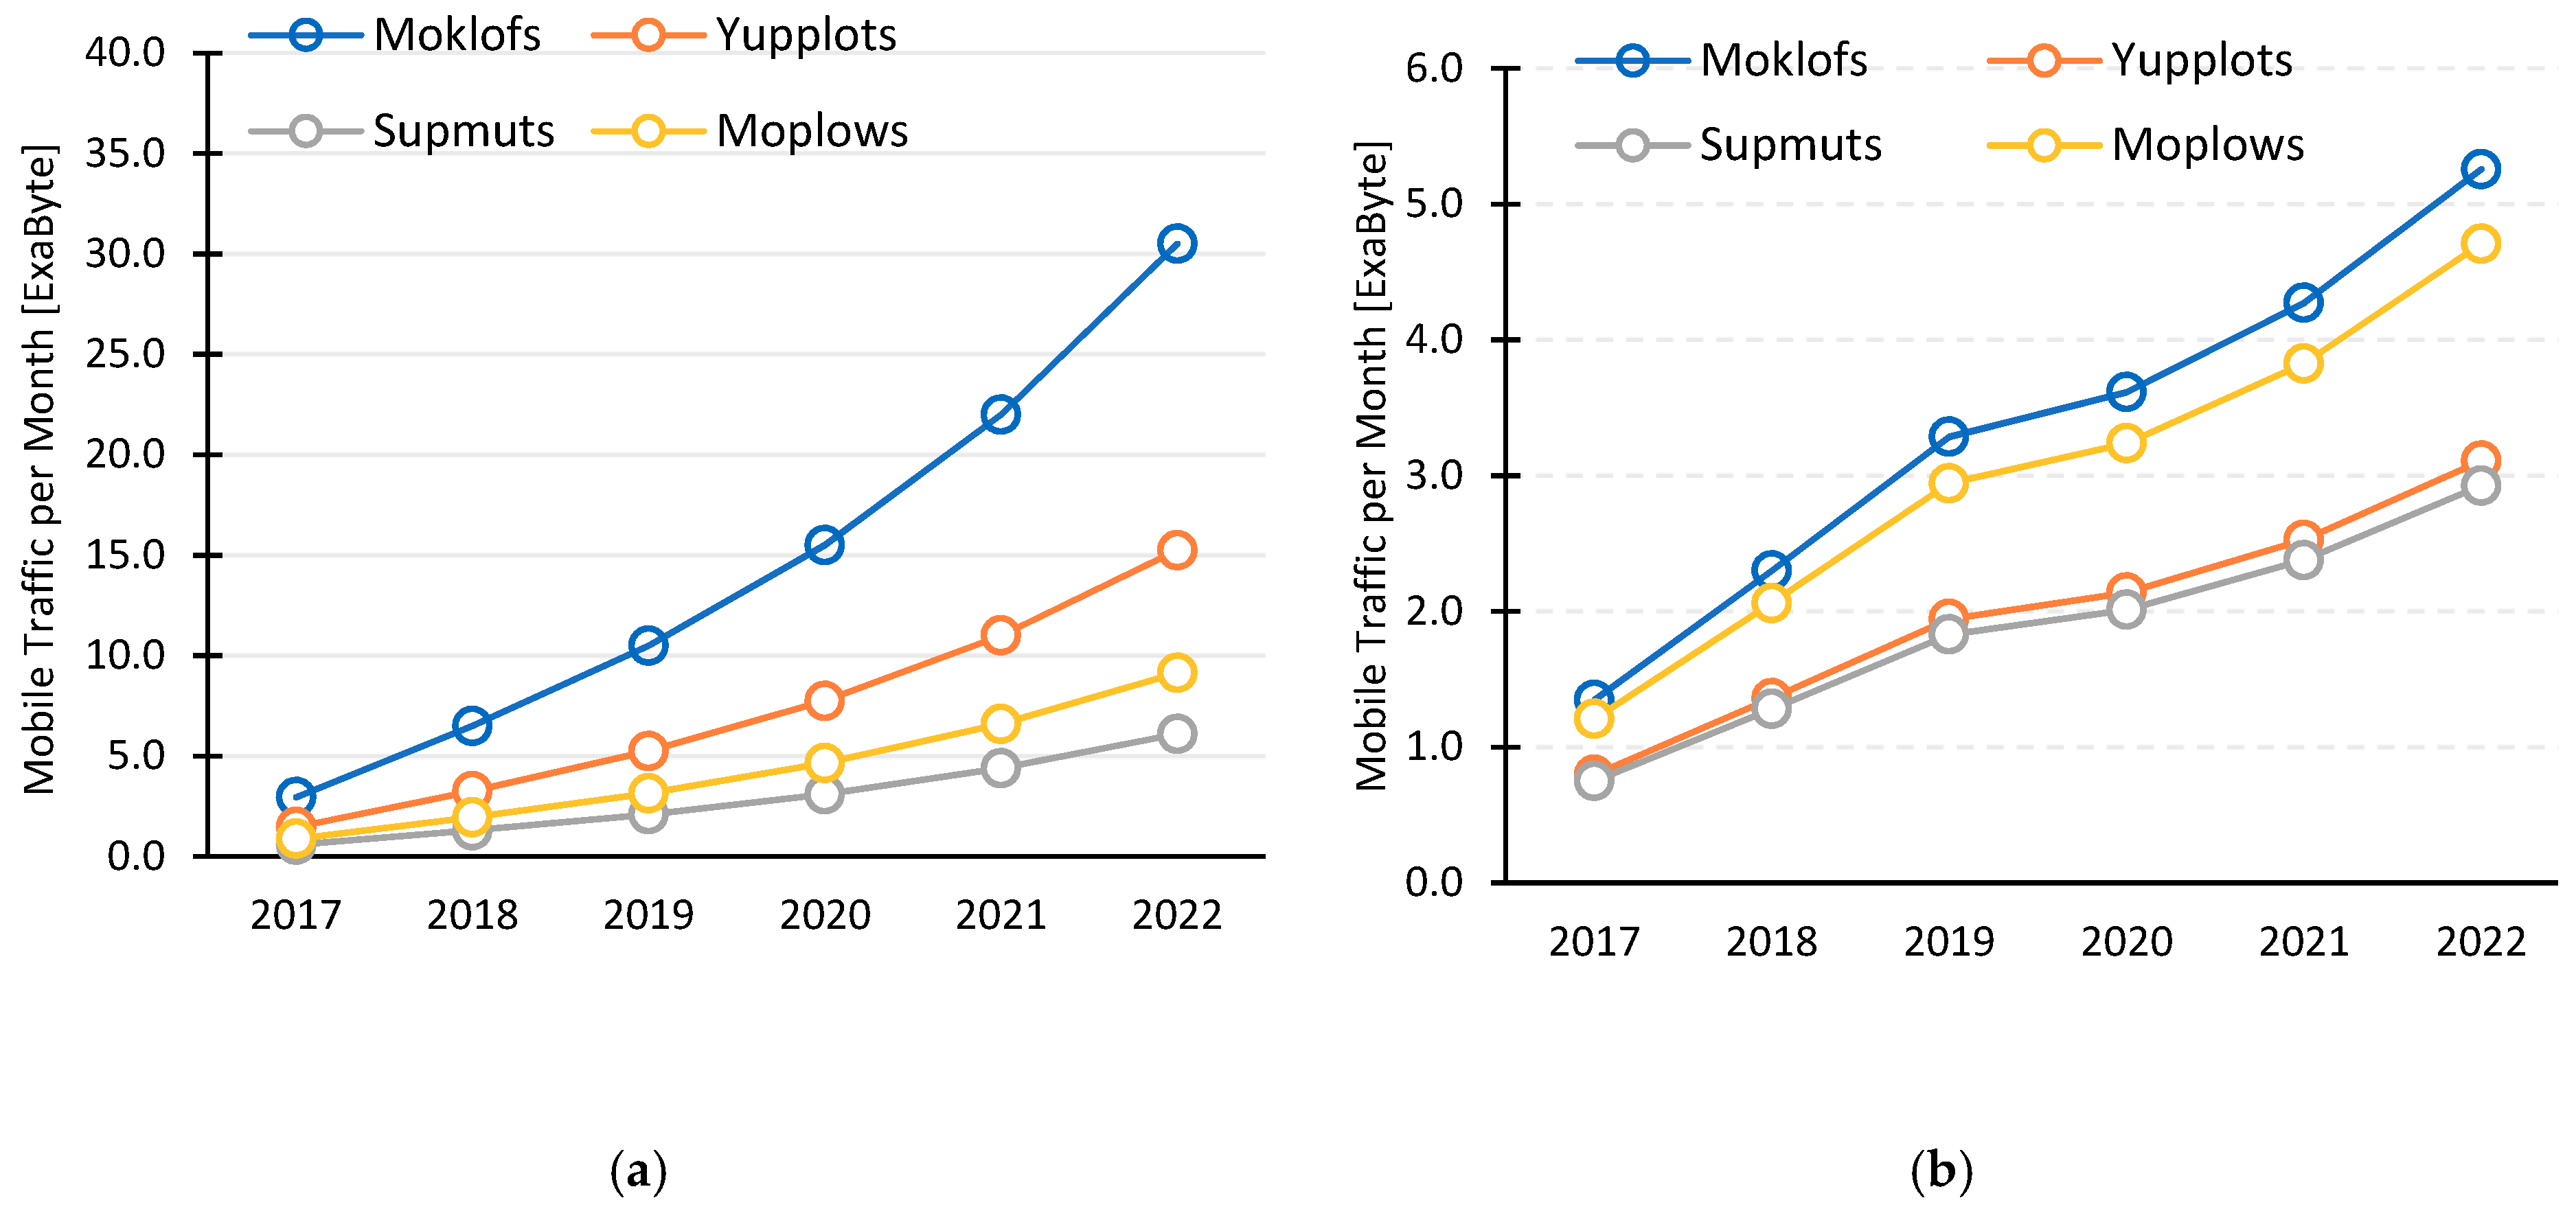
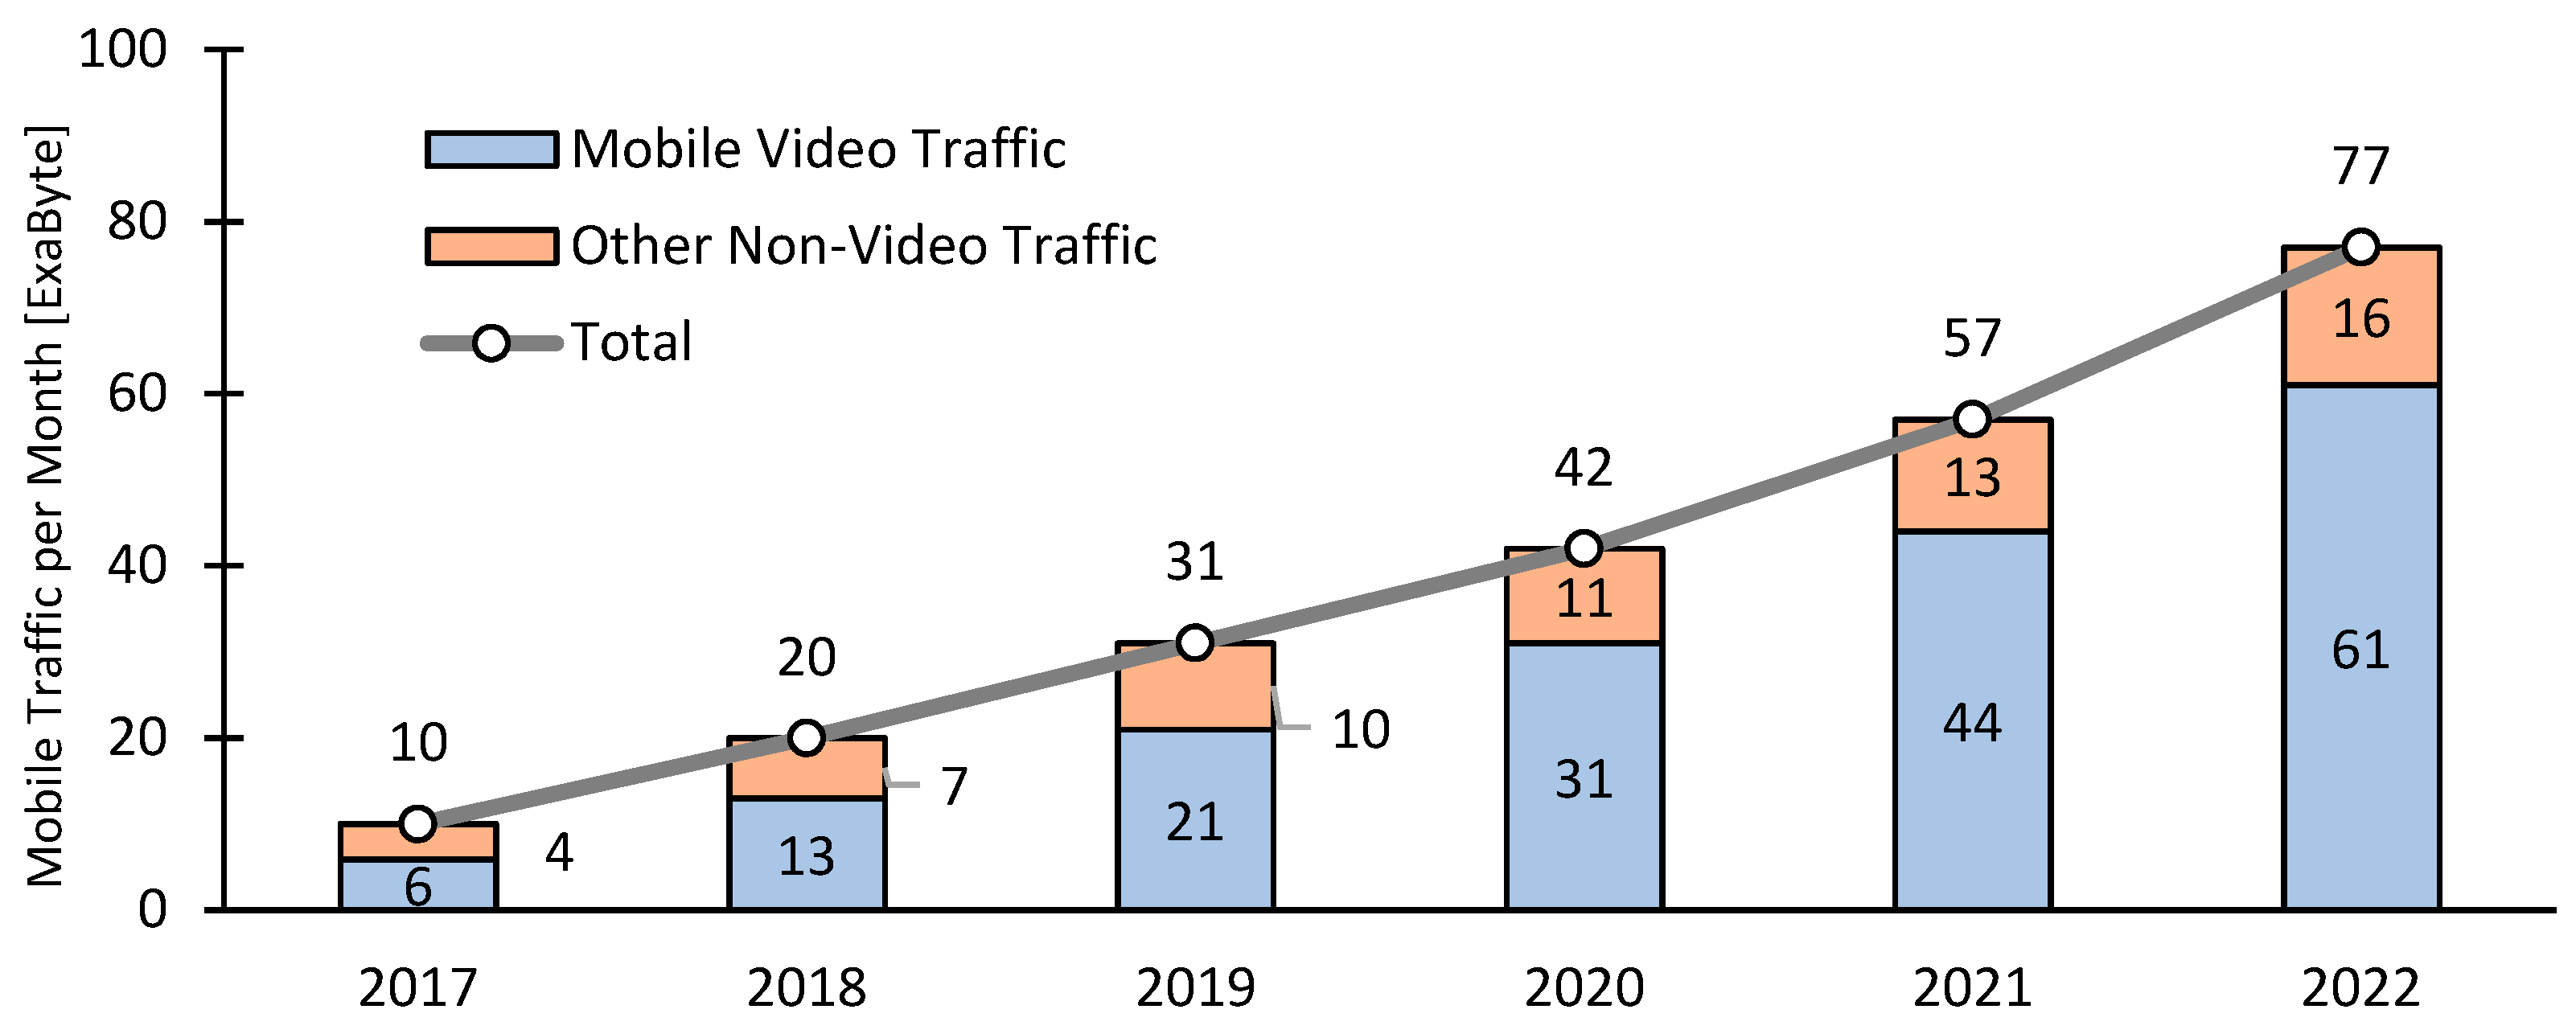
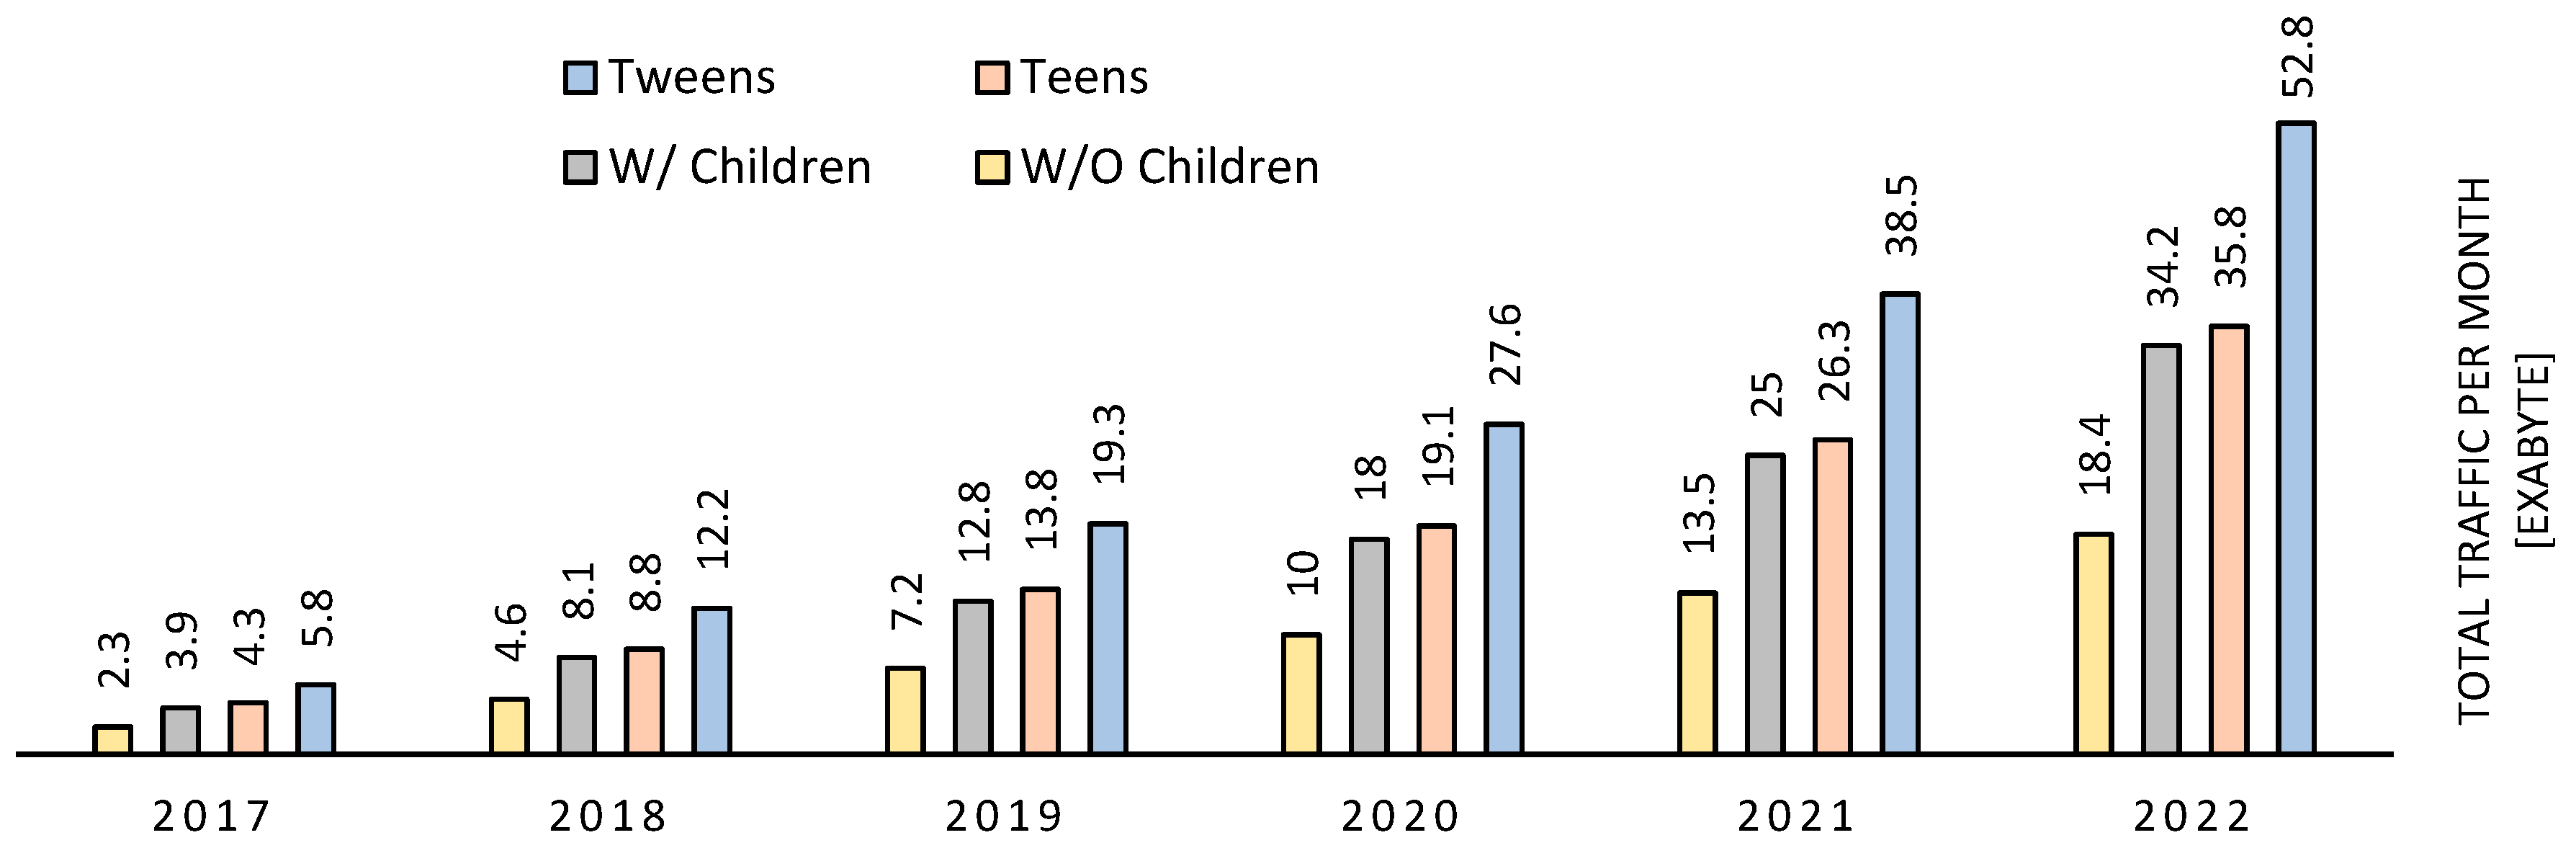
K to only two service classes. In order to evaluate if the new clusters have impact on overall traffic capacity and demand, we begin by presenting a 6 year evolution of mobile traffic, starting in 2017 and forecasting up to 2022, as depicted in
Figure 9 [
24,
27]. We focus solely on two service categories, only to show the impact of the four previous clusters versus the six new clusters resulting from the advanced behavior clustering process. Those two categories are represented in
Table 4. It can be seen from
Figure 9 that mobile video traffic is the service that has been increasing the most and is expected to continue, which is why for simplification we used only two categories.
A probability matrix was defined representing the probability of each segment using one of the services, considering that, in this case, the number of user segments L has increased from four to six.
The sum of each cluster impact applied to its corresponding service should equal one, according to . In this case, max(L) = 6 and max(M) = 1. We then assumed the following probability distribution of the services per user segments, with the additional two clusters derived from the existing ones:
The assumptions made are the following when comparing tweens with Moklofs (mobile kids with lots of friends):
Tweens use less than 50% of social networking;
Tweens spend more than 5% of the time playing games;
Tweens spend more than 30% of the time watching mobile videos;
Tweens are trend less in terms of using voice over IP (VoIP), mobile commerce and banking, as well as machine-to-machine (M2M) services.
Regarding Yupplots without children and with children, the following assumptions were made:
The usage of mobile video increases twofold when children use the device (main usage);
All other services practically remain the same;
Video streaming is the predominant change.
Such assumptions are supported by existing studies referred to throughout this work. Nevertheless, the impact model, which is not the subject of this work, is flexible enough to accommodate any change in behavior, as detailed in [
2].
Finally, with the existing probability distribution of the services and using the traffic per month values from
Figure 9, resulting in a traffic vector
T, one can calculate the overall impact (amount of generated compound traffic,
TC), resulting in a quantification of overall video traffic and non-video traffic generation per behavioral cluster.
where in this case
y = 2017 and
Y = 2022. This way, it is possible to calculate the total traffic (video and non-video) that each of the clusters generate based on their behavioral characteristics, as presented in the next section.
6. Results
This section presents the results from applying both advanced behavior clustering on the clusters derived as explained in the last section, as well as the impact that such new clusters have from traffic generation’s behavioral perspective. As seen earlier, on the basis of the information presented, two new behavioral clusters should be expected to extend from the initial four. Moklofs (mobile kids with lots of friends) [
2] were split, and instead of considering solely teenagers, tweens were also considered, in accordance to
Table 1. This section focuses only upon these two additional clusters versus the original ones, as the objective is to show the advantages of performing advanced clustering, which, in our case, applies only to two of the original four clusters. Yupplots (young parents with lack of time) were also split into two different behavioral clusters.
The Yupplots cluster without children maintained the impact levels as previously discussed [
2], but for the new cluster it was necessary to break down the capacity into two: directly generated, that is, by the parents, and indirectly generated, that is, by children, whether the child is a toddler or a preschooler.
Considering that such service is the one that relates more to the behavior of the new clusters, it appears to be adequate to use it in order to evaluate the impact of considering both a new cluster and splitting the Yupplots cluster.
Figure 10a presents the breakdown of evolution of traffic for the four original clusters in what concerns mobile video traffic when applying the cluster characteristics to the data from
Figure 9.
It can be seen that Moklofs and Yupplots are the behavioral clusters with the highest level of traffic usage.
Figure 10b shows exactly the same breakdown but for the second category of services (non-video traffic).
Figure 11 presents the video and non-video traffic generated per month for each of the four original behavior clusters. It can be seen that by 2017 video traffic was not that much higher than non-video traffic. Nevertheless, as the time goes by, and especially considering 5G, the expectation is that by 2022 mobile video accounts for 79% of all traffic per month and non-video will account for 21%. By 2017, video traffic represented 59% of the whole mobile traffic generated per month and 41% represented the sum of all remaining services.
Up to this point, it has been shown that mobile video is the prevalent service on all four behavioral clusters, as it was concluded in [
2]. It was shown also that such traffic will increase significantly over the next few years, especially fueled by 5G and behavioral changes on subscribers. From that perspective, we have applied the impact methodology developed in [
2] to two new clusters resulting from this work (refer also to
Figure 10):
- -
The Moklofs cluster was split into two behavioral segments, one which represents teenagers in general and the other a new cluster focused solely on tweens.
- -
The Yupplots cluster was split into two behavioral segments, one which consists of young parents without children, and a new one, which mimics the behavior of young parents that have children and whose traffic consumption behavior changes accordingly.
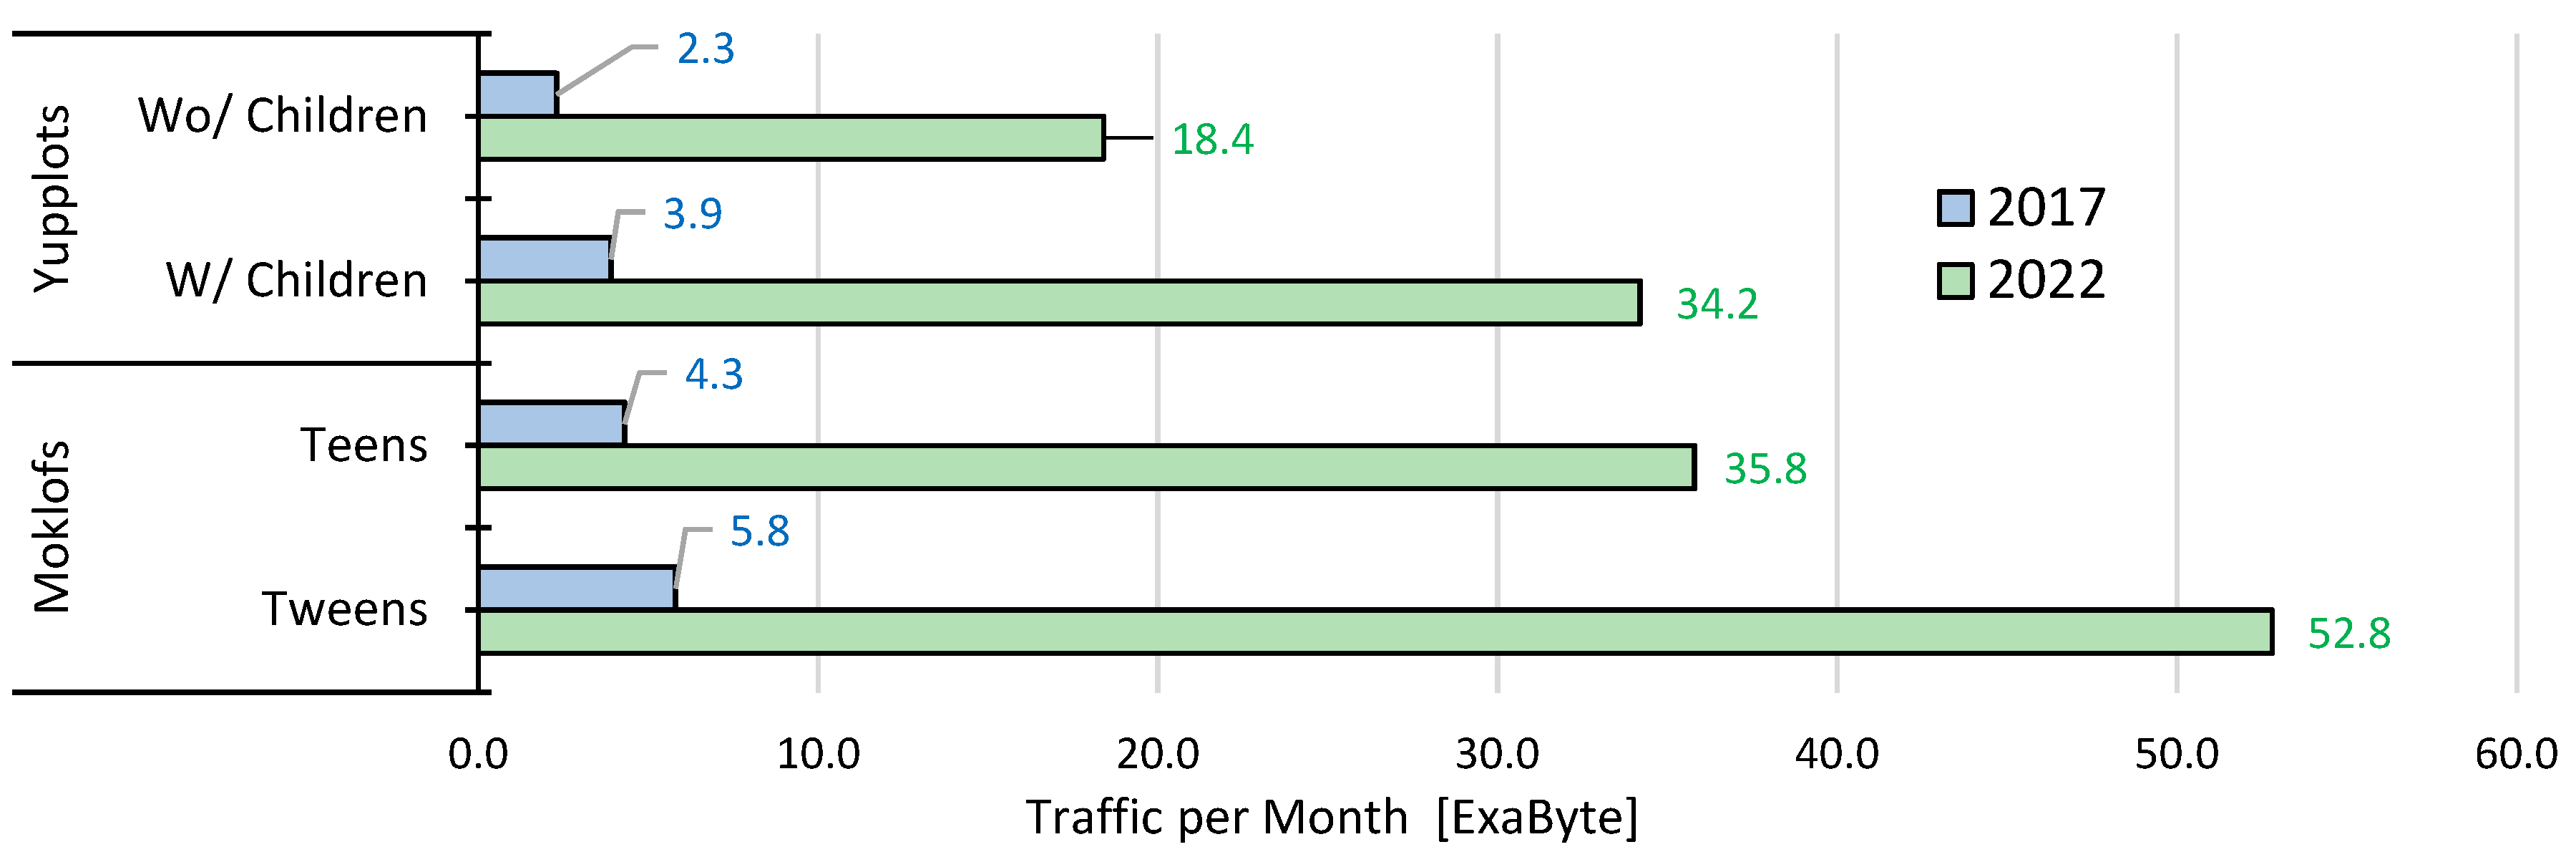
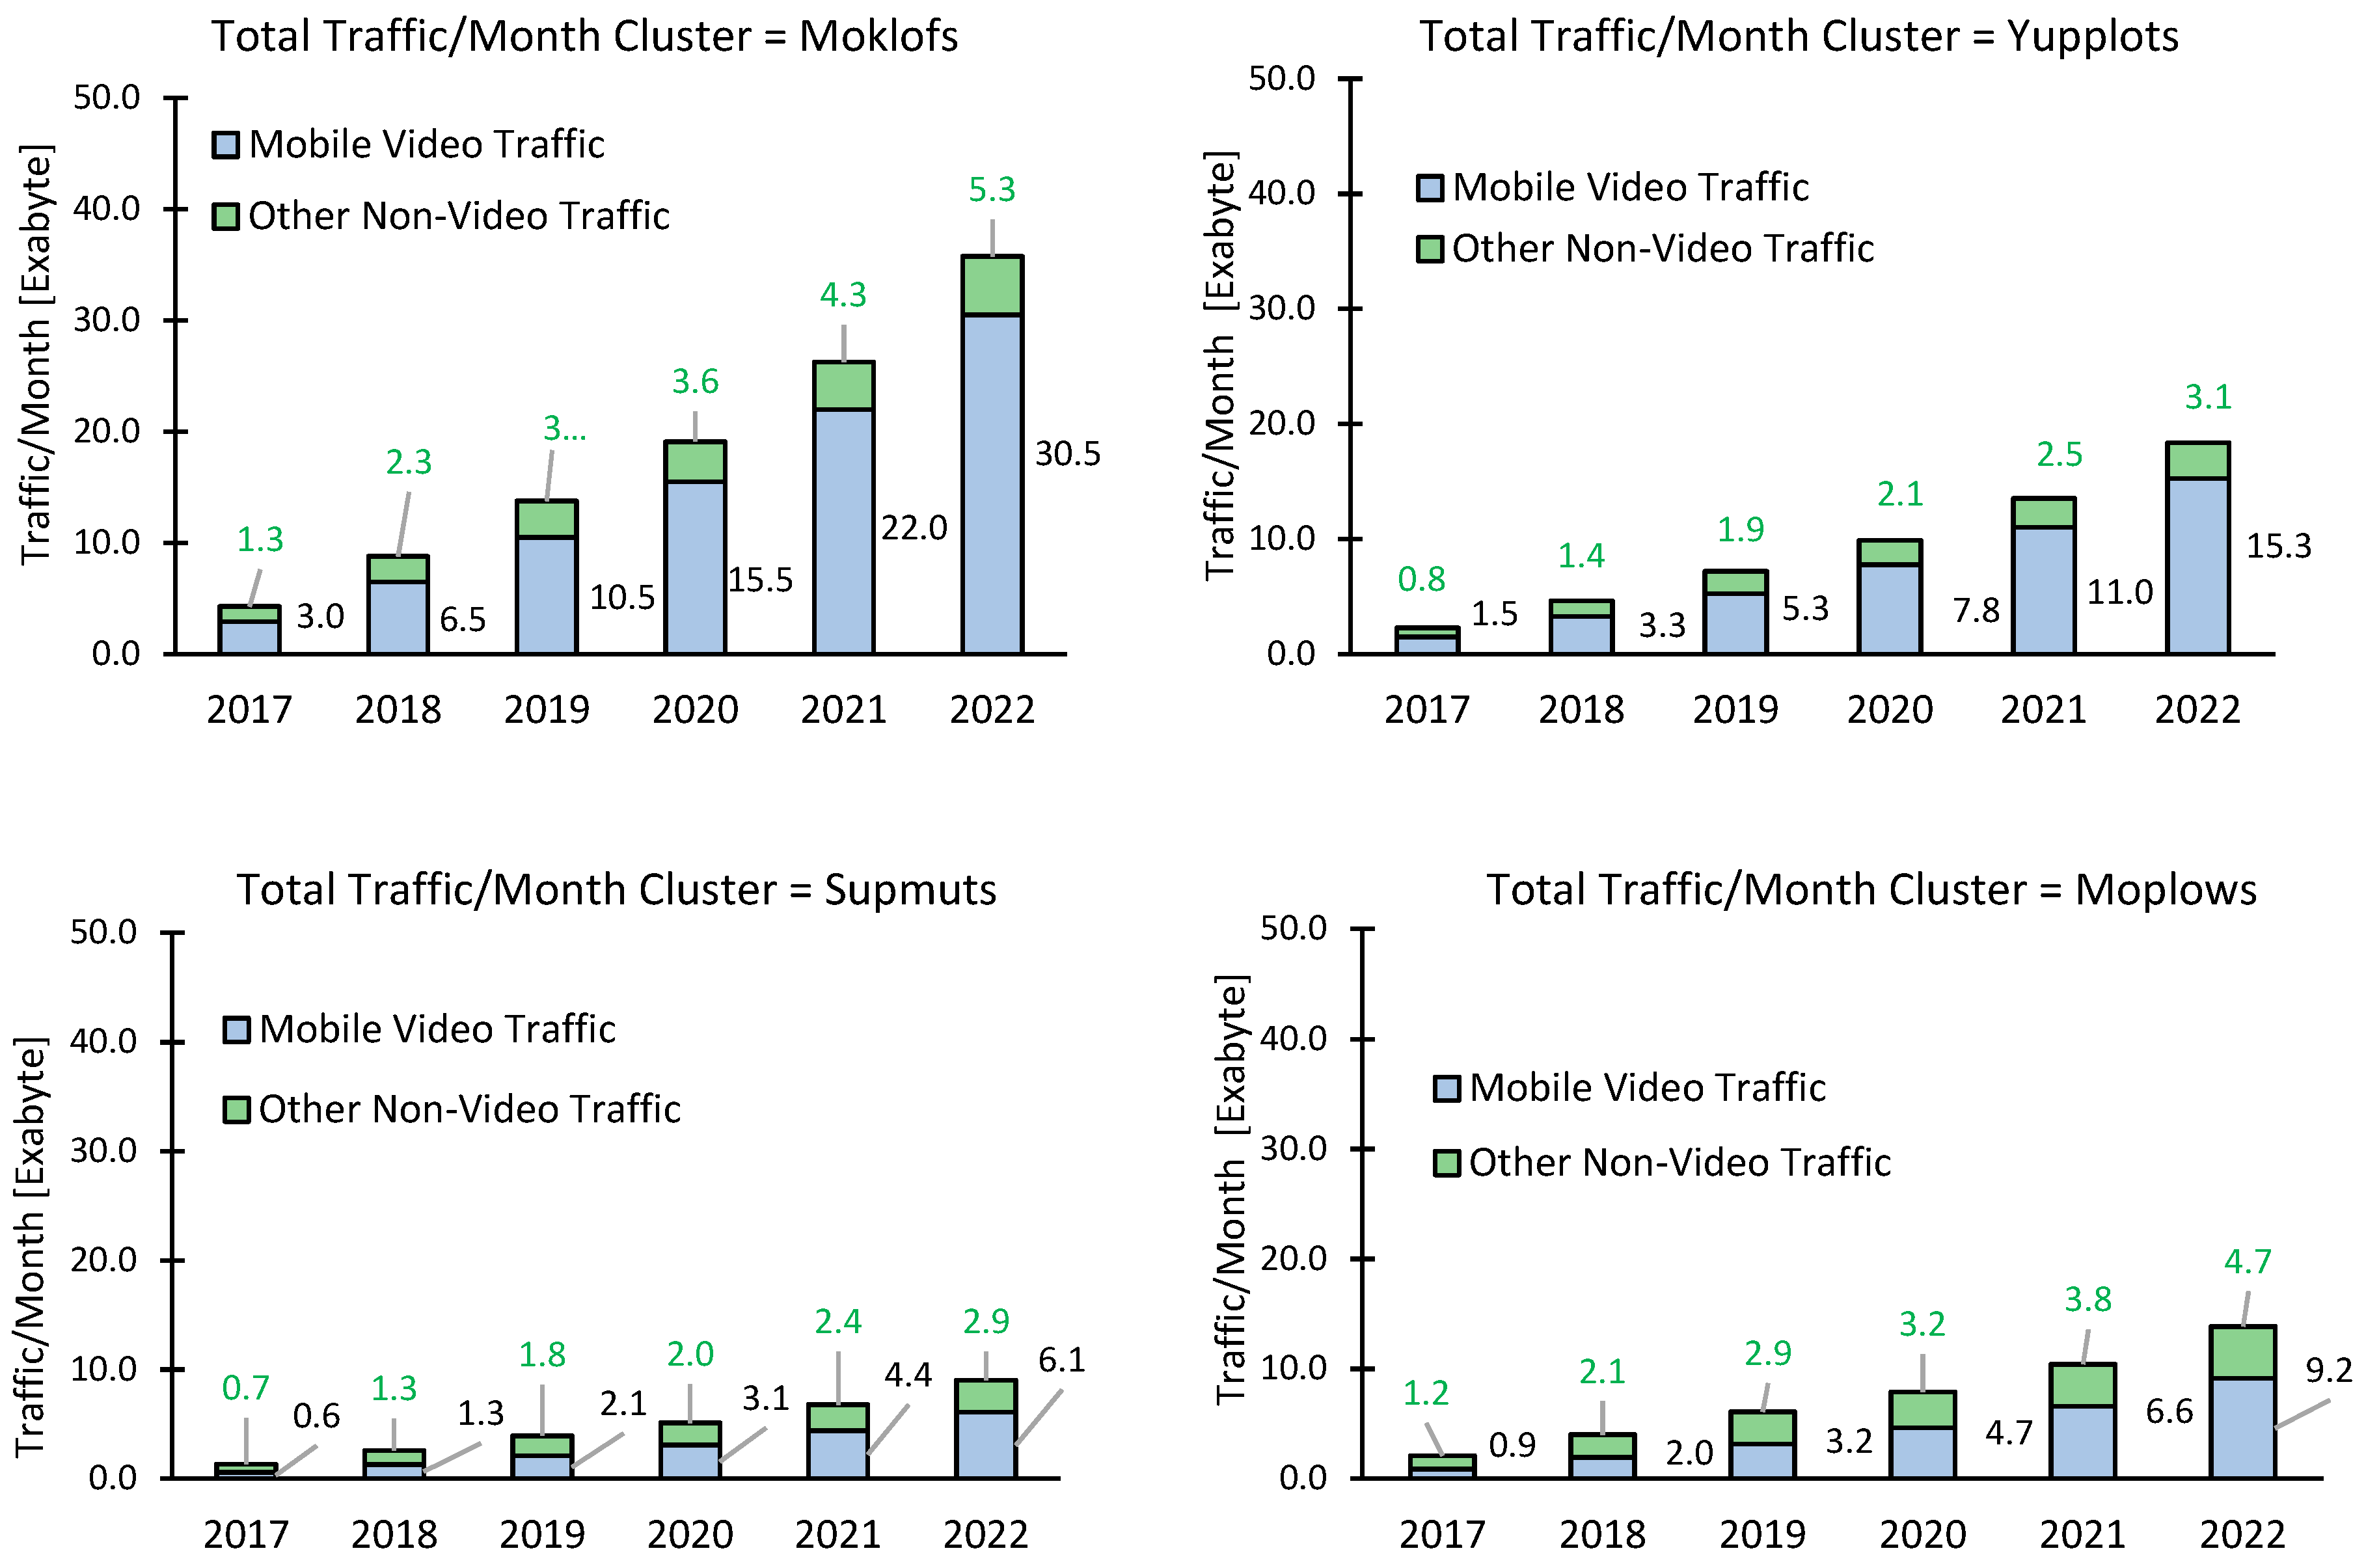
Figure 12 shows the results in terms of traffic generation when considering the new clusters by 2022. It can be seen that there was an increase in traffic generation for the parents that have children, considering that there was a behavior change as previously presented in
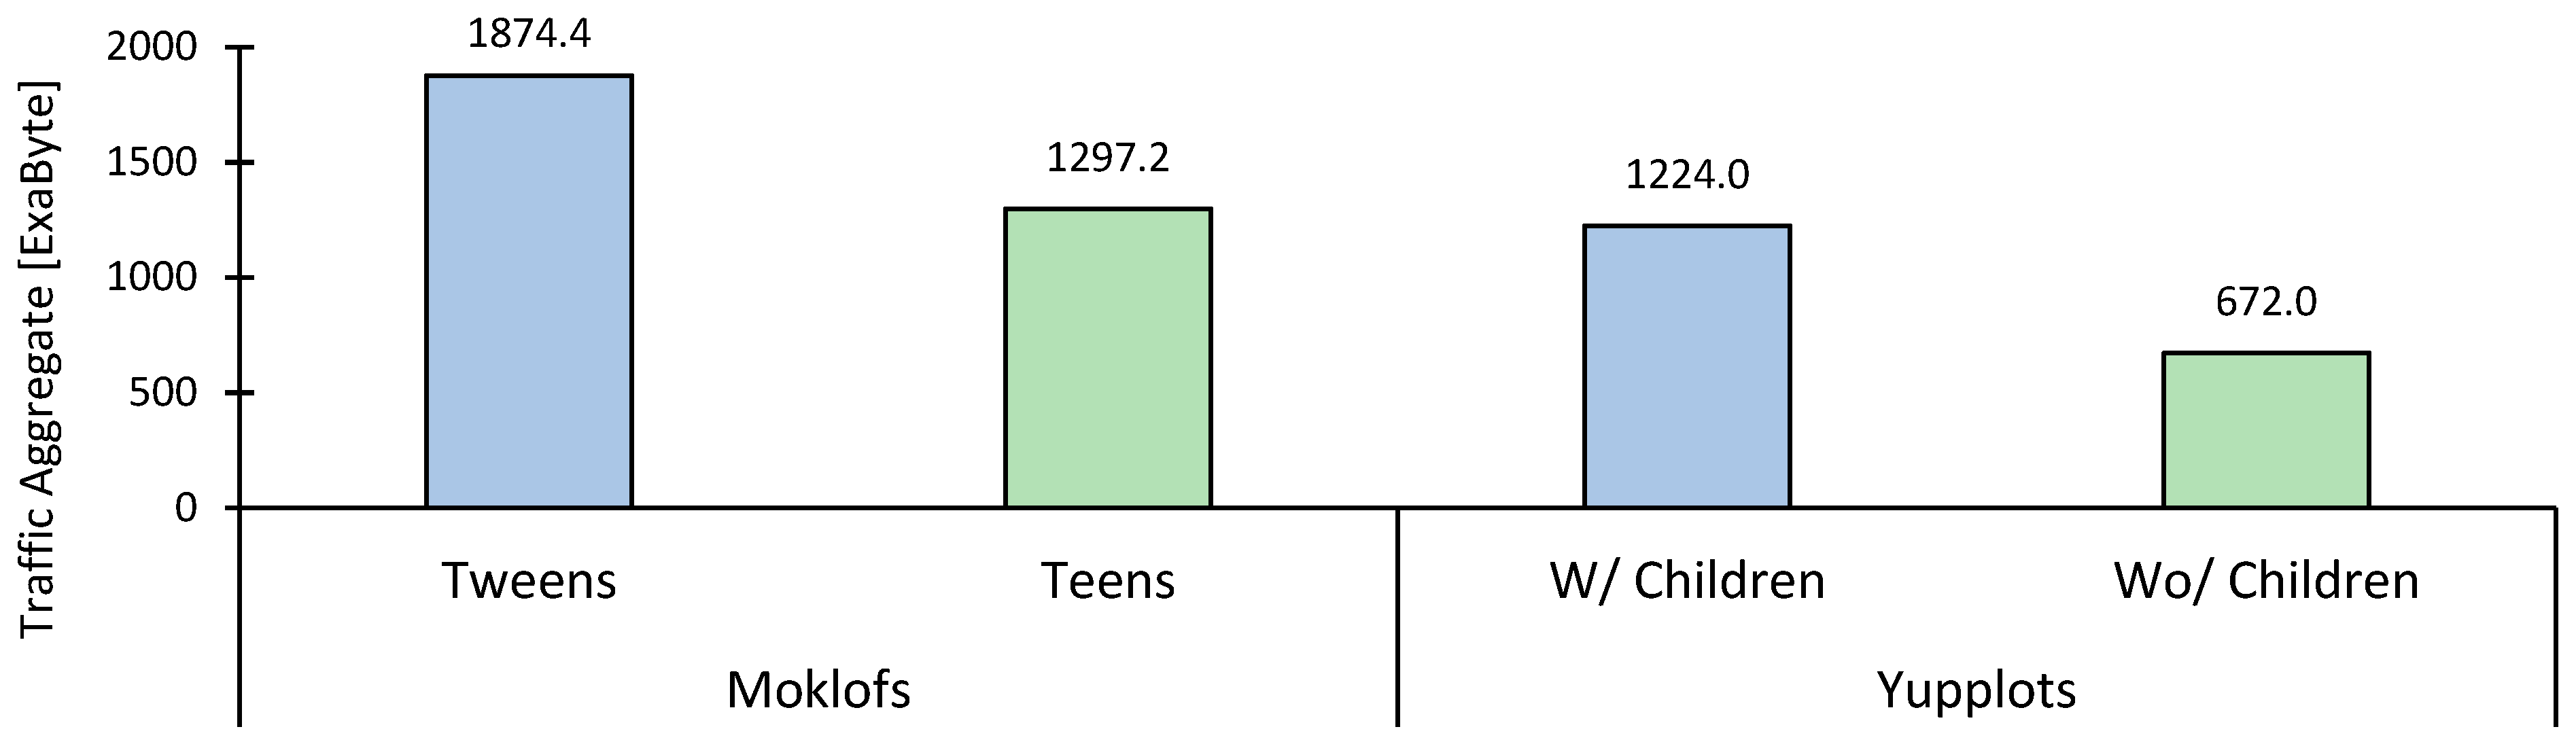
Section 5, leading to additional usage of video streaming. Regarding tweens, the new cluster, it can be seen that, at such ages, video consumption is higher, whereas social networking (within other services) does not represent much of a traffic increase. Thus, by 2022, tweens are expected to generate 148% more traffic than teens, and Yupplots with children using their devices will represent a traffic increase of 186% compared to normal Yupplots’ behavioral patterns.
Figure 12 presents the traffic per month by 2017. It can be seen that, curiously, Yupplots behavior changes due to child usage of smart devices for video streaming, which brings this cluster closer to a behavior typical of teens.
In fact, this aspect is also shown in
Figure 13. This is one of the conclusions that can be drawn after applying advanced clustering when the two initial clusters have been divided and looked at more closely.
Nevertheless, by 2017, traffic generated by tweens represented 135% more than that generated by teens. As for Yupplots, when children are given smart devices, this cluster behavior transforms and increases traffic consumption by 172% compared with normal behavfior.
Figure 14 presents an interesting result. It can be seen that by 2022, according to the estimates, if an MNO would consider solely teens and Yupplots as simple clusters, the total amount of expected traffic would be nearly 1970 Exabyte. Nevertheless, the tweens cluster and also the behavior changes of Yupplots when children start to use their devices must be considered. In such cases, without the detailed analytics and advanced clustering, the MNO would expect an aggregate traffic of 1970 Exabyte, disregarding and overlooking an additional 3100 Exabyte of approximate generated traffic. On the other hand, by performing the proposed advanced clustering, an MNO should have the notion that there are two additional specific clusters and thus it should plan its network to sustain a total of 5067 Exabyte in a time span of 5 years. Thus, a MNO who was able to perform advanced clustering, such as the proposed approach versus one that would stand with only four clusters, would know that in 5 years’ time, span traffic increase due to new behavior clusters would represent an increase of 157% and could therein prepare its network planning and resource management accordingly, representing a competitive advantage over others.
This example clearly shows the advantage of bridging advanced subscriber analytics, and
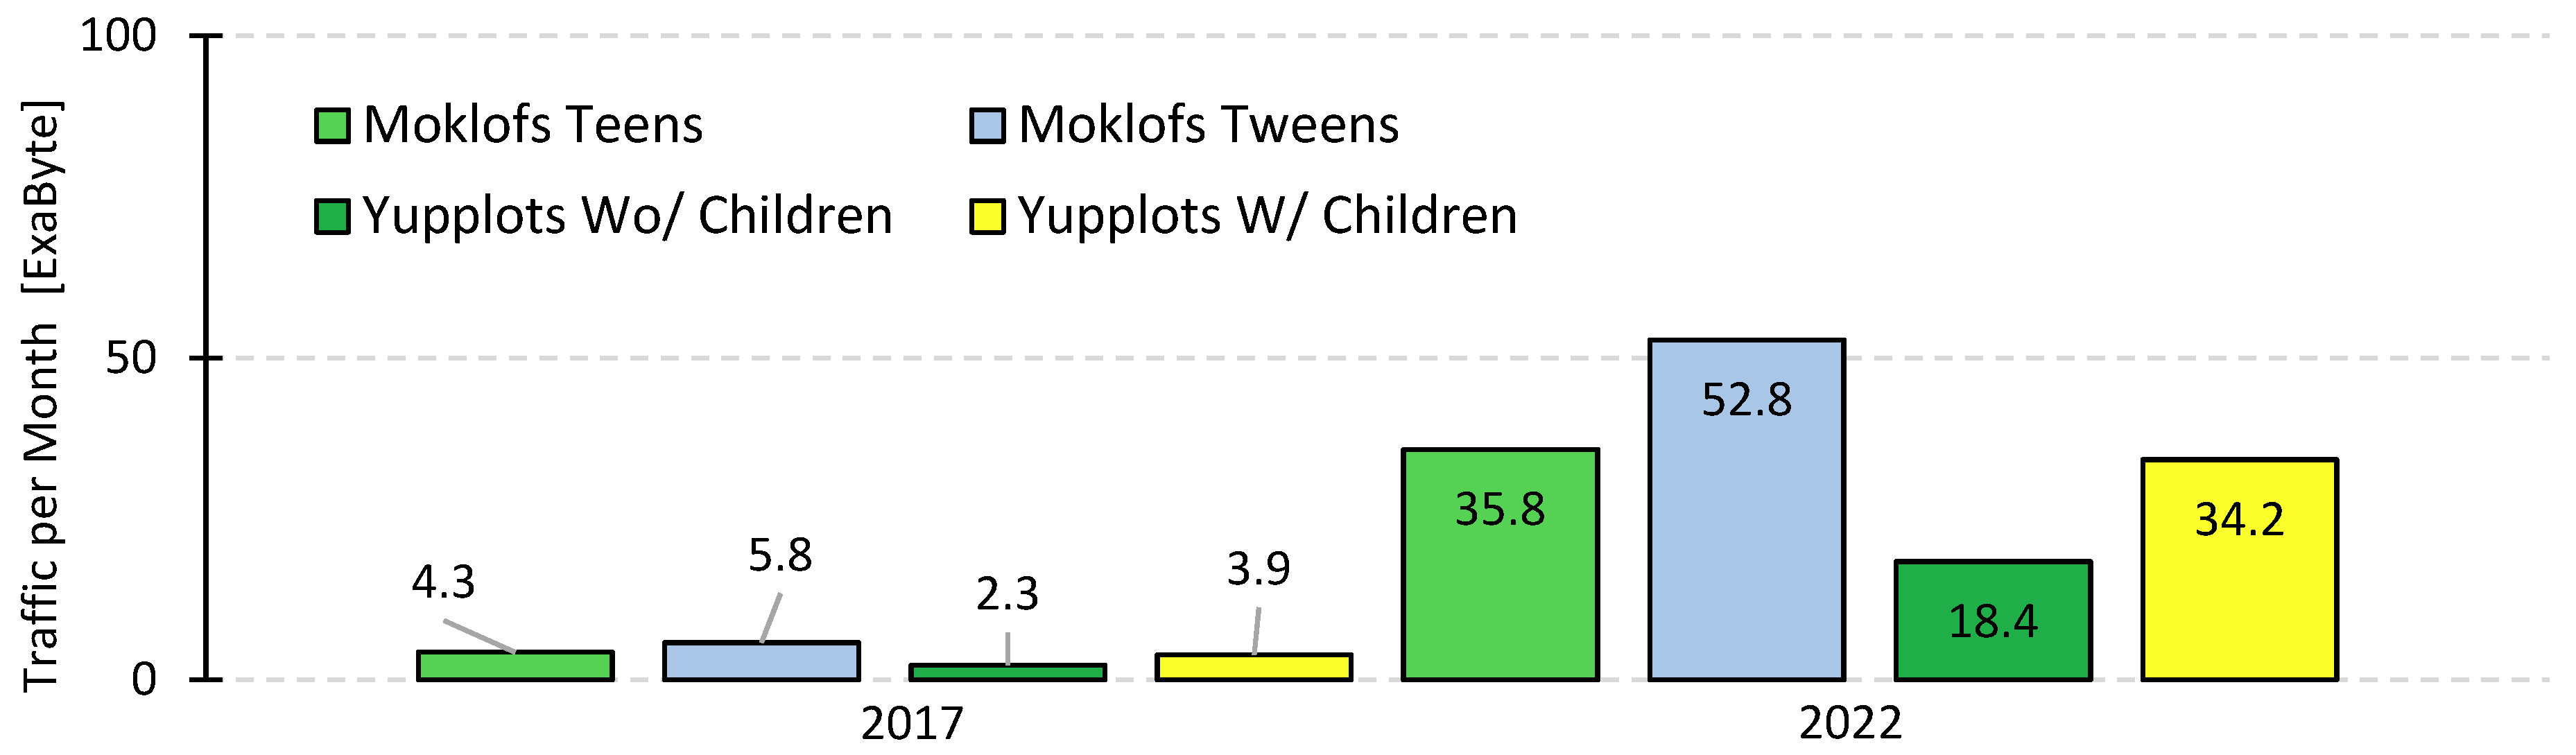
Figure 15 presents the comparison of traffic per month generated by each behavioral cluster when considering 2017 versus 2022. It can be seen that by 2017, a more uniform traffic amount was present among clusters, mainly due to the fact that mobile video streaming was more paired with all other services. However, when considering 2022, the behavioral change of subscriber clusters indicate that traffic per month is expected to grow unprecedentedly, especially within the clusters that mostly use mobile video as the main service, that is, Tweens, Teens, and Yupplots with children, which represent a behavior change that bring them closer to teen traffic patterns.
Figure 15 presents the average monthly traffic per month for all four segments that resulted from splitting the original two.
As previously mentioned, the results of applying the advanced clustering techniques referenced in the first sections of this work lead to extend the existing four segments from [
2] to a total of six segments.
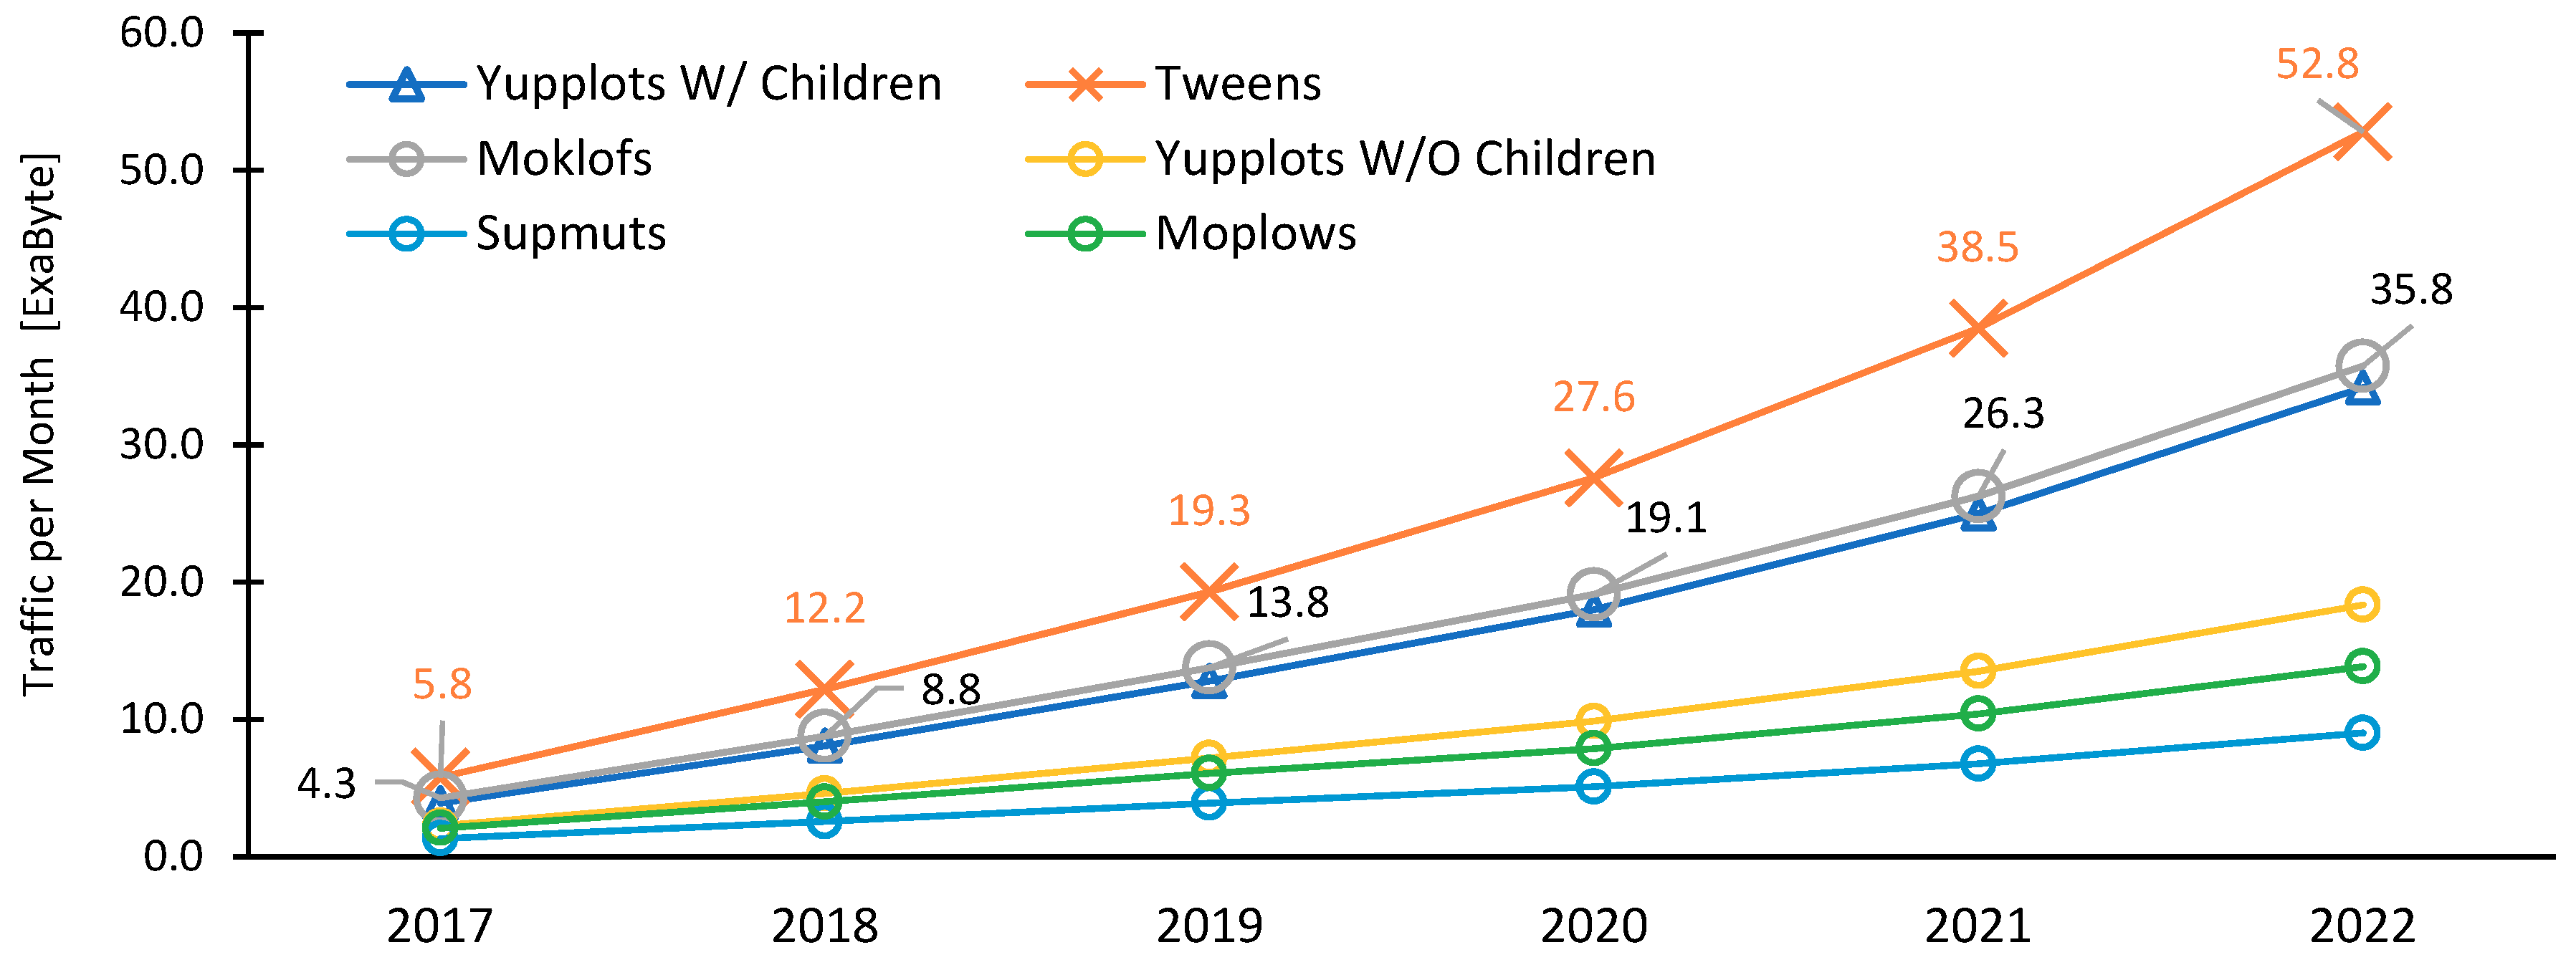
Figure 16 shows the overall traffic impact that each of the six behavioral clusters represent. It can be seen that the two new segments resulting from this work are part of the top three segments with highest traffic generation. As so, segments very relevant to traffic generation are now considered after advanced clustering has been performed.
Finally, in a direct comparison between the traffic per month generated by the four clusters and six clusters,
Figure 17 shows that the new clusters resulting from advanced clustering should not be ignored, that is, the cluster formed by tweens and the one by the behavior of parents when letting their children use smart devices. Their sum, as depicted, from 2017 to 2019 represents almost the same traffic generation as the four initial clusters. However, from 2020 onwards, these two segments will surpass the traffic generated by the original four clusters and, therefore, should be considered and focused upon in depth. As previously mentioned, the end user device will play a very crucial role in future networks, not only 5G, but also beyond, becoming the main source of traffic generation and consumption.
With higher cellular network capacity, higher data rates, and more capable and performant smartphones, we can imagine that the majority of services will be provided by the handheld device, thus representing an unprecedented traffic generation in cellular networks. It is, therefore, of utmost importance to further develop advanced analytics over subscriber data, with important conclusions potentially appearing as the ones presented in this paper—the need to consider a new cluster of subscribers and also the discovery of a behavior change that was only possible to identify by using such techniques.
7. Conclusions
In this paper, our main contribution is twofold: first, we demonstrated the advantage of applying subscriber-centric clustering based on behavior, both to capacity network planning process and resource management. We also focused on the advantages of applying several types of clustering.
Next, our second main contribution was the definition and characterization of a new subscriber cluster comprising subscribers aged from 0 to 12 years old—extending previous work clusters—who are increasingly using tablets and smartphones to access high capacity-demanding services such as video streaming and online cooperative gaming. The other part of the second contribution was that by using different clustering based on behavior, we could demonstrate that one cluster needed to be split into two different clusters, precisely due to behavioral change—parents that have children and let them use their smart devices represent a pattern change in traffic consumption and, therefore, must be considered for analysis.
We showed that tweens and older preschoolers are avid consumers of high data rate services over smartphones, and thus should be considered as a relevant subscriber cluster from an MNO perspective. This comes as normal nowadays. Nevertheless, additionally, in terms of capacity planning, it was demonstrated that toddlers and young preschoolers constitute an indirect cluster of high demand subscribers, hidden by the fact that parents’ smartphones are mainly used, although some have their own devices at very young ages. Nevertheless, for a cluster of parents that are not identified as having data-hungry behaviors, the fact that having children may unbalance the clustering process results in a different cluster. This shows clearly one aspect that is of utmost importance for MNOs—knowing your customer. In fact, one of the major pitfalls in this approach will materialize if MNOs do not have proper and sufficient quality information or data from their subscribers. As we have shown, and such can be seen as proof of the importance of quality data, simply by overlooking the fact that young parents might share their devices with their children makes a large difference and, thus, a new behavioral class appears, one that was being overlooked. Herein, proper data and information are paramount, especially when considering applying methodologies such as data mining, or even artificial intelligence (e.g., artificial neural networks) to detect and predict behavioral anomalies and, possibly, new clusters of analysis. If data are not sufficient or properly treated, MNO’s approaches to network and capacity planning might not be realistic. As such, although it was not the objective of this work to address data quality, in order for results to be reliable and fit for feeding to the impact model, we minimized that issue by using proper and valid data from known sources, as referenced throughout the work. Nevertheless, MNOs should take into consideration that proper data preparation and handling should be performed in order to have a workable, valid, and quality dataset.
It was shown that there are relevant advantages of having the subscribers segmented into clusters using behavioral parameters as variables—it allows for a more effective process of cellular planning while giving the ability, especially in 5G dense networks for MNOs, to adapt their capacity and planning strategies more frequently, as well as enhance resource management. As an example, just by knowing that there is a cluster of subscribers who have been parents lately might be enough to expect an increase in capacity demand.
We also contributed by focusing on age groups that usually are not considered for subjects regarding cellular capacity and planning. Typically, only subjects older than 18 years of age are considered because they are old enough to be allowed in a survey, which is the most common process used to gather behavioral information. Although teenagers are often also considered through online surveys, there is a gap, which we have discussed, ranging from very young ages to pre-teenagers. The reality shows that global overall cellular service consumption and, thereafter, capacity demand starts at very young ages, sometimes under one year old. Finally, we contributed to the extension of previous work by introducing two clusters that have not been focused upon previously from cellular planning and resource management perspectives, also introducing such new cluster groups to the impact scoring methodology used before in order to evaluate overall network impact over capacity towards traffic generation [
2]. The results showed that tweens should definitely be considered, especially by 2022, in a high-capacity driven network, and they also uncovered a behavior change in one of the Yupplots clusters due to the fact that children are given their parents’ smart devices, indirectly changing traffic consumption patterns. Clearly it was shown that, when giving their children smart devices, the Yupplots’ traffic pattern changes, becoming closer to the traffic and behavioral pattern of teens.
Our work showed that subscriber clustering should be considered one of the most important analysis vectors when considering network and capacity planning, especially in high-density and high capacity such as 5G and beyond. This kind of technique is of utmost importance to MNOs, and we have argued that advanced clustering and analytics should the thoroughly performed prior to any service introduction, also on the network planning phase, as well as during full production, in order to maximize resource management, according to the ever-changing behavior of subscribers. The present work can be applied generically to any user in the world, on a national level or cross-border, depending, once again, on the existence of data about the subscribers. The approach is not dependent on any specific geography or demographic information. As long as there is a national, European or any other kind of dataset regarding subscribers, behavioral features might be extracted, and MNOs can start applying clustering techniques and advanced analytics in order to evaluate possible advantages of such approaches.
This is one of the actual limitations of the current work, which is in having a proper and recent dataset to work with. Future work will focus on finding the right dataset, which will allow taking this approach one step further by enabling applying mechanisms such as data mining, artificial intelligence, and deep learning to the new behavioral clusters in order to enhance overall resource management and capacity planning, as well as end users’ quality of experience.


