Article

5G Base Station Deployment Perspectives in Millimeter Wave Frequencies Using Meta-Heuristic Algorithms

1
School of Electronics and Information Engineering, Huazhong University of Science and Technology, Wuhan 430074, China
2
School of Systems and Enterprises, Stevens Institute of Technology, Hoboken, NJ 07030, USA
3
School of Computer Science and Electronic Engineering, Hunan University, Changsha 410082, China
*
Author to whom correspondence should be addressed.
Electronics 2019, 8(11), 1318; https://doi.org/10.3390/electronics8111318
Submission received: 20 September 2019 / Revised: 24 October 2019 / Accepted: 6 November 2019 / Published: 8 November 2019
(This article belongs to the Section Microwave and Wireless Communications)

Abstract

:
It can be predicted that the infrastructure of the existing wireless networks will not fill the requirement of the fifth generation (5G) wireless network due to the high data rates and a large number of expected traffic. Thus, a novel deployment method is crucial to satisfy 5G features. Meta-heuristic is expected to be a promising method for the complex deployment optimization problem of the 5G network. This work presents an implementation of a meta-heuristic algorithm based on swarm intelligence, to minimize the number of base stations (BSs) and optimize their placements in millimeter wave (mmWave) frequencies (e.g., 28 GHz and 38 GHz) in the context of the 5G network while satisfying user data rates requirement. Then, an iterative method is applied to remove redundant BSs. We formulate an optimization problem that takes into account multiple 5G network deployment scenarios. Further, a comparative study is conducted with the well-known simulated annealing (SA) using Monte Carlo simulations to assess the performance of the developed model. In our simulation results, we divide the region of interest into two subareas with different user distributions for different network scenarios while considering the intercell interference. The results demonstrate that the proposed approach has better network coverage with low percentage users in outage. In addition, the developed approach has less computational times to reach the desired target network quality of service (QoS).

1. Introduction

5G is the next generation of wireless and mobile network, capable of ultra-fast data speeds, and low latency [1]. Therefore, one can predict that the number of interconnected wireless devices of 5G will be high due to the large amount of data traffic that will be generated between a large wireless communications infrastructures [2]. Thus, there is a need for creating a new capacity through the use of new frequency band, and the improvement of cell deployment. However, the advanced antenna techniques that are being introduced with 5G new radio has motivated the usage mmWave carrier frequencies. MmWave offers a large amount of available unlicensed spectrum that supposed to be a suitable frequency band for the 5G network [3]. There are several motivations to use mmWave frequencies in the 5G network such as the security and privacy due to the limited transmission range of mmWave, and the same frequency can be reused in a very short distance. Therefore, the study on channel model for frequencies from 0.5 to 100 GHz of 3GPP TR 38.901 evaluated the distance between base station (BS) and user for urban micro-cells (UMi) street canyon and urban macro-cells (UMa) scenarios. For BS antenna height of 10 m and 25 m for UMi and Uma, respectively, the distance is 10 m and 35 m for UMi and Uma, respectively [4]. Thus, these very short distances allow better frequency reuse within a dense network coverage area. The usage of high frequencies is expected to be one of the key 5G technology enabling very high data rates and significant increases in capacity. The spectrum at 28 GHz and 38 GHz are still unexploited and have negligible atmospheric gases attenuation as compared to others high-frequency ranges according to International Telecommunication Union (ITU) L-series recommendations. 5G new radio deployments will require ultra-dense network topologies with the usage of high frequencies, which required many new cells, resulting in additional potential deployment challenges. Consequently, where and when to deploy cells while satisfying user data rates requirement will be challenging. To help assess this deployment challenge, the new approach of network planning is needed to meet the demand of 5G networks and beyond. Network planning is vital in order to deploy 5G networks efficiently, it is considered to be a promising solution to satisfy the user data rates requirement in 5G network [5], it depends on various parameters such as geographical area, cells configuration parameters, estimated number of users, estimated number of cells, path loss and propagation models, and frequency reuse patterns [6]. In the proposed model, UMa are deployed for large coverage, and smaller cells called UMi are integrated with UMa to form heterogeneous networks. Since the UMa cannot provide in-depth coverage for indoor users, UMi covers large indoor users, reduces latency, offers higher capacity, and increases the active resources, making users closer to the BS. Consequently, dense deployment of UMi for the hotspot scenario may result in a waste of network resources, while less deployment in this area during an on-peak-hours period may cause network key performance indicator degradation. In this context, it becomes essential to develop new algorithms and deployment policies for the upcoming 5G network.
In this work, we propose a novel approach of BSs deployment for the next-generation 5G network in millimeter wave (mmWave) frequencies using meta-heuristic algorithms. The scope is to find the optimized position of each BS using mmWave frequencies to meet the data rates requirement of the 5G network with the minimum required number of BSs in hotspots areas. To assess the performance of the developed model, we employed both deployment architectures; the standalone architecture where the network consists of mmWave UMi and the non-standalone architecture where mmWave UMi is deployed in the coverage of the existing LTE UMa. Note that, in non-standalone deployment architecture, the 5G radio systems are integrated into the previous LTE networks according to 3GPP release 15, and in standalone deployment architecture, the new radio system is complemented by a next-generation core network. The standalone deployment will be utterly different from the LTE core network. Therefore, due to a massive amount of hardware expected on 5G deployment, the non-standalone deployment way-point enables network operations to progress with the design and the initial network implementation. We implemented a particle swarm optimization (PSO) based on swarm intelligent, and we compare the performances of the PSO-based planning approach to the ones of simulated annealing (SA) and genetic algorithm (GA) to find the suboptimal position of UMi to satisfy the data rates requirement concerning next-generation 5G network. Then, we employed an iterative approach to remove the futile (redundant) BSs. Firstly, we evaluate the link budget subject to determine the minimum required BSs to be deployed while satisfying the user data rates requirement in the peak-hours period and evaluated the radius of BSs using the radio propagation model in mmWave frequencies at 28 GHz and 38 GHz. Note that we considered the intercell interference and the impact of atmospheric gas attenuation, foliage losses, and rain attenuation at 28 GHz and 38 GHz in the propagation model. Furthermore, we use Monte Carlo simulations to perform numerical simulations focusing on different scenarios in the 5G network at the spectrum of 28 GHz and 38 GHz to measure the outage rate given the placement of the BSs determined in the planning phase. The result shows that our proposed approach will significantly facilitate the deployment feasibility of 5G network in mmWave frequencies. This study is an extension of [6], which was mainly focused on macro BSs deployment in the LTE network. In this investigation, mmWave carrier frequencies have been used in the planning process of UMi BSs subject to satisfy user data rates requirements.
The rest of the article is organized as follow: Section 2 presents the background and related work, and the system model and problem formulation are described in Section 3. The proposed meta-heuristic algorithm is provided in Section 4; after describing the algorithm for UMa and UMi deployment, an iterative method is developed to remove the redundant BSs. Next, the performance of the proposed model is evaluated, and the results are presented and discussed in Section 5. Finally, the conclusion of the article is given in Section 6.

2. Background and Related Work

The 5G network is expected to be deployed with a considerable amount of BSs due to the use of mmWave frequencies; the topologies go beyond the one used in the current wireless network. For a single 5G mobile cell, the download speed is expected to be at least 20 Gbps according to ITU perspectives, while the current 4G cell has about 1 Gbps peak data rates. The upcoming 5G standard will support a multitude of interconnected devices up 1 million per square kilometer [7]. Enhancing mobile broadband services is considered to be one of the key initial driving forces behind 5G. To this end, various innovative technologies were investigated or are under investigation such as massive multiple-input multiple-output technology and distributed antenna system [8] to deal with penetration loss for indoor wireless users who are considered to be 80% of the total networks users [9], spatial modulation [10], mmWave technology [11], C-RAN, and small cells with heterogeneous networks deployments [12]. 5G has to meet several requirements [13], and all the requirements will be affected by the solution of the deployment of BSs. Some investigations have been proposed to examine the deployment of BSs in engineering and academics fields. For instance, the authors in [14] employ SA to perform the deployment of BSs for LTE network, where an SA algorithm is used to place the macro BSs in the area of interest. Another work [15] determines the number of BSs to be deployed and their locations in the region of interest, where the users are non-uniformly distributed in order to minimize the energy consumption in the network. Reference [16] proposes a green cell planning scheme based on a stochastic approach to minimize the number of deployed BSs, where the final number of BSs to be deployed derives from the optimal location of each BS under all considered traffics pattern. A non-dominated sorting GA [17] and an evolutionary multi-objective optimization algorithm [18] were investigated to find the locations of BSs in LTE heterogeneous networks. The authors in [19] investigate a metaheuristic algorithm for the 5G hyper-dense deployment problem and the proposed search economics algorithm divides the search space into a set of subspaces to determine the location of BSs. Reference [20] considers the deployment case of co-existing macro cell BS, small cell BSs, and private femtocell access points forming dense cellular heterogeneous networks. Greedy solution using GA is studied by the authors in [5] to investigate the problem of hyper-dense deployment of BSs in 5G network, where they propose to build the small cells in the existing macro BSs to fill up the coverage holes. Furthermore, if the existing UMa BSs are not in the best positions, they can be removed as long as the demolition costs are suitable. Another work presented in [21] proposes to find the locations of small cells BSs under the coverage area of macro BS in 5G heterogeneous networks using the location-based operation algorithm. Joint interference and load balance and deterministic deployment schemes were proposed by the authors in [22] to examine the small BS deployment strategies in two-tier cellular networks. The authors demonstrate the effect of interference and load on throughput performance based on the position of the small BS position to the macro BS. The authors in [23] adopt the unsupervised self-organizing map to solve both coverage planning and performance optimization problems in two tiers. The approach proposes to adjust the position of small cells based on the proposed algorithm, which maximizes the key performance indicators such as average throughput, fairness, and coverage probability in an unsupervised manner. The authors in [24] investigate the dynamic small cell placement problem in high-demand outdoor environments for the LTE network. Reference [25] uses a metaheuristics algorithms to find the minimum set of BS location that can cover the defined domain. The impact of imperfect small cell placement is investigated inside a macrocell [26], where the authors analyze the deployment of small cells in both static and dynamic levels.
The investigation in [27] proposed an algorithm based on GA to determine the minimum number of BSs in the ultra-dense 5G network to satisfy cell capacity and coverage constraints; the authors used optical fiber and wireless backhaul to serve wired BSs and unwired BSs. However, few previous studies dealt with optimizing the placement of BSs for 5G networks in mmWave frequencies. The paper in [28] investigates the key requirement and characteristics of an ultra-dense network when using mmWave frequencies to deploy BSs. The deployment of the high-capacity small cell is studied in [29] where small cells are mmWave-backhauled to the core network. Ultra-dense network deployment and management guidelines were instigated in [30], where the authors investigate the deployment at sub-6 GHz, and the ultra-dense at centimeter-wave. Furthermore, some fundamental differences of ultra-dense network deployments are presented, such as more BSs than active users; in this case, BS can mute its transmission when there is no active UE connected to it; in the case of less active UE per active BS, the higher the number of deployed BSs in ultra-dense deployment network, the lower the number of UE in each BSs. However, it is necessary to note that with the expected dense number of BSs in ultra-dense network to satisfy 5G requirements, the use of mmWave frequencies in the planning process is vital, and the research on how to find the required number of BSs while satisfying the 5G requirement is still limited. To our knowledge, various algorithms have been widely used in solving cell deployment problems; there is plenty of room for improvement due to the problematic deployment of the 5G environment in mmWave frequencies as compared to the previous generations of wireless networks. The recommended solutions did not offer a general solution as the upcoming 5G will be very dense due to the use of mmWave carrier frequencies, and the locations of the BSs will depend on the performance of the user, and the locations can change from one performance to another.
In this article, we proposed a novel approach for deployment perspective of the upcoming 5G network in mmWave frequencies. Our planning approach for the 5G network can be considered as the first completed approach compared with previously proposed methods when using mmWave carrier frequencies in the planning process. We estimated the number of required BSs to satisfy user data rates requirement in 5G environments. Secondly, all the mmWave parameters are taken into account in the systems for the accurate propagation models and we try to determine the minimum required number of BSs to be deployed while satisfying user demands in the developed model. More accurate scenarios were considered where the area is divided into a smaller area, called subareas, with different user densities, instead of concentrating on the traditional uniform area with uniform user distribution.

3. System Model and Problem Statement

In this section, we present the system model and formulate the optimization problem of our study.

3.1. System Model

The model is focused on the 5G network, where a set of candidate BSs denoted by C B needs to be deployed in a geographical area of interest. C B corresponds to the final combination of UMa and UMi. The coexistence of UMa and UMi in the same area will depend on the number of users in this area and their required downlink (DL) data rates target, which can be defined based on Shannon’s capacity equation in additive white Gaussian noise (AWGN) model as given in Equation (1):
R target = B log 2 ( 1 + P r   ( u , i ) I + N B ) ,
where R t a r g e t represents the target DL data rates, B is the subcarriers bandwidth allocated to user u , it is expressed as: B = B T D L Z s u b D L , where the numerator term expresses the total usable DL bandwidth, and the denominator term is the total number of DL subcarriers. P r is the total received power from BS i C B to user μ .   P r can be expressed as follows: P r = Antenna   gain   transmitter   ×   antenna   gain   receiver   ×   channel . In this article, we considere equal power transmission over subcarriers expressed as: P s u b = P m a x Z s u b D L . N is related to the noise power. We represent the interference on subcarrier measured at the receiver of user u , which can be modelled as follows:
I = k = 1 ,   k i Z B S ( u = 1 Z U B S ƴ u , k ) P t G u , s , k B S G u C u , s , k   ,
where ƴ u , k a binary variable set to 1 if a resource is allocated to the user u in a cell k , and 0 otherwise. P t is the power transmitted by BS i . G u is the user antenna gain, and G u , s , k B S is the BS antenna gain, which is modeled according to [6,31] as:
G u , s , k B S = 10 1.2 ( p v ( χ u , s , i χ s φ v ) 2 + p h ( Ψ u , s , i Ψ s φ s , h ) 2 )   ,
where χ u , s , i and Ψ u , s , are vertical and horizontal angles in degrees on sector s and user u . p v and p h represent vertical and horizontal beam patterns of the antenna [6]. χ s and Ψ s denote the tilt and the azimuth of the sector s . The last term C u , s , k is the channel gain between user u and antenna sector of BS i , which can be expressed as follows:
C u , s , k = ( қ υ 10 log 10 d u , i ) ξ u , s , j + 10 log 10 F u , s , i   ,
where d u , i denotes the distance between user u to BS i . ξ u , s , i expresses shadowing, and the last term F u , s , i represents fading. Z B S and Z U B S are the required number of BSs with respect to deployment constraints and the number of users supported by each BS, respectively. The signal to noise of user u in BS i is given in [32] as follows:
Γ u , s , i = P t G u , s , k B S G u C u , s , k   I + K T B R B   ,
where K T B R B expresses the noise power at the receiver of the user, k is Boltzmann constant, T is the temperature in Kelvin, and B R B is resource block bandwidth. Assuming that a resource block is assigned to each user to satisfy his data rate requirement in 5G environment. The frequent parameters used in this study and their corresponding description are listed in Table 1.
In this model, the link between the user and his serving BSs is established using mmWave link in the access network, and that all the BSs are assumed to be directly connected to the next-generation core network through fiber and mmWave for UMa and UMi, respectively, with a sufficient bandwidth in the backhaul to satisfy the user data rates target. We assume that the new radio core used in this model is independent from the LTE core network. UMa assures the functions of control plane due to its large coverage and user plan to guarantee the minimum data rates requirements in urban or suburban zones, and UMi are deployed in hotspots to fulfill one of the main 5G Key performance indicators, which is data rates requirement. Note that the user plan, also known as data plane, carries the network user traffic. The control plane carries the signaling messages that are exchanged between the user and the network. Figure 1 illustrates the proposed model in detail for the case of one UMa with two hotspots. UMa and UMi will be deployed with three sectorial antennas and omnidirectional antenna, respectively. For instance, users can be uniformly or normally (Gaussian) distributed in the area of interest.
Let S M =   { 1 , 2 , 3 , , M } and S N = { 1 , 2 , 3 , , N } be the sets of candidate UMa and UMi, respectively. Thus, C B can be defined as S M S N . We assumed that all S M are planned with the same carrier frequency. However, with the dense deployment of BSs in a limited area, severe interference would happen due to the spectrum reused in a short distance when using mmWave frequencies. Therefore, to mitigate interference in the Gaussian hotspots, S N will be planned with the different carrier frequency with its related S M . For simplicity purposes, we assume that all S M are optimally placed in a manner to cover all the area of interest. The path loss between user μ and BS i C B when using mmWave frequencies can be expressed based on the free space propagation loss described in [33,34], and modeled in [3,35], as follows:
P L o s s ( d B ) = 92.45 + 20 log 10 ( d ( K m ) ) + 20 log 10 ( f ( G H z ) ) + A ( d B / K m ) + B ( d B / K m ) + C ( d B / K m ) + δ ,
where δ is a random variable; A, B, and C represent the atmospheric, rain attenuation, and the foliage losses, respectively.
In our proposed model, the cell range is calculated using the propagation model, and the link budget determines the maximum allowed path loss model (MAPL), which calculates the cell radius R. We aim to determine the coverage and capacity, and some parameters need to be identified and computed such us penetration loss, propagation model, fading margin, shadowing, and the MAPL in the mmWave environment. An example of a link budget for mmWave at the spectrum of 28 GHz used in this study is given in Table 2, and the input parameters are selected from [36,37,38]. The transmission radius of the UMi is smaller than those of UMa, due to their deployment cost. Then, we intend to define the minimum number of required BSs and to find their placement in the manner of satisfying the data rates requirement. Let A R i ( A R i = π R 2 for a circular cell and A R i = 3 3 2 R 2 for a hexagonal cell) be the surface occupied by one BS i and A R T the total surface of the given geographical region A . Thus, the number of needed BSs denoted by Z c o v to cover the area of interest is obtained by the following equation:
Z c o v = min ( A R T A R i ) ,       i M  
where P i is the received power from BSs i to u and Z U B S is the number of users that can be supported by each BS given by the following expression:
Z U B S = max ( Z s e c   Z c a p s e c R t a r g e t )
where Z s e c and Z c a p s e c   are respectively the numbers of sector antennas and the available cell capacity of each sector. The capacity is defined using the system bandwidth and spectrum efficiency. Let S Z a r e a be the size of the subarea j , which contains a certain number of BS i in the geographical area, and Γ Z u the average number of users per subarea. Thus, the minimum number of BS satisfying Equation (1) is denoted by Z c a p in each subarea and given as follows:
Z c a p = Γ Z u j S Z a r e a j Z U B S   ,       S Z a r e a A .
The result of the capacity and the coverage dimensioning may be different. Then, for an accurate result, the number of required BSs needs to be a balance between the results from the coverage and capacity dimensioning. The required number of BSs to cover all geographical region while respecting the users DL data rates can be an estimated based on the following equation.
Z B S = max ( Z cov , Z c a p ) = max ( A T A t A T A i , Γ Z u j S Z a r e a j Z U B S   ) ,    

3.2. Problem Statement

The objective of our developed model is to define the optimized positions of the smallest number of required UMa and UMi ( x , y ) with respect to user data rates requirement and coverage constraints. We assume that all users in the same subarea request the same data rates. We also assume that each user will be covered by at least one BS by using mmWave carrier frequencies in the planning process. The following perspectives are taken into attention: Each user can be served either by an UMa or UMi. It is important to note that Z B S , which is Z B S U M a + Z B S U M i , is also a variable of our optimization problem. Thus, the initial number of Z B S might be different from the final value. We randomly distributed ϑ D R data rates satisfaction point in the entire region of interest to satisfy user data rates requirement. Thus, the higher the ϑ D R , the better the coverage efficiency. Therefore, the complexity of the problem is proportional to the number of ϑ D R .
Binary constraints: The parameters P ( S 1 , i , j ) 1 and P ( S 2 , i , j ) 2 are binary variables. P ( S 1 , i , j ) 1 measures the presence of UMa sector antenna in the subarea, and P ( S 2 , i , j ) 2 measures the existence of UMi in UMa.
P ( S 1 , i , j ) 1 ( x j , y j ) = { 1 ,   if   the   sector   of   UMa   is   totally   comprised   in   the   subarea   j 0 ,   otherwise P ( S 2 , i , j ) 2 ( x j , y j ) = { 1 ,   if   UMi   is   totally   comprised   in   the   UMa   i 0 ,   otherwise
Please note that P ( S 1 , i , j ) 1 and P ( S 2 , i , j ) 2 will be less than 1 if they are partially included in the subarea j and UMa i , respectively.
Consistently, the parameter V q is a binary variable (with the sequence of q = 1 , 2 , 3 , ϑ D R ) that is:
  q ( x , y ) = { 1 ,   if   the   q   is   covered   by   at   least   one   B S   ( UMa   or   UMi ) 0 ,   otherwise
Equivalently, the vector δ is a binary variable that holds all the UMa and UMi states. The deployed UMa or UMi state correspond to the value of δ = 1 . Otherwise, the BS is redundant.
Data rates constraint: The average number of users served by the sector antenna of UMa and UMi can be expressed as Z U B S Z s e c M P ( S 1 , i , j ) 1 ( x j , y j ) and Z U B S Z s e c M P ( S 2 , i , j ) 2 ( x j , y j ) . Thus, to ensure that all user data rates requirement in a subarea are satisfied, the following expression should be fulfilled.
  μ Ɗ j Ѕ ( j ) i = 1 Z B S S 1 , S 2 = 1   ( S 1 S 2 ) Z s e c ( Z U B S Z s e c M P ( S 1 , i , j ) 1 + Z U B S Z s e c m P ( S 2 , i , j ) 2 ) ( x j , y j ) ,   j = 1 , , N
where μ is a tolerance parameter added to relax the data rates constraint and the value of μ [ 0 , 1 ] , Ɗ j is a density function. Note that the parameters P ( S 1 , i , j ) 1 and P ( S 2 , i , j ) 2 depend on UMa and UMi locations.
Coverage constraint: The entire region of interest is considered to be covered if the following condition is satisfied:
q = 1 ϑ D R V q θ ϑ D R .
θ is a tolerance added to relax the coverage, the value of θ [ 0 , 1 ] . We set the objective function of the cell deployment problem to minimize the number of UMa and UMi to be deployed, expressed as follows.
minimize U M a , U M i i = 1 Z B S δ i .
Subject to: [ensure that all users data rates required in a subarea are satisfied expressed as:]
μ Ɗ j Ѕ ( j ) i = 1 Z B S S 1 , S 2 = 1   ( S 1 S 2 ) Z s e c ( Z U B S Z s e c M P ( S 1 , i , j ) 1 + Z U B S Z s e c m P ( S 2 , i , j ) 2 ) ( x j , y j ) ,   j = 1 , , N
[And the entire region of interest is considered to be covered expressed as:]
q = 1 ϑ D R V q ( x , y ) θ ϑ D R     .
Minimizing the number of deployed BSs in the planning phase can significantly reduce the power consumption of the system, especially when using mmWave frequencies in the planning process. Thus, if all user data rates requirement can be satisfied with less BSs, the energy efficiency will be enhanced. This problem is NP-hard [39], and it is very difficult to determine its optimal solution; therefore, we opt for a meta-heuristic approach. The planning process will decide where to deploy the minimum required numbers of BSs in order to satisfy users QoS by considering users connectivity, mobility, and data rates requirement.

4. Meta-Heuristic Algorithms

As discussed previously, the complexity of the solution increases significantly for a high number of data rates satisfaction point and users. To that end, we propose to employ a meta-heuristic algorithm named PSO, which consists of two steps. After considering all the input parameters in the link budget and the propagation models in mmWave frequencies, step 1 computes the number of BSs and places them in the area of interest with their first best position. Step 2 consists of eliminating redundant BSs to determine the minimum required number of BSs and to find the optimized position of each BS while satisfying Equations (15b) and (15c).

4.1. PSO Algorithm for Base station Planning

The use of mmWave carrier frequencies in the planning process of the upcoming 5G network is a promising solution to reach user data rates requirement. Therefore, the number of BSs to be deployed will significantly increase. Optimizing the location process of these BSs will be vital to improve and maintain the QoS. To overcome this situation, an alternative solution was proposed in the previously published papers such as GA used by Han et al. [40], PSO [41], grey wolf optimizer [42], and SA [14]. Therefore, we employed PSO in our proposed approach due to the advantage of dealing with an unlimited number of possible BS combinations and the good convergence speed. The general process is shown in Figure 2.
PSO was first described in 1995 by James Kennedy and Russel C. Eberhard [43,44]; it is a population-based meta-heuristic inspired by swarm intelligence and consists of a swarm of the particle, and each particle includes a potential solution. Particles move in the search space to explore for optimal solutions [45]. PSO is easy to implement with few parameter adjustments, and the swarm is similar to a population and particle to an individual. Some main advantages of PSO are that is it an easy concept, its simple implementation, robustness to control parameters, very efficient global search algorithm, very few algorithm parameters, faster convergence, and ability to find better solutions. These advantages have classified PSO as the best approach and motivated researchers to use PSO in many areas such as fuzzy system control, function optimization, artificial neural network training, and wireless communication field [46]. PSO is a computational system that optimizes a given objective function by iteratively attempting to increase a candidate solution concerning a given measure of quality; the population consists of K agents moving around in a D-dimensional search space. At each iteration, an agent moves from one position to another in the decision space, and each agent preserves its position in the search space, velocity, and individual best solution. PSO executes searching based on a population of agents that updates from iteration to iteration. To explore the optimal solution, each agent moves in the direction to its previous best (pbest) position and the global best (gbest) location in the swarm and tries to adjust its location using the following information.
Step 1:
Initialize population in hyperspace.
Step 2:
Estimate the suitability of each agent.
Step 3:
Adjust velocities and location of each agent.
Step 4:
Finish some conditions or return to step 2.
Gbest converges faster than pbest PSO, but pbest PSO is less vulnerable to being trapped in local optima due to the massive particle interconnectivity of the gbest PSO [47]. PSO computes and updates the velocity V Ѵ ( k ) ,   Ѵ = 1 , 2 , , Z B S of each iteration h and the position of each element Ѵ . The following equations update the velocity V and position K of agents:
V i ( t + 1 ) = ω V i ( t ) + c 1 r 1 ( P L ( i , t ) P i ( t ) ) + c 2 r 2 ( g b e s t ( t ) P i ( t ) ) ,
P i ( t + 1 ) = P i ( t ) + V i ( t + 1 ) ,
where in Equation (16), c 1 and c 2 are called acceleration coefficients and the values are chosen close to 2, while the ω is the inertia weight employed to control the convergence speed. A suitable selection of ω can provide stability between global and local exploration abilities. It was found that the selected value of ω in the range of [0.9, 1.2] has an excellent achievement. The parameters r 1 and r 2 are independent random numbers for each element of the agent. r 1 and r 2 are generated every velocity update, and the values are close to 1. The restricted value of velocity called “ V m a x ” is used if the velocity exceeds the prefixed limit. The process is reproduced, and by doing so, it is expected to reach the convergence either by succeeding the maximum number of iterations or by achieving the algorithm objectives. Let generate H number of agents Z h , h = 1 , 2 , 3 , ,   H of 2 N × 1 dimensions in the initial population G . Note that the vector Z h = [ x ( h ) , y ( h ) ] contains the random states of UMa and UMi in the area of interest. PSO finds and updates the velocity V Ѵ ( h ) ,   Ѵ = 1 , 2 , ,   Z B S of each iteration τ and the position of each element Ѵ are obtained, then it computes two utilities functions R f ( h ) , 1 and R f ( h ) . 2 realized by each agent h . Lastly, the optimized solution is given by Z o p t = Z G .
R f ( h ) , 1 = { n = 1 ϑ D R V n ( h ) 0 ,   e l s e     ,   if   Equation   ( 15 b )   is   satisfied   by   h   agents  
R f ( h ) , 2 = j = 1 N | i = 1 Z B S Z U B S Z s e c s = 1 Z s e c ƴ ( h ) ( Z ( h ) ) μ Ɗ j Ѕ ( j ) |
R f ( h ) , 1 in Equation (18) represents the number of ϑ D R covered by all BSs. The value is set to 0 if the Equation (15b) is not satisfied for any subarea; the agent h does not cover the region at all. R f h . 2 is used to compute the difference between the minimum required number of users that have to be served by the agent h and the number of users served by agent h ; when it determines a suitable solution, the PSO changes the utility to R f ( h ) , 1 and attempts to minimize it until θ ϑ D R is achieved. Algorithm 1 optimizes the number and the first position of BSs in the system while satisfying the coverage and data rates requirement. PSO has been successfully used in diverse and complex problems. However, when using PSO in a high dimensional swarm, its convergence cannot be guaranteed [48]. Also, the particles converge prematurely and get entombed in local minima. Dividing the search area, choosing better parameters for PSO, and a velocity value greater than zero can be an alternative solution for the complex problems to find an optimal output.
Algorithm 1: Algorithm for UMa and UMi deployment
1:
Generate an initial random population containing H particles Z ( h ) , h = 1 , 2 , , H of size 2 Ɲ   X   1 and find their corresponding position.
2:
R f 1 m i n = 0 , τ = 1 and use R 2 as a utility by setting R = R 2 .
3:
While R f 1 m i n > θ ϑ D R do
4:  
for h = 1 , 2 , , H do
            
calculate R ( h ) ( τ ) ,   h = 1 , 2 , , H .
5:    
end for
6:    
if arg   min h , τ   R ( h ) ( τ   ) 0 then
            
find ( h m , τ   m ) = arg   min   h , τ R ( h ) ( τ   ) , where h m and τ m express the particle’s index and position that results in the lowest utility R . Then, set R m i n = R ( ( h m ) ( ( τ m ) and Z G = Z ( h m ) ( k m ) .
            
Find τ l o c a l = arg   min h , τ   R ( h ) (   τ   ) for each h where τ l o c a l expresses the placement of h which is the output of the lowest local utility. Then, set R ( I , l o c a l ) = R ( h ) ( ( τ l o c a l ) and Z ( I , l o c a l ) = Z ( h ) ( τ l o c a l ) .
            
Adjust the velocity and the location of each agent based on Equations (15b) and (15c), respectively.
7:    
else
            
R = R 1 which is shifting the utility R to R 1 .
8:    
end if
τ   = τ + 1 .
9:  
end while

4.2. Algorithm for BSs Selection with Redundant BSs Elimination

As described previously, let C B = S M S N =   { 1 , 2 , 3 , , i M , N } be a set of candidate UMa and UMi to be deployed in the region of interest, and we assumed that all these BSs are powered on. This approach mainly focused on consecutive elimination of duplicated BSs in order to get the minimum selected number of required BSs to satisfy user data rates requirement in 5G environments. After finding the placement of each BSs using the developed meta-heuristic algorithm, we assumed that all the deployment constraints are satisfied. Then, we started the process by removing duplicated BSs with respect to the user data rates requirement. We summarized the total process in three steps:
Step 1, we place S M =   { 1 , 2 , 3 , , M } in the region of interest using meta-heuristic algorithm then we eliminated redundant macro cell BSs if any.
Step 2, we place S N =   { 1 , 2 , 3 , , N } in the region of interest using meta-heuristic algorithm then we eliminated redundant micro cell BSs if any.
Step 3, we suppose that the remaining UMa and UMi are placed in the area of interest, and we remove the duplicated BSs ones to obtain the final selected BSs combination that satisfies user data rates requirement and coverage constraints. Given two sets denoted S 1 C B and S 2 C B , we assume that all BSs in the set of S 1 is considered to be indispensable, which means that removing any BS in this set will cause service deterioration. UMa or UMi in the set of S 2 is considered to be futile and can be safely removed without affecting user data rates requirement. The objective is to keep all selected BSs in S 1 and to remove all BSs in S 2 and find the optimized UMa and UMi combination without affecting user data rates requirement and coverage constraints. To reach our objective, we optimize a binary vector denoted by α with a size of ( Z B S   ×   1 ) . Then, we remove BSs one by one while checking constantly if user data rates requirement and coverage constraints remain fulfilled or not. If a BS i causes any services deterioration, it cannot be removed and will be placed in S 1 , and its corresponding τ i remains 1, otherwise it is supposed to be eliminated and placed into S 2 . The algorithm only focuses on S 2 to determine all BSs that can be safely removed and set their corresponding τ to 0. Note that τ   of   size   ( Z U B S × 1 ) is an optimized binary vector to find optimized BSs combination that will not affect the performance of the system. If two or more BSs in S 1 can reinforce each other to keep user data rates requirement, only one that has insignificant influence on the served users denoted by ı ^ can be removed. ı ^ is given by:
ı ^ = arg   max i α j = 1 N i = 1 , i ı ^ Z B S ( Z U B S Z s e c s = 1 Z s e c ƴ ( Z o p ) μ Ɗ j Ѕ ( j ) )   ,
The steps are repeated until getting the final combination of UMa and UMi that could be removed without affecting any service, which corresponds to remove all BSs in S 2 . Algorithm 2 eliminates redundant UMa or UMi in the network to output the final candidate set of BS while satisfying the data rates requirement and coverage constraints.
Algorithm 2: Algorithm for redundant UMa and UMi elimination
1:
τ = 0 , C B =   { 1 , 2 , 3 , , i M , N } with C B =   S M S N which corresponds to the total candidate of BSs to de deployed.
2:
Assume all C B is powered on α ( h ) = [ 1 , , 1 ] .
3:
Repeat
4:  
For i = 1 , , Z B S do
        
Remove UMa or UMi i   S 2 and define α ( j ) ( τ ) which corresponding to α ( τ ) with 0 in the j t h position.
        
Check user data rates requirement.
5:     
if user data rates requirement are still satisfied then
    UMa or UMi i can be removed, i   S 2 .
6:     
else
    UMa or UMi cannot be removed.
7:     
end if
8:    
end for
9:    
Find UMa or UMi ı ^ such that:
ı ^ = arg   max i α j = 1 N i = 1 , i ı ^ Z B S ( Z U B S Z s e c s = 1 Z s e c ƴ ( Z o p ) μ Ɗ j Ѕ ( j ) )   , .
UMa or UMi ı ^ is totally and carefully removed, C 2 = C 2 \ { ı ^ } , and α ( τ + 1 ) = α ( ı ^ ) ( τ ) .
τ = τ + 1 .
10:
until S 1 = .
11:
The final UMa or UMi combination after network planning is α ( τ ) .

5. Simulation Results and Discussions

This section aims firstly to prove the motivation behind using the mmWave frequencies spectrum at 28 GHz and 38 GHz; secondly, in order to validate our proposed approach, we presented numerical examples and simulations results for different scenarios. Furthermore, we use Monte Carlo simulation to measure the outage rate given the placement of the base stations determined in the planning phase.

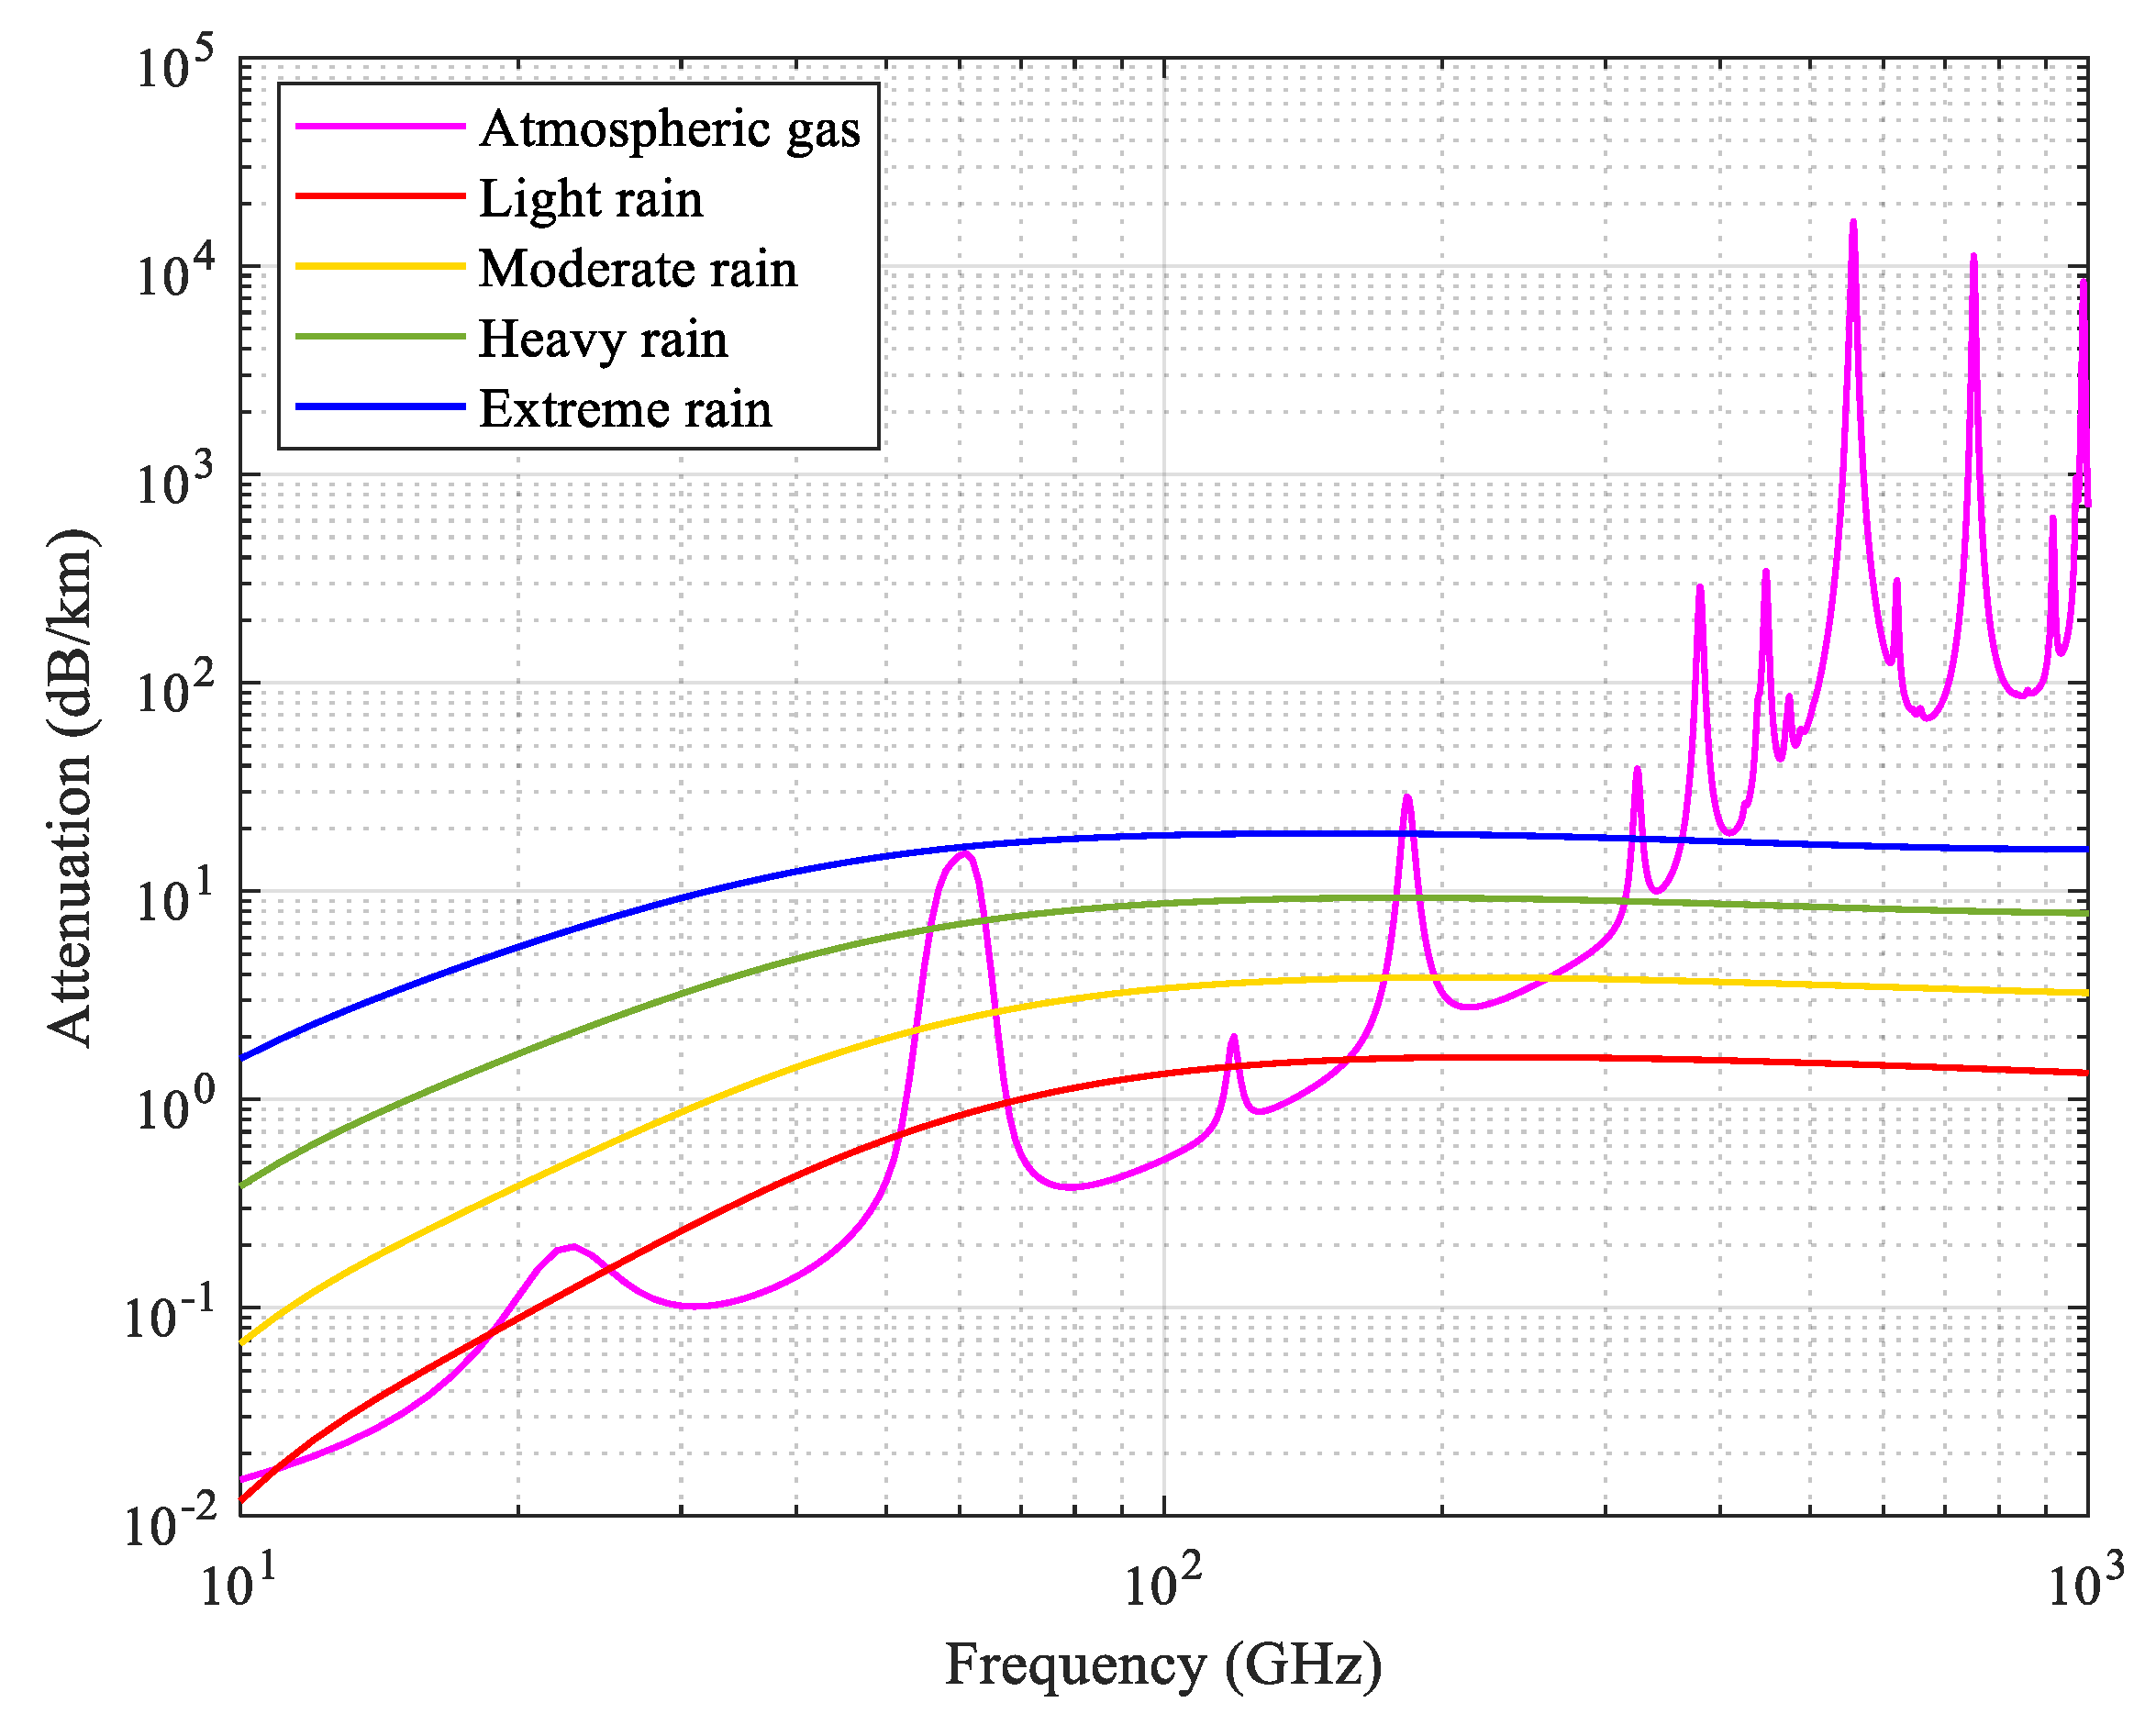
5.1. 28G and 38G MmWave Frequencies Spectrum

The deployment of dense heterogeneous networks with the use of mmWave carrier frequency is desired to be studied in the planning process of the upcoming 5G networks. The target is getting systems with higher data rates up to 20 Gb/s with very low latency. The use of the mmWave carrier spectrum in the cell planning process will significantly improve the data rates of the networks while increasing the number of UMi to be deployed. The intermediate frequency band for 5G and mmWave frequencies band will be suitable for 5G UMi dense networks in urban hotspots where additional capacity is vital. However, these frequencies bands can also accommodate UMa for a wider coverage area [49]. MmWave is considered to be a promising solution for the increasing demand for faster data rates and the high bandwidth utilization for the next generation wireless network. With the possible gigabit-per-second data rates, mmWave has attracted high attention as a potential frequency band for the 5G wireless network [50]. Free space path loss defines a part of the signal attenuation. The signal travels with interaction with particles in the air and loses energy during its propagation, and the loss varies with different factors such as water density and pressure.
Currently, the 28 GHz and 38 GHz bands get the most international support. The studies in [35,50,51] show atmospheric attenuation at different frequencies and prove that at 28 GHz and 38 GHz the atmospheric attenuation is negligible (0.06 dB/km and 0.08 dB/km, respectively). In general, heavy rain can cause higher attenuation using the mmWave spectrum due to the similar size of the mmWave wavelength and raindrop [52]. The investigations show that the rain attenuation will have a high effect to the system at high frequencies based on network size and distribution [53]; also, the attenuation insignificantly decreases with the use of highly directional antennas as studied in [50,52]. Figure 3 shown how loses due to atmospheric gas and rain varies with frequency according to ITU recommendations [54,55]. The penetration loss is also a big challenge for the use of mmWave spectrum as compared to today’s UHF/microwave systems. At 28 GHz and 38 GHz, the studies in [35,56] found a penetration loss of approximately 28 dB and 25 dB respectively. Global researchers in academic and engineering fields are showing their interest in the frequency spectrum at 28 GHz and 38 GHz for the usage in the 5G network. Some advantages are: Better cell-edge coverage, large bandwidth at higher frequencies, and less interference caused by BSs to UE in the neighbouring cells as compare to microwave [57]. The foliage losses will have a high impact in mmWave, according to ITU-R recommendations; it can be calculated as following [58]:
C = 0.2 × f 0.2 d 0.6
where f is the frequency in MHz and the d is the tree depth expressed in meters.

5.2. Results and Analysis

We considered an area of 10   K m × 10   K m , where we generated the simulation results. UMa are uniformly placed in a manner that covers the area while UMi are deployed to satisfy 5G user data rates requirement in the hotspot zones. As mentioned, the proposed approach can be performed with uniform and normal user distributions. Table 3 provides a summary of mains simulation parameters for PSO and SA. We used MATLAB (R2018a) software running on a PC with Intel Core (TM) i5 CPU 2.67GHz RAM 4 GB Microsoft Windows 10 Pro to run the algorithms of PSO and SA.

5.2.1. Planning at 28 GHz Using PSO and SA

Since PSO and SA are supposed to find a clarification to a given objective function but employ diverse approaches and computational effort, it is suitable to compare their performance. We studied the performance comparison of PSO and SA optimization techniques, for high-density network BSs planning in mmWave carrier frequencies. We considere the scenario I and scenario II, as described in Table 4 when running PSO and SA algorithms. In scenario I, the objective is to display the performance of the proposed approach and SA by deploying only UMi in the area of interest where users are uniformly distributed. Then, Algorithm 1 is used with the link budget parameters given in Table 1 to define the number of needed BSs to cover the area of interest while respecting the 5G user data rates requirement. The obtained results from PSO and SA are compared in Figure 4a for PSO and Figure 4b for SA. For PSO and SA, we considered 2000 iterations to reach our goal when running the algorithm, but the iteration can stop if the following conditions are met: (1) The use data rates requirement is satisfied; (2) all the data rates satisfaction point are covered. Note that the aim is to determine the minimum number of BSs while satisfying 5G user data rates requirement and cover the total area of interest. The results presented in Table 4 indicate that the number of site for SA increases to achieve the same coverage as PSO. Further, the same number of user with the same data rates requirement are considered for both SA and PSO algorithms. However, in scenario II, the number of users has been increased, and the region of interest is subdivided into two subareas. We concentrated 60% of the total traffic density to subarea B where users are normally distributed and 40% of the traffic density to subarea A with uniform user distribution. This scenario adapts the proposed approach to 5G network environments; the subarea B can be a very dense multitude of users, such as a big shopping area.
We explored the co-siting 5G new radio mmWave with the existing LTE UMa. Indeed, in the adapted algorithm, the number of users can be increased and changing the distributions without affecting the coverage constraint. This demonstrates the efficiency of the adapted algorithm. In Figure 5, we compare the results obtained for PSO and SA. We place UMa by using the propagation model proposed in [34,59] with the bandwidth of 2 GHz to cover all the area; the result shows that 42 UMa are needed for both PSO and SA to cover the area. Then, we combine UMa and UMi to execute the Algorithm 2, subject to eliminating redundant BS if any.
As seen from Figure 5a,b for PSO and SA, respectively, PSO provides almost the same placement with minor differences, but PSO is more close to the optimal performance. Further, all the UMi are concentrate to the center of Gaussian distribution due to high data rates request in this zone, and high amount of sites is normal for the 5G environment with the expected data rates and the use of mmWave. The subarea A can be considered as a suburban zone where the traffic is slight with low user density. After applying Algorithm 2, all the MBSs in this subarea A remain stable. Table 4 summarizes the performance comparison between the results obtained from PSO and SA at 28 GHz.
The Monte simulation is used to assess the efficiency of the developed model, and the results demonstrate that the obtained values are in line with the desired 5G network QoS requirements. The percentage of users in outage for both PSO and SA is low at around 12.57 and 13.01, respectively, with better performance for PSO. Further, for both scenarios, the results indicate that PSO and SA present excellent cell coverage, but the number of the site for SA increases to achieve the same coverage as PSO. We can clearly see from Figure 6 that PSO is faster than SA with less time consummation to reach the convergence. Therefore, SA presents the same convergence at the start but faces difficulties in reaching the target point as the number of iterations increases, as it is shown in Figure 6. Note that for the shake of graph visibility, we separated Figure 6a,b. All the scenarios for 5G planning are stable in term of coverage, data rates requirement, and also QoS with the developed model.
Some practical deployment studies have been presented for solving the deployment problem of 5G, such us unsupervised self-organizing map proposed in [23], smart cell planning solution for the deployment of dense small cells in a dynamic traffic demands and severe co-channel interference [16], mobile backhauling for the deployment of 5G small cells, joint deployment of small cells, and wireless backhauls links [60], where the aim is looking for the best positions to deploy the BSs with respect to planning constraints. The distinguishing feature of the proposed algorithm is that it will first search the global solution based on the mmWave link budget, which is one of the key points of the 5G network, and then determines the position of each BSs based on the planning constraints. The results of the studies mentioned above reveal that our method converges faster and achieves superior performance in mmWave frequencies. Some main concerns, which need to be taken into account when deploying the 5G network, are considered by our investigation, such as serve more users, enhance the data rate, and improve the coverage of the services.
We also compare with the GA for cell planning presented in [27]; in general, PSO is similar to the GA in the logic that these two meta-heuristics algorithms are population-based search methods. In a single point iteration, PSO and GA move from one population to another with expected improvement. PSO and GA begin with a group of a randomly generated population and utilize a fitness value to evaluate the population. They all update the population and search for the optimum with random techniques. We focus on performance comparison, and due to space limitations, we only report and analyze the results. In our simulation, we consider the same area dimension proposed in scenario II with mmWave BSs. In order to fulfill both constraints (data rates and coverage), and serve 3000 users, and the total number of iterations is set to 2000, and each user required 500 Mbps in contrast to 180 Mbps proposed in [27]. Forty-two UMa BSs are needed to cover the area, and four extra UMi BSs are deployed for GA to fulfill date rates constraints. The main difference between the PSO and GA is that PSO does not have genetic operators such as crossover and mutation. In PSO, particles update themselves with the internal velocity; they also have a memory important to the algorithm. Although PSO and GA share many common features, PSO is more suitable for cell deployment problems than GA, PSO is easy to implement, and also there are few parameters to adjust.
Some comparative metrics were also been identified for this study, and the obtained values by the three investigated heuristics approaches are summarized in Table 5. Compared to GA and SA, PSO has less outage probability. Although PSO, GA, and SA show almost the same effectiveness on coverage efficiency, there is a need to mention that the site density is different. For the same coverage, PSO requires less site density than GA and SA which is one of the main key concern of 5G network. For the convergence time efficiency test, we use the time needed by PSO, GA, and SA heuristic approaches to reach convergence metric target. PSO requires less time to reach the convergence point than GA and SA to arrive at the same point for the same number of iterations. On other hand, in terms of CPU time, PSO is faster than GA and SA as it performs 2000 iterations in 3010.39 seconds. The comparative results of PSO and GA show that PSO outperformed GA in obtaining better convergence. As the iteration increases, the PSO particles reach much better fitness than the fitness of chromosomes of GA. PSO, GA, and SA are generally three meta-heuristics algorithms where the accurate number of iterations required to reach the solution is arbitrary and depends on the scenario being studied.

5.2.2. Planning at 38 GHz Using PSO

We kept the same number of users as described in scenario II at the spectrum of 28 GHz, the frequency spectrum has been changed to 38 GHz, and the link budget was adjusted, resulting in the change of MAPL and cell range, and the propagation model used in this case was also adjusted related to the one as described in the Report ITU-R M.2376-0 [61]. Then, we generated results for Gaussian distribution with hotspots in subarea B and uniformly user distribution in subarea A. Although we have proven with 28 GHz that the adapted algorithm has close to optimal performance, this case aims to show the impact of increasing the mmWave frequency when deploying BSs in 5G network in the planning process with 38 GHz, and also the flexibility of the developed approach. The number of BSs increases as the frequency increases, as shown in Figure 7. The coverages are comparable to the previous study where planning was implemented using 28 GHz. The difference is that the number of BSs increased due to the change of the link budget in this case for 38 GHz, which reduce the cell range.
As compare to the result obtained for 28 GHz, 196 extra BSs need to be added when deploying BSs using 38 GHz for the same coverage as 28 GHz. Increasing the BSs density in 5G environments will make user close to the BSs as much as possible to satisfy their data rates requirement and enhance the cell-edge QoS and the coverage. The percentage user in outage rate is low, at around 11.63; this ideal value obtained is due to the advantage of the number of sites obtained using mmWave frequencies in the planning process, which allow the user to be served closer to the BS. Thus, the upcoming 5G network will be comfortable with a high number of BSs. Table 6 shows the results obtained for 38 GHz. The results demonstrate that the site density increases to archive the same coverage as 28 GHz [36].

6. Conclusions

In this paper, we studied the deployment of BSs problem in 5G heterogeneous networks with the use of mmWave frequencies, and we aimed to satisfy user data rates requirement with the minimum required number of BSs without compromising the user QoS while taking into account intercell interference. In the developed approach, we proposed to use PSO, and we compared it with the well-known SA algorithm. The model proposed in this investigation used the high spectrum bands for wireless mobile network deployment, which is not previously suitable. It is expected that meta-heuristics will become a promising solution for the complex optimization problems of 5G wireless communication systems. Our results indicate that (1) the use of mmWave is a capable solution for high data rates requirement and (2) PSO gives better performance as compared to SA in both 28 GHz and 38 GHz by considering the adjustment for link budget and propagation model. Further, the Monte Carlo simulation to measure the outage rate given the placement of the base stations determined in the planning phase. Our proposed BSs deployment can be rated as one of the first complete solutions capable of high data rates in mmWave for 5G environments using meta-heuristics algorithms. We expect that this work will be useful to meet the future challenge in 5G network deployment when using mmWave frequencies while satisfying user QoS.

Author Contributions

Conceptualization, H.G.(Hassana Ganame) and H.G.(Hakim Ghazzai); methodology, H.G.; software, H.G.(Hassana Ganame) and H.G.(Hakim Ghazzai); writing—original draft preparation, H.G.(Hassana Ganame) and D.K.; writing—review and editing, L.Y. and H.G.(Hakim Ghazzai); supervision, L.Y.; funding acquisition, L.Y.

Funding

This research was funded by Wuhan National Laboratory for Optoelectronics.

Conflicts of Interest

The authors declare no conflict of interest.

References

  1. Wymeersch, H.; Seco-Granados, G.; Destino, G.; Dardari, D.; Tufvesson, F. 5G mmWave positioning for vehicular networks. IEEE Wirel. Commun. 2017, 24, 80–86. [Google Scholar] [CrossRef]
  2. Bergren, S. Design Considerations for a 5G Network Architecture. arXiv 2017, arXiv:1705.02902. [Google Scholar]
  3. El-Beaino, W.; El-Hajj, A.M.; Dawy, Z. On Radio network planning for next generation 5G networks: A case study. In Proceedings of the 2015 International Conference on Communications, Signal Processing, and their Applications (ICCSPA’15), Sharjah, United Arab, 17–19 Febrary 2015; pp. 1–6. [Google Scholar]
  4. Mesodiakaki, A.; Adelantado, F.; Antonopoulos, A.; Alonso, L.; Verikoukis, C. Energy and spectrum efficient user association in 5G heterogeneous networks. In Proceedings of the 27th Annual International Symposium on Personal, Indoor, and Mobile Radio Communications (PIMRC), Valencia, Spain, 4–8 September 2016; pp. 1–6. [Google Scholar]
  5. Tsai, C.-W.; Cho, H.-H.; Shih, T.K.; Pan, J.-S.; Rodrigues, J.J. Metaheuristics for the deployment of 5G. IEEE Wirel. Commun. 2015, 22, 40–46. [Google Scholar] [CrossRef]
  6. Ghazzai, H.; Yaacoub, E.; Alouini, M.-S.; Dawy, Z.; Abu-Dayya, A. Optimized LTE cell planning with varying spatial and temporal user densities. IEEE Trans. Veh. Technol. 2014, 65, 1575–1589. [Google Scholar] [CrossRef]
  7. Anthony, S. 5G Specs Announced: 20 Gbps Download, 1 ms Latency, 1M Devices Per Square km. Ars Tech. 2017, 24, 2017. [Google Scholar]
  8. Wang, C.X.; Haider, F.; Gao, X.; You, X.H.; Yang, Y.; Yuan, D.; Aggoune, H.M.; Haas, H.; Fletcher, S.; Hepsaydir, E. Cellular architecture and key technologies for 5G wireless communication networks. IEEE Commun. Mag. 2014, 52, 122–130. [Google Scholar] [CrossRef]
  9. Bogale, T.E.; Le, L.B. Massive MIMO and mmWave for 5G wireless HetNet: Potential benefits and challenges. IEEE Veh. Technol. Mag. 2016, 11, 64–75. [Google Scholar] [CrossRef]
  10. Renzo, M.D.; Haas, H.; Ghrayeb, A.; Sugiura, S.; Hanzo, L. Spatial modulation for generalized MIMO: Challenges, opportunities and implementation. Process. IEEE 2014, 102, 56–103. [Google Scholar] [CrossRef]
  11. Milosevic, V.; Jokanovic, B.; Boric-Lubecke, O.; Lubecke, V.M. Key Microwave and Millimeter Wave Technologies for 5G Radio. In Powering the Internet Things 5G Netw; IGI Global: Hershey, PA, USA, 2018; pp. 70–104. Available online: https://www.igi-global.com/chapter/key-microwave-and-millimeter-wave-technologies-for-5g-radio/185922 (accessed on 18 January 2019).[Green Version]
  12. Checko, A.; Holm, H.; Christiansen, H. Optimizing small cell deployment by the use of C-RANs. In Proceedings of the European Wireless 2014—20th European Wireless Conference, Barcelona, Spain, 14–16 May 2014; pp. 1–6. [Google Scholar]
  13. Agiwal, M.; Roy, A.; Saxena, N. Next generation 5G wireless networks: A comprehensive survey. IEEE Commun. 2016, 18, 1617–1655. [Google Scholar] [CrossRef]
  14. Yaacoub, E.; Dawy, Z. LTE radio network planning with HetNets: BS placement optimization using simulated annealing. In Proceedings of the 17th IEEE Mediterranean Electrotechnical Conference (MELECON), Beirut, Lebanon, 13–16 April 2014; pp. 327–333. [Google Scholar]
  15. Gonzalez-Brevis, P.; Gondzio, J.; Fan, Y.; Poor, H.V.; Thompson, J.; Krikidis, I.; Chung, P.J. Base station location optimization for minimal energy consumption in wireless networks. In Proceedings of the Vehicular Technology Conference (VTC Spring), Yokohama, Japan, 15–18 May 2011; pp. 1–5. [Google Scholar]
  16. Zhou, L.; Sheng, Z.; Wei, L.; Hu, X.; Zhao, H.; Wei, J.; Leung, V.C. Green cell planning and deployment for small cell networks in smart cities. Ad Hoc Netw. 2016, 43, 30–42. [Google Scholar] [CrossRef]
  17. Amine, O.M.; Sylia, Z.; Selia, K.; Mohamed, A. Optimal base station location in LTE heterogeneous network using non-dominated sorting genetic algorithm II. Int. J. Wirel. Mobile Comput. 2018, 14, 328–334. [Google Scholar] [CrossRef]
  18. Liang, X.; Liu, H.; Wang, Q. 4G heterogeneous networks base station planning using evolutionary multi-objective algorithm. In Proceedings of the 2015 11th International Conference on Computational Intelligence and Security (CIS), Shenzhen, China, 19–20 December 2015; pp. 248–252. [Google Scholar]
  19. Liu, S.-J.; Tsai, C.-W. An effective search algorithm for hyper-dense deployment problem of 5g. Procedia Comput. Sci. 2018, 141, 151–158. [Google Scholar] [CrossRef]
  20. Ghazzai, H.; Farooq, M.J.; Alsharoa, A.; Yaacoub, E.; Kadri, A.; Alouini, M.-S. Green networking in cellular hetnets: A unified radio resource management framework with base station on/off switching. IEEE Trans. Veh. Technol. 2016, 66, 5879–5893. [Google Scholar] [CrossRef]
  21. Cai, S.; Che, Y.; Duan, L.; Wang, J.; Zhou, S.; Zhang, R. Green 5G heterogeneous networks through dynamic small-cell operation. IEEE J. Sel. Areas Commun. 2016, 34, 1103–1115. [Google Scholar] [CrossRef]
  22. Park, Y.; Heo, J.; Kim, H.; Wang, H.; Choi, S.; Yu, T.; Hong, D. Effective small cell deployment with interference and traffic consideration. In Proceedings of the 2014 IEEE 80th Vehicular Technology Conference (VTC2014-Fall), Vancouver, BC, Canada, 14–17 September 2014; pp. 1–5. [Google Scholar]
  23. Gazda, J.; Šlapak, E.; Bugár, G.; Horváth, D.; Maksymyuk, T.; Jo, M. Unsupervised Learning Algorithm for Intelligent Coverage Planning and Performance Optimization of Multitier Heterogeneous Network. IEEE Access 2018, 6, 39807–39819. [Google Scholar] [CrossRef]
  24. Qutqut, M.H.; Abou-zeid, H.; Hassanein, H.S.; Rashwan, A.M.; Al-Turjman, F.M. Dynamic small cell placement strategies for LTE heterogeneous networks. In Proceedings of the 2014 IEEE Symposium on Computers and Communications (ISCC), Funchal, Portugal, 23–26 June 2014; pp. 1–6. [Google Scholar]
  25. Ikeda, Y.; Kawahara, R.; Saito, H. Homology-based metaheuristics for cell planning with macroscopic diversity using sector antennas. In Proceedings of the 2015 IEEE International Conference on Communications (ICC), London, UK, 8–12 June 2015; pp. 3442–3447. [Google Scholar]
  26. Jaziri, A.; Nasri, R.; Chahed, T. System-level analysis of heterogeneous networks under imperfect traffic hotspot localization. IEEE Trans. Veh. Technol. 2016, 65, 9862–9872. [Google Scholar] [CrossRef]
  27. Rezaabad, A.L.; Beyranvand, H.; Salehi, J.A.; Maier, M. Ultra-dense 5G small cell deployment for fiber and wireless backhaul-aware infrastructures. IEEE Trans. Veh. Technol. 2018, 67, 12231–12243. [Google Scholar] [CrossRef]
  28. Baldemair, R.; Irnich, T.; Balachandran, K.; Dahlman, E.; Mildh, G.; Selén, Y.; Parkvall, S.; Meyer, M.; Osseiran, A. Ultra-dense networks in millimeter-wave frequencies. IEEE Commun. Mag. 2015, 53, 202–208. [Google Scholar] [CrossRef]
  29. Santos, R.; Ghazzai, H.; Kassler, A. Optimal Steerable mmWave Mesh Backhaul Reconfiguration. In Proceedings of the 2018 IEEE Global Communications Conference (GLOBECOM), Abu Dhabi, UAE, 9–13 December 2018; pp. 1–7. [Google Scholar]
  30. Ding, M.; Lopez-Perez, D.; Claussen, H.; Kaafar, M.A. On the Fundamental Characteristics of Ultra-Dense Small Cell Networks. IEEE Netw. 2018, 32, 92–100. [Google Scholar] [CrossRef]
  31. Viering, I.; Dottling, M.; Lobinger, A. A Mathematical Perspective of Self-Optimizing Wireless Networks. In Proceedings of the 2009 IEEE International Conference on Communications, Dresden, Germany, 14–18 June 2009; pp. 1–6. [Google Scholar]
  32. Myung, H.G.; Goodman, D.J. Single Carrier FDMA: A New Air Interface for Long Term Evolution; John Wiley & Sons: Hoboken, NJ, USA, 2008; Volume 8, Available online: https:// books.google.com/books?hl=en&lr=&id=Dotsv0dfH7kC&oi=fnd&pg=PR5&dq=Myung,+H.G.%3B+Goodman,+D.J.+Single+Carrier+FDMA:+A+New+Air+Interface+for+Long+Term+Evolution%3B+John+Wiley+%26+Sons:+2008+%3B+Volume+8&ots=fIj62Kxkxy&sig=7sMFnfl9FqmJN8S2_GminSAnkWA#v=onepage&q&f=false (accessed on 10 January 2019).
  33. Flickenger, R. Wireless Networking in the Developing World: A Practical Guide to Planning and Building Low-Cost Telecommunications Infrastructure; Hacker Friendly LLC: Seattle, WA, USA, 2007. [Google Scholar]
  34. Pedersen, G.F. COST 231-Digital mobile radio towards future generation systems. In Cost 231-Digital Mobile Radio Towards Future Generation Systems; EU: Aslborg, Denmark, 1999; pp. 92–96. Available online: https:// vbn.aau.dk/en/publications/cost-action-231-digital-mobile-radio-towards-future-generation-sy (accessed on 7 March 2019).
  35. Rappaport, T.S.; Sun, S.; Mayzus, R.; Zhao, H.; Azar, Y.; Wang, K.; Wong, G.N.; Schulz, J.K.; Samimi, M.; Gutierrez, F. Millimeter Wave Mobile Communications for 5G Cellular: It Will Work! IEEE Access 2013, 1, 335–349. [Google Scholar] [CrossRef]
  36. Rappaport, T.S.; Xing, Y.; MacCartney, G.R.; Molisch, A.F.; Mellios, E.; Zhang, J. Overview of Millimeter Wave Communications for Fifth-Generation (5G) Wireless Networks—With a Focus on Propagation Models. IEEE Trans. Antennas Propag. 2017, 65, 6213–6230. [Google Scholar] [CrossRef]
  37. Matalatala, M.; Deruyck, M.; Tanghe, E.; Martens, L.; Joseph, W. Performance Evaluation of 5G Millimeter-Wave Cellular Access Networks Using a Capacity-Based Network Deployment Tool. Mob. Inf. Syst. 2017, 2017, 3406074. [Google Scholar] [CrossRef]
  38. Leinonen, M.E.; Destino, G.; Kursu, O.; Sonkki, M.; Parssinen, A. 28 GHz Wireless Backhaul Transceiver Characterization and Radio Link Budget. ETRI J. 2018, 40, 89–100. [Google Scholar] [CrossRef] [Green Version]
  39. Amaldi, E.; Capone, A.; Malucelli, F. Planning umts base station location: Optimization models with power control and algorithms. IEEE Trans. Wirel. Commun. 2003, 2, 939–952. [Google Scholar] [CrossRef]
  40. Han, J.K.; Park, B.S.; Choi, Y.S.; Park, H.K. Genetic approach with a new representation for base station placement in mobile communications. In Proceedings of the IEEE 54th Vehicular Technology Conference, Atlantic City, NJ, USA, 7–11 October 2001; pp. 2703–2707. [Google Scholar]
  41. Yangyang, Z.; Chunlin, J.; Ping, Y.; Manlin, L.; Chaojin, W.; Guangxing, W. Particle swarm optimization for base station placement in mobile communication. In Proceedings of the International Conference on Networking, Sensing and Control, Taipei, Taiwan, 21–23 March 2004; pp. 428–432. [Google Scholar]
  42. Kumar, G.; Ranga, V. Meta-heuristic solution for relay nodes placement in constrained environment. In Proceedings of the 2017 Tenth International Conference on Contemporary Computing (IC3), Noida, India, 10–12 August 2017; pp. 1–6. [Google Scholar]
  43. Blondin, J. Particle Swarm Optimization: A Tutorial. Available online: http://cs.armstrong.edu/saad/csci8100/psotutorial (accessed on 3 April 2009).
  44. Richards, M.; Ventura, D. Choosing a starting configuration for particle swarm optimization. In Proceedings of the 2004 IEEE International Joint Conference on Neural Networks (IEEE Cat. No.04CH37541), Budapest, Hungary, 25–29 July 2004; pp. 2309–2312. [Google Scholar]
  45. Xue, B.; Zhang, M.; Browne, W.N. Particle swarm optimization for feature selection in classification: A multi-objective approach. IEEE Trans. Cybern 2013, 43, 1656–1671. [Google Scholar] [CrossRef]
  46. Zhang, Y.; Wang, S.; Ji, G. A Comprehensive Survey on Particle Swarm Optimization Algorithm and Its Applications. Math. Probl. Eng. 2015, 2015, 931256. [Google Scholar] [CrossRef]
  47. Eberhart, R.; Simpson, P.; Dobbins, R. Computational Intelligence PC Tools; Academic Press Professional, Inc.: San Diego, CA, USA, 1996; Available online: https:// dl.acm.org/citation.cfm?id=236603 (accessed on 20 March 2019).
  48. Hendtlass, T. Particle Swarm Optimisation and high dimensional problem spaces. In Proceedings of the 2009 IEEE Congress on Evolutionary Computation, Trondheim, Norway, 18–21 May 2009; pp. 1988–1994. [Google Scholar]
  49. Sharma, A.; Lucini, B.A. Inclusión Digital en América Latina y el Caribe; Boston, USA, 2016; Available online: https://www.gsmaintelligence.com/research/?file=bc2039b5cc86be21d1299ba3a7b1bde2&download (accessed on 28 December 2018).
  50. MacCartney, G.R.; Zhang, J.; Nie, S.; Rappaport, T.S. Path loss models for 5G millimeter wave propagation channels in urban microcells. In Proceedings of the 2013 IEEE Global Communications Conference (GLOBECOM), Atlanta, GA, USA, 9–13 December 2013; pp. 3948–3953. [Google Scholar] [CrossRef]
  51. Nagaraj, P. Impact of Atmospheric Impairments on mmWave based Outdoor Communication. arXiv 2018, arXiv:1806.05176. [Google Scholar]
  52. Al-Hourani, A.; Chandrasekharan, S.; Kandeepan, S. Path loss study for millimeter wave device-to-device communications in urban environment. In Proceedings of the 2014 IEEE International Conference on Communications Workshops (ICC), Sydney, NSW, Australia, 10–14 June 2014; pp. 102–107. [Google Scholar]
  53. Faragó, Á.; Kántor, P.; Bitó, J.Z. Rain Effects on 5G millimeter Wave ad-hoc Mesh Networks Investigated with Different Rain Models. Period. Polytech. Electr. Eng. Comput. Sci. 2016, 60, 44–50. [Google Scholar] [CrossRef] [Green Version]
  54. Recommendation, ITU-R P. 838: Specific Attenuation Model for Rain for Use in Prediction Methods; Geneva, Switzerland, 2005; Volume 3, Available online: https:// www.itu.int/dms_pubrec/itu-r/rec/p/R-REC-P.838-3-200503-I!!PDF-E.pdf (accessed on 29 May 2018).
  55. Recommendation ITU-R P. 676–10, Attenuation by Atmospheric Gases; International Telecommunications Union: Madrid, Spain, 2013; Available online: https://www.itu.int/dms_pubrec/itu-r/rec/p/R-REC-P.676-10-201309-S!!PDF-E.pdf (accessed on 29 May 2013).
  56. Rodriguez, I.; Nguyen, H.C.; Sorensen, T.B.; Elling, J.; Holm, J.A.; Mogensen, P.; Vejlgaard, B. Analysis of 38 GHz mmWave propagation characteristics of urban scenarios. In Proceedings of the European Wireless 2015—21th European Wireless Conference, Budapest, Hungary, 20–22 May 2015; pp. 1–8. [Google Scholar]
  57. Sulyman, A.I.; Nassar, A.T.; Samimi, M.K.; MacCartney, G.R.; Rappaport, T.S.; Alsanie, A. Radio propagation path loss models for 5G cellular networks in the 28 GHZ and 38 GHZ millimeter-wave bands. IEEE Commun. Mag. 2014, 52, 78–86. [Google Scholar] [CrossRef]
  58. Meng, Y.S.; Lee, Y.H. Investigations of foliage effect on modern wireless communication systems: A review. Prog. Electromagn. Res. 2010, 105, 313–332. [Google Scholar] [CrossRef]
  59. Dalela, C. Tuning Of Cost-231 hata Model for Radio Wave Propagation Predictions. Comput. Sci. Eng. Appl. 2012, 10, 255–267. [Google Scholar]
  60. Xu, X.; Saad, W.; Zhang, X.; Xu, X.; Zhou, S. Joint Deployment of Small Cells and Wireless Backhaul Links in Next-Generation Networks. IEEE Commun. Lett. 2015, 19, 2250–2253. [Google Scholar] [CrossRef] [Green Version]
  61. Technical Feasibility of IMT in Bands Above 6 GHz; Report ITU-R M.2376-0; International Telecommunications Union: Geneva, Switzerland, 2015; Available online: https://www.itu.int/dms_pub/itur/opb/rep/R-REP-M.2376-2015-PDF-E.pdf (accessed on 3 June 2019).
Figure 1. Millimeter wave (MmWav)e network model architecture. UE: User equipment; UP: User plan; CP: Control plan; UMa: Macro base station (BS); UMi: Micro BS.
Electronics 08 01318 g001
Figure 2. General process of particle swarm optimization (PSO).
Electronics 08 01318 g002
Figure 3. Atmospheric gas and rain attenuation variation with frequencies (figure collected from [54,55]).
Electronics 08 01318 g003
Figure 4. Comparison between PSO and SA in 5G planning at 28 GHz with urban micro-cells (UMi) standalone deployment architecture. (a) and (b) represent the results obtained for PSO and SA, respectively. Users are represented by black dots, whereas red squares represent UMi.
Electronics 08 01318 g004aElectronics 08 01318 g004b
Figure 5. Comparison between PSO and SA in 5G planning at 28 GHz with overlay deployment architecture. (a) and (b) represent the results for PSO and SA, respectively. Urban macro-cells (Uma) are represented by black squares, whereas UMi are represented by red squares; BSs sector represented by an arrow.
Electronics 08 01318 g005
Figure 6. Convergence speed comparison for (a) PSO and (b) SA with eight agents.
Electronics 08 01318 g006
Figure 7. 5G planning at 38 GHz with overlay deployment architecture. UMa are represented by black squares, whereas UM1 are represented by red squares and BSs sector is represented by an arrow.
Electronics 08 01318 g007
Table 1. Parameters notations and their corresponding description.
NotationDescription
C B Set of combined UMa and UMi
S M ,   S N Set of candidate BS, UMa and UMi, respectively
u user
A R i Surface occupied by one BS
A R T Total surface of geographical area
Z c o v Number of BSs for coverage constraint
Z c a p Number of BSs for data rates constraint
Z U B S Number of user supported by each BS
Z B S Required number of BS to satisfy the problem
Z c a p s e c Available cell capacity
Z s e c Number of sector antenna
ϑ D R data rates satisfaction point
μ ,   θ Tolerance to relax the data rates and coverage constraints respectively
G Initial population number
Z h Number of agents ( Particles)
τ Iteration
Table 2. 5G link budget parameters for mmWave at 28 GHz.
ParametersValues
Carrier frequency (GHz)28
Channel Bandwidth (GHz)1
TX antenna Gain (dBi)27
TX power (dBm)30
EIRP (dBm)57
TX Noise Figure (dB)7
RX power (dBm)23
RX antenna Gain (dBi)10
RX Noise figure (dB)7
Target data rates (Mbit/s)500
RX noise floor (dBm)−72.73
Thermal Noise (dBm/Hz)−174
Atmospheric attenuation (dB/Km)0.06
Rain attenuation (dB/Km)3.45
Foliage losses (dB)4.34
Penetration losses (dB)28
Others losses (dB)10
Table 3. Summary of important simulation parameters for PSO and simulated annealing (SA).
ParameterValue
Tolerance μ and θ 99%
Maximum velocity V m a x 200
Maximum iteration2000
Accelerations c 1 = c 2 2
Table 4. Performance comparison (PSO vs. SA) in different user distribution for 5G network planning at 28 GHz.
Meta-Heuristic AlgorithmsPSOSA
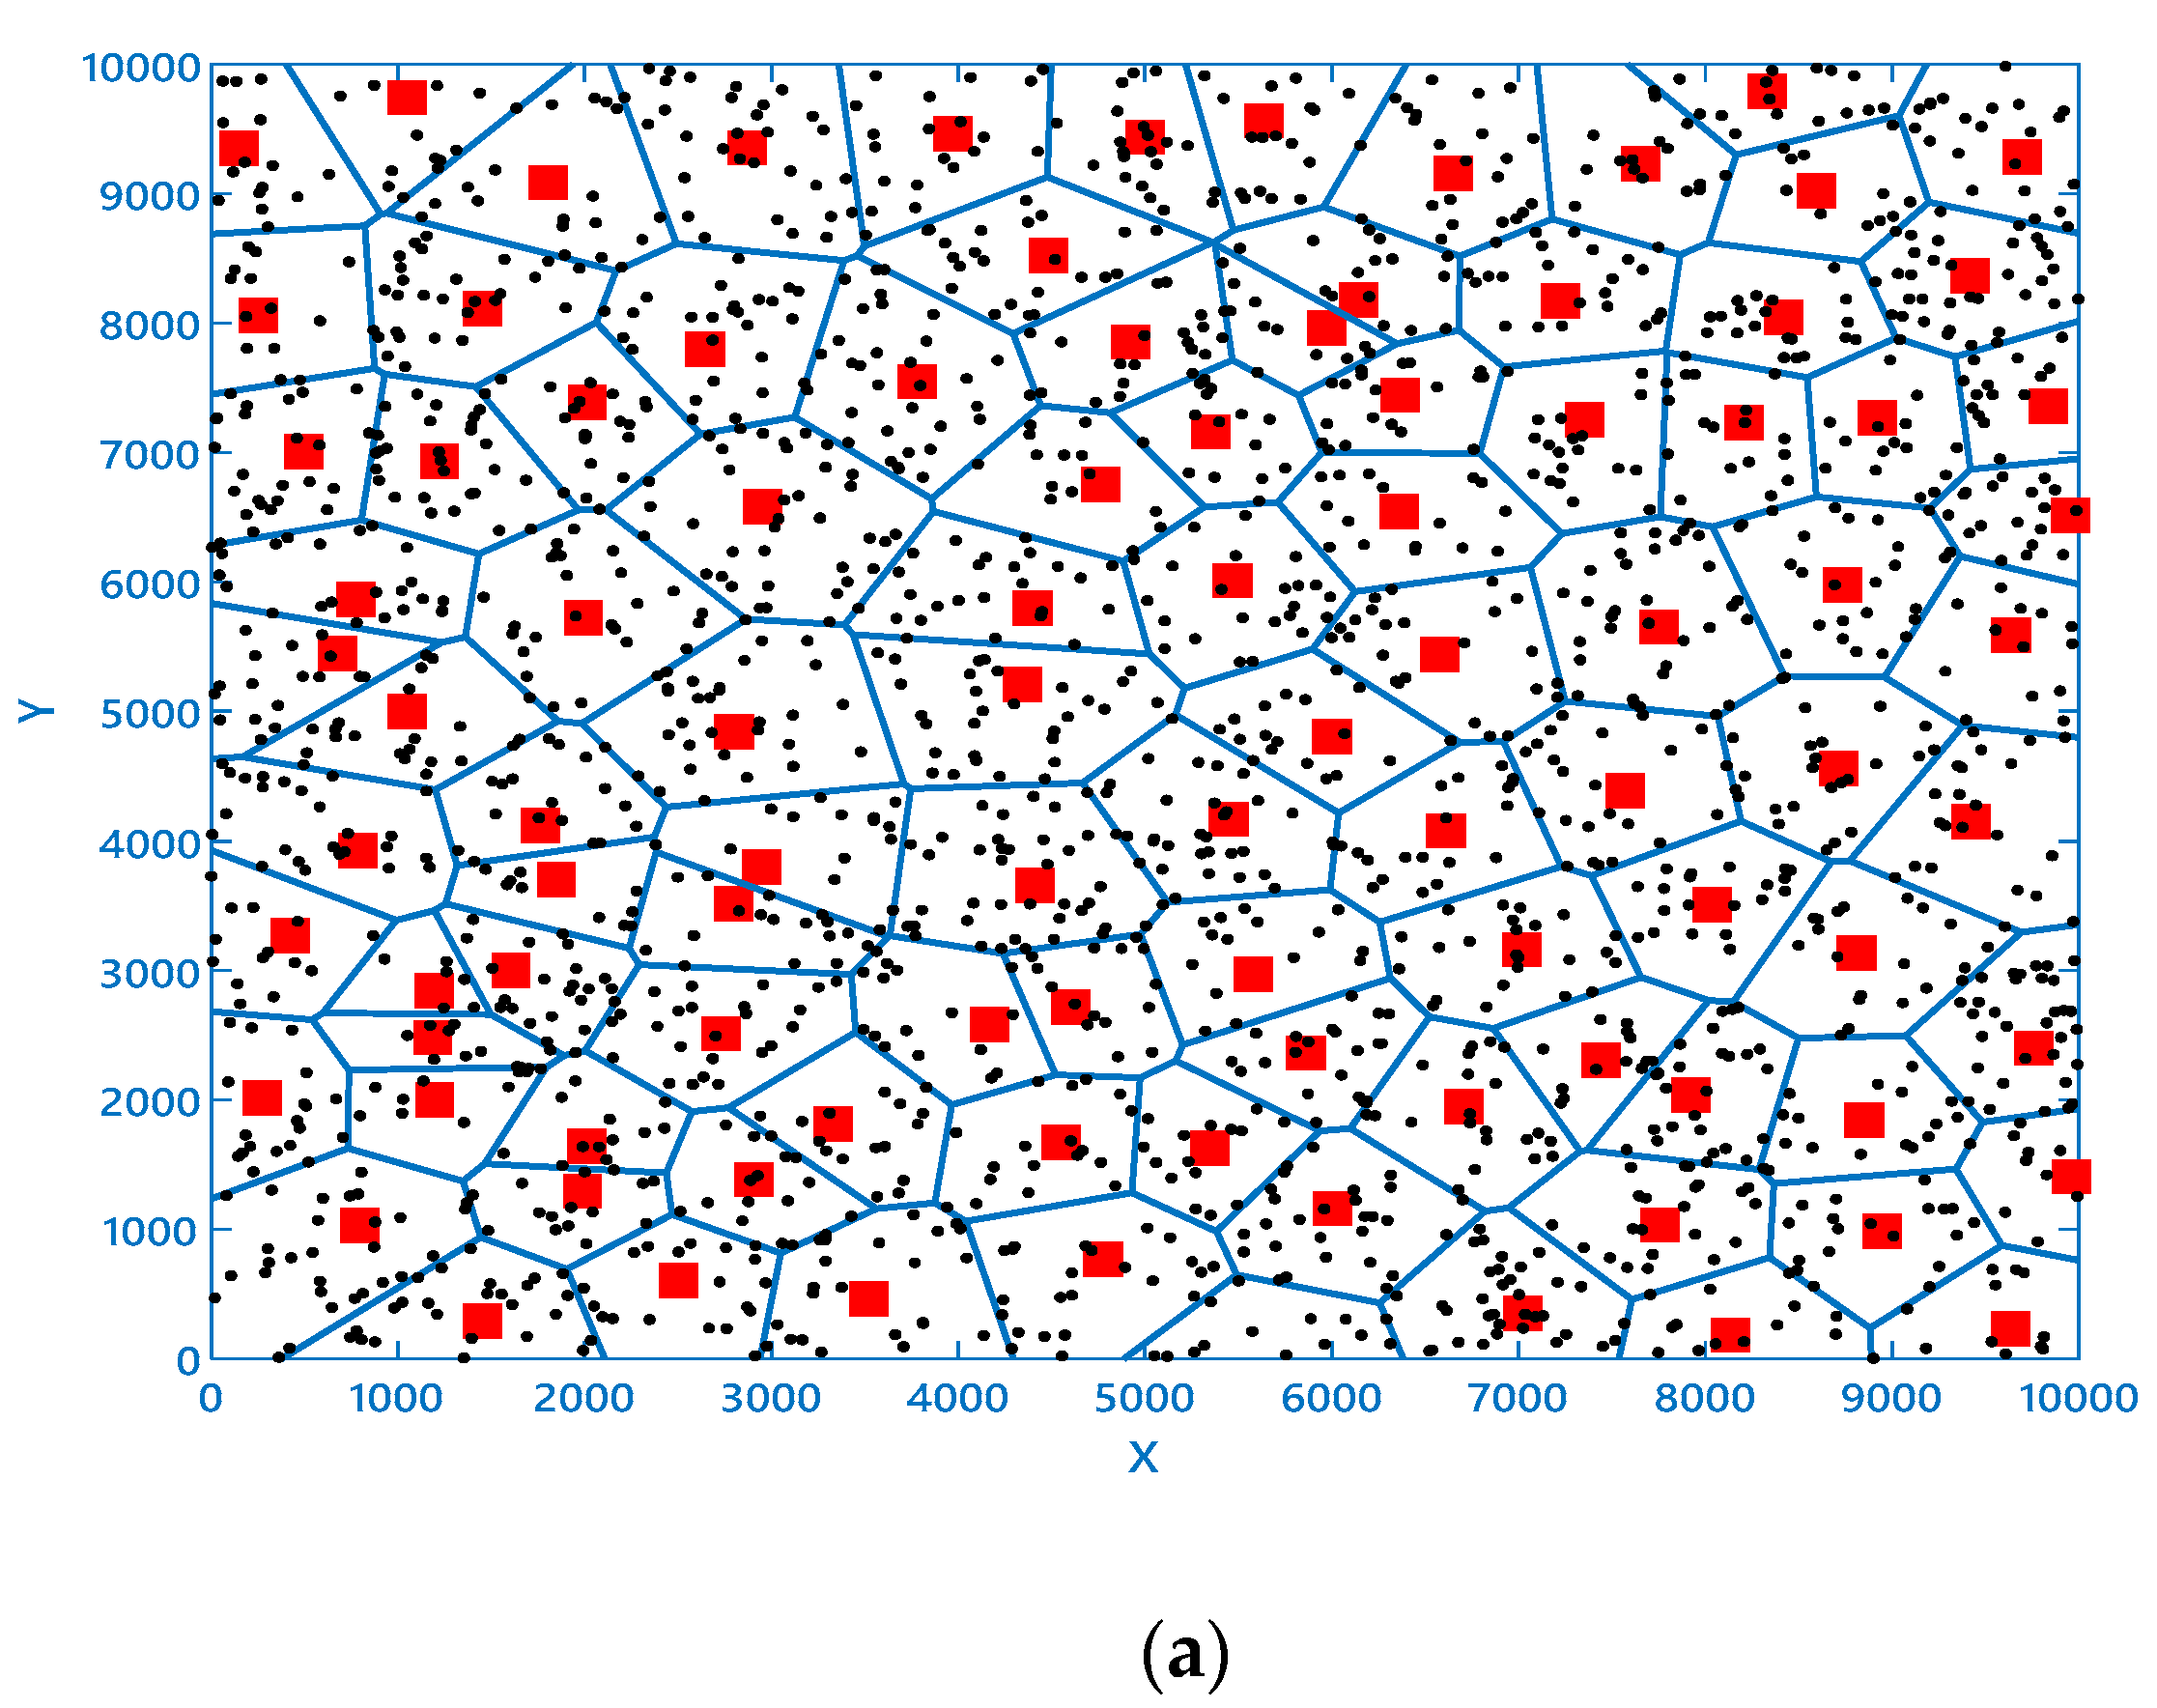
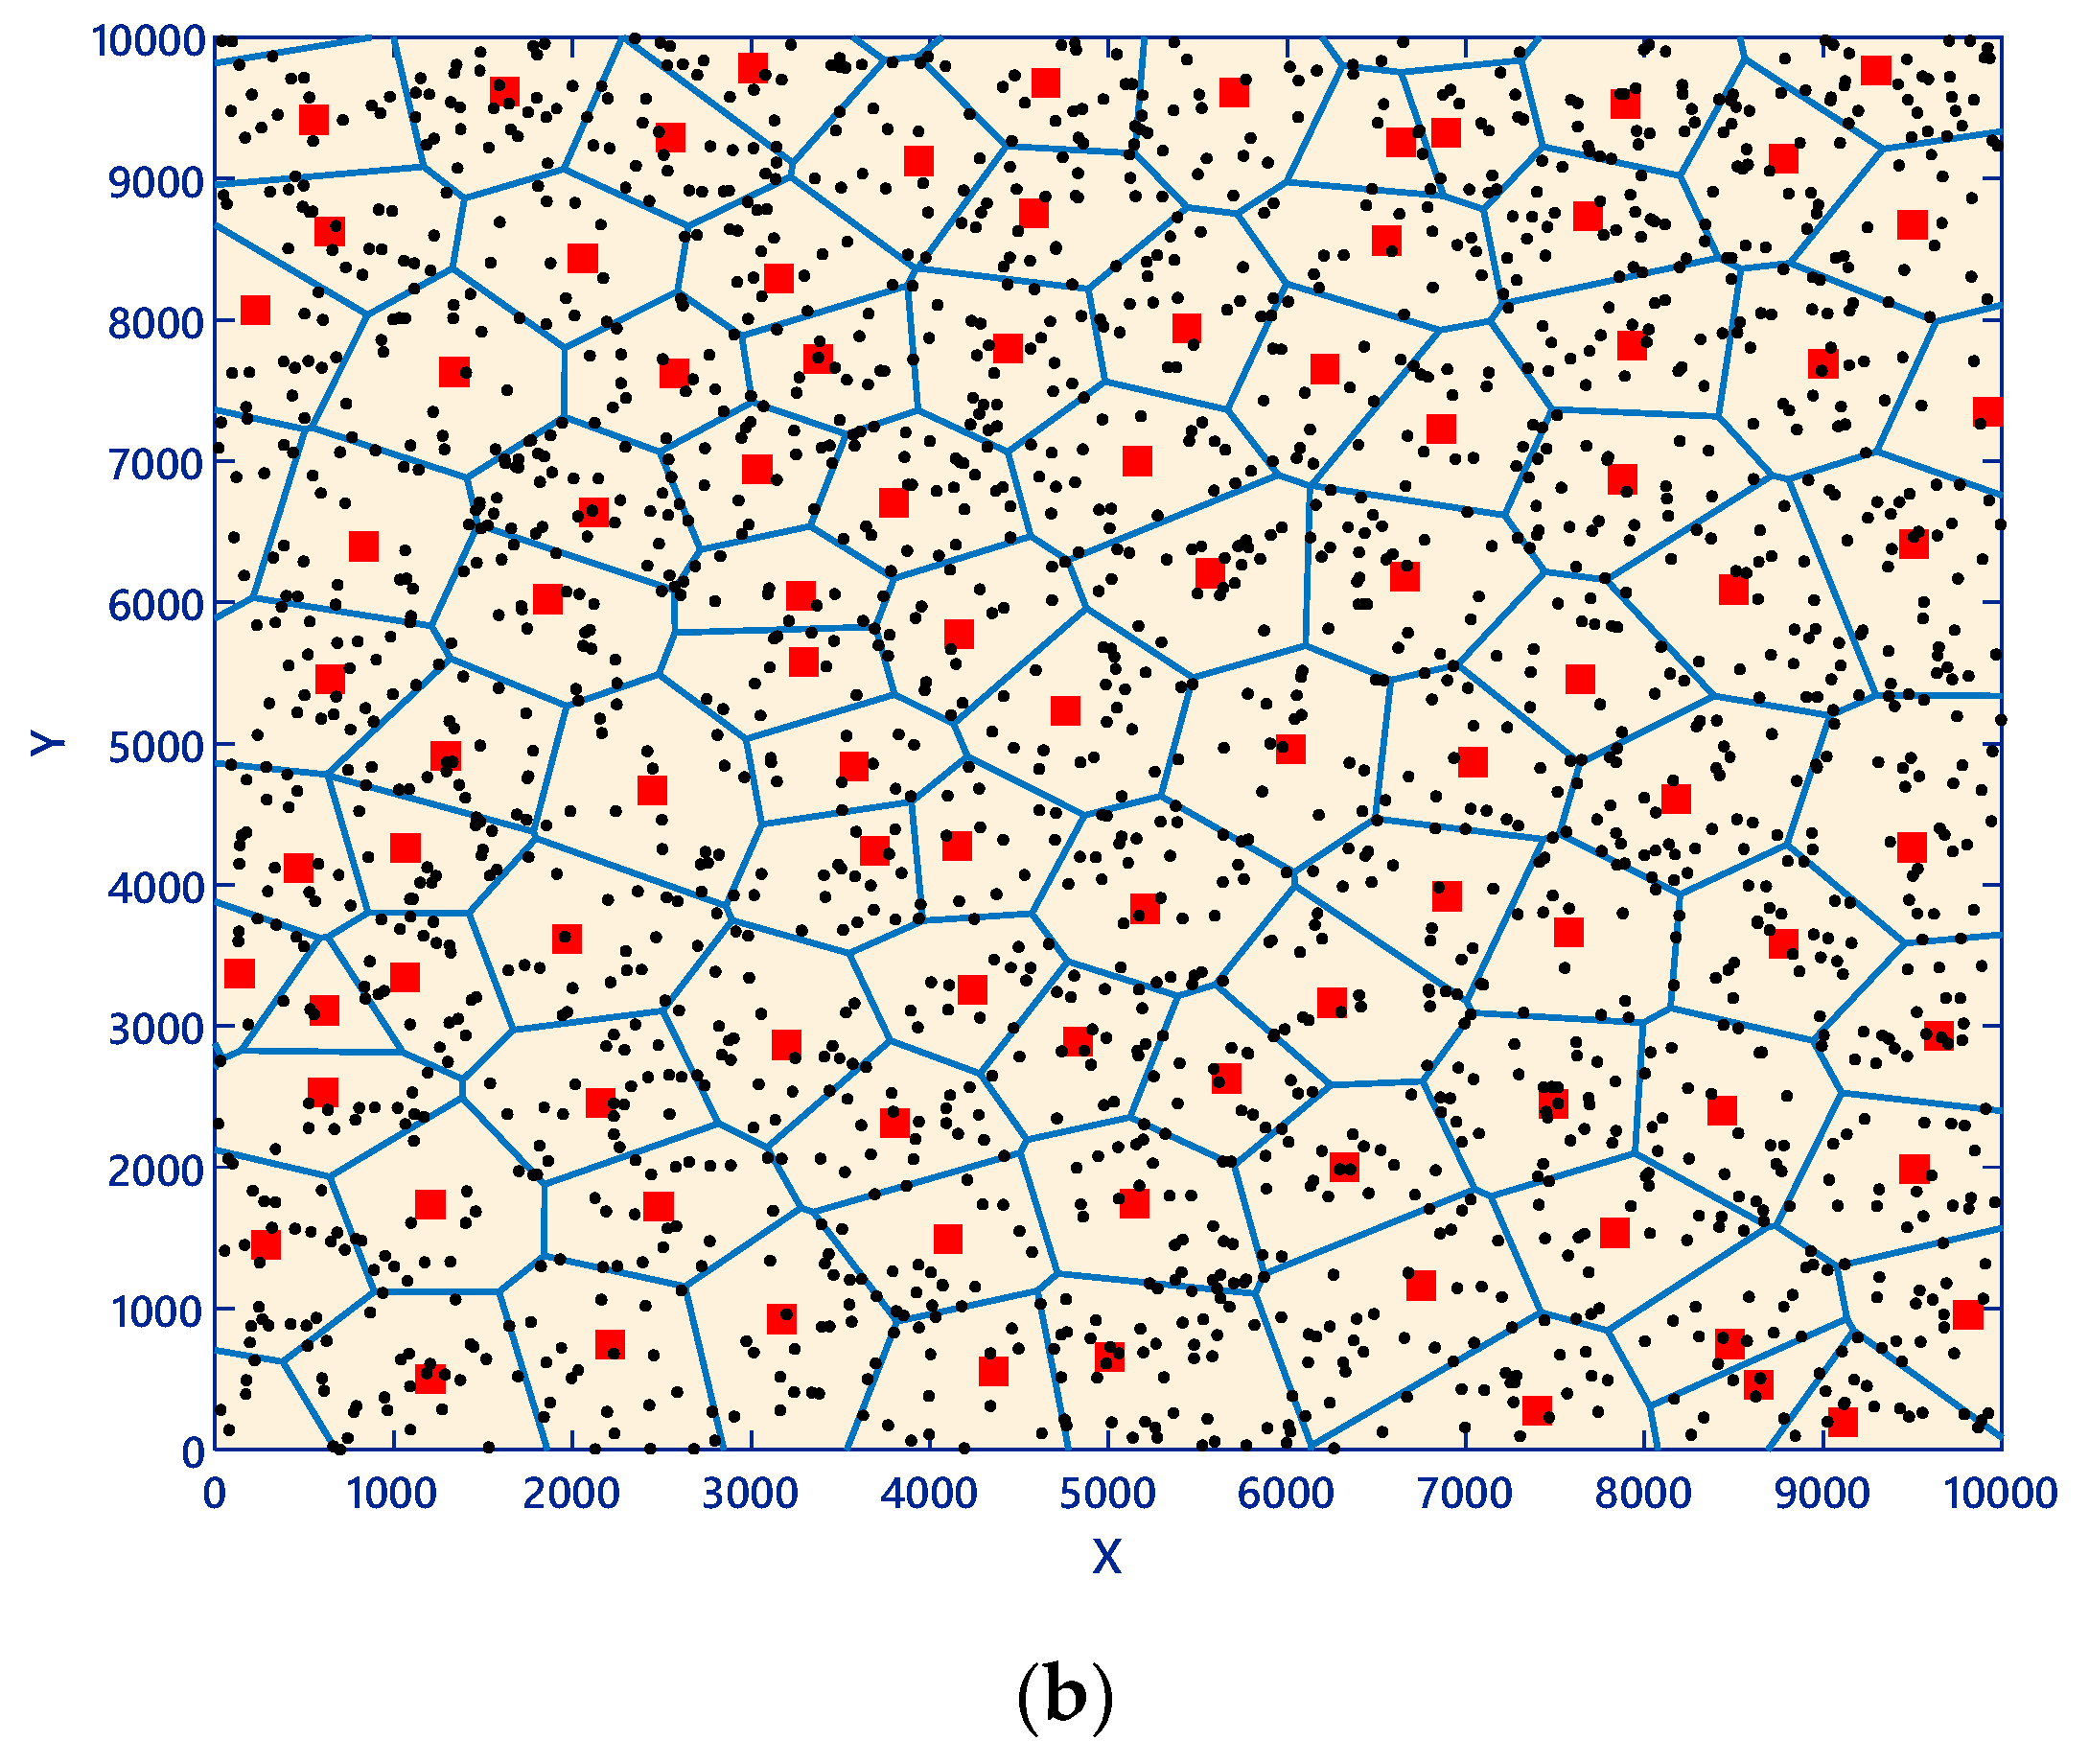
Scenario I: The area is uniformly distributed, with standalone deployment architecture
Number of users2000
Initial number of BSs104104
Redundant BSs52
Z B S 99102
Coverage98%98%
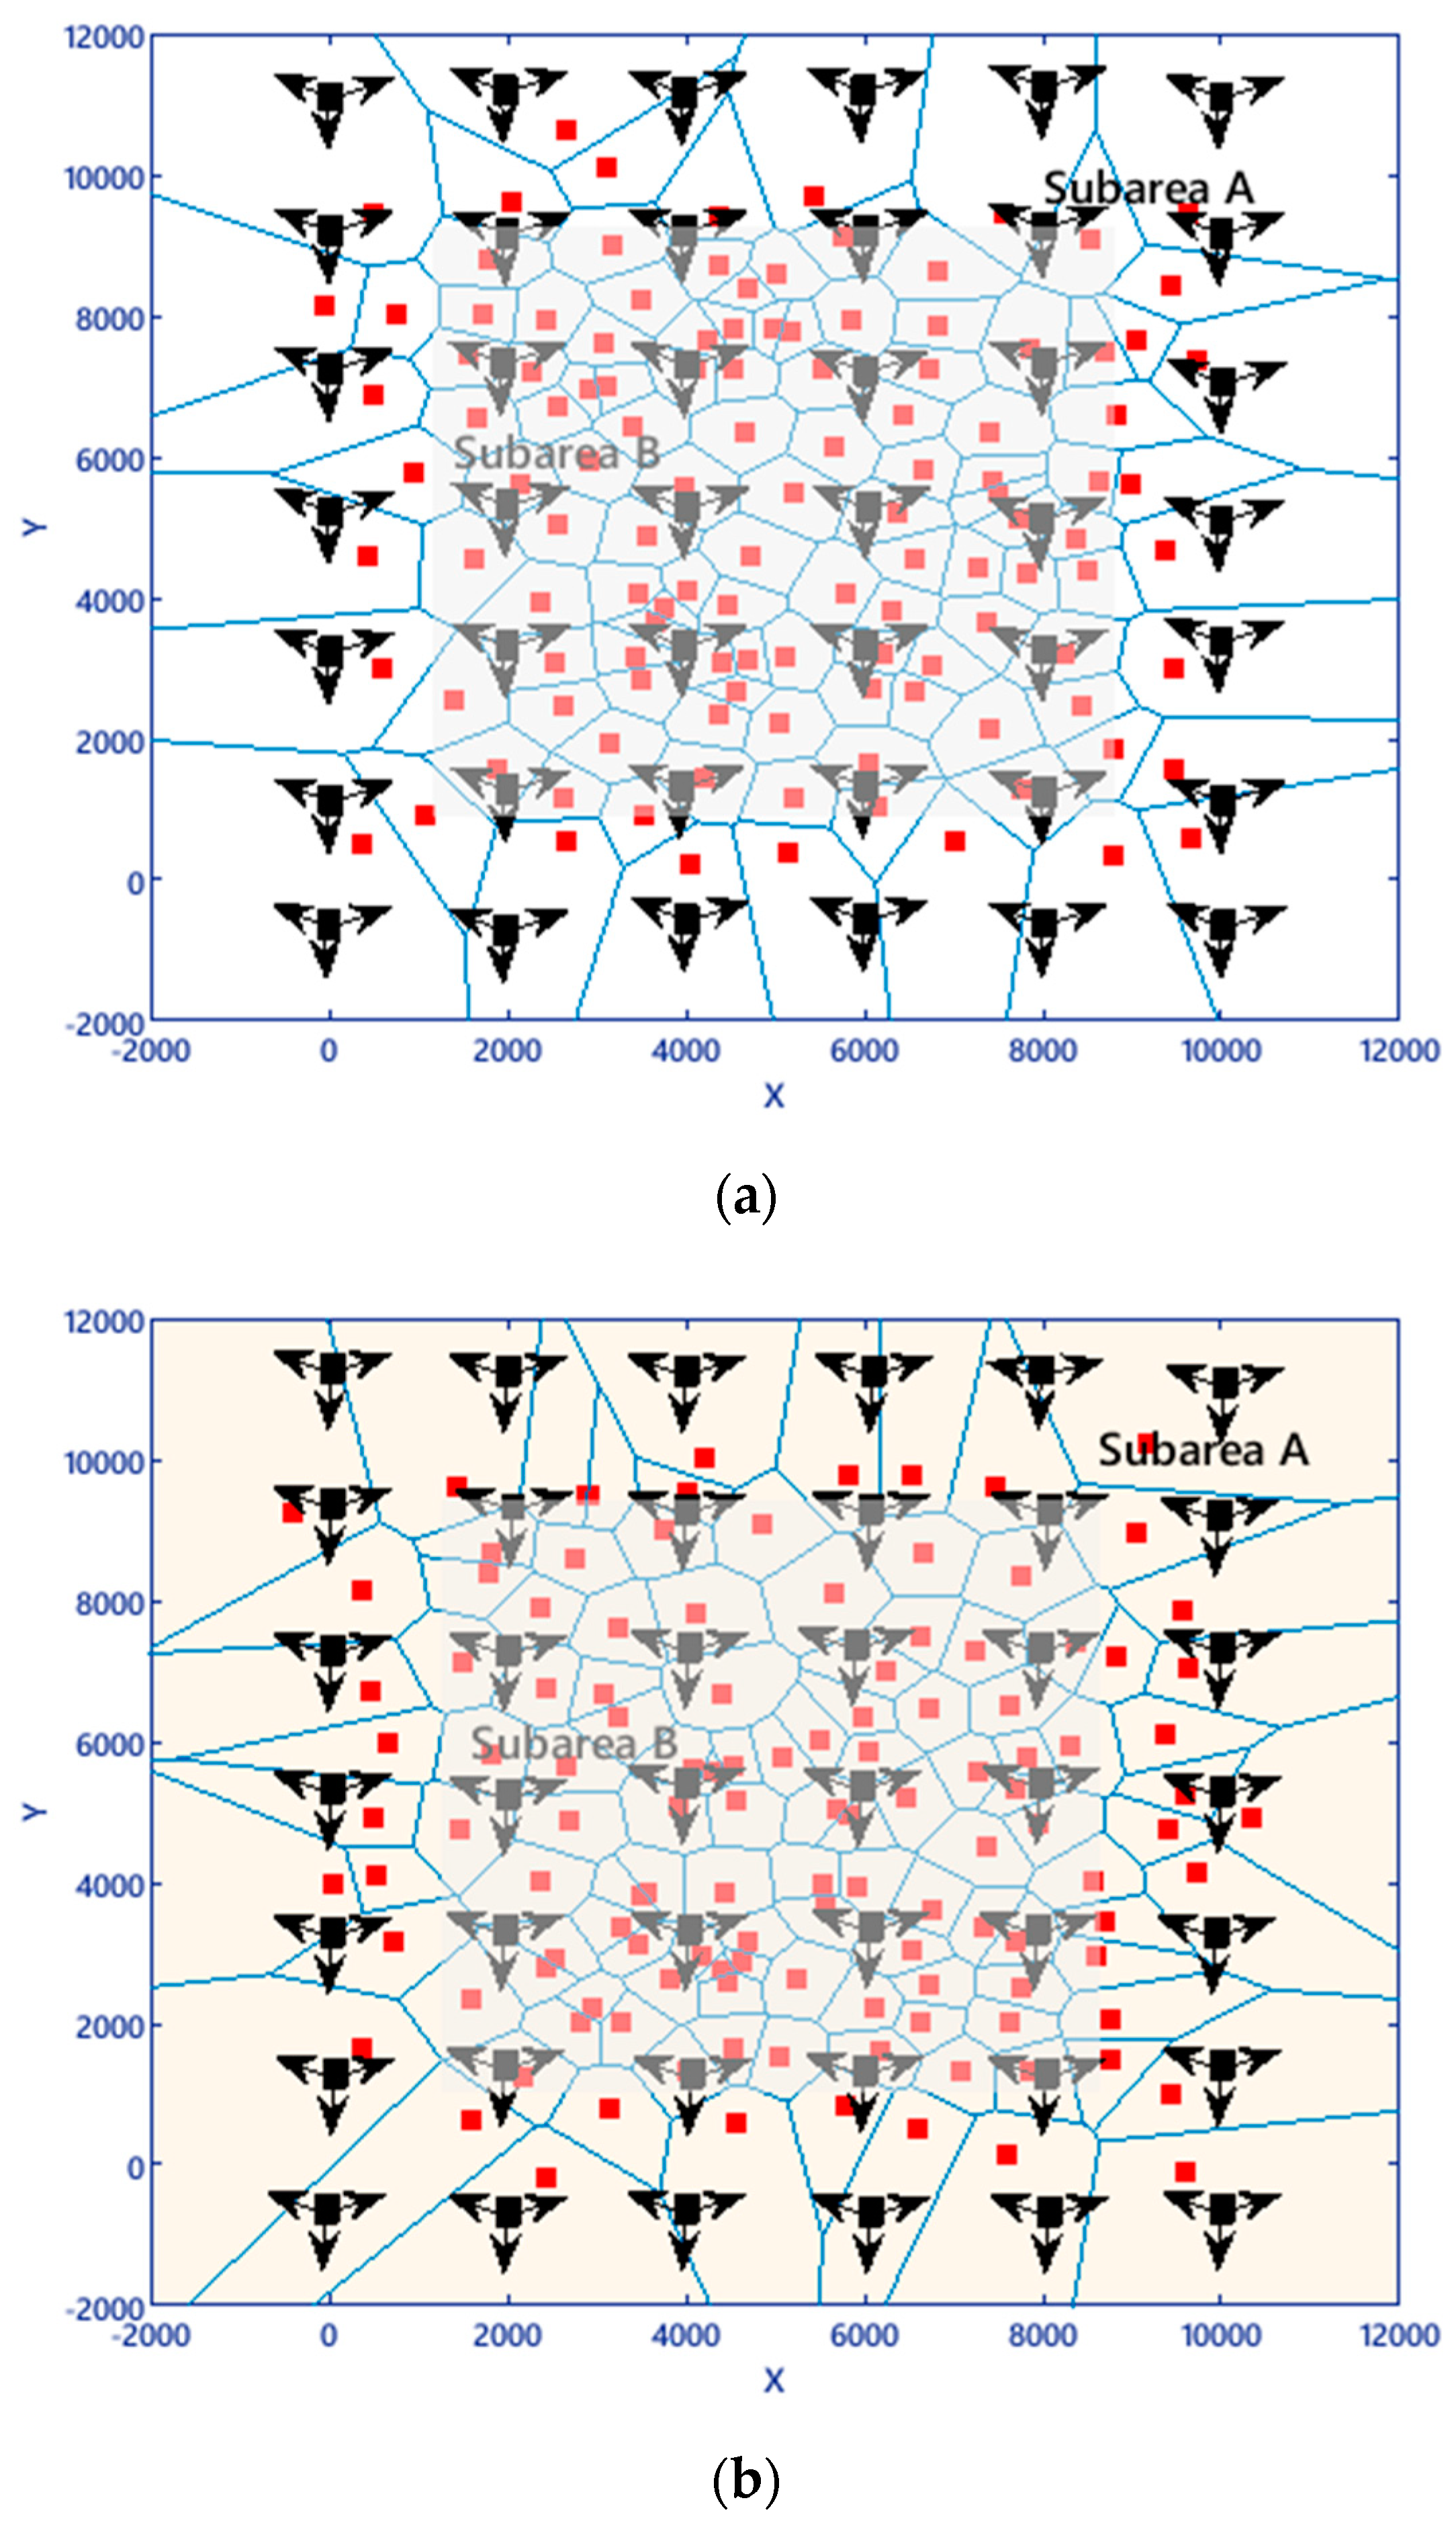
Scenario II: The area is divided into two subareas. The subarea A is uniformly distributed (40% of users) and subarea B normally distributed (60% of users), overlay deployment architecture.
Number of users3000
UMaUMiUMaUMi
Initial number of BSs4212742127
Redundant BSsStandalone0603
Combined01
Z B S 163165
Coverage98%98%
Table 5. Metrics comparison (PSO vs. genetic algorithm (GA) vs. SA) for 2000 iterations.
MetricsCoverage EfficiencyOutage ProbabilitySite DensityCPU Time (Second)
PSO98%0.1257%1633010.39
GA98%0.1298%1674250.96
SA98%0.1301%1655360.48
Table 6. Performance evaluation in different user distribution for 5G network planning at 38 GHz.
Meta-Heuristic AlgorithmPSO at 38 GHz
Scenario III: The subarea A is uniformly distributed (40% of users) and subarea B normally distributed (60% of users), in an overlay deployment architecture.
Number of users3000
UMaUMi
Initial number of BSs42359
Redundant BSsStandalone08
Combined03
Z B S 390
Coverage98%

