Article

Incremental Low Rank Noise Reduction for Robust Infrared Tracking of Body Temperature during Medical Imaging

by
Bardia Yousefi
1,†,
Hossein Memarzadeh Sharifipour
1,
Mana Eskandari
1,
Clemente Ibarra-Castanedo
1,
Denis Laurendeau
1,
Raymond Watts
2,
Matthieu Klein
3 and
Xavier P. V. Maldague
1,*
1
Computer Vision and System Laboratory (CVSL), Department of Electrical and Computer Engineering, Laval University, Quebec City, QC G1V 0A6, Canada
2
RT Thermal Co., 7167 Elkhorn Drive, West Palm Beach, FL 33411, USA
3
Visiooimage Inc., 2560, Rue Lapointe, Sainte-Foy, Quebec City, QC G1W 1A8, Canada
*
Author to whom correspondence should be addressed.
Current address: Department of Radiology, University of Pennsylvania, Philadelphia, PA 19104, USA.
Electronics 2019, 8(11), 1301; https://doi.org/10.3390/electronics8111301
Submission received: 21 September 2019 / Revised: 1 November 2019 / Accepted: 4 November 2019 / Published: 7 November 2019
(This article belongs to the Special Issue Design and Application of Biomedical Circuits and Systems)

Abstract

:
Thermal imagery for monitoring of body temperature provides a powerful tool to decrease health risks (e.g., burning) for patients during medical imaging (e.g., magnetic resonance imaging). The presented approach discusses an experiment to simulate radiology conditions with infrared imaging along with an automatic thermal monitoring/tracking system. The thermal tracking system uses an incremental low-rank noise reduction applying incremental singular value decomposition (SVD) and applies color based clustering for initialization of the region of interest (ROI) boundary. Then a particle filter tracks the ROI(s) from the entire thermal stream (video sequence). The thermal database contains 15 subjects in two positions (i.e., sitting, and lying) in front of thermal camera. This dataset is created to verify the robustness of our method with respect to motion-artifacts and in presence of additive noise (2–20%—salt and pepper noise). The proposed approach was tested for the infrared images in the dataset and was able to successfully measure and track the ROI continuously (100% detecting and tracking the temperature of participants), and provided considerable robustness against noise (unchanged accuracy even in 20% additive noise), which shows promising performance.

1. Introduction

Thermographic applications in medicine have been increasing over past years [1,2,3] and a great variety of research has been conducted in different fields of medicine such as pain diagnosing and treatment monitoring [4], breast cancer [5], psychology [6], dentistry [7], avian flu [8], and many other applications. The application of thermography focuses on medical prevention and monitoring particularly during radiology imaging, where external measurement tools could be the source of a risk for the health of patients ([9,10,11,12,13]). An infrared tracking tool is proposed with robustness against noise to tracking body temperature and is applicable to patients during medical imaging and can be used for different modalities in radiology (one good example is functional magnetic resonance imaging (fMRI) [14], or recording devices such as electroencephalogram (EEG) during fMRI [15] and MRI [16,17,18]).
Medical imaging provides vital information from patients and plays a big role in diagnosis and prognosis of diseases. Among all medical imaging modalities, magnetic imaging [19,20] avoids exposure to X-ray radiation [21] and involves no side-effects for the human body. However, there are some reported cases of burning or issues for some patients with implants (e.g., metal or breast implants [22,23]). Metallic materials, chips, foreign objects such as artificial joints, prosthetic devices, pacemakers, metallic bone plates, and surgical clips can considerably affect the MRI imaging. In addition, heart pacemakers, metal implants or metal clips in (or even around) the patient’s eyes cannot be scanned by MRI due to the risk of metal objects movement in the magnetic field. This involves bullet fragments, artificial heart valves, metallic ear implants, insulin pumps and even chemotherapy patients. There are some cases of joint pain (hip joint) and tenderness, rib cage pain from fibrosing disease called Nephrogenic Systemic Fibrosis (NSF).
One of the most probable issue is related to the adjustment of radiology instruments that is not properly tuned for the patient. Electromagnetic exposure of the patient’s body has some biological effects which can be categorized as thermal effects and non-thermal effects [24]. These effects are due to direct energy transformation to living tissues and is associated with the frequency of the field [25]. Applying heating to the human body has different effects, and mostly depends on its sensitivity [26,27]. For example, permanent cosmetics and tattoos on the skin with metallic pigments (i.e., iron oxide) may cause first or second degree burns on a patient’s body [28,29,30]. To alleviate such burns, dosimetric parameters are commonly used as a safety standard, specially for the absorption rate (e.g., specific absorption rate (SAR)) [31]. The standard level of SAR is approximately equivalent to an increase in scanning temperature of 0.6 °C for 20–30 min time duration [32,33,34], which prevents hot spot occurrence [35,36]. There are very few systems for early detection or prevention of such burns problem. There is no possibility to insert a probe in the body since all metal is prohibited on the body during the scanning. However, these complications can never overshadow the significance of medical imaging as these instruments play vital role in diagnosis, and prognostic of diseases. Nevertheless, the issue of over-heating remains partially unsolved. The objective of this research is to determine and track the overheating spots using an infrared imaging system during radiology examination. There are some similar approaches involving the tracking of body temperature (e.g., [37]) using a particle filter to track the selected the region of interest (ROI) [38] or combined with a Kalman filter to mitigate the effect of noise in tracking and thermal measurements [39] in the human body. The proposed approach creates a thermal dataset from several volunteers in a lying position (similar to radiology imaging environments) in front of thermal camera. For every frame, a color based segmentation of the ROI was performed in the thermal image. Then, this region fed to a particle filter to track it throughout the stream. Noise is an important problem which aggravates the performance in such systems. Several research studies have been conducted to reduce or model noise in thermal imagery (e.g., [40,41,42]). The proposed approach can monitor and observe the body temperature from a distance (with initial calibration) which eliminates the possibility of direct contact with the patient while tracking the temperature. Moreover, it implements a noise reduction approach which renders our system more robust against environmental noise. The proposed system was challenged by additive noise to a thermal image dataset created by 15 participants and achieved a very promising performance. This paper starts with stating the problem. Then a brief review on burning and dermatological effects is described next. The possibility of a 3D reconstruction of the patients in visible imaging is discussed afterwards. Section 2 describes the methodology for the incremental low rank noise reduction and tracking system, and is followed by the presentation of experimental results (Section 3). We discuss the challenges and advantages of the approach in Section 4. Finally, we conclude and describe future work in Section 5.

3D Analysis

For analysis of the human body temperature, a 3D thermal model of the body can be constructed during MRI exposure (a visible 3D reconstruction is shown in Figure 1). By 3D analysis of the infrared image, the thermal 3D model of the body allows the overheating points to be detected. In this section, a brief review of 3D processing analysis is presented. The human body is a living organism which has changes in internal factors and external form and is constantly in motion. These variations involve many factors such as pose shifts, fluid distributions in the body, sway, respiration and occlusion which create many limitations and difficulties in the topology of the body. Scattering properties, skin pigmentation and especially the radiology gown are considered as limitations that create problems in accurate measurement. The use of infrared images helps to overcome the mentioned difficulties. However, infrared images have their limits and face their own barriers. An explanation of the indoor thermal radiation environment in the human body has been analyzed through 3D modeling of the human body in some poses and situations [43].
A 3D X-ray microtomography image analysis of low density wood fiberboard has been conducted. It was used for the prediction and modeling of local densification with material behaviour under radiation exposure [44]. The study in 3D visualization of fiber is not limited to this investigation and has been studied in greater detail (for example [45]). There is another application of 3D reconstruction using thermal images for detection of infection in the skin of patients. An integration of 3D and high resolution far-infrared FIR thermal images of the body has been used for 3D structural binocular profilometer [46]. Research on jet fuels toxicity concerning skin damage measured by 900 MHz skin microscopy has been conducted. The authors applied three-dimensional spatial visualization that can show the skin structure and help draw conclusion regarding the toxicity [47].
Many medical image processing research studies have been conducted on 3D visualization of limbs and tissues under MRI scanning. The structural anatomy which has been considered by some 3D applications can be summarized as follows: vertebrae and Spin; Skull and brain (head); general, hip joint, femur, tibia, knee joint (limbs); perineum, entire (pelvis); heart, ribs, entire (thorax) [48]. Most research work on 3D (or even 2D) in biomedical image analysis adding the following areas: patient motion tracking, patient positioning (radiotherapy), arteriovenous malformation (radio-surgery), embolization, shunt angioplasty (vascular interventional radiology), neck, head, and spine, procedures which are invasive (neuroradiology interventional), replacement of hip and knee, total arthroplasty hip (orthopedic surgery), knee kinematics (kinematic study) with benefits for radiosurgery and radiotherapy applications [48]. A 3D building construction using Infrared thermography images and real images has been presented [49] which is not categorized in medical image analysis but the idea is valuable in terms of the potential applications.
Applying an oriented scheme cubic for co-registration of the practical geometry of medical parts of the human body using points and 3-plane has been presented based on localization properties and fusion of MR, computed tomography (CT) and positron emission tomography (PET) images for creating a 3D model [50]. The model includes images fused across modalities of PET+MR, CT+MR, PET+CT, MR+CT+PET and has been tested on patients for detectability of tumors with significant results. However, no thermal images or skin visualization was done. A very relevant research work regarding 3D surface thermal image construction has been conducted for energy auditing which gives a 3D surface temperature model [51]. This work is relevant however it was done for nonliving objects. Applying this technique to humans would make it a very useful system for relevant applications. Siewert et al. (2014) present a method for the analysis of body temperature in pig skin using thermal infrared images. This approach has used the averaging value of the temperature for both ROI (from two anatomical regions in IR images) to reduce noise [52]. One of the drawbacks of 3D reconstruction of the patient during imaging besides the difficulties of setting points as references, relates to reconstruction of 3D with thermal imaging. After camera calibration, a 3D object using two (or more) photos from different angles (limited angles, e.g., less that 90 degree) is reconstructed by following steps:
  • Registration of depth to RGB (in order to align depth map with RGB image)
  • Applying speeded up robust features speeded up robust features (SURF) [53] to both images to find keypoints;
  • Comparing keypoints’ descriptors to find most similar points
  • Estimating the required rotation and translation matrices to register keypoints pairs using iterative closest points (ICP) [54]
  • Performing the transformations and calculating the final 3D coordinates
  • Accumulating the 3D coordinates and their colors in the final point cloud matrix
  • Visualize the point cloud using point cloud library (PCL) [55].
These steps were implemented in two phases, the first phase was to generate a 3D model of an object using a left view (first image) and a right view (second image) of the object. Then, to reconstruct a more detailed 3D model using an image sequence captured by a Kinect camera while it was moving in front of the patient with limited angle. Figure 1 presents an example of making 3D model of a patient (participant) using a Kinect camera with limited degree of freedom designed for installation in front of imaging system. The information of depth and visible was used to reconstructed 3D images applying speeded up robust features (SURF), finding most similar key-points, using iterative closest points (ICP), and point cloud library (PCL) for visualization.

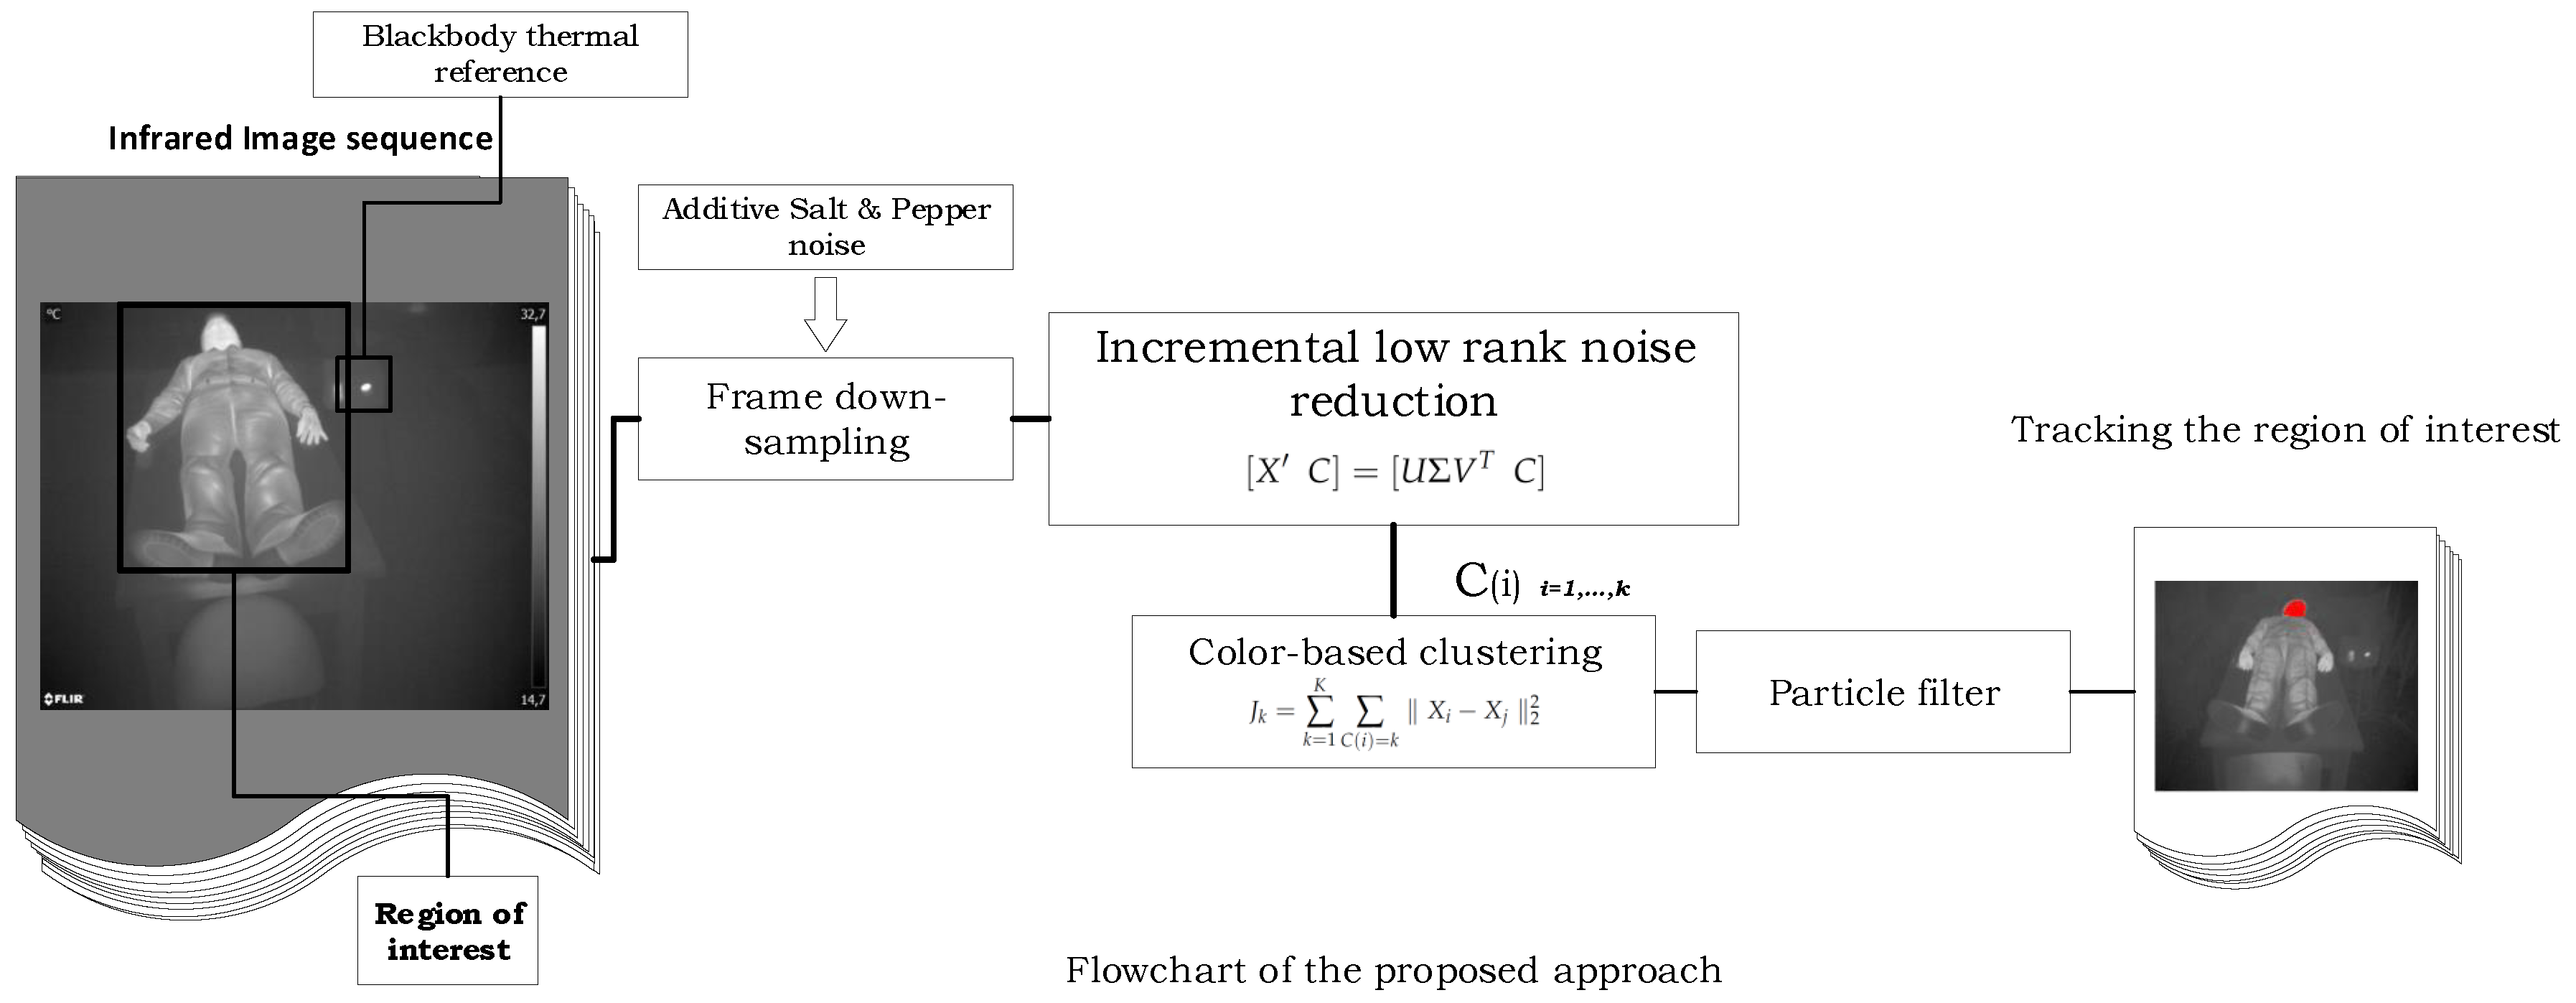
2. Incremental Low Rank Robust Tracking

The necessity of employing the thermal infrared system to monitor thermal changes for medical applications was discussed in the previous section. Here, the proposed method for monitoring the thermal variations is presented (Figure 2). The process begins with lower rank noise reduction and then an automatic detection of the ROI.

2.1. Low Rank Noise Reduction

Due to the nature of the process involving thermal cameras, the presence of noise in the thermal images seems inevitable. The sensitivity of the acquisition also depends on the acquisition conditions which may decrease the Signal to Noise Ratio (SNR) in the system.
Let X be an input matrix which has dimension p × q where p is the number of frames and q is the vector corresponding to each image ( q = i m a g e h e i g h t ( m ) × i m a g e w i d t h ( n ) ). The Singular Value Decomposition (SVD) [56] gives a bilinear factoring of input matrix X, ( X = U Σ V T ) which can be shown to decrease the rank by r and ultimately reduce the noise level as the noise’s eigenvectors correspond to the lower eigenvalues in Σ . The mentioned process can described as follows:
X ( p × q ) S V D r U p × r Σ r × r V r × q T , r m i n ( p , q )
For higher r in low-rank representation, the data is represented in a more explanatory form due to noise reduction ( X ).

2.2. Incremental SVD

Performing the low rank noise reduction by SVD Equation (1) for the purpose of video processing and possible online system enforces the SVD to function incrementally. Incremental SVD [57] can handle randomly missing and incomplete or uncertain data. It is potentially an efficient robust subspace projection. We already have the eigenvalue decomposition of X ( U Σ V T ) and for the additional matrix C to the previous data (X), we have:
[ X C ] = [ U Σ V T C ]
[ U ( 1 U U T ) C / M ] Σ Y 0 M V 0 0 1 T
[ U Ψ ] Σ Y 0 M V 0 0 1 T
Equations (2) and (3) are representing the procedure of adding the additional matrix C (as a new infrared image from the stream) added into previous decomposition (X representing the components from the previous batch of infrared images). Where ( I U U T ) C = C U L , Y = U T C and M Ψ T T where Ψ is an orthogonal basis of T. Applying QR-decomposition (QR of an orthogonal matrix Q and an upper triangular matrix R), there will be T Q R Ψ M . In the Equation (3), the middle matrix is denoted as Q and must be updated and diagonalized to lead to the answer for the whole process. In the case of adding a single vector c = C the computation speed is increased by calculating the vector ψ = Ψ = ( c U U T c ) / m and scalar c T c 2 Y T Y + ( U Y ) T ( U Y ) m . First m M , m Σ , m / m U , and V 1 and is then updated by iteration for the above mentioned calculations with truncation [58]. In the proposed approach, the initial data matrix is constructed using initial frames and after noise reduction, the additional frame (c) is added to the current data ( X ) to complete the process.

2.3. Clustering and Tracking

After noise reduction for the initialization of the particle filter, a color based K-means clustering [38,59] is used. Here, a brief review of the kernelled K-means [60] is presented. Let S = X 1 , , X n R p be our observation set (p) and dissimilarities are calculated by X i X j 2 2 for X i R p and K is the number of clusters. Clustering of the data X is nothing more than a function C assigning every observation X i to a set of k 1 , , K . The minimization of the following formula is required:
J k = k = 1 K C ( i ) = k X i X j 2 2
Let X = 1 / n i = 1 n X i and C ( i ) = k means that X i is assigned to group k. A different observation here is closely related to a different color base X. The color based clustering determines the ROI and is labelled using the reference temperature provided by the blackbody during the experiment or in thermal calibration process (one time for all). Tracking these labels is done using a particle filter which is similar to the previously presented approaches [38]. The function updates the ROI and concentrates the particles within the video stream.

2.4. Particle Filter

Clustering analysis detects and groups hot-spots and then a particle filter tracks these hot-spots with temperature updates and thermal expansion during imaging occurs (experiment). The robustness of tracking algorithm plays an important role due to presence of thermal fluctuations and noise (which is suppressed by the propose algorithm). Particle filter tracking algorithm [61,62] is employed for tracking and adaptation of thermal variations ( [63,64,65]), and provides a reasonably robust system within thermal imaging stream. The following assumptions have been considered for the tracking algorithm:
-
Thermal images are gray scale (0,255) corresponds to cold and hot representation;
-
Thermal camera’s field of view (FOV) always has ROI;
-
The ROI’s temperature is higher than the surrounding temperature;
-
The ROI does not have a particular shape and is adjustable in the algorithm with the respect to thermal increases (elevating image intensity);
-
The ROI updates during the experiment (simulating medical test) and temperature updates by an upward trend to find hot spots which are cause of the burning in patients.
Particle filter performs in time t and approximates tracking the target recursively by a finite set of posterior distribution weighted samples. Particle filters simulate the class filters for approximating random variables recursively. Let α t | Y t = ( y 1 , y 2 , , y t ) be the random variables and α t 1 , , α t M are particles, which have discrete probability mass of π t 1 , , π t M . Points for variable approximation are shown by f ( α t | Y t ) and for π t j are assumed to be equal to 1 / M , which is the preferred amount of M for particles to approximate the density value of α t | Y t . It is noticeable that particles are located in the ROI, which is previously defined, and incrementally updated throughout experiment (medical exam). The discrete support is used as true density and provides an approximation of density prediction using particle support and empirical prediction:
f ^ ( α t + 1 | Y t ) = j = 1 M f ^ ( α t + 1 | α t j ) π t j
Mixture of echoes while the filtering proceed and density. This provides the following modification on previous equation:
f ^ ( α t + 1 | Y t + 1 ) f ^ ( y t + 1 | α t + 1 ) j = 1 M f ^ ( α t + 1 | α t j ) π t j
The above-mentioned equation is an approximation of true density filtering. New particles are produced α t + 1 1 , , α t + 1 M with weights π t + 1 1 , , π t + 1 M and this iterates throughout thermal imaging stream, which includes online tracking problems and an estimation of one-step-ahead density f ( y t + 1 | Y t ) . This is relevant to updates of the ROI and spreading of hot spots during radiology exam ( [61,66]).

3. Results

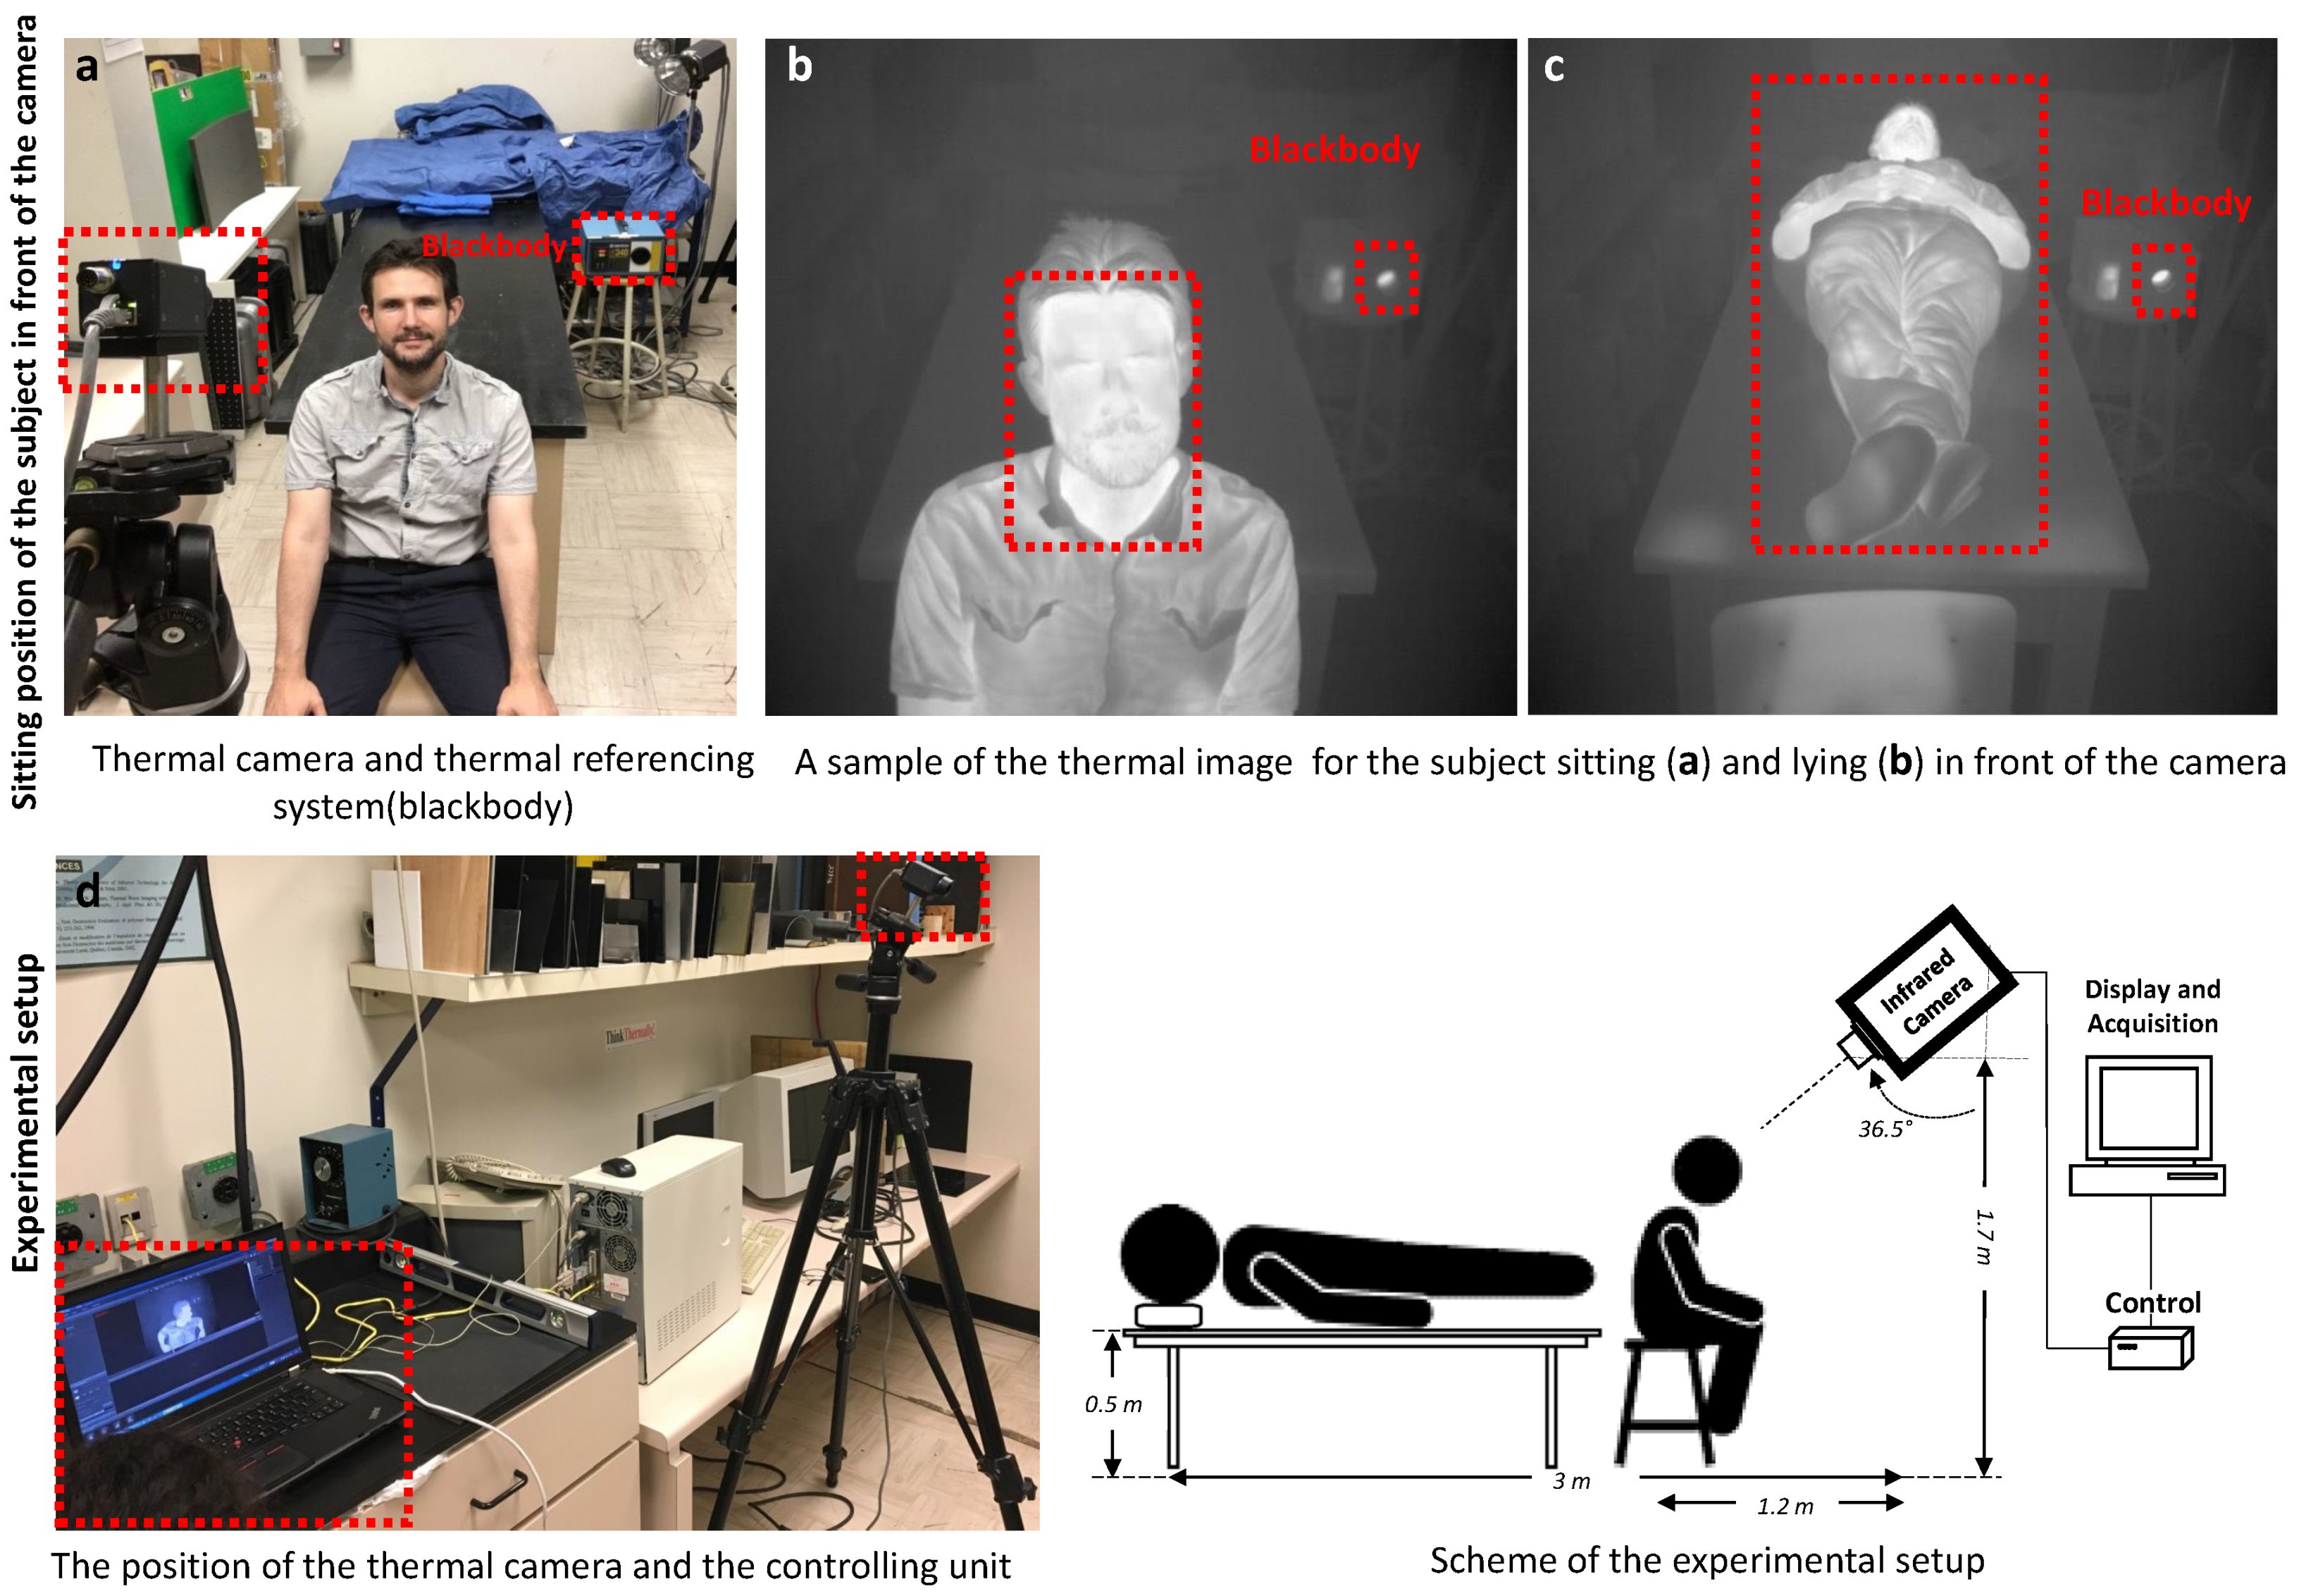
3.1. Experimental Setup and Thermal Image Database

The experiments were conducted at room temperature using an A65 FLIR camera (Manufacturer: FLIR Systems, Inc., Wilsonville, OR, USA) for infrared image acquisition at wavelength (7.5 μm < λ < 13 μm). The resolution of the IR-camera was 640 × 512 pixels with field of view (FOV) of 45 ( H ) × 37 ( V ) and a 13 mm focal length. This provides 1.31 m rad Spatial resolution (IFOV). The frame rate of the camera was able to reach 9Hz but it was 1 second interval time between the frames to avoid high computational complexity. The object temperature range can be varied from −40 °C to +160 °C. During the experiment the subjects were sitting at 1.2 m and lying at 3 m distance in front of the camera. The camera was located at 1.7 m from the ground with an angle of 36.5° from the vertical axis. Figure 3 shows the schematic experimental setup along with two examples of thermal images.
The thermal image database (The mentioned dataset is available for research uses. A sample set of this database is provided at the following link: http://vision.gel.ulaval.ca/~bardia/web%20page/ThermalDatabase.html) was created using 15 subjects for two minutes of acquisition while the subjects are sitting or lying in front of the camera. The subjects were free to have arbitrary movements during the acquisition to not only simulate the actual condition but also to verify the ability of the system to deal with motion artifacts. The processing was carried out with a PC (Intel(R) Core(TM) i7 CPU, 930, 2.80 GHz, RAM 24.00 GB, 64 bit Operating System) and processing of the thermal data was conducted using MATLAB computer program.

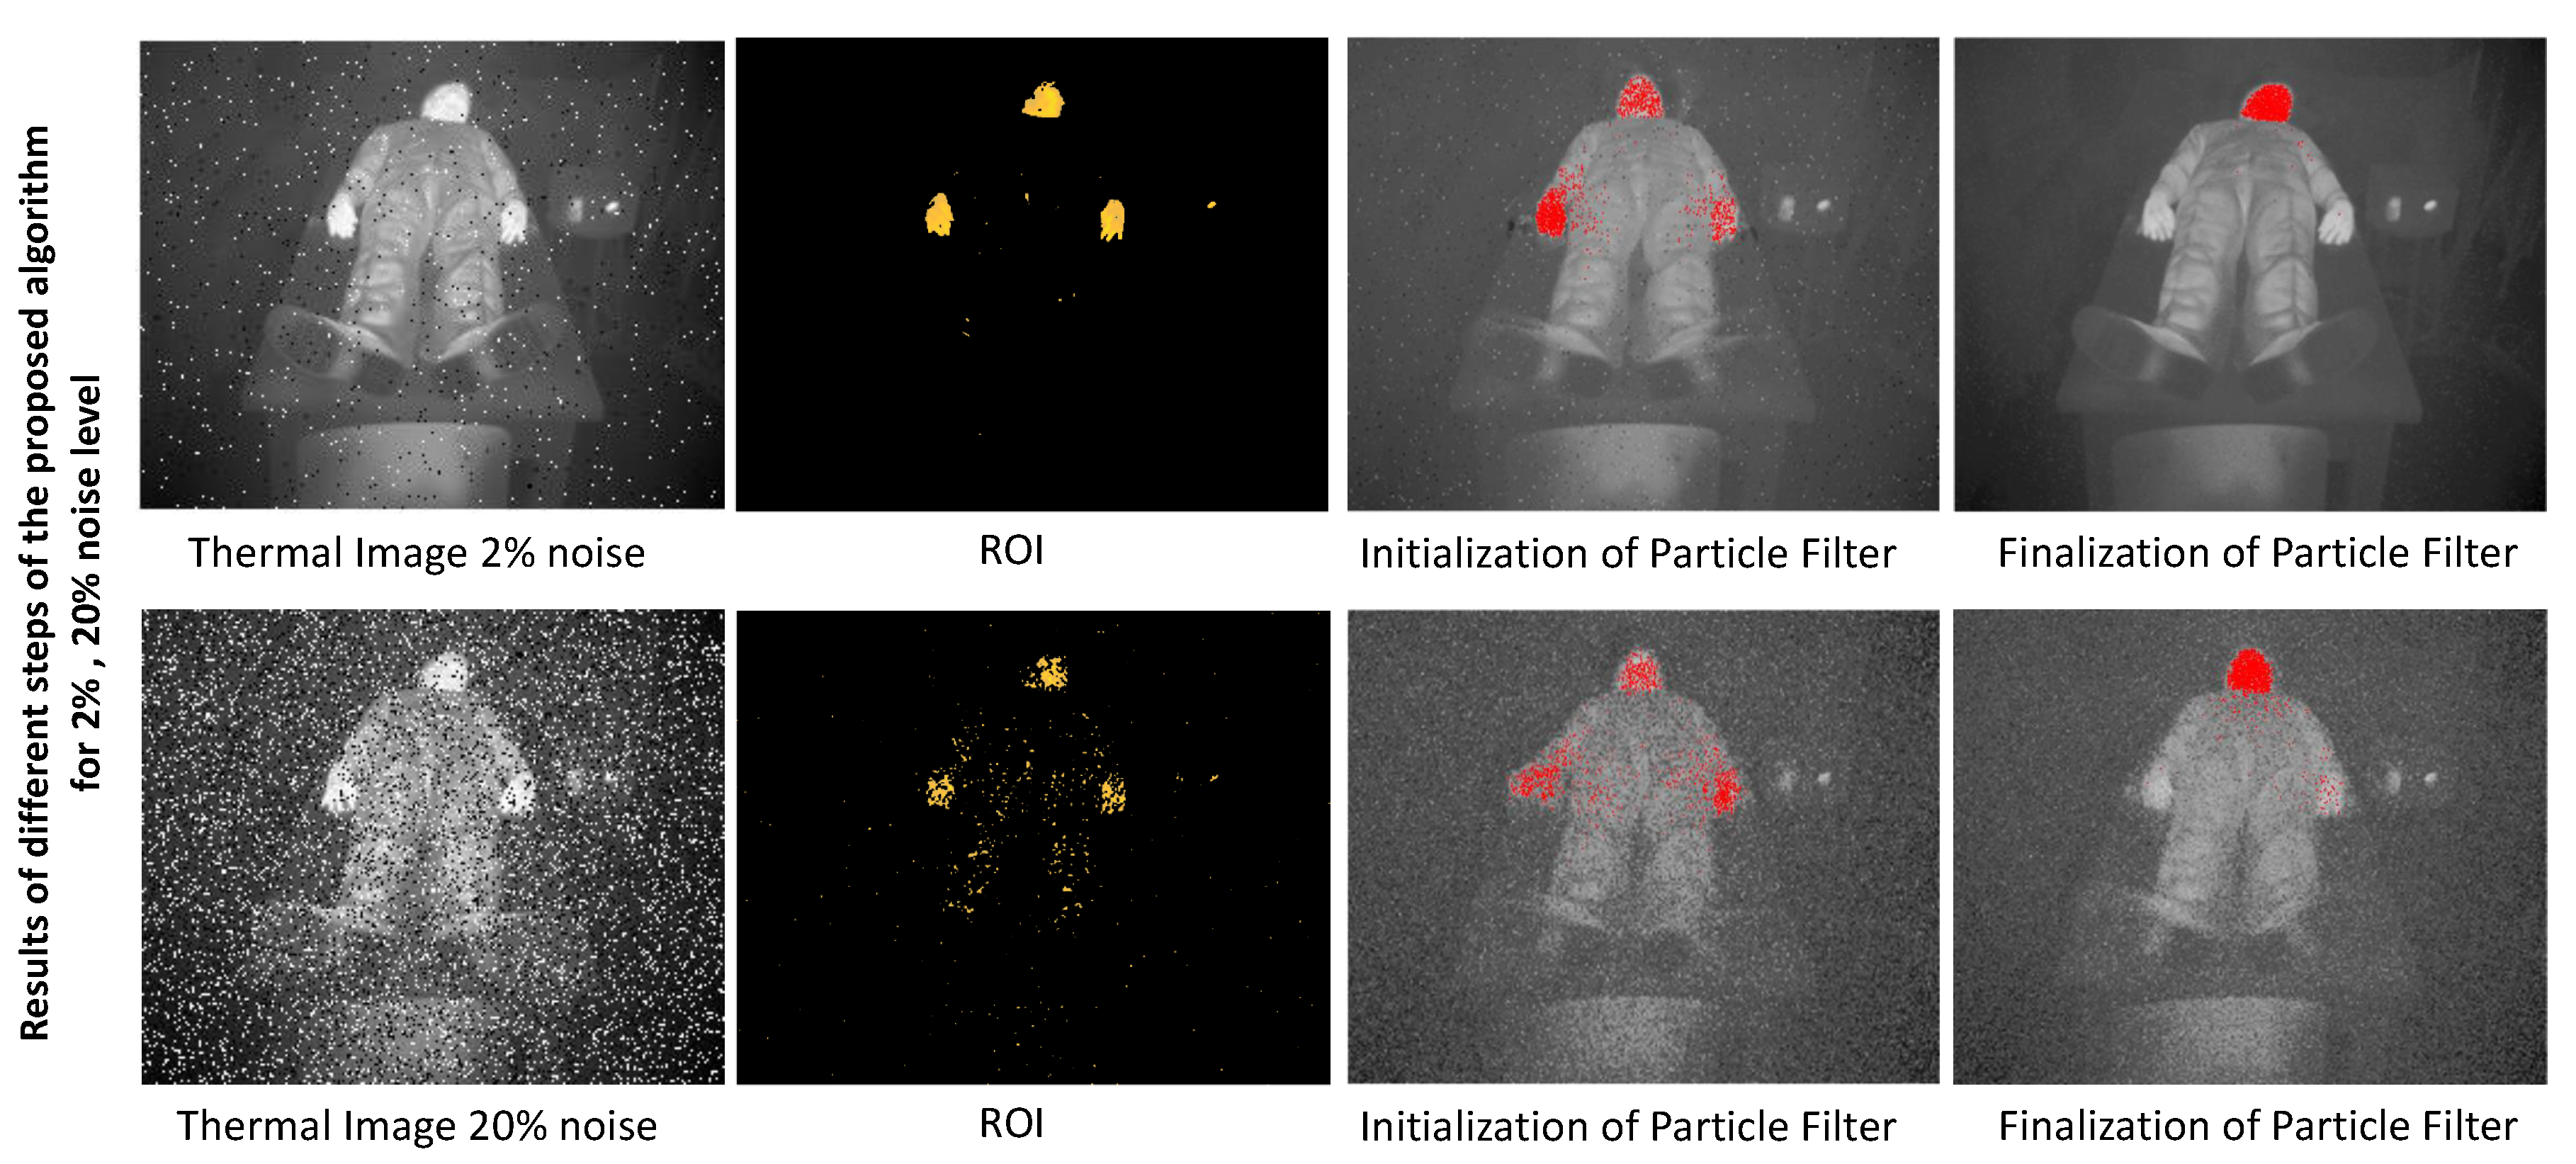
3.2. System Evaluation

To verify the performance of the system in the presence of noise, we added seven levels of additive Salt and pepper noise into the input stream. The system showed considerable robustness against noise due to the incremental low-rank noise reduction stage in the process. Figure 4 represents the performance of the system involving additive noise and computational complexity of the proposed approach. Figure 5 shows a participant during the simulation, during which is processed with Matlab while a heating source was attached to the volunteer’s body. Figure 5a,b show two time points at start and middle of the experiment when the temperature of the heating source has not increased yet. Figure 5c represents segmented hot spots during imaging and their temperatures can be measured. Figure 6 also shows two examples of system performance for 2% and 20% noise. The ROIs for both cases are correctly found and tracked during the experiments.

4. Discussion

This study has shown the application of infrared imagery in the 7.5–13 μm wavelength range for temperature monitoring using unsupervised learning techniques. One of the requirements of the proposed system is an initial calibration to obtain the real temperature. However this is not an issue due to the use of a black-body as a reference temperature for the healthy body temperature (around 36.5 °C). The system interestingly covers the particles of the regions where the highest temperature is located (which usually involves the face of the subjects). Following the results, the particle filter was initiated on the group which showed the higher temperature and segmented by clustering then shifted to the higher temperature points. That is because of the tendency of the particles in the particle filter to track the higher value points. This process usually involved some initial time and then stabilized to a certain region.
The other matter to be discussed is related to the noise reduction and the level of additive noise. The system has shown a considerable performance to track the thermal regions while the system was exposed to 2% to 20% additive salt&pepper noise and the results have provided a confirmation for this matter. The good performance of the system is a result of the low rank noise reduction which was carried out though an incremental Eigen-decomposition method (SVD). Incremental-SVD improved the heavy process of batch-SVD but it is still a heavy stage in the proposed algorithm and the system achieved a reasonable computational complexity due to down-sampling in the frame rate to compensate for the processing time.
The contributions of the proposed approach lie under two major points of view, i.e., a modification in applications of thermal object tracking and incremental noise reduction. In this application modification, we have modified the previous approach ([38]) by concentrating more on normal body temperature and adjusting this approach by using a black-body as a temperature reference. This provides a more applicable system for medical and health care usages. Moreover, the contribution involving low rank noise reduction has provided considerable novelty to the previous similar approaches such as [38,39,67].

5. Conclusions

The approach presented is an automatic monitoring system for the patient’s body temperature using incremental low-rank noise reduction and applying Incremental SVD and applied color based K-means clustering to find the ROI and a particle filter to track the ROI(s) within the sequence. The system was tested in an experiment conducted to simulate the hospital’s conditions which involved 15 subjects in sitting and lying positions. The robustness of the method was verified in the presence of subject’s arbitrary movements and additive noise. The system was able to function even in the presence of 20% (salt & pepper) noise with reasonable computational load. As future work, the low ranking noise reduction process can be modified to avoid the vulnerability of the system when facing a higher level of noise. This objective can be reached by using an additional penalty term in the computing of the low rank data representation or by adding a possible relaxation coefficient into the calculation.

Author Contributions

Conceptualization, design and implementation B.Y. and H.M.S.; methodology, B.Y.; data-set curation, M.E., C.I.-C.; supervisor of M.E., D.L.; writing draft preparation, B.Y.; review and editing, all authors; main supervision, X.P.V.M.; project administration, C.I.-C., X.P.V.M., R.W. and M.K.; main PI and funding acquisition, X.P.V.M.

Funding

This research was conducted under Canadian-Tier 1 Research Chair in Multipolar Infrared Vision (MIVIM) at Computer Vision and Systems Laboratory (CVSL), Laval University.

Acknowledgments

The authors would like to acknowledge and thank Dr. Annette Schwerdtfeger from the Department of Electrical and Computer Engineering at Laval University for her constructive comments, proof reading, and help. Also, we would like thank anonymous reviewers for their insightful and constructive comments.

Conflicts of Interest

R.W. and M.K. are with RT thermal and Visiooimage companies, respectively. The rest of the authors declare no conflict of interest.

Abbreviations

The following abbreviations are used in this manuscript:
ROIregion of interest
SVDsingular value decomposition
FOVfield of view
3Dthree dimension
PCLpoint cloud library
ICPiterative closest points

References

  1. Jones, B.F. A reappraisal of the use of infrared thermal image analysis in medicine. IEEE Trans. Med. Imaging 1998, 17, 1019–1027. [Google Scholar] [CrossRef] [PubMed]
  2. Wu, D.; Lu, H.; Zhao, B.; Liu, J.; Zhao, M. Micro-Motion Dynamics and Shape Parameters Estimation Based on an Infrared Signature Model of Spatial Targets. Electronics 2019, 8, 755. [Google Scholar] [CrossRef]
  3. Abdel-Nasser, M.; Moreno, A.; Puig, D. Breast Cancer Detection in Thermal Infrared Images Using Representation Learning and Texture Analysis Methods. Electronics 2019, 8, 100. [Google Scholar] [CrossRef]
  4. Etehadtavakol, M.; Ng, E.Y. Potential of Thermography in Pain Diagnosing and Treatment Monitoring. In Application of Infrared to Biomedical Sciences; Springer: New York, NY, USA, 2017; pp. 19–32. [Google Scholar]
  5. Manohar, S.; Vaartjes, S.E.; van Hespen, J.C.; Klaase, J.M.; van den Engh, F.M.; Steenbergen, W.; Van Leeuwen, T.G. Initial results of in vivo non-invasive cancer imaging in the human breast using near-infrared photoacoustics. Opt. Express 2007, 15, 12277–12285. [Google Scholar] [CrossRef] [PubMed]
  6. Merla, D.A.; Tsiamyrtzis, P.; Pavlidis, I. Imaging Facial Signs of Neurophysiological Responses. IEEE Trans. Biomed. Eng. 2009, 56, 477–484. [Google Scholar]
  7. Tabatabaei, N.; Mandelis, A.; Amaechi, B.T. Thermophotonic lock-in imaging of early demineralized and carious lesions in human teeth. J. Biomed. Opt. 2011, 16, 071402. [Google Scholar] [CrossRef]
  8. Chiang, M.F.; Lin, P.W.; Lin, L.F.; Chiou, H.Y.; Chien, C.W.; Chu, S.F.; Chiu, W.T. Mass screening of suspected febrile patients with remote-sensing infrared thermography: Alarm temperature and optimal distance. J. Formos. Med. Assoc. 2008, 107, 937–944. [Google Scholar] [CrossRef]
  9. Dempsey, M.F.; Condon, B.; Hadley, D.M. Investigation of the factors responsible for burns during MRI. J. Magn. Reson. Imaging Off. J. Int. Soc. Magn. Reson. Med. 2001, 13, 627–631. [Google Scholar] [CrossRef]
  10. Shellock, F.G.; Kanal, E. Burns associated with the use of monitoring equipment during MR procedures. J. Magn. Reson. Imaging 1996, 6, 271–272. [Google Scholar] [CrossRef]
  11. Brown, T.; Goldstein, B.; Little, J. Severe burns resulting from magnetic resonance imaging with cardiopulmonary monitoring. Risks and relevant safety precautions. Am. J. Phys. Med. Rehabi. 1993, 72, 166–167. [Google Scholar]
  12. Bashein, G.; Syrovy, G. Burns associated with pulse oximetry during magnetic resonance imaging. Anesthesiol. J. Am. Soc. Anesthesiol. 1991, 75, 382. [Google Scholar] [CrossRef] [PubMed]
  13. Hall, S.C.; Stevenson, G.; Suresh, S. Burn associated with temperature monitoring during magnetic resonance imaging. Anesthesiol. J. Am. Soc. Anesthesiol. 1992, 76, 152. [Google Scholar] [CrossRef] [PubMed]
  14. Albuquerque, R.J.; de Leeuw, R.; Carlson, C.R.; Okeson, J.P.; Miller, C.S.; Andersen, A.H. Cerebral activation during thermal stimulation of patients who have burning mouth disorder: An fMRI study. Pain 2006, 122, 223–234. [Google Scholar] [CrossRef] [PubMed]
  15. Lemieux, L.; Allen, P.J.; Franconi, F.; Symms, M.R.; Fish, D.K. Recording of EEG during fMRI experiments: Patient safety. Magn. Reson. Med. 1997, 38, 943–952. [Google Scholar] [CrossRef]
  16. Simi, S.; Ballardin, M.; Casella, M.; De Marchi, D.; Hartwig, V.; Giovannetti, G.; Vanello, N.; Gabbriellini, S.; Landini, L.; Lombardi, M. Is the genotoxic effect of magnetic resonance negligible? Low persistence of micronucleus frequency in lymphocytes of individuals after cardiac scan. Mutat. Res./Fund. Mol. Mech. Mutagenesis 2008, 645, 39–43. [Google Scholar] [CrossRef]
  17. Bonassi, S.; Znaor, A.; Ceppi, M.; Lando, C.; Chang, W.P.; Holland, N.; Kirsch-Volders, M.; Zeiger, E.; Ban, S.; Barale, R.; et al. An increased micronucleus frequency in peripheral blood lymphocytes predicts the risk of cancer in humans. Carcinogenesis 2007, 28, 625–631. [Google Scholar] [CrossRef]
  18. Hartwig, V.; Giovannetti, G.; Vanello, N.; Lombardi, M.; Landini, L.; Simi, S. Biological effects and safety in magnetic resonance imaging: A review. Int. J. Environ. Res. Public Health 2009, 6, 1778–1798. [Google Scholar] [CrossRef]
  19. Jin, J. Electromagnetic Analysis and Design in Magnetic Resonance Imaging; Routledge: London, UK, 2018. [Google Scholar]
  20. Pykett, I.L. NMR imaging in medicine. Sci. Am. 1982, 246, 78–91. [Google Scholar] [CrossRef]
  21. Rodgers, P.M.; Ward, J.; Baudouin, C.J.; Ridgway, J.P.; Robinson, P.J. Dynamic contrast-enhanced MR imaging of the portal venous system: Comparison with x-ray angiography. Radiology 1994, 191, 741–745. [Google Scholar] [CrossRef]
  22. Laakman, R.; Kaufman, B.; Han, J.; Nelson, A.; Clampitt, M.; O’Block, A.; Haaga, J.; Alfidi, R. MR imaging in patients with metallic implants. Radiology 1985, 157, 711–714. [Google Scholar] [CrossRef]
  23. Morgan, D.E.; Kenney, P.J.; Meeks, M.C.; Pile, N.S. MR imaging of breast implants and their complications. AJR Am. J. Roentgenol. 1996, 167, 1271–1275. [Google Scholar] [CrossRef] [PubMed]
  24. Formica, D.; Silvestri, S. Biological effects of exposure to magnetic resonance imaging: An overview. Biomed. Eng. Online 2004, 3, 11. [Google Scholar] [CrossRef] [PubMed]
  25. Shellock, F.G. Radiofrequency energy-induced heating during MR procedures: A review. J. Magn. Reson. Imaging 2000, 12, 30–36. [Google Scholar] [CrossRef]
  26. Shellock, F.G.; Rothman, B.; Sarti, D. Heating of the scrotum by high-field-strength MR imaging. AJR Am. J. Roentgenol. 1990, 154, 1229–1232. [Google Scholar] [CrossRef]
  27. Shellock, F.; Crues, J.V. Corneal temperature changes induced by high-field-strength MR imaging with a head coil. Radiology 1988, 167, 809–811. [Google Scholar] [CrossRef] [PubMed]
  28. Vahlensieck, M. Tattoo-related cutaneous inflammation (burn grade I) in a mid-field MR scanner. Eur. Radiol. 2000, 10, 197. [Google Scholar] [CrossRef] [PubMed]
  29. Wagle, W.A.; Smith, M. Tattoo-induced skin burn during MR imaging. Am. J. Roentgenol. 2000, 174, 1795. [Google Scholar] [CrossRef]
  30. Kreidstein, M.; Giguere, D.; Freiberg, A. MRI interaction with tattoo pigments: Case report, pathophysiology, and management. Plast. Reconstr. Surg. 1997, 99, 1717–1720. [Google Scholar] [CrossRef]
  31. Cleveland, R.F., Jr.; Athey, T.W. Specific absorption rate (SAR) in models of the human head exposed to hand-held UHF portable radios. Bioelectromagn. J. Bioelectromagn. Soc. Soc. Phys. Regul. Biol. Med. Eur. Bioelectromagn. Assoc. 1989, 10, 173–186. [Google Scholar] [CrossRef]
  32. International Electrotechnical Commission. Particular Requirements for the Basic Safety and Essential Performance of Magnetic Resonance Equipment for Medical Diagnosis; Technical Report; International Electrotechnical Commission (IEC): Geneva, Switzerland, 2010; p. 60601-2-33. [Google Scholar]
  33. Adair, E.R.; Berglund, L.G. On the thermoregulatory consequences of NMR imaging. Magn. Reson. Imaging 1986, 4, 321–333. [Google Scholar] [CrossRef]
  34. Shellock, F.G.; Schaefer, D.J.; Crues, J.V. Alterations in body and skin temperatures caused by MRI. Br. J. Radiol. 1990, 63, 317. [Google Scholar] [CrossRef] [PubMed]
  35. Van den Berg, C.A.; Van den Bergen, B.; Van de Kamer, J.B.; Raaymakers, B.W.; Kroeze, H.; Bartels, L.W.; Lagendijk, J.J. Simultaneous B homogenization and specific absorption rate hotspot suppression using a magnetic resonance phased array transmit coil. Magn. Reson. Med. Off. J. Int. Soc. Magn. Reson. Med. 2007, 57, 577–586. [Google Scholar] [CrossRef] [PubMed]
  36. Liu, F.; Zhao, H.; Crozier, S. Calculation of electric fields induced by body and head motion in high-field MRI. J. Magn. Reson. 2003, 161, 99–107. [Google Scholar] [CrossRef]
  37. Stathopoulos, I.; Skouroliakou, K.; Michail, C.; Valais, I. Dynamic infrared thermography study of blood flow relative to lower limp position. In Journal of Physics: Conference Series; IOP Publishing: Bristol, UK, 2015; Volume 637, p. 012027. [Google Scholar]
  38. Yousefi, B.; Fleuret, J.; Zhang, H.; Maldague, X.P.; Watt, R.; Klein, M. Automated assessment and tracking of human body thermal variations using unsupervised clustering. Appl. Opt. 2016, 55, D162–D172. [Google Scholar] [CrossRef] [Green Version]
  39. Bilodeau, G.A.; Torabi, A.; Lévesque, M.; Ouellet, C.; Langlois, J.P.; Lema, P.; Carmant, L. Body temperature estimation of a moving subject from thermographic images. Mach. Vis. Appl. 2012, 23, 299–311. [Google Scholar] [CrossRef]
  40. Kennedy, H.V. Modeling noise in thermal imaging systems. Proc. SPIE 1993, 1969, 66–70. [Google Scholar]
  41. Watts, M.R.; Shaw, M.J.; Nielson, G.N. Optical resonators: Microphotonic thermal imaging. Nat. Photonics 2007, 1, 632–634. [Google Scholar] [CrossRef]
  42. Cardone, D.; Pinti, P.; Merla, A. Thermal infrared imaging-based computational psychophysiology for psychometrics. Comput. Math. Methods Med. 2015, 2015. [Google Scholar] [CrossRef]
  43. Manabe, M.; Yamazaki, H.; Sakai, K. Shape factor simulation for the thermal radiation environment of the human body and the VRML visualization. Build. Environ. 2004, 39, 927–937. [Google Scholar] [CrossRef]
  44. Badel, E.; Delisee, C.; Lux, J. 3D structural characterisation, deformation measurements and assessment of low-density wood fibreboard under compression: The use of X-ray microtomography. Compos. Sci. Technol. 2008, 68, 1654–1663. [Google Scholar] [CrossRef] [Green Version]
  45. Jaganathan, S.; Tafreshi, H.V.; Pourdeyhimi, B. Modeling liquid porosimetry in modeled and imaged 3-D fibrous microstructures. J. Colloid Interface Sci. 2008, 326, 166–175. [Google Scholar] [CrossRef] [PubMed]
  46. Cheng, V.S.; Bai, J.; Chen, Y. A high-resolution three-dimensional far-infrared thermal and true-color imaging system for medical applications. Med. Eng. Phys. 2009, 31, 1173–1181. [Google Scholar] [CrossRef] [PubMed]
  47. Sharma, R.; Locke, B.R. Jet fuel toxicity: Skin damage measured by 900-MHz MRI skin microscopy and visualization by 3D MR image processing. Magn. Reson. Imaging 2010, 28, 1030–1048. [Google Scholar] [CrossRef] [PubMed]
  48. Markelj, P.; Tomaževič, D.; Likar, B.; Pernuš, F. A review of 3D/2D registration methods for image-guided interventions. Med. Image Anal. 2012, 16, 642–661. [Google Scholar] [CrossRef]
  49. Lagüela, S.; Armesto, J.; Arias, P.; Herráez, J. Automation of thermographic 3D modelling through image fusion and image matching techniques. Autom. Constr. 2012, 27, 24–31. [Google Scholar] [CrossRef]
  50. Schutt, D.J.; Swindle, M.M.; Helke, K.L.; Bastarrika, G.; Schwarz, F.; Haemmerich, D. Sequential activation of ground pads reduces skin heating during radiofrequency tumor ablation: In vivo porcine results. IEEE Trans. Biomed. Eng. 2009, 57, 746–753. [Google Scholar] [CrossRef]
  51. Vidas, S.; Moghadam, P. HeatWave: A handheld 3D thermography system for energy auditing. Energy Build. 2013, 66, 445–460. [Google Scholar] [CrossRef] [Green Version]
  52. Siewert, C.; Dänicke, S.; Kersten, S.; Brosig, B.; Rohweder, D.; Beyerbach, M.; Seifert, H. Difference method for analysing infrared images in pigs with elevated body temperatures. Zeitschrift für Medizinische Physik 2014, 24, 6–15. [Google Scholar] [CrossRef]
  53. Bay, H.; Tuytelaars, T.; Van Gool, L. Surf: Speeded up robust features. In European Conference on Computer Vision; Springer: New York, NY, USA, 2006; pp. 404–417. [Google Scholar]
  54. Chen, Y.; Medioni, G. Object modelling by registration of multiple range images. Image Vis. Comput. 1992, 10, 145–155. [Google Scholar] [CrossRef]
  55. Rusu, R.B.; Cousins, S. Point cloud library (pcl). In Proceedings of the 2011 IEEE International Conference on Robotics and Automation, Shanghai, China, 2011; pp. 1–4. [Google Scholar]
  56. Golub, G.H.; Van Loan, C.F. Matrix computations; JHU Press: Baltimore, MD, USA, 2012; Volume 3. [Google Scholar]
  57. Bunch, J.R.; Nielsen, C.P. Updating the singular value decomposition. Numer. Math. 1978, 31, 111–129. [Google Scholar] [CrossRef]
  58. Brand, M. Incremental singular value decomposition of uncertain data with missing values. In Computer Vision—ECCV 2002; Springer: Berlin/Heidelberg, Germany, 2002; pp. 707–720. [Google Scholar]
  59. Jain, A.K. Data clustering: 50 years beyond K-means. Pattern Recognit. Lett. 2010, 31, 651–666. [Google Scholar] [CrossRef]
  60. Yousefi, P.; Jalab, H.; Ibrahim, R.; Mohd Noor, N.; Ayub, M.; Gani, A. River segmentation using satellite image contextual information and Bayesian classifier. Imaging Sci. J. 2016, 64, 453–459. [Google Scholar] [CrossRef]
  61. Isard, M.; Blake, A. Condensation—Conditional density propagation for visual tracking. Int. J. Comput. Vis. 1998, 29, 5–28. [Google Scholar] [CrossRef]
  62. Hoseini, S.; Kabiri, P. A Novel Feature-Based Approach for Indoor Monocular SLAM. Electronics 2018, 7, 305. [Google Scholar] [CrossRef]
  63. Zhang, F.; Hancock, E.R.; Goodlett, C.; Gerig, G. Probabilistic white matter fiber tracking using particle filtering and von Mises–Fisher sampling. Med. Image Anal. 2009, 13, 5–18. [Google Scholar] [CrossRef] [PubMed]
  64. Smal, I.; Meijering, E.; Draegestein, K.; Galjart, N.; Grigoriev, I.; Akhmanova, A.; Van Royen, M.; Houtsmuller, A.B.; Niessen, W. Multiple object tracking in molecular bioimaging by Rao-Blackwellized marginal particle filtering. Med. Image Anal. 2008, 12, 764–777. [Google Scholar] [CrossRef] [PubMed]
  65. Smal, I.; Meijering, E. Quantitative comparison of multiframe data association techniques for particle tracking in time-lapse fluorescence microscopy. Med. Image Anal. 2015, 24, 163–189. [Google Scholar] [CrossRef]
  66. Pitt, M.K.; Shephard, N. Filtering via simulation: Auxiliary particle filters. J. Am. Stat. Assoc. 1999, 94, 590–599. [Google Scholar] [CrossRef]
  67. Bilodeau, G.A.; Ghali, R.; Desgent, S.; Langlois, P.; Farah, R.; St-Onge, P.L.; Duss, S.; Carmant, L. Where is the rat? Tracking in low contrast thermographic images. In Proceedings of the 2011 IEEE Computer Society Conference on Computer Vision and Pattern Recognition Workshops (CVPRW), Colorado Springs, CO, USA, 2011; pp. 55–60. [Google Scholar]
Figure 1. An example of making 3D model of a participant using a Kinect camera. (a) shows a visible image. (b,c) are depth images and reconstructed 3D images applying speeded up robust features (SURF), finding most similar keypoints, using iterative closest points (ICP), and point cloud library (PCL) for visualization, respectively.
Electronics 08 01301 g001
Figure 2. Flowchart which shows the proposed approach for the estimation of down-welling radiance among all of the possible points.
Electronics 08 01301 g002
Figure 3. The experimental setup of the approach is shown along with schematic design of the experiment. (a) shows an example of a subject sitting in the field of view of the IR-camera. (b,c) are the two thermal image samples of sitting and lying in front of the camera. (d) presents the infrared camera and the camera’s interface on the computer during the experiment. The position of the blackbody and subject as our ROI are highlighted.
Electronics 08 01301 g003
Figure 4. The robustness of the tracking approach is tested against the additive noise and computational load of this process is shown in the table and bar-plot from 2% to 20% additive noise.
Electronics 08 01301 g004
Figure 5. Thermal measurement and tracking conducted by an experiment. (ac) are thermal images of a volunteer with its measuring temperature points before (a) and after (b) increasing the temperature of a synthetic elevating thermal source, and heating spot were tracked and clustered by our algorithm (c).
Electronics 08 01301 g005
Figure 6. The results of the proposed approach are shown for two levels of noise (2% and 20%).
Electronics 08 01301 g006

