Article

Real-Time Object Detection in Remote Sensing Images Based on Visual Perception and Memory Reasoning

1
College of Field Engineering, PLA Army Engineering University, Nanjing 210007, China
2
Second Institute of Engineering Research and Design, Southern Theatre Command, Kunming 650222, China
*
Author to whom correspondence should be addressed.
Electronics 2019, 8(10), 1151; https://doi.org/10.3390/electronics8101151
Submission received: 26 September 2019 / Revised: 5 October 2019 / Accepted: 8 October 2019 / Published: 11 October 2019

Abstract

:
Aiming at the real-time detection of multiple objects and micro-objects in large-scene remote sensing images, a cascaded convolutional neural network real-time object-detection framework for remote sensing images is proposed, which integrates visual perception and convolutional memory network reasoning. The detection framework is composed of two fully convolutional networks, namely, the strengthened object self-attention pre-screening fully convolutional network (SOSA-FCN) and the object accurate detection fully convolutional network (AD-FCN). SOSA-FCN introduces a self-attention module to extract attention feature maps and constructs a depth feature pyramid to optimize the attention feature maps by combining convolutional long-term and short-term memory networks. It guides the acquisition of potential sub-regions of the object in the scene, reduces the computational complexity, and enhances the network’s ability to extract multi-scale object features. It adapts to the complex background and small object characteristics of a large-scene remote sensing image. In AD-FCN, the object mask and object orientation estimation layer are designed to achieve fine positioning of candidate frames. The performance of the proposed algorithm is compared with that of other advanced methods on NWPU_VHR-10, DOTA, UCAS-AOD, and other open datasets. The experimental results show that the proposed algorithm significantly improves the efficiency of object detection while ensuring detection accuracy and has high adaptability. It has extensive engineering application prospects.

1. Introduction

The automatic object detection technology based on remote sensing images is an intelligent data analysis method to realize automatic classification and location of remote sensing objects. It is one of the important research directions in the field of remote sensing image interpretation and has received extensive attention in the civil and military fields. Automatic detection of remote sensing objects is playing an important role in many practical applications such as urban planning, traffic safety, environmental monitoring, and so on. In remote sensing images, besides the serious interference caused by objective factors such as illumination, occlusion, and geometric deformation, multi-class, multi-scale, and multi-directional object detection in complex scenes has always been a crucial and challenging issue in the research of remote sensing image interpretation.
Considering the characteristics of remote sensing images, a new real-time object detection algorithm based on visual perception and convolutional memory network reasoning is proposed for multi-object and micro-object detection in large-scene remote sensing images. The main work of this paper includes the following two points:
(1) A self-attention pre-screening fully convolutional network (SOSA-FCN) is designed to enhance object self-attention. A self-attention mechanism module is introduced to extract the attention feature map. A depth feature pyramid is constructed on the basis of convolutional long-term and short-term memory networks to reasonably optimize the attention feature map and guide the acquisition of potential object sub-regions in the scene. The low computational complexity enhances the network’s ability to extract features of multi-scale objects and adapt to the background complexity and small objects in large scenes of remote sensing images;
(2) An accurate detection fully convolutional network (AD-FCN) is an improved U-Net network. By adding the object mask and the object orientation estimation layer to the traditional U-Net structure, multi-task learning can be achieved, and fine object orientation can be obtained.

2. Related Work

Object detection in remote sensing images is a branch of traditional object detection, which has many applications. Common methods of object detection in remote sensing images include template matching, background modeling, and shallow learning. At present, the deep-learning technology has greatly improved the performance of object detection because of its powerful feature representation and end-to-end learning ability. The main methods include R-CNN (regional recommendation convolutional neural network) [1], Faster R-CNN (real-time regional recommendation convolutional neural network) [2], YOLO (Unified Real-Time Object Detection) [3], SSD (single-network multi-scale detector) [4].
Reference [5] proposes a unified self-enhancement network, which is based on the convolutional neural network (R2-CNN) of a remote sensing region. It consists of Tiny-Net, a core network, a middle global attention module, a final classifier, and a detector. Tiny-Net is a lightweight residual network, which can extract depth features quickly and strongly from the input. A global attention module is built in Tiny-Net to suppress false positives. Then, the classifier is used to predict whether there are objects in each candidate box, and if there are objects, the tracking detector is used to locate them accurately. Classifier and detector reinforce each other through end-to-end training, which further speeds up the training process and avoids false alarms.
In reference [6], a cascade convolutional neural network detection framework was designed. The detection framework is composed of two fully convolutional networks: object pre-screening fully convolutional network (P-FCN) and object accurate detection fully convolutional network (D-FCN). P-FCN is a lightweight image classification network, which is responsible for the rapid pre-screening of possible ship areas in large-scene remote sensing images. It has fewer layers, simple training, and less redundancy of candidate frames, which can reduce the computational burden of subsequent networks. D-FCN adds an object mask and a ship orientation estimation layer to the traditional U-Net structure in order to carry out multi-task learning and determine the fine positioning of any ship object.
Reference [7] presents a visual perception object detection algorithm for high-resolution remote sensing images. Firstly, the algorithm obtains the sub-regions of the scene by selective guidance of salient regions and transfers computing resources to the regions that may contain objects, so as to reduce the computational complexity; secondly, it obtains the pre-selected objects by using the object detection model based on the single-detector (YOLO) convolutional neural network; lastly, it proposes an item. Object semantic association suppression is effective in screening pre-selected objects, which can reduce the interference of false objects and the false alarm rate.
Reference [8] proposes a multi-scale convolutional neural network remote sensing object detection framework (MSCNN). This method introduces an enhanced feature pyramid network (EFPN) to enhance the network’s ability to extract multi-scale object features. Then, focus classification loss is introduced as a classification loss function to enhance the network’s ability to learn difficult samples.
Reference [9] analyzes the influence of pooling operation and object size on regional proposals and proposes a method of combining multi-level features to carry out regional proposals, which improves the recall rate of proposals in object areas. The generation strategy of foreground samples is optimized to avoid invalid foreground samples in the training process, which makes the training of the whole detection model more efficient.
In order to reduce the computational complexity and improve the detection accuracy of large-scale remote sensing images, the method of in-depth learning firstly divides the image into slices by sliding windows and then sends the slices to a neural network model, such as Faster-RCNN and YOLO, for detection. However, there is a lot of redundant information when using the sliding window method, which seriously affects the detection efficiency and greatly depends on the parameters of the sliding window. The phenomena of object omission and object truncation may occur [10,11].

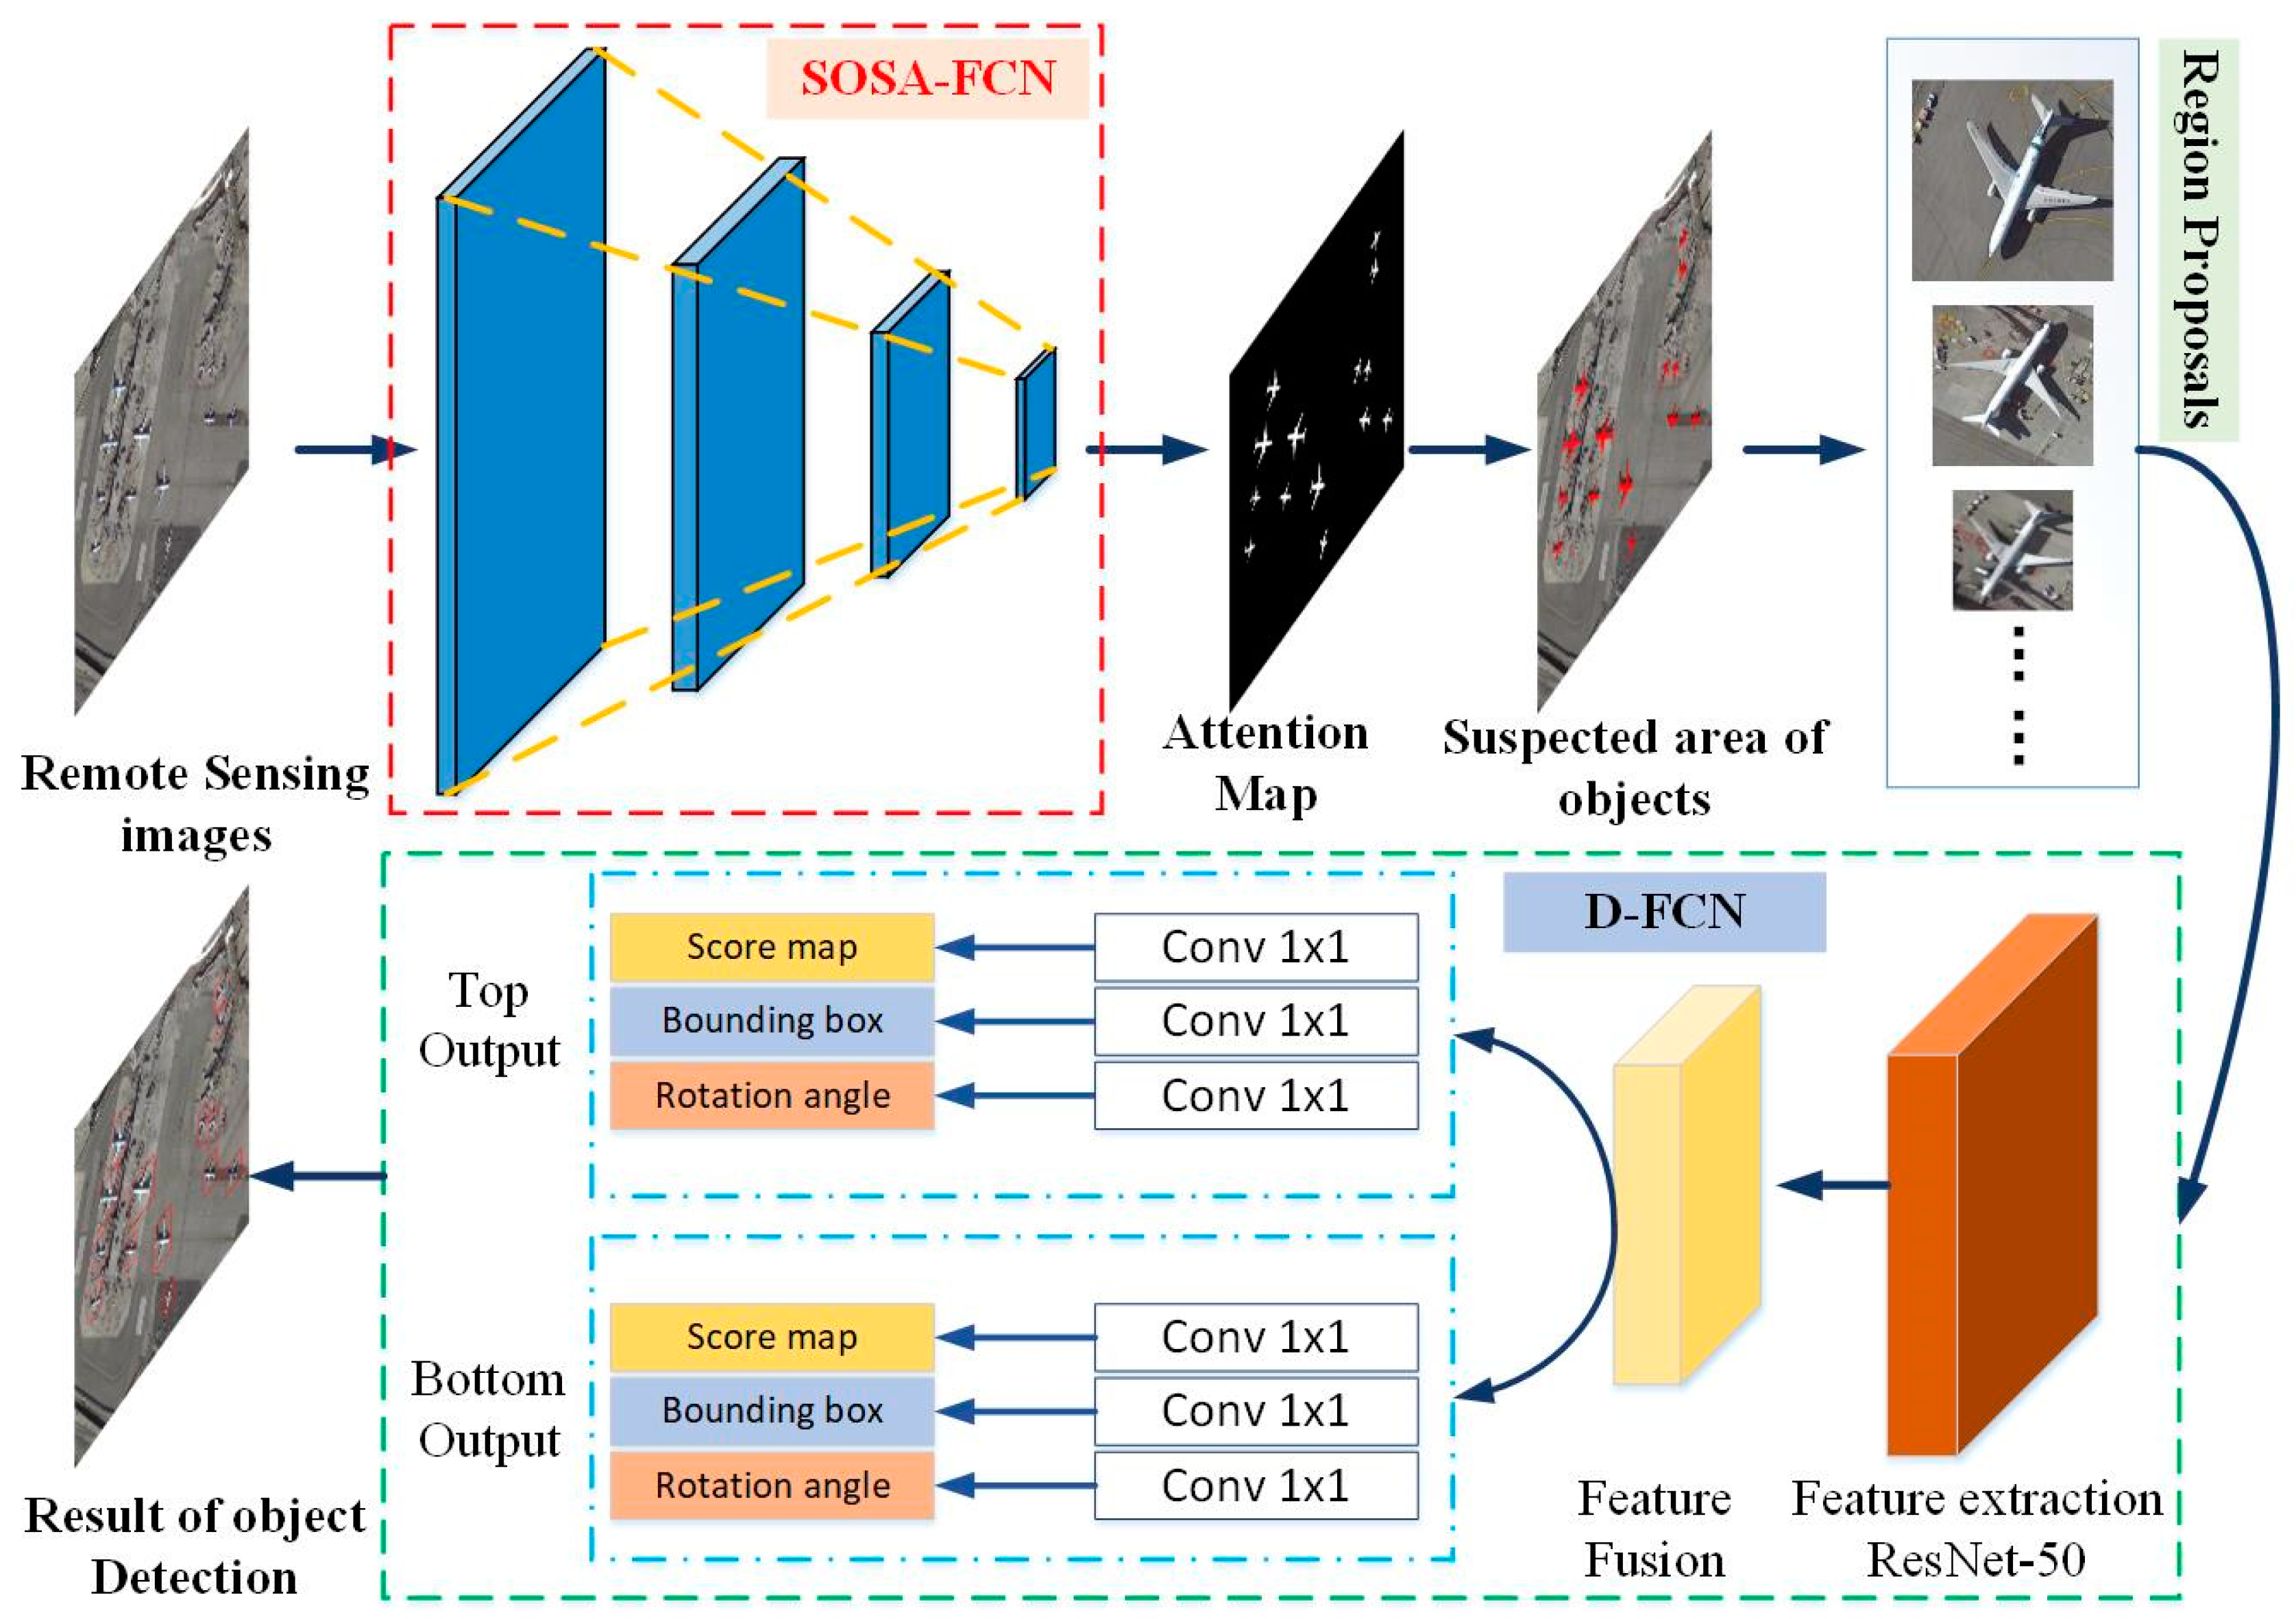
3. Theoretical Method

Considering the characteristics of remote sensing images, a new real-time object detection algorithm based on visual perception and convolutional memory network reasoning is proposed for multi-object and micro-object detection in large-scene remote sensing images. As shown in Figure 1, the detection framework is cascaded by two fully convolutional networks, SOSA-FCN and AD-FCN. The overall structure of this model is shown in Figure 1.

3.1. Strengthening Object Self-Attention Pre-Screening Fully Convolutional Network

Knowledge of the mechanism of attention originates from the study of human vision. In cognitive science, because of the bottleneck of information processing, human beings will selectively pay attention only to part of all available information, ignoring other visible information. The above mechanism is commonly referred to as the attention mechanism. Different parts of the human retina have different degrees of information-processing ability, known as acuteness. The central fovea of the retina has the strongest acuteness. In order to make rational use of limited visual information processing resources, human beings need to select a specific part of the visual area and then focus on it. The attention mechanism has two main aspects: deciding which part of input needs attention and allocating limited information processing resources to important parts [12,13,14].
The neural attention mechanism allows the neural network to focus on a subset of its inputs (or features), i.e., to select a specific input. Attention can be applied to any type of input regardless of its shape. In the case of limited computing power, the attention mechanism is a resource allocation scheme that is the main means to solve the problem of information overload, allocating computing resources to the most important tasks. In the field of computer vision, the attention mechanism is introduced to process visual information. Attention is a mechanism, or methodology, and there is no strict mathematical definition. For example, traditional local image feature extraction, saliency detection, and sliding window method can all be regarded as attention mechanisms.
In the neural network, the attention module is usually an additional neural network, which can rigidly select some parts of the input or assign different weights to different parts of the input. The attention mechanism in this paper mainly refers to the attention mechanism in neural networks. The self-attention mechanism shows a better balance among the ability to simulate remote dependency, computational efficiency, and statistical efficiency [15]. The self-attention module takes the weighted sum of the features at all positions as the response of the positions, wherein the weight or attention vector is calculated, with a low calculation cost. On the basis of the self-attention model, we have designed a new strengthening object self-attention network (SOSA-Net). The overall structure of the model is shown in Figure 2.
The self-attention feature map gives a rough but informative prior about visually significant regions. Many previous researches on pixel-labeling tasks have shown that neural networks can combine high-level feature information by encoding at the upper network layer to produce fine labeling results [16,17,18]. Therefore, we believe that our model can infer more detailed object attention information based on the self-attention feature map derived from high-order network layer reasoning. After training, the network model aggregates the information of the high-level self-attention feature map and the rich spatial and detailed features of the underlying network through the feature pyramid [19] strategy to focus on and continuously refine the objects in complex backgrounds. As shown in Figure 2, the model is calculated from top to bottom and integrates information from earlier layers in turn. A plurality of conv-LSTM networks (green blocks in the figure) are stacked to construct more meaningful feature expression results by circular connection. We use the sequence and memory characteristics of LSTM to process the features in an iterative manner. At a certain level, conv-LSTM abandons the feature of small information amount and strengthens the feature of large information amount, thus generating a gradually improved inference object reinforcement self-attention feature map [17].
f ( x ) , g ( x ) and h ( x ) are common 1 × 1 convolutions, the difference is only that the output channel size is different. The output of f ( x ) is transposed, multiplied by the output of g ( x ) , and normalized by the SoftMax function to obtain an attention map; SAGAN multiplies the obtained attention map and the convolution result obtained through h ( x ) by pixel [14] to obtain an adaptive attention feature maps. The image features of the previous hidden layer x R C × N are first converted into two feature spaces f , g , to calculate attention, where f ( x ) = W f x , g ( x ) = W g x .
β j , i = exp ( s i j ) i = 1 N exp ( s i j )
s i j = f ( x i ) T g ( x j )
where β j , i indicates the degree to which the model pays attention to the i position when synthesizing the j region. Then, the output of the attention layer is ο = ( ο 1 , ο 2 , , ο j , ο N ) R C × N , of which
ο j = i = 1 N β j , i h ( x i )
h ( x i ) = W h x i
Among the above formulas, W f R C × N , W g R C × N , and W h R C × N are all weight matrices obtained through learning. In addition, we further multiply the output of the layer of interest by the scale parameter and add it back to the input feature map. Therefore, the final output is:
y i = γ ο i + x i
in which γ is initialized to 0 and then gradually assigns more weight to non-local attention graphs. The network begins to learn some simple goals and then gradually increases the complexity of the task. Conv-LSTM extends the traditional fully connected LSTM to handle spatial features. Basically, this is achieved by using convolution instead of dot product in the LSTM equation. Conv-LSTM has a convolution structure in the input to the state and the state-to-state transition, which can preserve the spatial information of the convolution feature map, thus enabling our network to generate pixel-level labels. Similar to the traditional gate LSTM, conv-LSTM uses memory cells and gates to control the information flow. It works by sequentially updating the internal state H and memory cell C through the values i , f , c of three sigmoid gates. In the t step, when the input X t arrives, if the input gate i t is activated, the included information of X t will be accumulated in the memory cell, and if the forgotten gate f t is turned on, the state C t 1 of the previous memory cell will be forgotten. Whether the latest cell state C t should propagate to the final state H t is further controlled by the output gate o t . Formally, the above memory update process of step t is driven by the following equations:
i t = σ ( W i X X t + W i H H t 1 + b i )
f t = σ ( W f X X t + W f H H t 1 + b f )
o t = σ ( W o X X t + W o H H t 1 + b o )
C t = f t C t 1 + i t tanh ( W c X X t + W c H H t 1 + b c )
H t = o t tanh ( C t )
where represents a convolution operation, represents an element-wise product of related elements, σ and tanh are activation functions of logical sigmoid and hyperbolic tangent. Input X t , memory cell C t , hidden states H t , and gates i t , f t , c t are 3D tensors with the same spatial dimension. W and b are learned weights and biases. In this model, conv-LSTM takes the feature X extracted from the convolutional neural network (from the last convolution layer before the aggregation layer) as input and generates accurate object saliency features for final object saliency estimation. Because it operates on still images, the input features in all steps are the same. Here, we use the recursive nature of LSTM to iteratively optimize the salient features of static images, instead of using LSTM to model the time dependence of sequence data.
We combine the features of self-attention prior graph P s and convolution layer as the input of conv-LSTM. In each time step, conv-LSTM is trained, and salient objects are inferred by using fixed information knowledge, and the features are sequentially optimized according to the updated storage unit and hidden state. Therefore, the features are reorganized to better represent the significance of the object. First, we compress the characteristic response of the convolution layer through the convolution layer of multiple filters to reduce the calculation cost and use sigmoid activation to regularize the characteristic response, so that it is within the same range of P s . Then, the self-attention prior graph P s is connected with the compressed features and input to conv-LSTM. We apply the 1 × 1 and 3 × 3 combined convolution kernels to the final conv-LSTM output H to obtain the inference object enhanced self-attention feature map Q .
In order to evaluate the significance model, several different measurement standards have been proposed. We adopt the real prominent object annotation S proposed in reference [17] and thus we can obtain the conv-LSTM total loss function defined as:
L S a l ( S , Q ) = L C ( S , Q ) + α 1 L P ( S , Q ) + α 2 L R ( S , Q ) + α 3 L F ( S , Q ) + α 4 L M A E ( S , Q )
where the balance parameters are set to α 1 = α 2 = α 3 = α 4 = 0.1 , and L C is the weighted cross entropy loss function, which is the main loss function of the conv-LSTM model:
L C ( S , Q ) = 1 N x ( ϑ ( 1 s x ) log ( 1 q x ) + ( 1 ϑ ) s x log q x )
where N represents the total number of image pixels, s k S , q k Q . ϑ refers to the ratio of S significant pixels in the real value, and the weighted cross entropy loss function handles the imbalance between prominent and non-prominent pixels. L P , L R , L F are used to calculate the similarity of precision, recall, and F-measure scores:
L P ( S , Q ) = x s x q x x q x + ε
L R ( S , Q ) = x s x q x x s x + ε
L F ( S , Q ) = ( 1 + β 2 ) L P ( S , Q ) L R ( S , Q ) β 2 L P ( S , Q ) + L R ( S , Q ) + ε
where β 2 = 0.3 is the setting according to reference [17], and ε is a regularization constant. Because precision, recall, and F-measure are similarity measures, higher values are better, so negative values are used to minimize precision, recall, and F-measure. L M A E is derived from the mean absolute error (MAE) metric, which calculates the difference between the significance graph Q and the truth graph S .
L M A E ( S , Q ) = 1 N x | s x q x |
After obtaining the object saliency map Q inferred from the attention prior map P , we unsample Q and feed it to the next conv-LSTM to obtain the compression feature from the conv n − 1 layer for a more detailed optimization. The above process iterates layer by layer to the conv 1 layer. In short, the model can effectively infer the salient features of the learning object, which is due to (1) the learnable self-attention mechanism, (2) iteratively updating the salient features and the cyclic architecture, and (3) effectively merging the spatial rich information from the lower layers in a top-down manner.

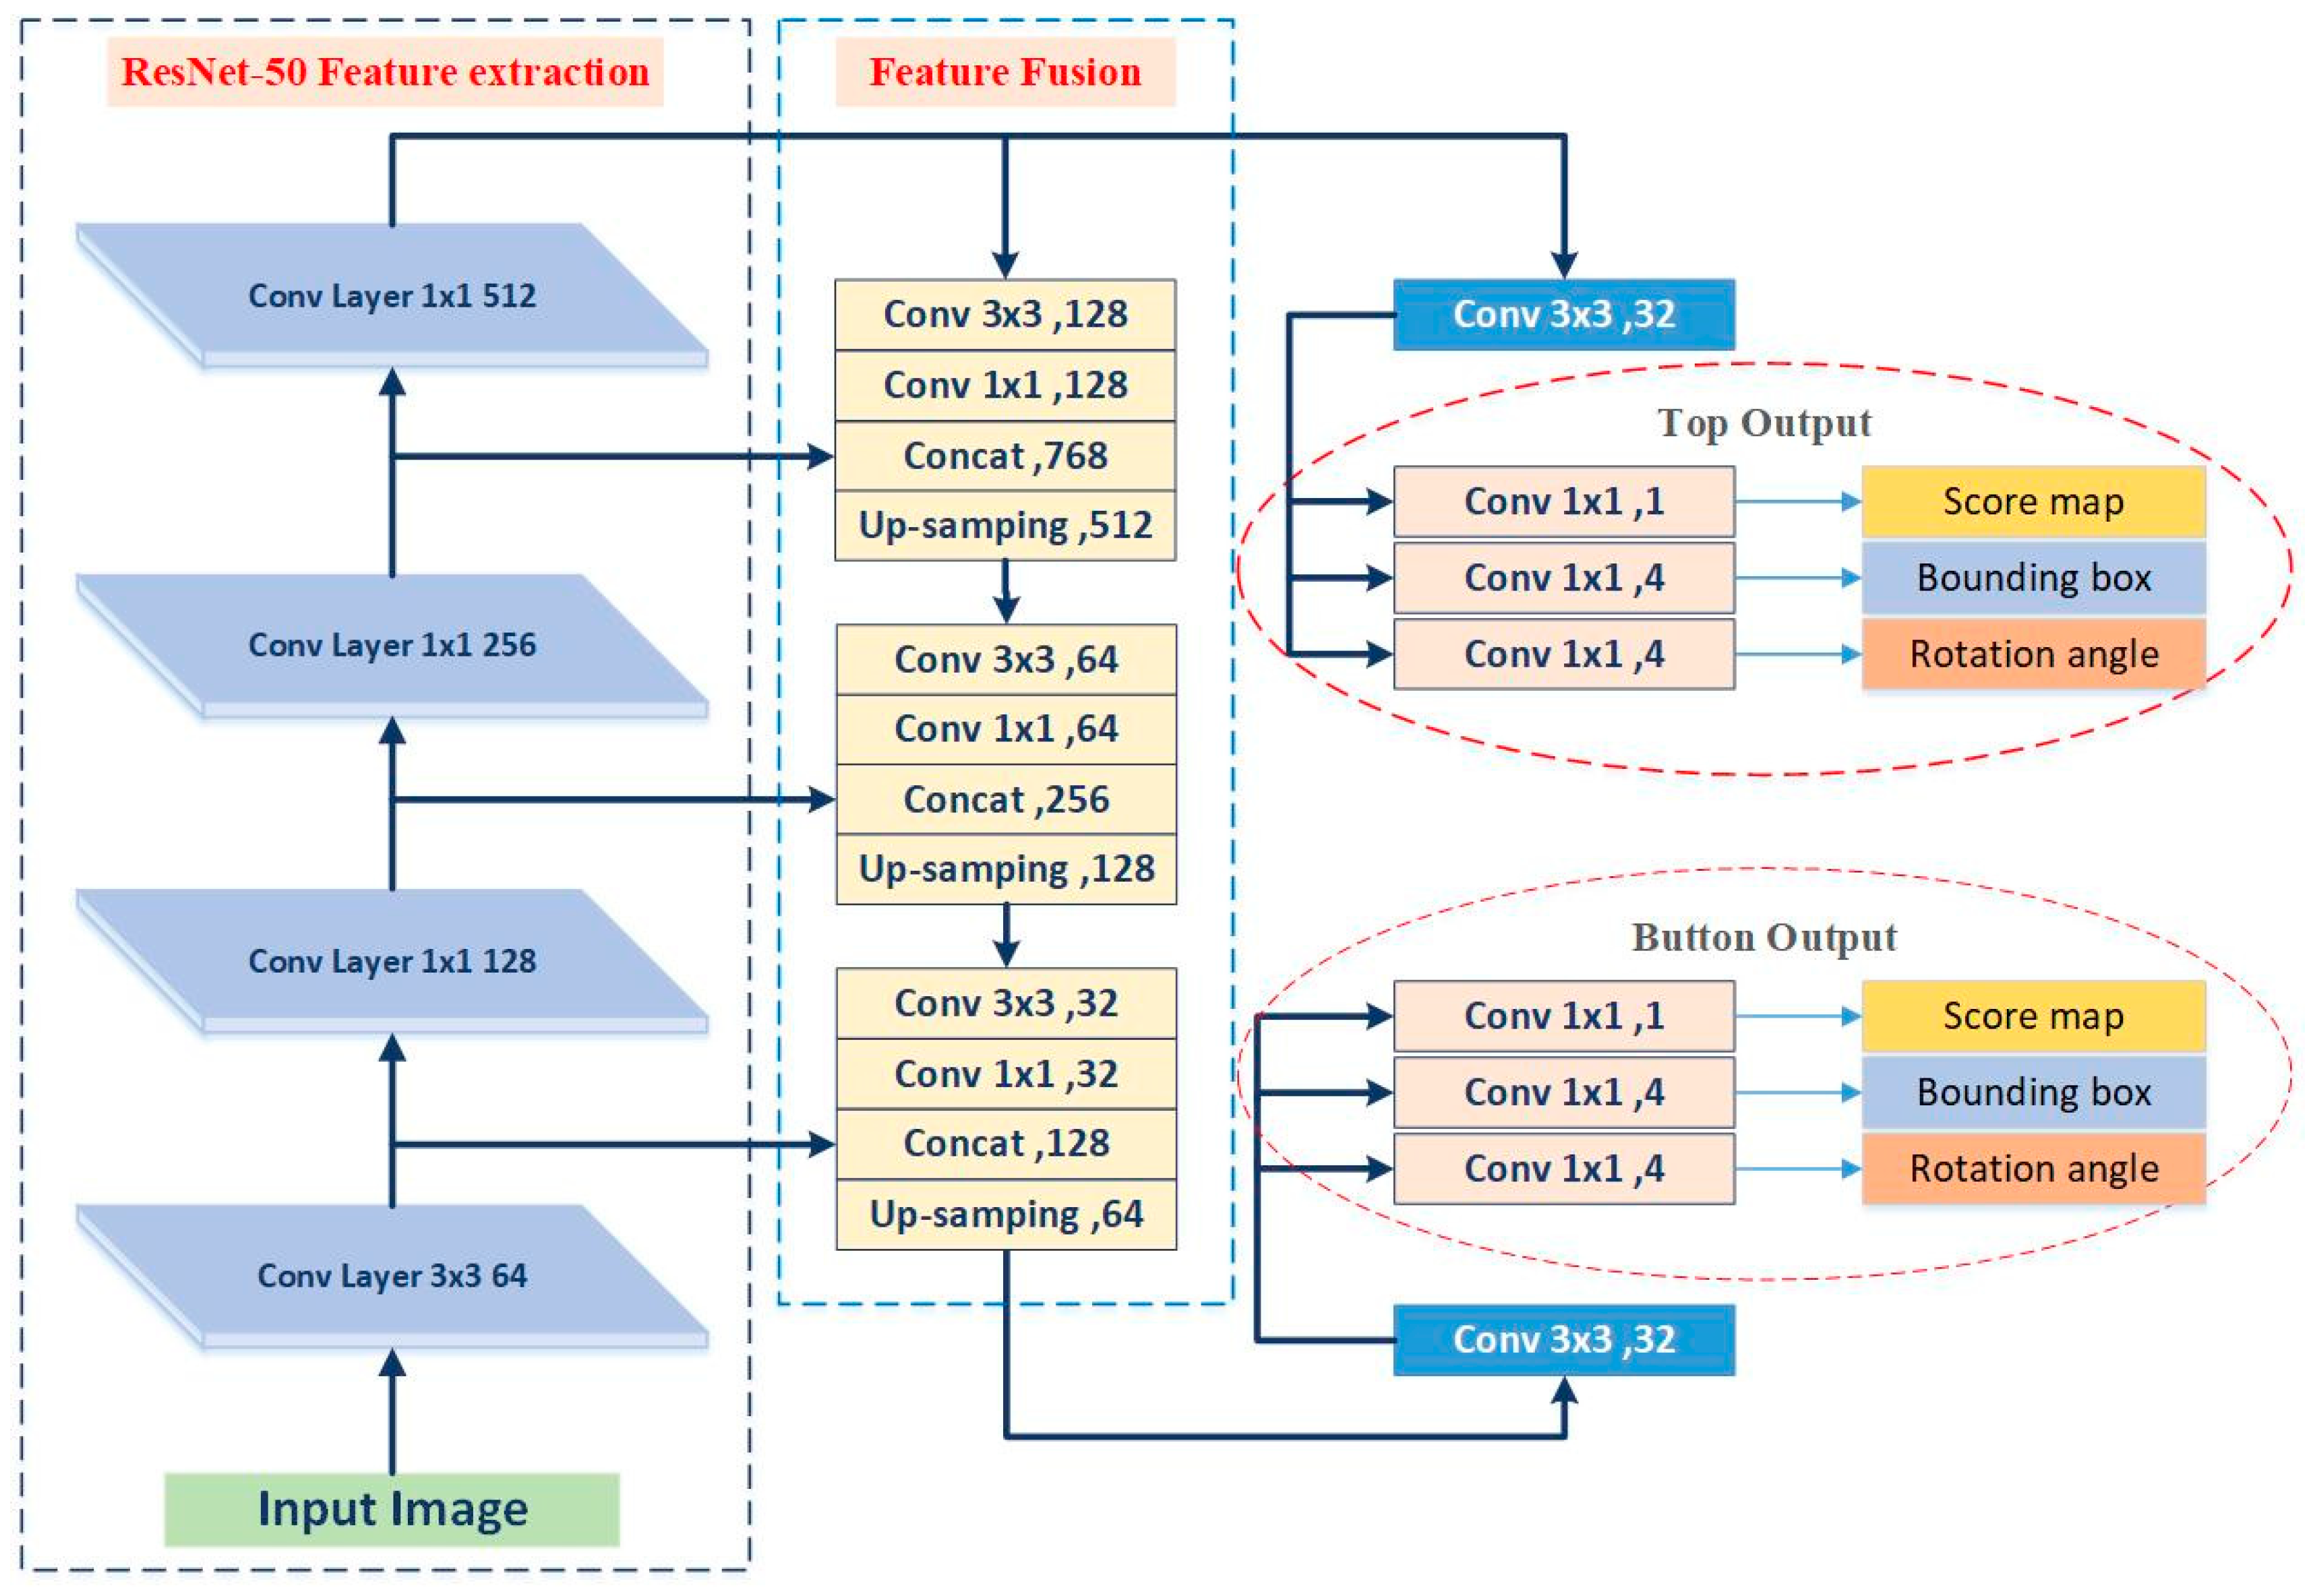
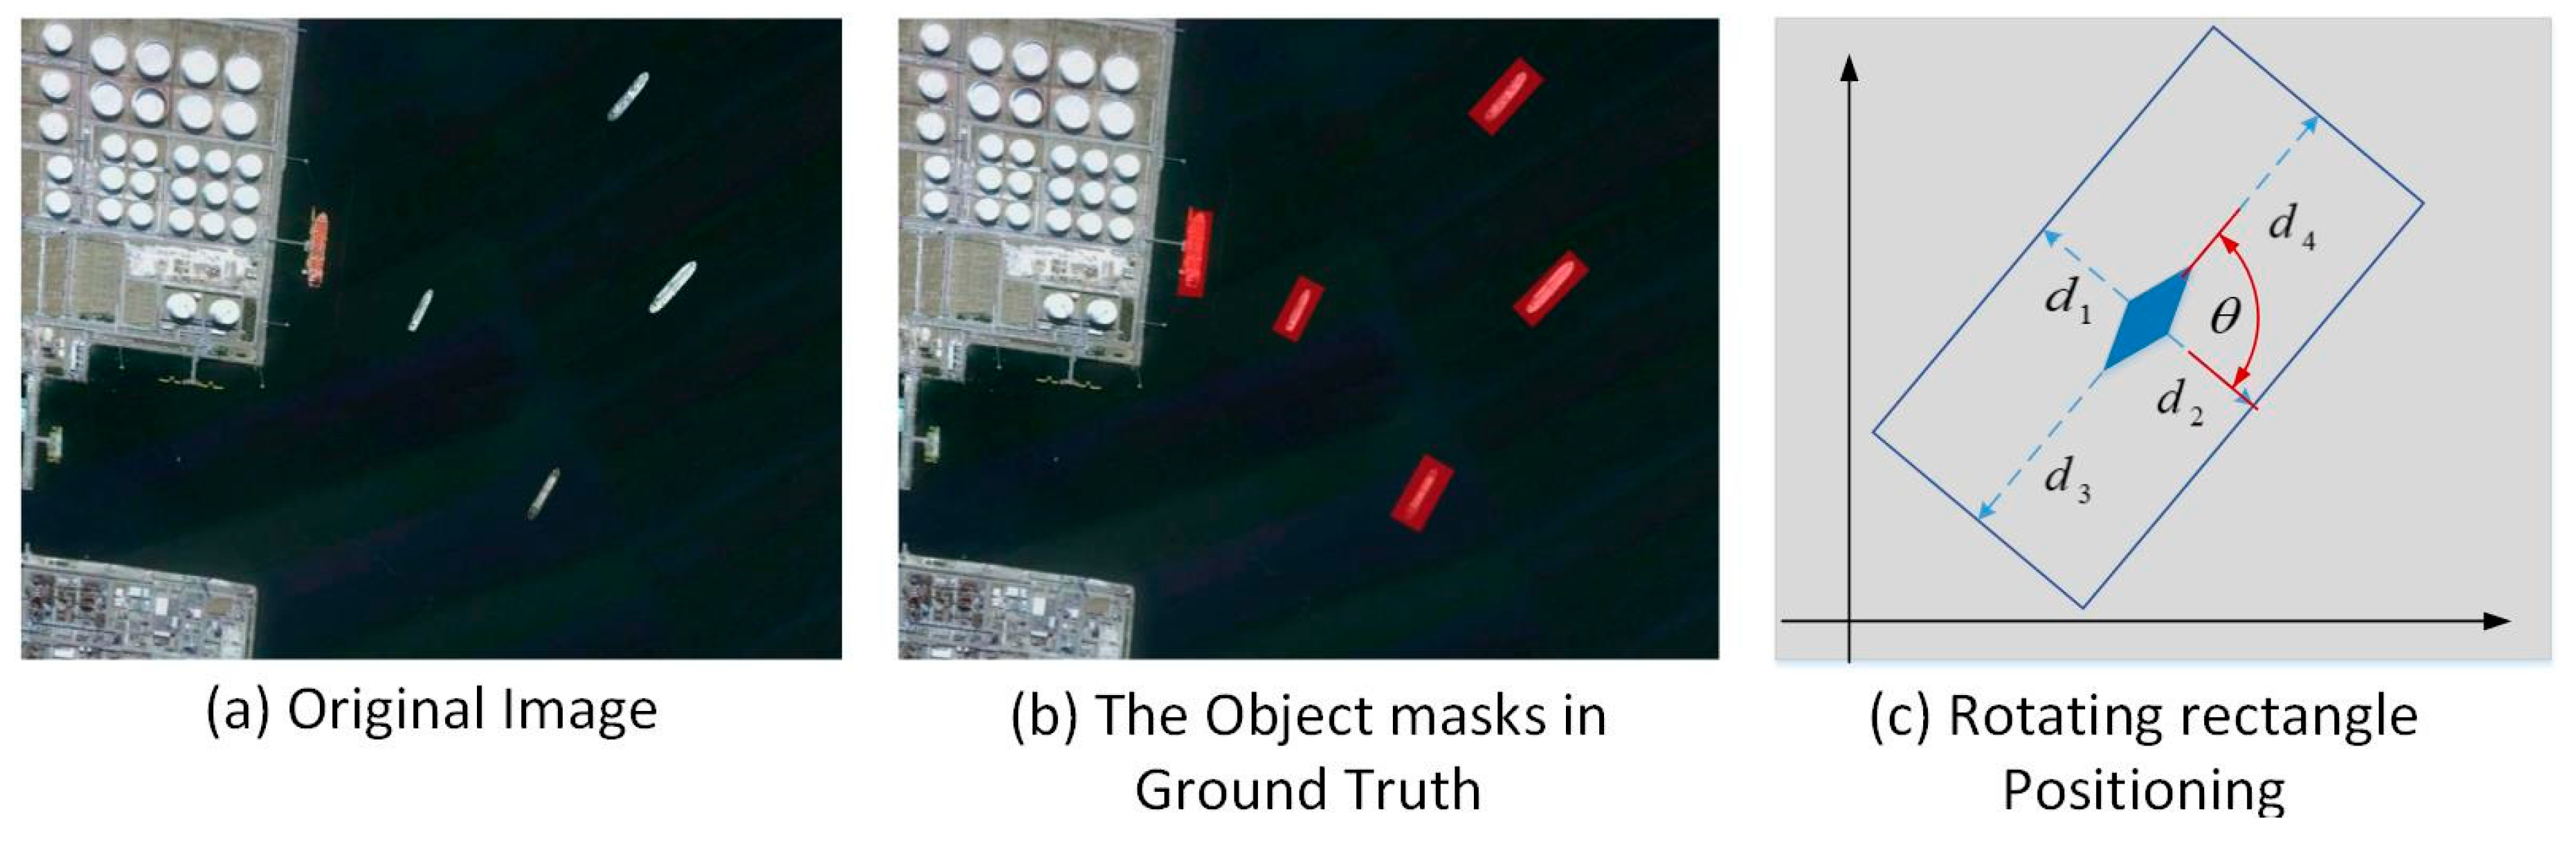
3.2. Accurate Object Detection Fully Convolutional Network (AD-FCN)

AD-FCN is an improved U-Net [20] structure, and Figure 3 shows the structure diagram of AD-FCN.
In the traditional U-Net model, the underlying features in the network are compared with the original image to construct a loss function, and then the model parameters are iteratively updated by using a back-propagation algorithm. However, according to the principle of the back propagation algorithm, the parameters closest to the loss constraint in the model will be updated preferentially, and the update amplitude of other parameters will gradually decrease with the propagation distance lengthening, which leads to the traditional U-Net model emphasizing the update of the bottom parameters while training, so that the optimization degree of the top parameters is relatively poor. According to this, this paper introduces additional loss constraints at the top of the model, so that parameters at different levels can be better optimized, thus further improving the detection accuracy.
Two parameters are needed for the location of the rotating rectangular frame: the orientation angle of the object and the boundary information of the rectangular frame. In the AD-FCN network, firstly, the object in the training data is labeled clockwise with a rotating rectangular frame, and then the object mask is generated according to the labeling information, as shown in Figure 4.
Each pixel in the object mask is defined as G = { d 1 , d 2 , d 3 , d 4 , θ } . The rotation angle and boundary information of the rectangular box can be obtained. Among them, d i represents the distance from the pixels to the four sides of the rotating rectangular frame, θ is the rotating angle of the rectangular frame, that is, the orientation of the object. The angle between the head and the tail lines of the object and the horizontal direction of the image are defined.
In order to realize object detection in an arbitrary rotation direction, AD-FCN adds top loss besides original bottom loss. Therefore, the total loss function in AD-FCN is as follows:
L D - FCN = L Top + L Bottom
where L Bottom is the loss value of the bottom output result and the truth map, L Top is the loss value of the top output result and the corresponding low-resolution truth map. The calculation process of top loss is the same as that of bottom loss. Taking bottom constraint as an example, its loss constraint can be divided into classified loss and geometric loss.
L Bottom = L cls + L geo
where L cls represents the loss of classification. In U-Net prediction map, the value of each pixel represents the confidence score of the ship. In view of the limitation of the fixed confidence threshold, which is not flexible enough, the fuzzy adaptive threshold method is used to adjust the adaptive threshold strategy to reduce the false alarm rate and the missed detection rate [22].
By default, N pixels are sent to U-Net by detecting an image. Finally, M pixels are obtained for each pixel to represent the confidence of M categories. Therefore, a total of N , M × 1 arrays can be obtained. Take out the maximum values in each array, sort them from big to small, and discard the values less than 0.1 (if all the values of N are less than 0.1, then there is no object), get the array C of N × 1 ; μ ( x ) is the membership function, μ ( C k ) is the membership degree of the region whose confidence is C k in array C . The ambiguity rate γ ( C ) of array C is a measure of the ambiguity of the array C . If h ( C k ) is the number of elements of confidence degree C k in the array C , the ambiguity rate γ ( C ) of the array C is defined as follows:
γ ( C ) = 2 n k = 0 n 1 T ( C k ) h ( C k )
where T ( C k ) = min { μ ( C k ) , 1 μ ( C k ) } . The ambiguity rate γ ( C ) of the array C depends on the membership function μ ( x ) , if the membership function is the S function, that is
μ ( x ) = { 0 , 0 x q Δ q 2 [ ( x q + Δ q ) 2 Δ q ] 2 , q Δ q x q 1 2 [ ( x q + Δ q ) 2 Δ q ] 2 , q < x q + Δ q 1 , q + Δ q < x C n
where L cls represents the loss of classification. In the U-Net prediction map, the value of each pixel represents the confidence score of the ship.
Then μ ( x ) is determined by the window width c = 2 Δ q and the parameter q . Once the window width is selected, γ ( C ) is only related to the parameter q . The solution process of the fuzzy threshold method is to set the window width in advance, while the coefficient is always set at 0.3. By changing q , the membership function μ ( x ) slides on the confidence interval [ C 0 , C n 1 ] , and the fuzzy rate curve is obtained by calculating the fuzzy rate γ q ( C ) . The valley point of the curve, even if γ q ( C ) has the minimum value q , is the adaptive threshold required. In this paper, the value of confidence greater than q is set to 255, and the predictive mask is obtained. Using Diss’s loss method, a classification loss function is constructed by comparing the predictive mask with the real mask, in which y cls represents the real mask, and y ^ cls represents the predictive mask.
L cls = 2 | y cls y ^ cls | | y cls | + | y ^ cls |
The geometric loss L geo includes rectangular frame positioning loss and rotation angle loss, as shown in the formula
L geo = L Bbox + L θ
where, L Bbox is the loss of the rectangular frame. IoU is used to calculate the loss of the rectangular frame. Its expression is shown in Formula (21), where R ^ represents the predicted mask area, and R represents the real mask area.
L Bbox = log IoU ( R ^ , R ) = log | R ^ R | | R ^ R |
L θ is the loss of rotation angle, and the calculation method is based on the formula:
L θ = 1 cos ( θ ^ θ )
where, θ ^ represents the predicted rotation angle, and θ represents the real rotation angle.

4. Results

In this chapter, we implement ablation research to analyze and verify the impact of different computing components on detection strategies. At the same time, in order to verify the overall advancement of this model, we compare the most advanced object detection models based on deep learning that have been proposed in recent years.

4.1. Experimental Dataset and Evaluation Index

The image data used in this experiment are from a high-resolution optical remote sensing image. The classifier based on a conventional dataset training has poor detection ability with high-resolution remote sensing images. The main reason is that a remote sensing image has particular features, such as various scales, a special perspective, small objects, multi-directionality, and high background complexity. In this paper, several mainstream remote sensing image databases are used as experimental datasets, including DOTA [23], UCAS-AOD [24], NWPU VHR-10 [25], TGRS-HRRSD-Dataset [26], and RSOD [27]. In addition, stretched image histogram [coefficient 0.02], rotation, and random flip are used to expand the dataset.
Considering a small object in large-scale remote sensing image and the need of practical engineering application, object detection needs to perform the two tasks of object location and object recognition simultaneously. The accuracy of object location is determined by comparing the overlap degrees (IoU) of the predicted border and ground truth border and the size of the threshold, and the correctness of object recognition is determined by comparing the confidence score and the threshold. The above two steps are used to determine whether the object detection is correct or not. Finally, the problem of multi-class object detection is transformed into a two-class problem of correct detection of a certain kind of object and detection error. Thus, a confusion matrix can be constructed, and a series of indicators of object classification can be used to evaluate the accuracy of the model [28].
In multi-object classification, the recognition effect of existing objects is concerned, and the recognition rate generally refers to the detection rate. The sum of sham alarm rate P f , detection rate P d , missed detection rate P m , and false detection rate P e is 1. In the actual calculation, the recognition rate is first calculated, then the false alarm rate and the false alarm rate are calculated, and the classified false alarm rate is calculated by counting the object types recognized by the remaining systems but not actually present. The false alarm rate accumulated in a certain period of time should be calculated for the false alarm rate in multi-object recognition. For datasets, we use the averaging method to calculate the overall sham alarm rate, missed detection rate, detection rate, and false detection rate [28].
Deep learning adjusts the weight of a neural network through the back propagation of errors to achieve the goal of modeling. The number of back propagation iterations gradually increased from tens of thousands to hundreds of thousands until the training error tended to converge. Finally, the model is evaluated by calculating the average precision (AP) of the model on the test set and the mean AP (m AP) of all categories. AP measures the accuracy of the detection algorithm from the perspective of recall rate and accuracy rate. AP is the most intuitive standard to evaluate the accuracy of depth detection model, which can be used to analyze the detection effect of a single category. MAP is the average value of each category of AP. The higher the mAP, the higher the comprehensive detection performance of the model in all categories [29].
Because of different picture sizes, the testing speed of individual pictures varies greatly, so the unit of testing time is set to s / 1000 × 1000 , that is, the average testing time per 1000 × 1000 size images. In this paper, the test platform CPU is Intel Core i7 6700, the deep learning operating environment is TensorFlow 2.0, cuDNN 7.4.1, CUDA 10.0, Python version 3.7, the graphics card is NVIDIA Titan X, and the operating system is Ubuntu x64. In this paper, the initial learning rate of the network is set to 0.003, and when the number of training iterations reaches 100 and 20,000, the rate decreases 10 times. The activation function used is Leaky. We randomly initialize all layers by extracting weights from a zero-mean Gaussian distribution with a standard deviation of 0.01.

4.2. Analysis of the Pre-screening Effect of SOSA-FCN

To evaluate the effectiveness of SOSA-FCN in visual attention, we first verify the performance of SOSA-FCN for FP (fixation prediction) tasks. The purpose of this experiment is to study the validity of the fixed map in advance learning, rather than compare it with the most advanced FP model. Then, we evaluate the performance of SOSA-FCN in primary salient object detection (SOD) tasks. For FP tasks, we use five typical measures: normalized scanpath saliency (NSS), similarity metric (SIM), linear correlation coefficient (CC), AUC-Judd, and shuffled AUC. For SOD tasks, three standard metrics are used, namely, precision and recall (P-R) curve, F-measure, and MAE [17]. The image zooming process is added before the SOSA-FCN network test. By setting the resize parameter value, the detection speed can be significantly improved with a certain detection accuracy. We set the resize parameter to 3.
We evaluate the fixed prior map generated by SOSA-FCN and compare it with several state-of-the-art fixed models, including three classical models, i.e., ITTI [30], GBVS [31], and AIM [32], and the in-depth learning-based models P-FCN [6], Mr-CNN [33], Shallow-Net [34], Deep-Net [34], and AS-Net [17], reporting the results through DOTA and NWPU VHR-10 datasets.
As shown in Table 1, SOSA-FCN performs better than previous non-in-depth learning models and is more competitive in attention detection and efficiency than the current best-performing in-depth learning competitors, which indicates that the proposed SOSA-FCN may obtain better FP results with more detailed spatial information.
Here, we evaluate the performance of SOSA-FCN on its main task: SOD. Three widely used datasets, DOTA, UCAS-AOD, and NWPU VHR-10, were quantitatively studied. We compare SOSA-Net with alternative methods based on in-depth learning: P-FCN, ELD [35], RFCN [36], DHS [37], HEDS [38], DSSOD [38], AS-Net. We also consider several classical non-in-depth learning models: HS [39], DRFI [40], and DSR [41], using results from authors or running their open source implementations through the original settings. We report in Table 2 the maximum F measurements (Fβ) and MAE scores. Overall, the proposed method achieves better performance on three datasets using all evaluation indicators.
In this paper, the P-R curve is used to compare the proposed method with the existing saliency detection method based on depth learning. In Figure 5, we depict P-R curves generated by the method used in this paper and the most advanced method used in the past on three popular datasets, i.e., DOTA, UCAS-AOD, and NWPU VHR-10. Obviously, by combining the results of multiple datasets, the algorithm in this paper can achieve the best results. We also find that when the recall score is close to 1, the accuracy of our method is much higher, which reflects the fact that our false alarm is much lower than that of other methods and shows the effectiveness of our strategy. The visual attention map of the object in the high-resolution remote sensing image with complex background thus obtained more closely corresponds to the basic facts.
Figure 6 shows the qualitative results for an example image from the above dataset, which verify that the proposed SOSA-FCN is very suitable for the task of extracting attention maps of high-resolution complex scenes.

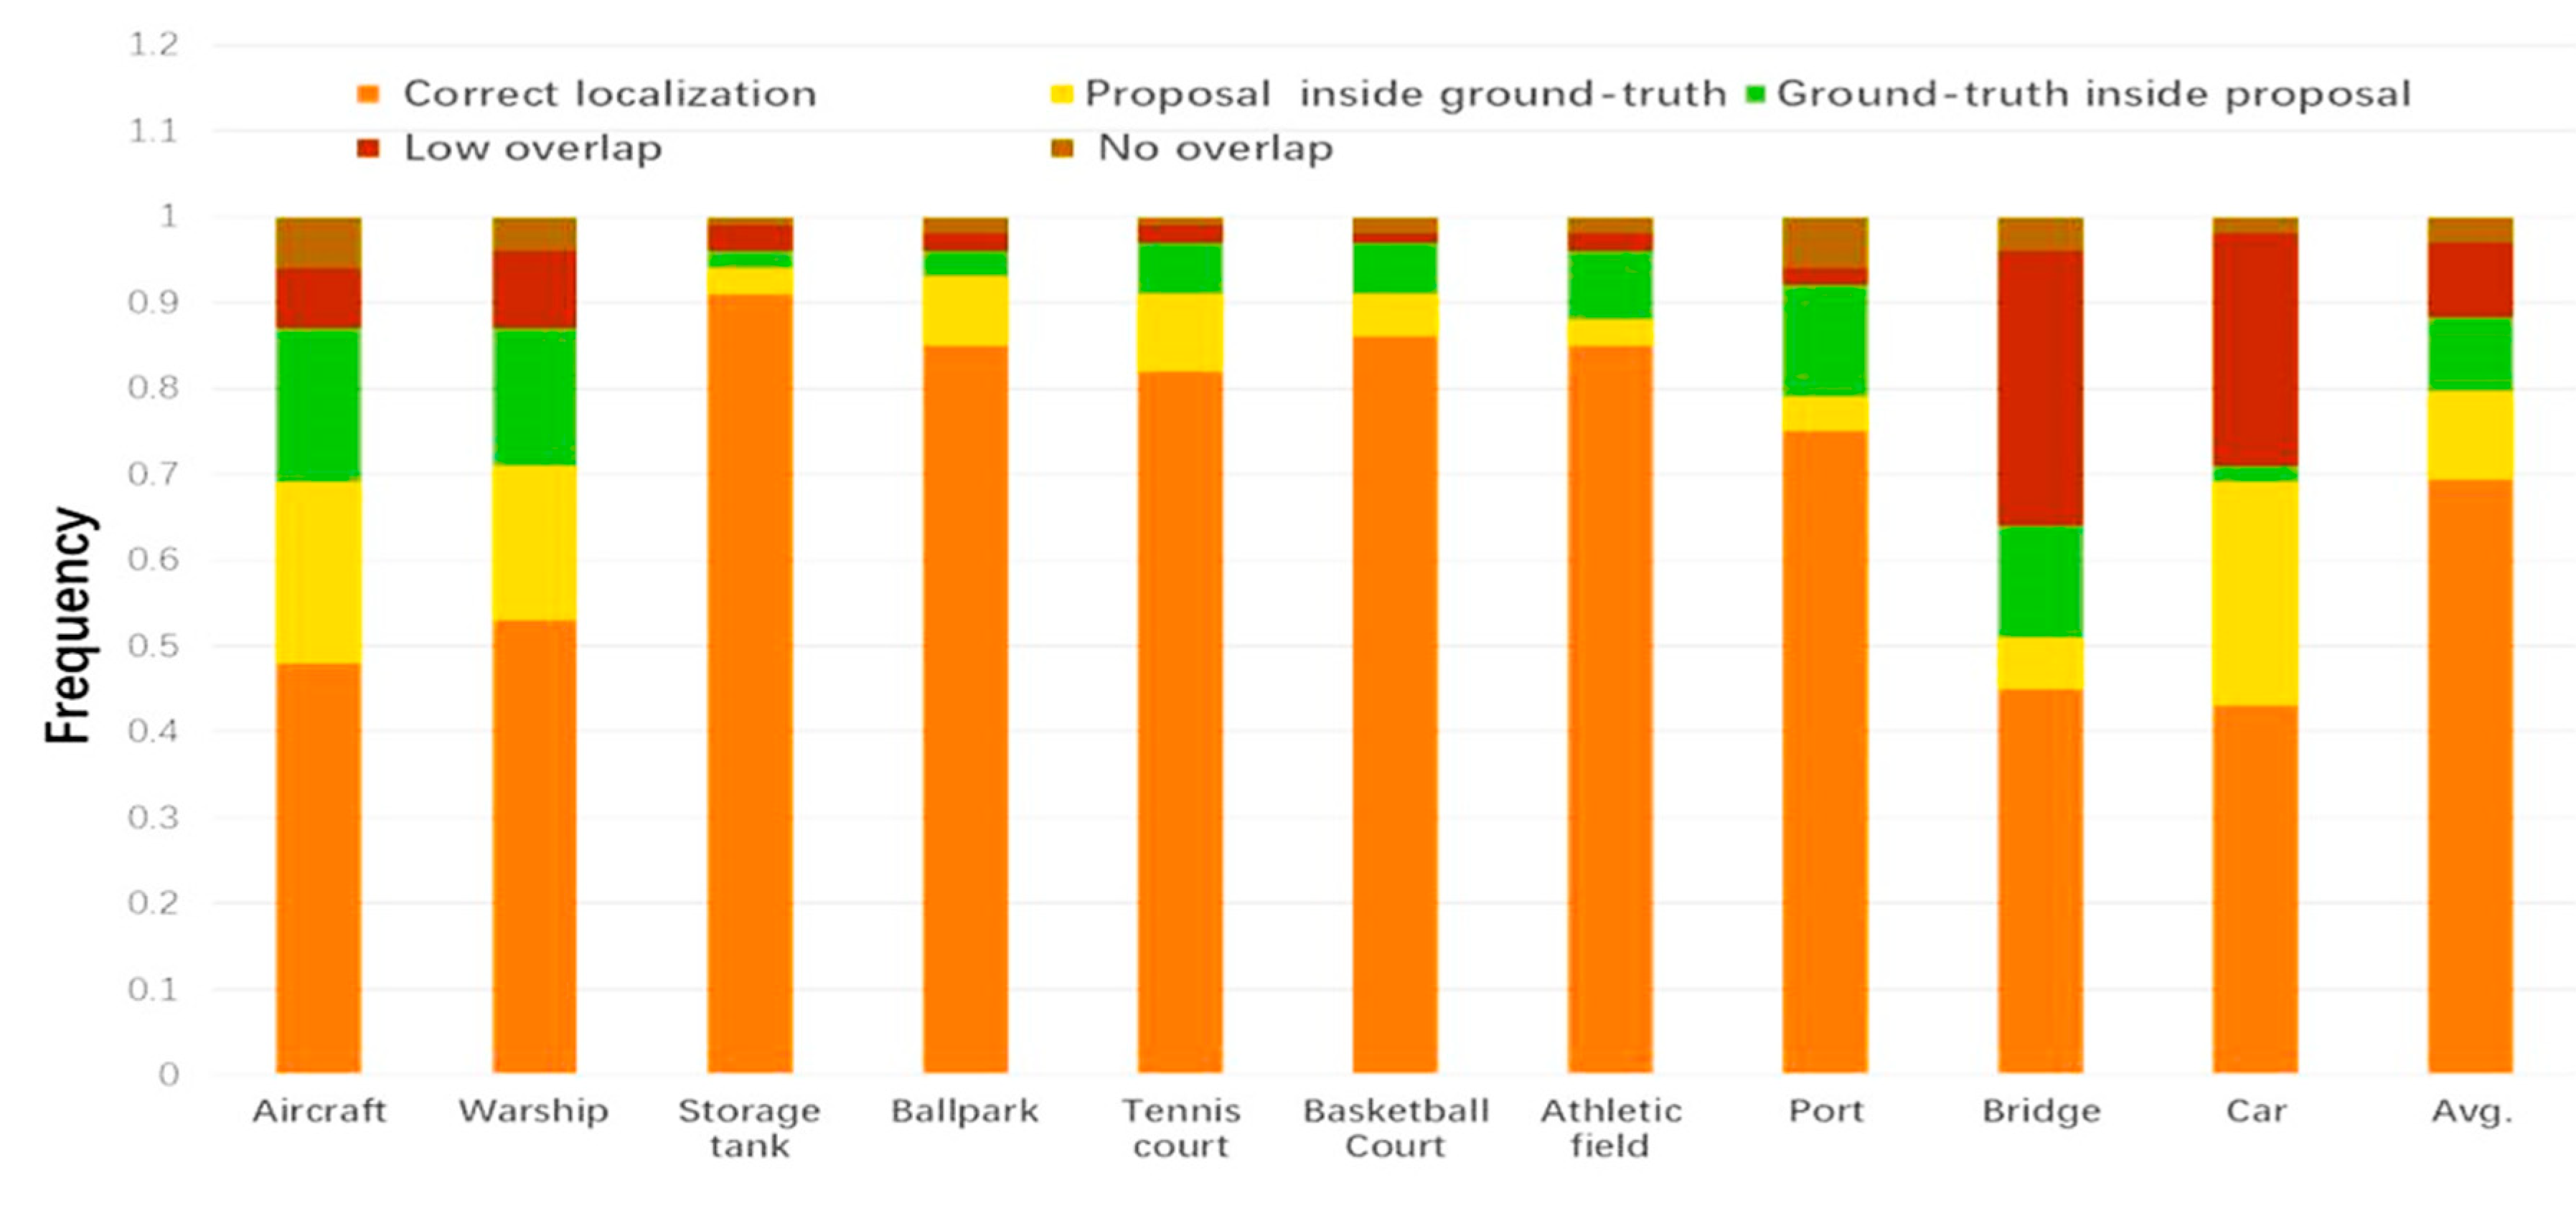
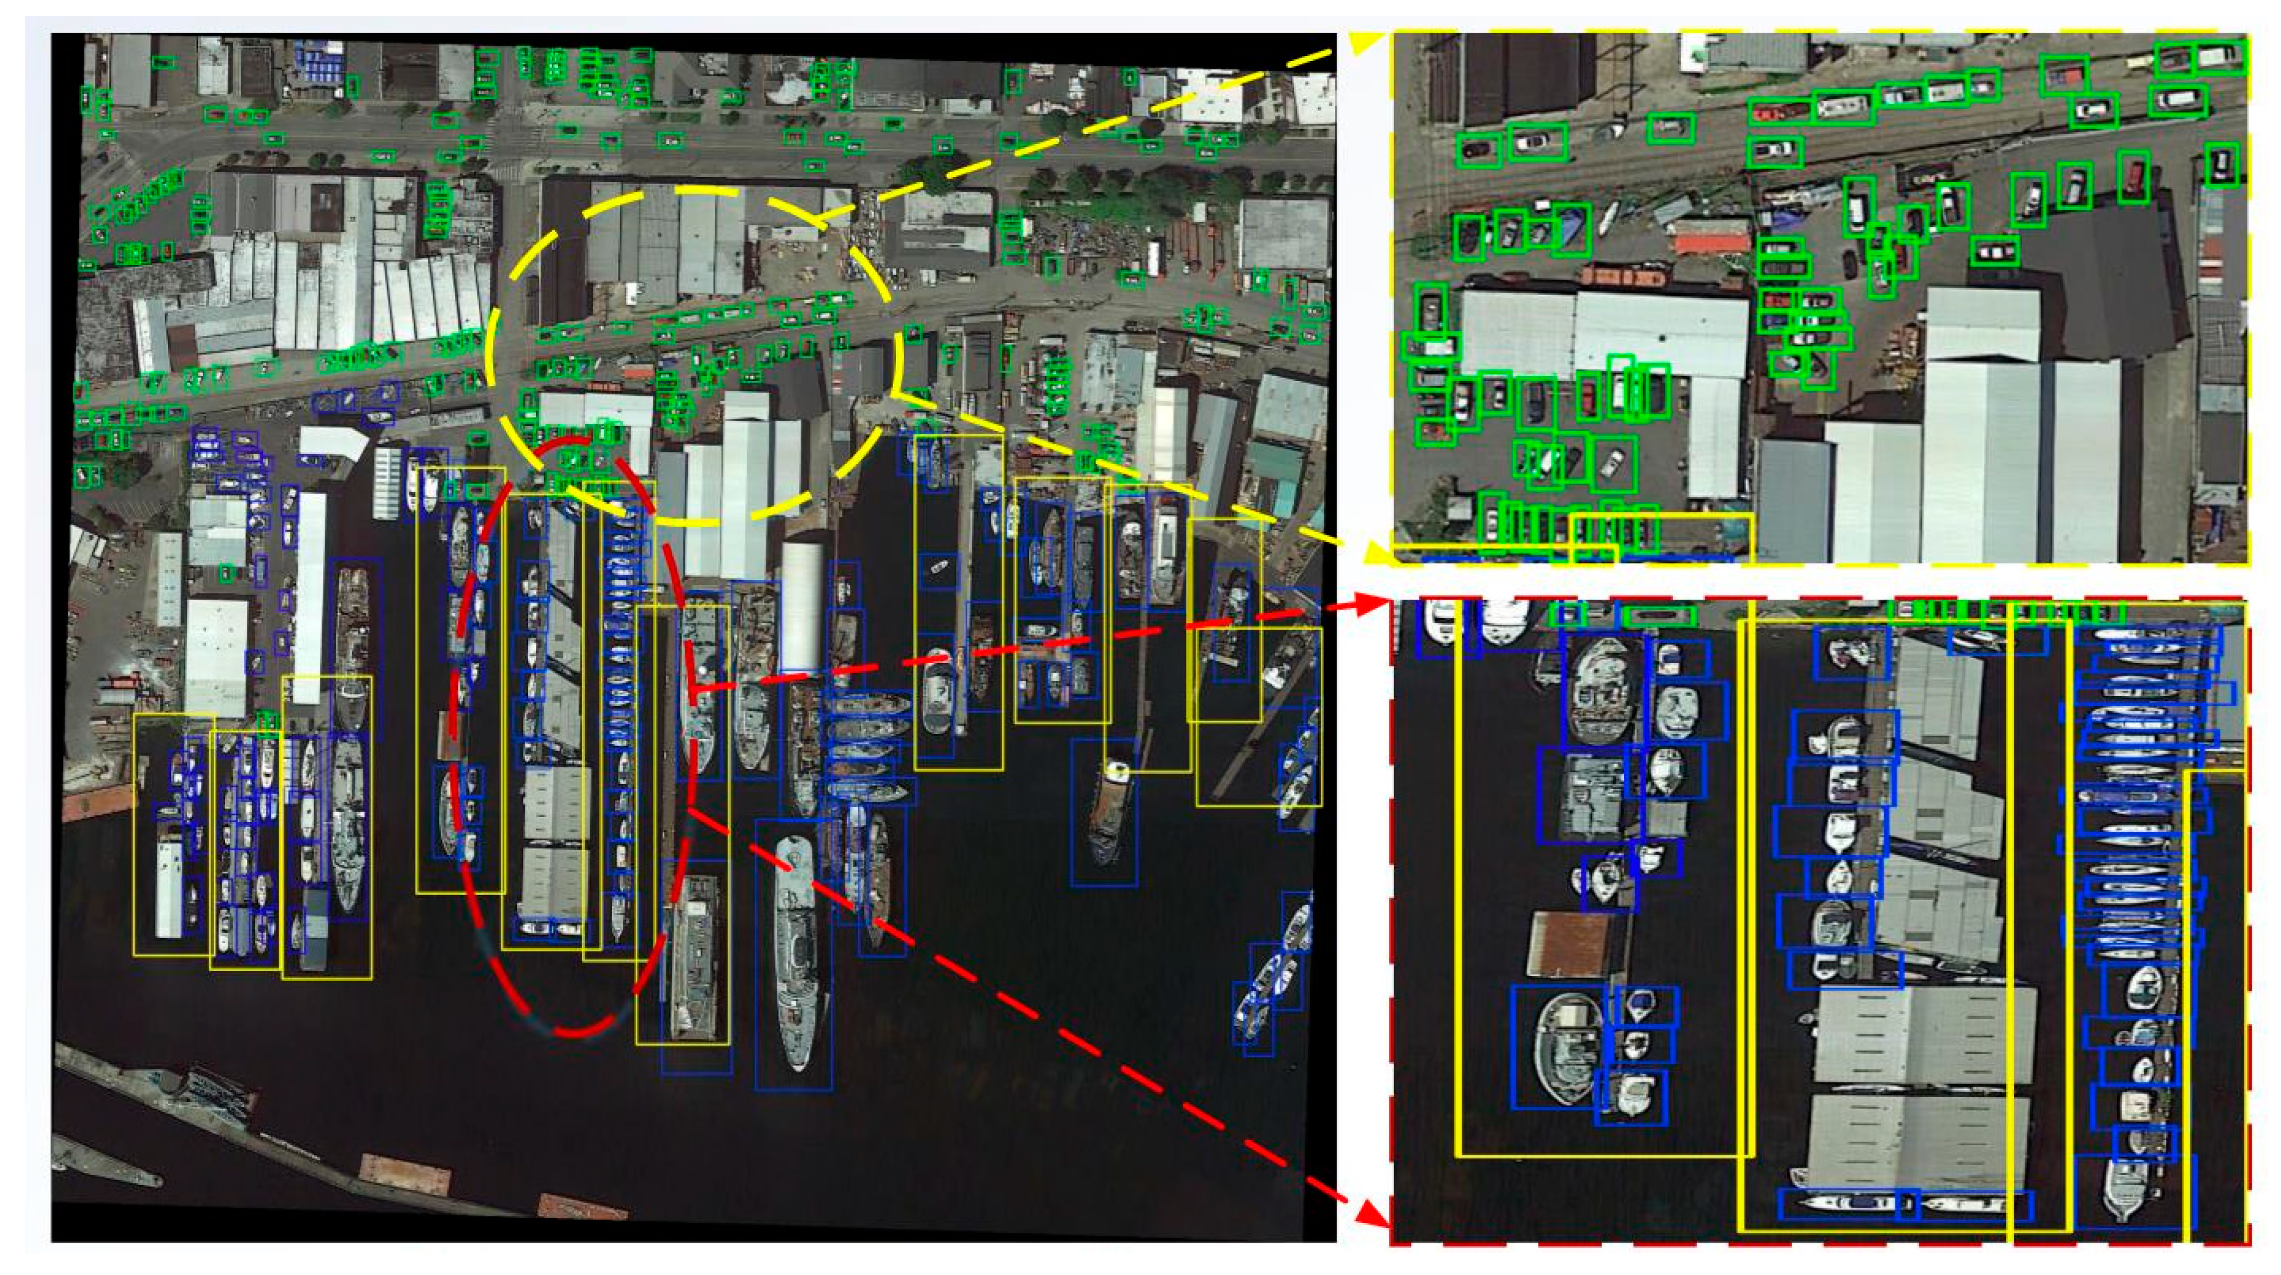
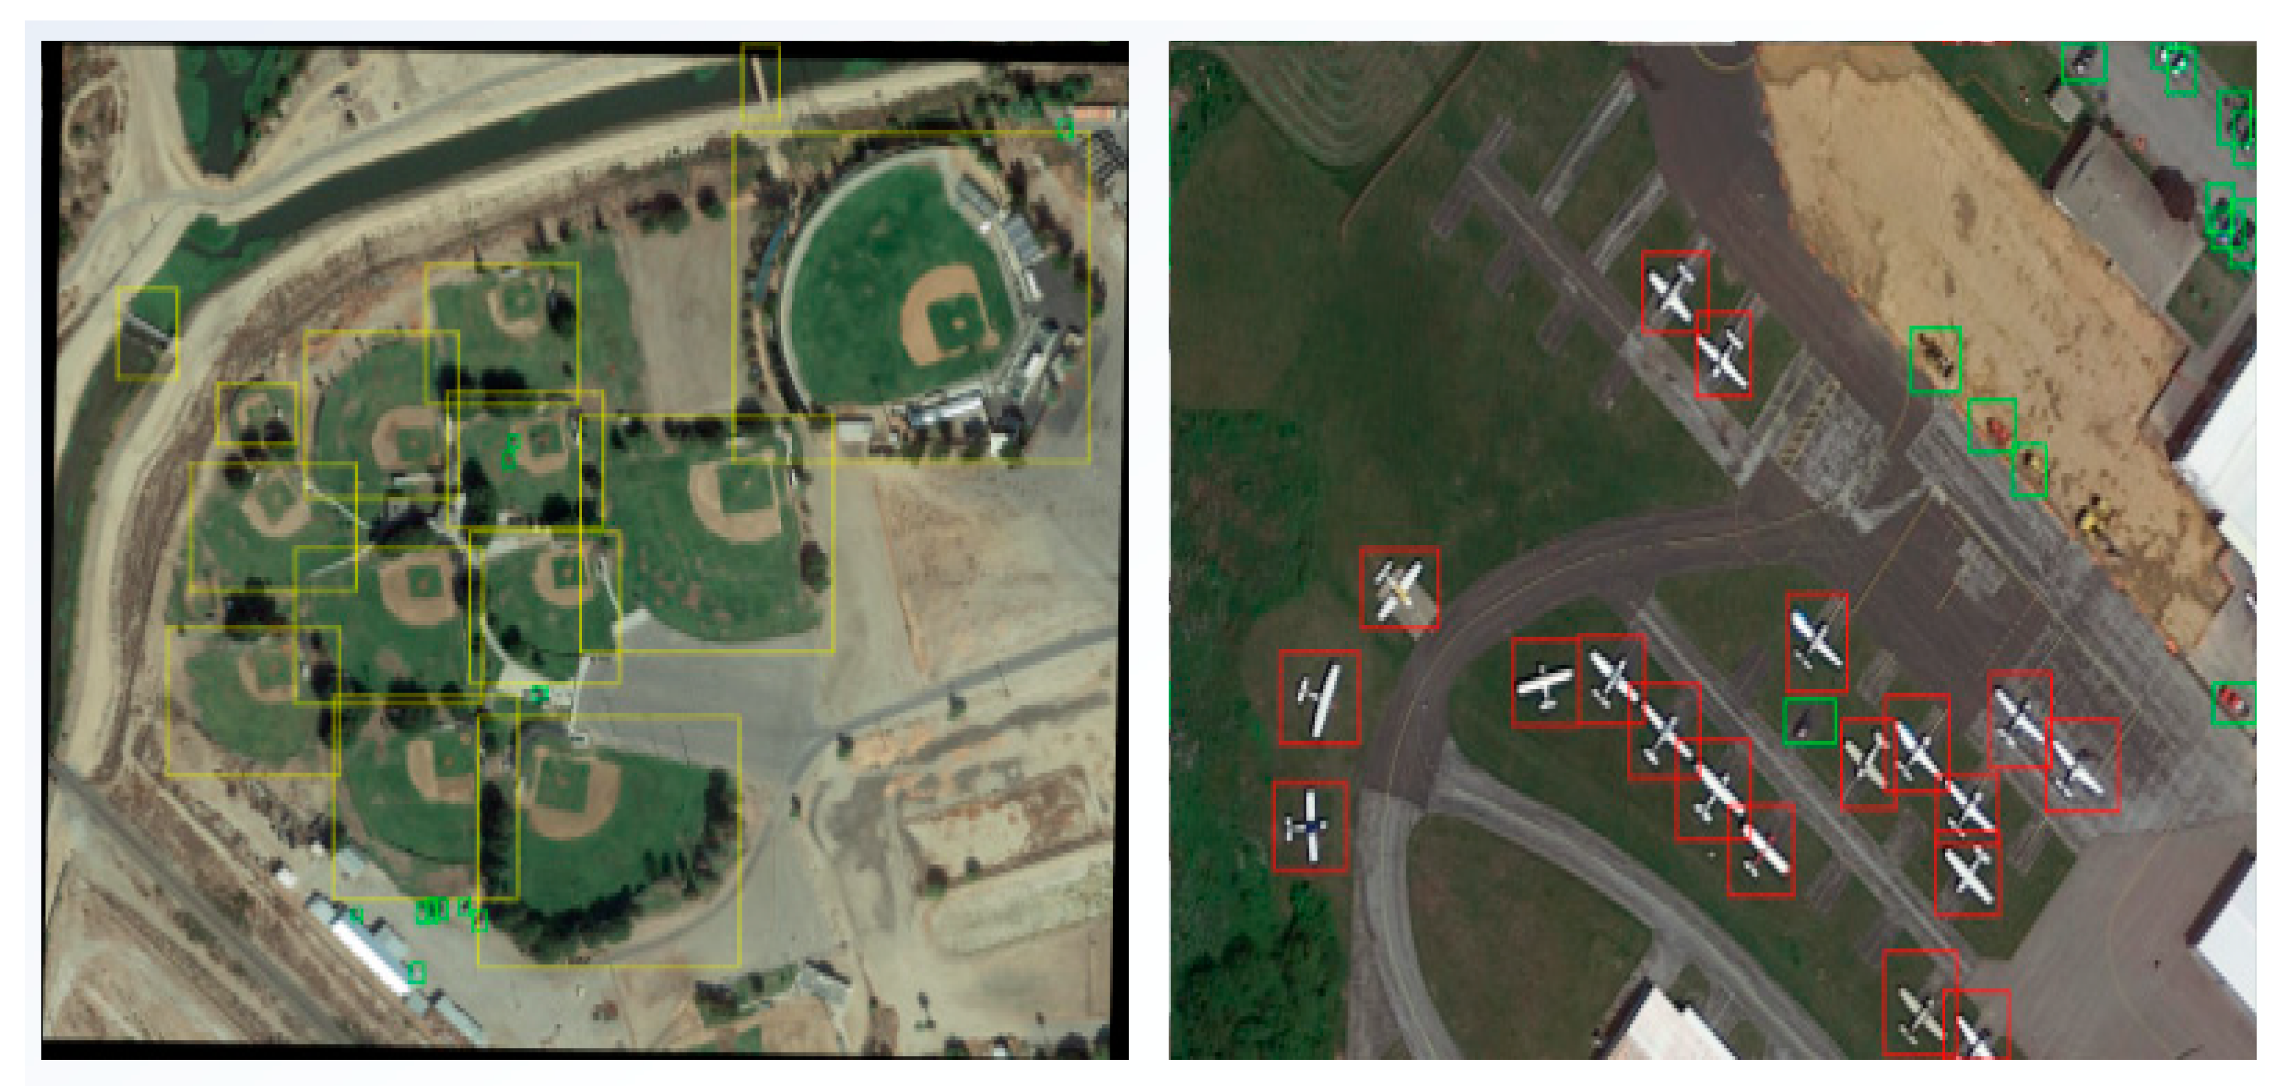
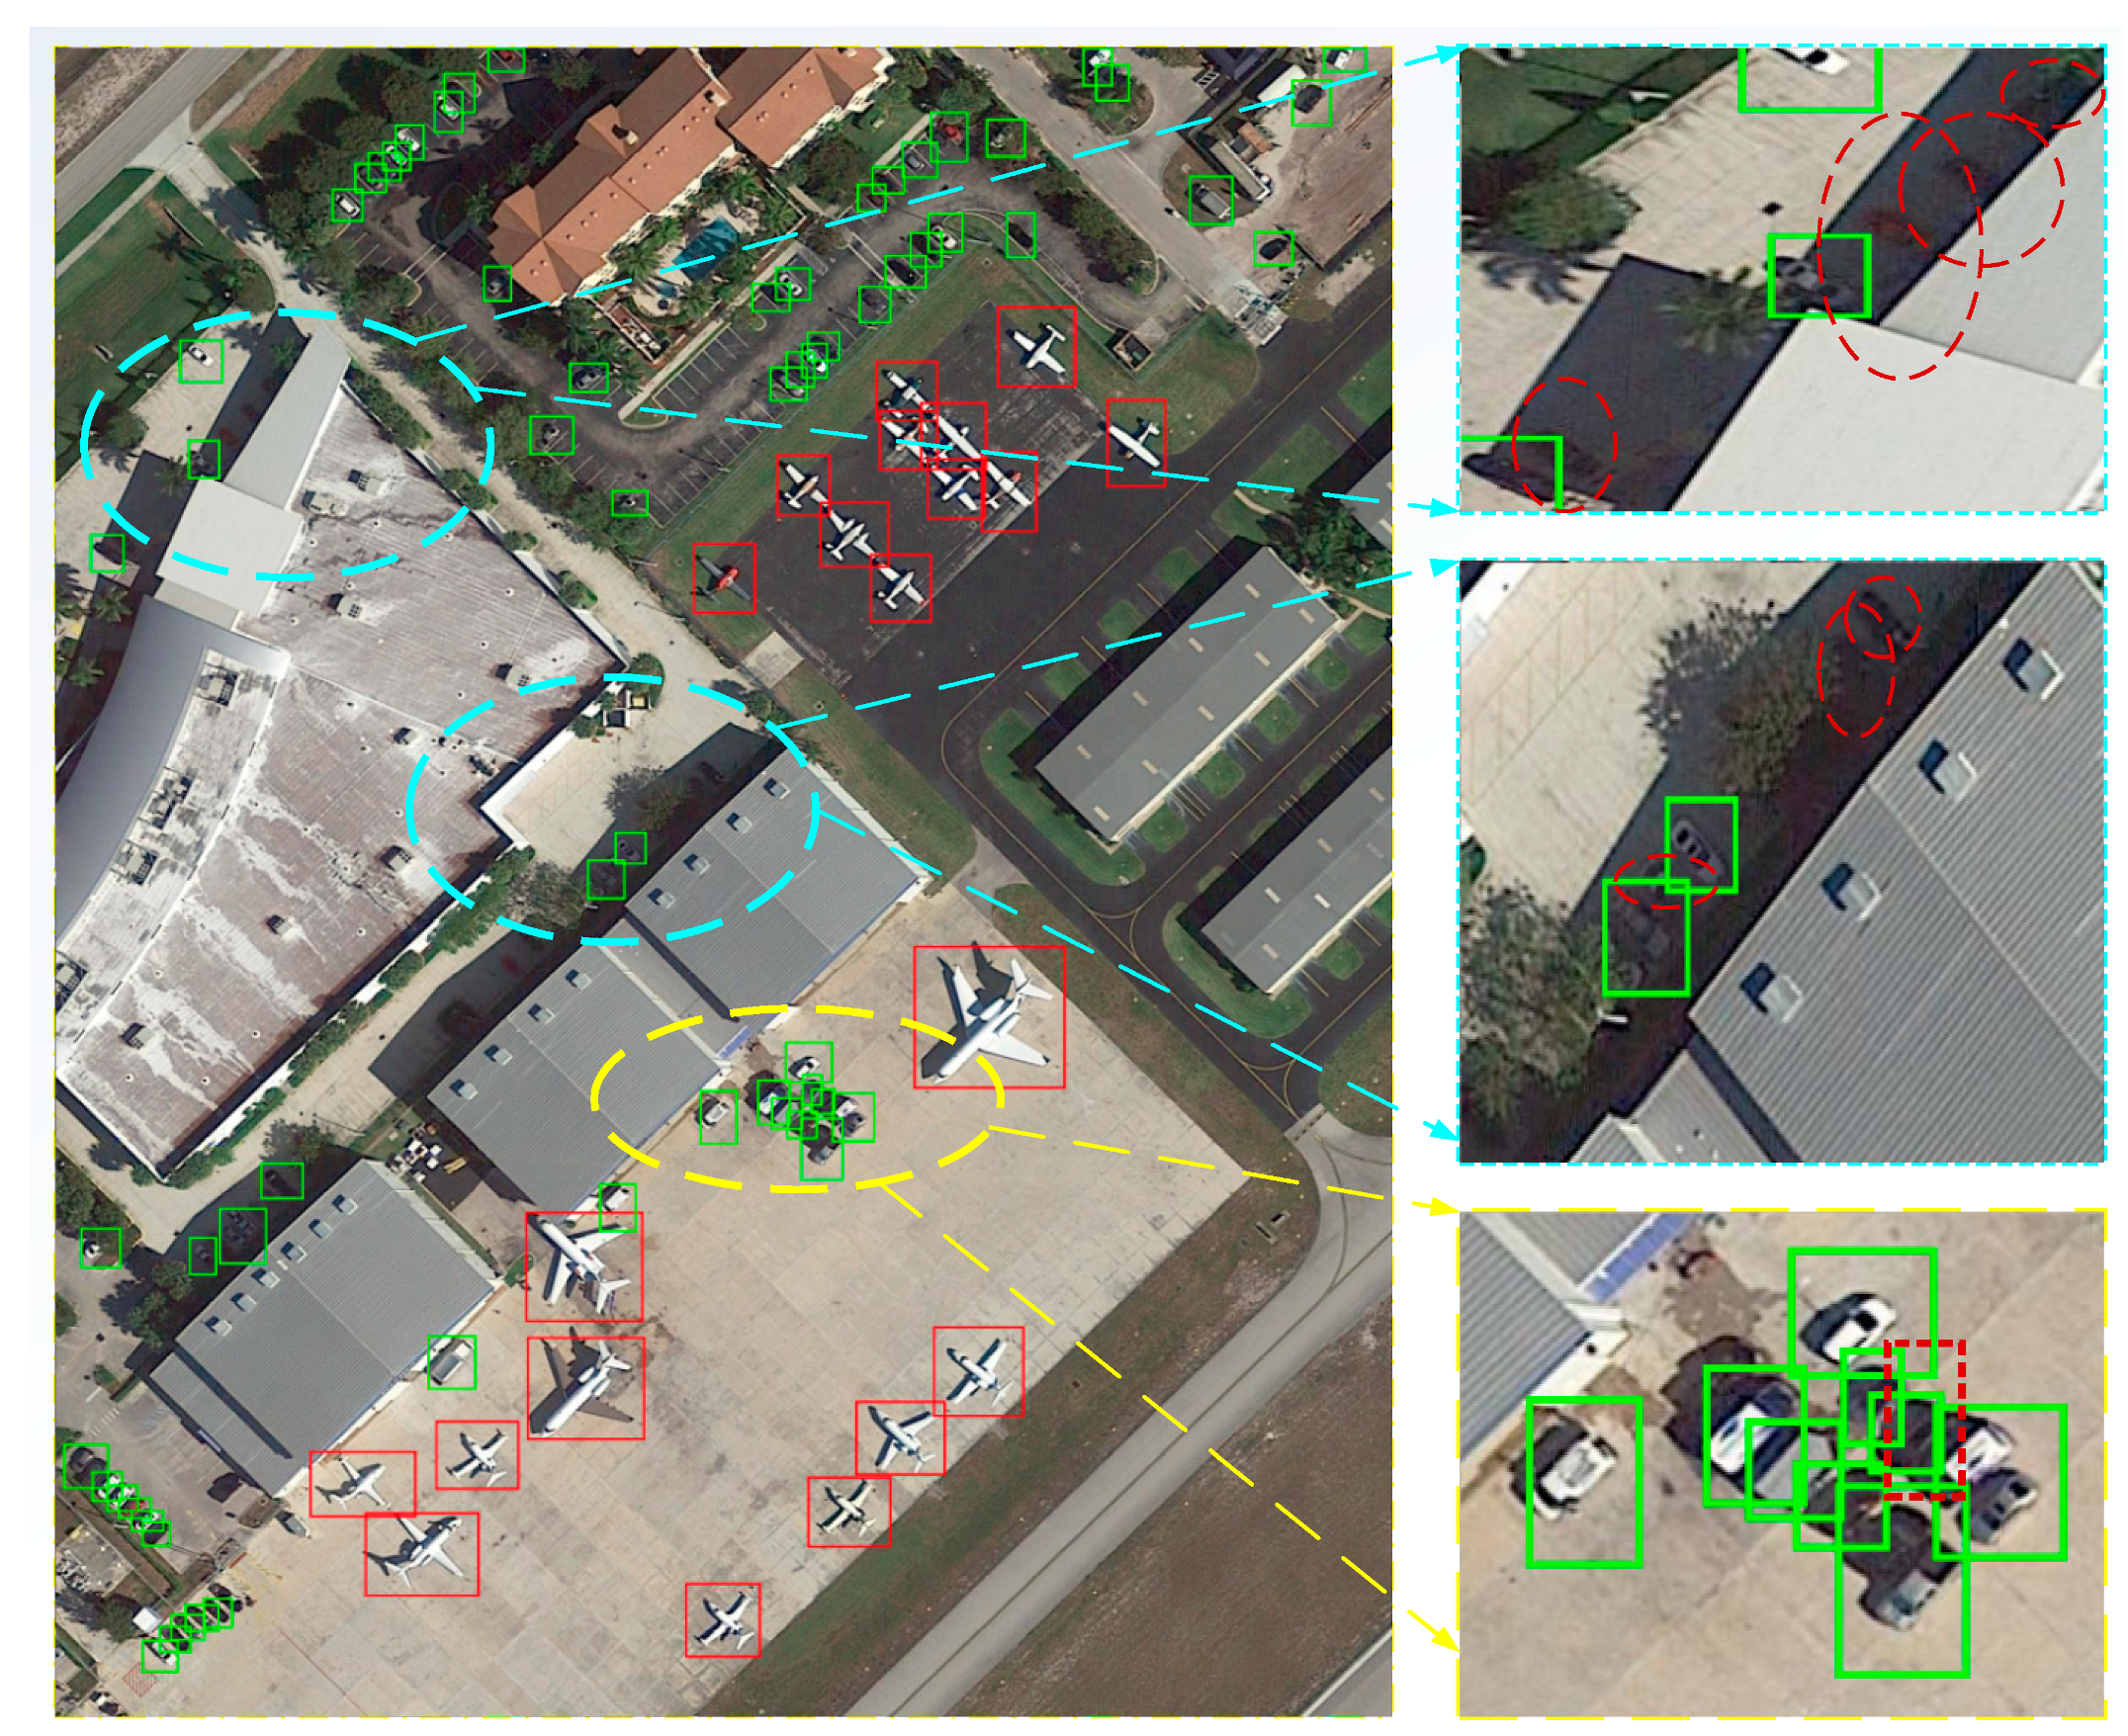
4.3. Analysis of the Detection Effect of AD-FCN

The experiment was carried out on the NWPU VHR-10 dataset. Firstly, we compare the proposed method with the seven mainstream baseline detection strategies of SS-A [42], SS-V [43], SS-A-F [44], EB-A-F [45], EB-V-F [46], EB-V-F-CS [29], and EB-V-F-BR [29]. The results are shown in Table 3. The evaluation index is mAP (mean average precision).
By comparing the experimental results of various detection strategies, we find that, compared with other mainstream detection strategies, AD-FCN introduces additional loss constraints at the top layer of the model, so that the parameters at different levels can be better optimized; also, an improved strategy consisting in adding an object mask and an object orientation estimation layer for multi-task learning can effectively improve the detection accuracy.
In order to further analyze the positioning error of AD-FCN, we classify each extraction object in positive training images as one of the following five situations: correct positioning (overlap (>50%), recommendation (complete) in real internal ground truth, recommendation containing real knots. None of the above situations is ground truth in origin, but no-zero overlap and no overlap [47]. Figure 7 shows the frequency of these five situations for each object class and the average error for all categories of AD-FCN. The experimental results show that the positioning accuracy of AD-FCN for different types of objects can reach more than 70%, which basically avoids the problem of no overlap error. Figure 7 shows that nearly 98% of the selected object detection frames overlap with their corresponding basic fact boundaries to some extent.

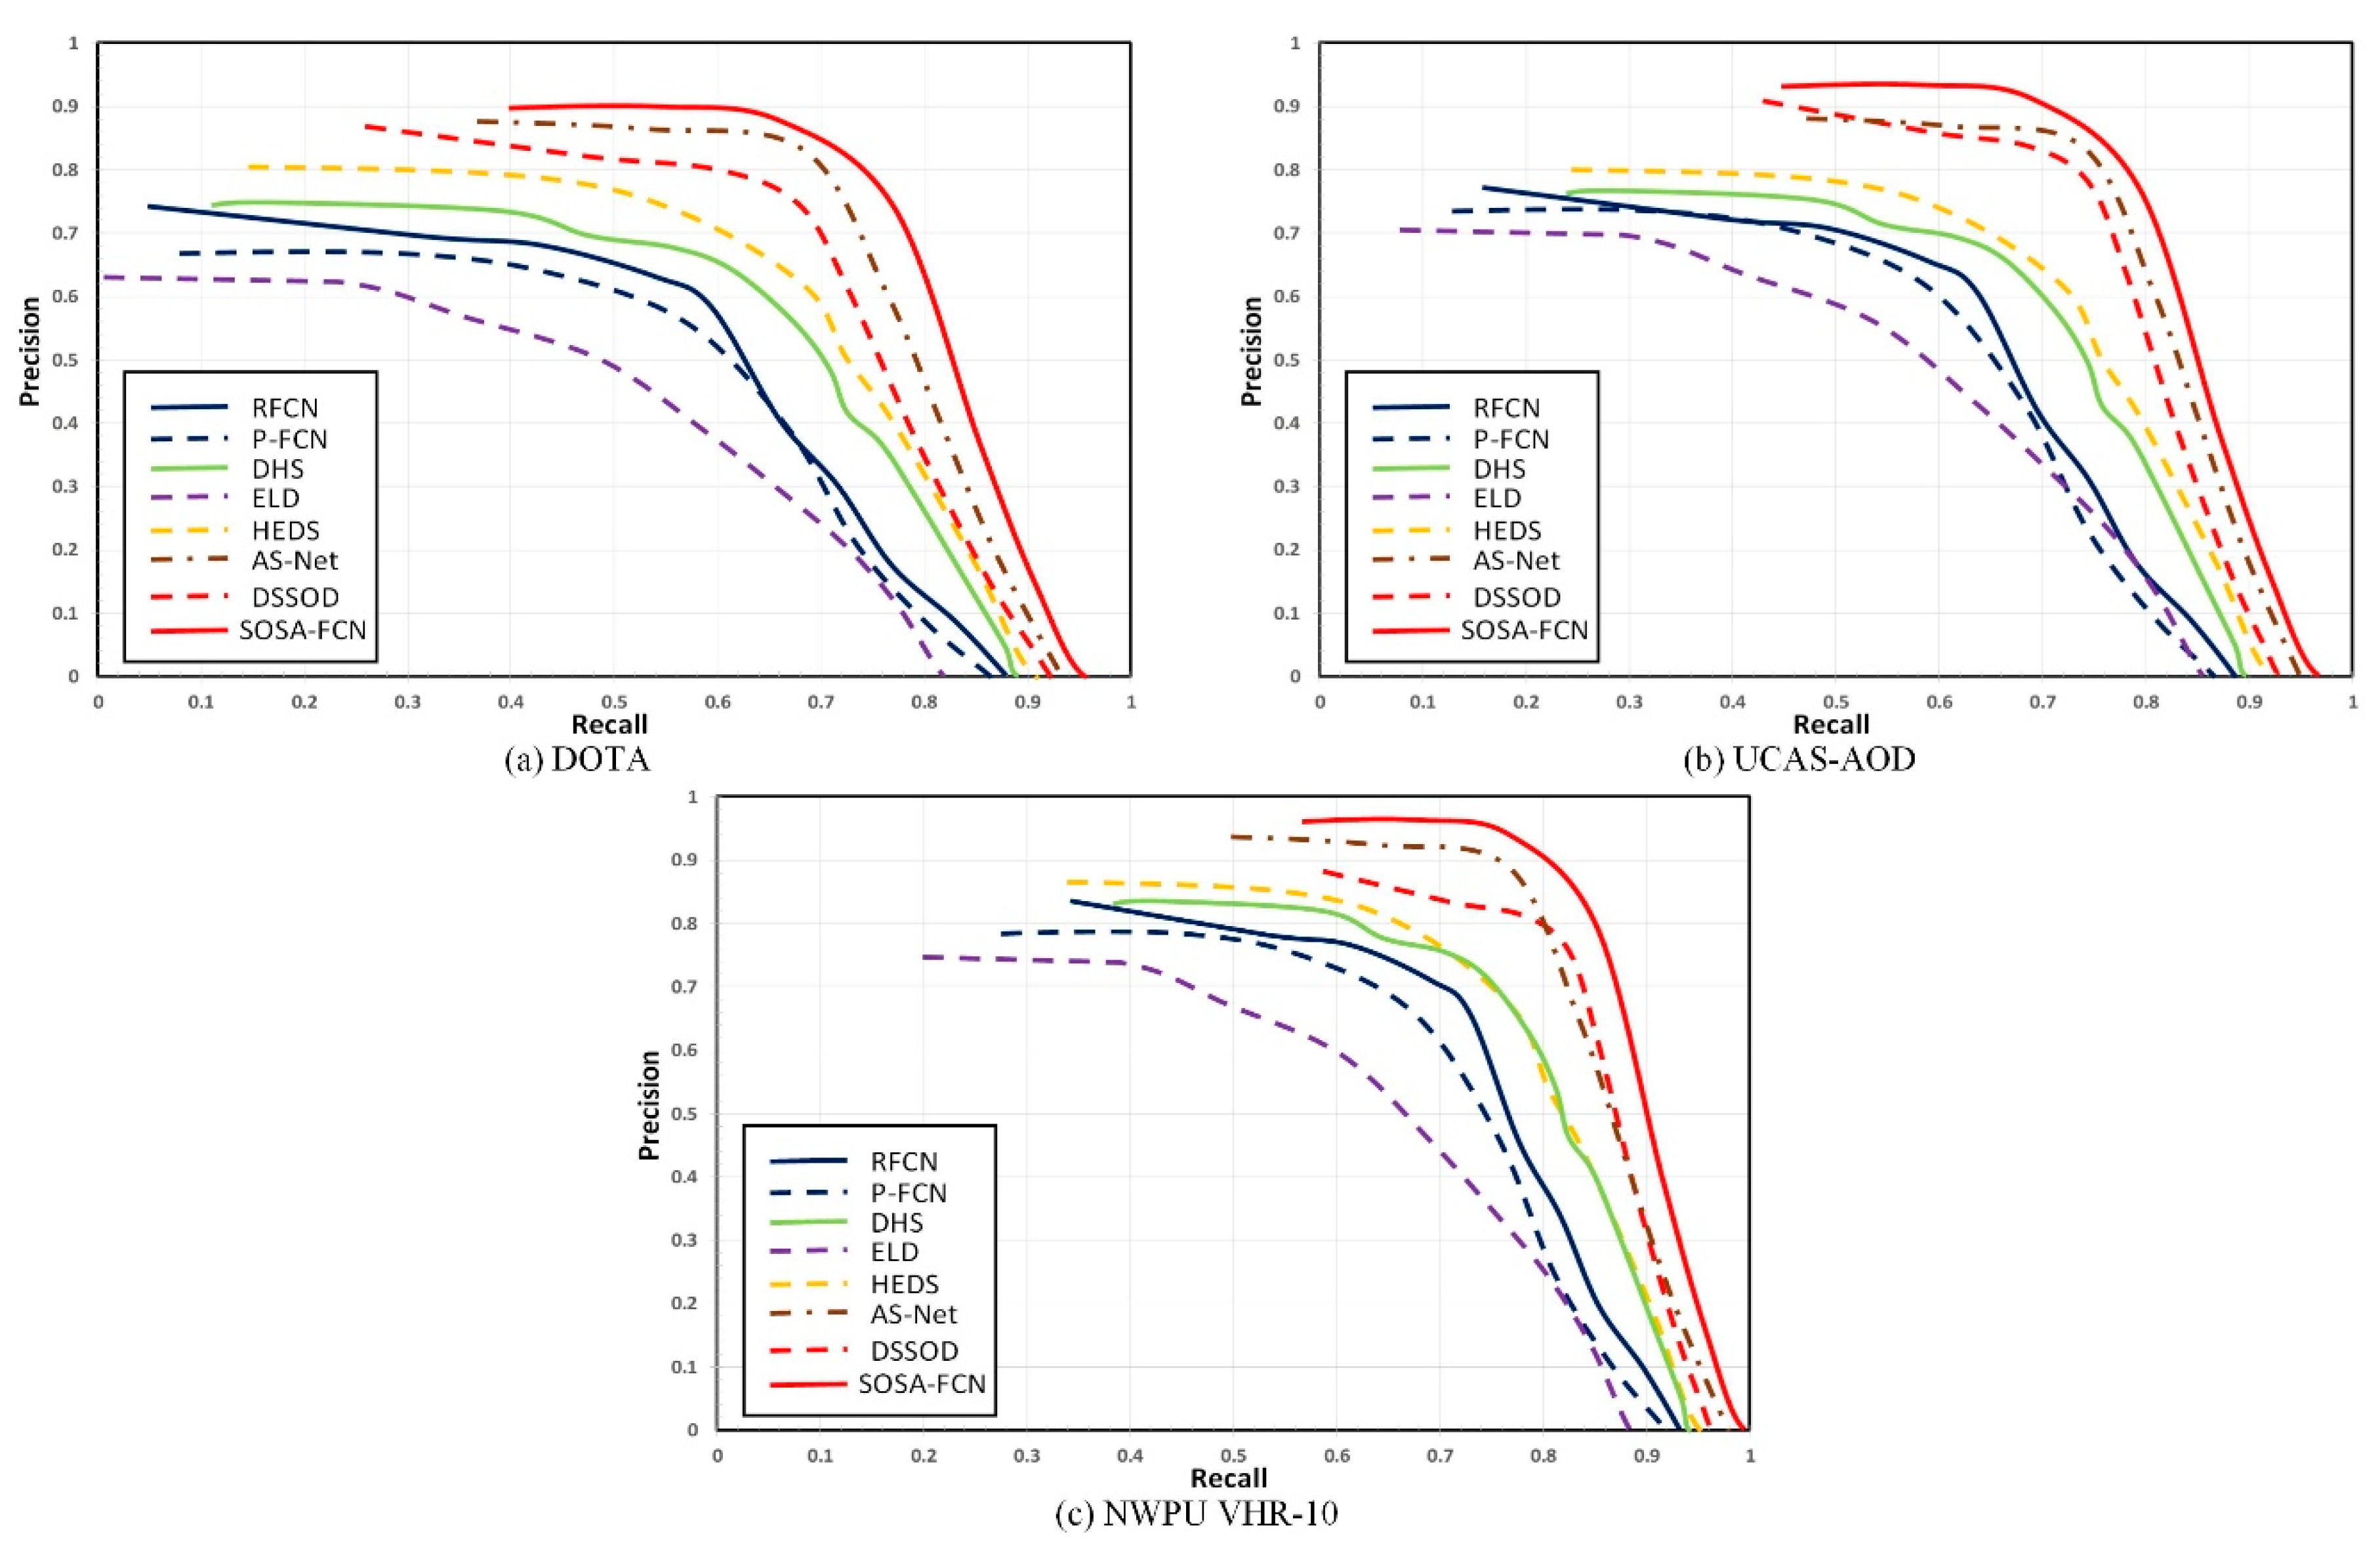
4.4. Comparison Experiments with State-of-the-Art Models

In order to verify the effectiveness of our proposed architecture, we use the most advanced object detection models based on in-depth learning tha have been used in recent years, i.e., R2-CNN [5], FPN Faster R-CNN [5], C-SPCL [47], F-RLN [48], MSCNN [8], DSSD [49], SDBD [50], YOLOv3 [51], VPN [7], MDSSD [52] as comparison algorithms, which are higher in DOTA, TGRS-HRD-Data. The results of multi-object detection are compared using the optical remote sensing image dataset of resolution. The above comparison algorithm uses the default parameters set in the official code published by the author.
The experimental results on the DOTA dataset are shown in Table 4. Compared with the results of the algorithm in this paper and those of other deep learning algorithms in the table, mAP for our model is improved by about 5%–38%, and the detection rate is increased by 2%–42% for the DOTA dataset. The detection speed is obviously higher than that of other algorithms, which basically meets the real-time requirements.
The experimental results for the TGRS-HRRSD dataset are shown in the Table 5. Comparing the detection results of our algorithm with those of other deep learning algorithms, indicated in the table, for the TGRS-HRRSD dataset, mAP is improved by about 3%–38%, the detection rate is improved by 2%–39%, and the detection speed is significantly higher than that of the other algorithms; our algorithm basically meets the requirements of real-time detection.
Figure 8 and Figure 9 are fusion detection results of multiple objects in DOTA and TGRS-HRRSDt datasets, with four categories of objects including: building (yellow border), vehicle (green border), ship (blue Border), aircraft (red border). By analyzing the experimental results, we find that the framework of this paper can complete a relatively fine and accurate detection of multiple objects in high-resolution complex scenes, has strong robustness against interferences such as illumination, shadow, occlusion, etc., and can also give reasonable detection frames for dense and small objects such as vehicles, aircrafts, ships, etc.

5. Discussion

Although our algorithm has achieved ideal detection results on both datasets considered, in the process of analyzing the experimental results, we found that some distortion and strong illumination interference caused extremely rare missed detection and false detection errors. As shown in Figure 10, some vehicle objects in the shade were not detected. At the same time, the shadow of some vehicles was mis-detected as the object. However, through the follow-up experiments, we found that these problems could be eliminated by adjusting the confidence parameters.

6. Conclusions

On the basis of the analysis of the limitations of existing algorithms for object detection in large-scale high-resolution remote sensing images and the characteristics of large-scale high-resolution remote sensing images, this paper proposes a cascade convolutional neural network real-time object detection framework for remote sensing images that combines visual perception and convolutional memory network reasoning. The proposed algorithm uses the visual attention mechanism and the convolutional memory network reasoning method and combines the fast and accurate characteristics of a deep learning algorithm. Ablation experiments and comparative experiments were carried out on several public datasets, and relatively advanced detection results were obtained. It was verified that the cascade network structure proposed in this paper can achieve a faster detection speed compared with other methods on the premise of ensuring detection accuracy and can basically meet the detection requirements of real-time detection and accuracy in engineering practice.

Author Contributions

Conceptualization, X.H. and X.W.; methodology, X.H., X.W. and T.R.; software, X.H., D.W. and F.S.; validation, X.H., X.W., and T.R.; formal analysis, X.H. and T.R.; investigation D.W. and F.S.; data curation, X.W.; writing—original draft preparation, X.H., X.W., T.R., D.W., and F.S.; visualization X.H., X.W., and T.R.; project administration, X.H. and X.W.

Funding

This work was supported in part by the China National Key Research and Development Program (No. 2016YFC0802904), National Natural Science Foundation of China (61671470), Natural Science Foundation of Jiangsu Province (BK20161470), 62nd batch of funded projects of China Postdoctoral Science Foundation (No. 2017M623423).

Conflicts of Interest

The authors declare no conflict of interest.

References

  1. Girshick, R.; Donahue, J.; Darrell, T.; Malik, J. Rich Feature Hierarchies for Accurate Object Detection and Semantic Segmentation. In Proceedings of the IEEE Conference on Computer Vision and Pattern Recognition, Washington, DC, USA, 23–28 June 2014; pp. 580–587. [Google Scholar]
  2. Ren, S.; He, K.; Girshick, R.B.; Sun, J. Faster R-CNN: Towards Real-Time Object Detection with Region Proposal Networks. IEEE Trans. Pattern Anal. Mach. Intell. 2017, 39, 1137–1149. [Google Scholar] [CrossRef] [PubMed] [Green Version]
  3. Redmon, J.; Divvala, S.; Girshick, R.; Farhadi, A. You Only Look Once: Unified, Real-Time Object Detection. In Proceedings of the IEEE Conference on Computer Vision and Pattern Recognition, Las Vegas, NV, USA, 27–30 June 2016; pp. 779–788. [Google Scholar]
  4. Liu, W.; Anguelov, D.; Erhan, D.; Szegedy, C.; Reed, S.; Fu, C.Y.; Berg, A.C. SSD: Single Shot MultiBox Detector. In Proceedings of the 14th European Conference on Computer Vision, Amsterdam, The Netherlands, 11–14 October 2016; pp. 21–37. [Google Scholar]
  5. Pang, J.; Li, C.; Shi, J.; Xu, Z.; Feng, H. R2-CNN: Fast Tiny Object Detection in Large-scale Remote Sensing Images. arXiv Comput. Vis. Pattern Recognit. 2019, 1902, 06042. [Google Scholar]
  6. Chen, H.; Liu, Z.; Guo, W.; Zhang, Z.; Yu, W. Fast detection of ship targets in large-scale remote sensing images based on cascade convolution neural network. J. Radar 2019, 8, 413–424. [Google Scholar]
  7. Li, C.; Zhang, Y.; Lan, T.; Du, Y. A visual perception target detection algorithm for high resolution remote sensing images. J. Xi’an Jiaotong Univ. 2018, 6, 9–16. (In Chinese) [Google Scholar]
  8. Yao, Q.; Hu, X.; Le, H. Remote sensing target detection based on multi-scale convolution neural network. J. Opt. 2019, 1–11. (In Chinese) [Google Scholar]
  9. Wang, L.; Feng, Y.; Zhang, M. Optical remote sensing image target detection method. Syst. Eng. Electron. Technol. 2019, 41, 1–8. (In Chinese) [Google Scholar]
  10. Zhang, Z.; Guo, W.; Zhu, S.; Yu, W. Toward Arbitrary-Oriented Ship Detection with Rotated Region Proposal and Discrimination Networks. IEEE Geosci. Remote Sens. Lett. 2018, 15, 1745–1749. [Google Scholar] [CrossRef]
  11. Zhao, J.; Guo, W.; Zhang, Z.; Yu, W. A coupled convolutional neural network for small and densely clustered ship detection in SAR images. Sci. China Ser. F Inf. Sci. 2019, 62, 42301. [Google Scholar] [CrossRef]
  12. Orhan, F.; Cho, K.; Bengio, Y. Multi-Way, Multilingual Neural Machine Translation with a Shared Attention Mechanism. arXiv 2016, arXiv:1601.01073. [Google Scholar] [Green Version]
  13. Choi, E.; Bahadori, M.T.; Sun, J.; Kulas, J.; Schuetz, A.; Stewart, W. Retain: An interpretable predictive model for healthcare using reverse time attention mechanism. In Proceedings of the Advances in Neural Information Processing Systems 29 (NIPS 2016), Barcelona, Spain, 5–10 December 2016. [Google Scholar]
  14. Chu, Q.; Ouyang, W.; Li, H.; Wang, X.; Liu, B.; Yu, N. Online Multi-Object Tracking Using CNN-based Single Object Tracker with Spatial-Temporal Attention Mechanism. In Proceedings of the IEEE International Conference on Computer Vision, Venice, Italy, 22–29 October 2017. [Google Scholar]
  15. Zhang, H.; Goodfellow, I.; Metaxas, D.; Odena, A. Self-Attention Generative Adversarial Networks. ArXiv Mach. Learn. 2018, 1805, 08318. [Google Scholar]
  16. Lakatos, P.; Musacchia, G.; Connel, M.; Falchier, A.; Javitt, D.; Schroeder, C. The spectrotemporal filter mechanism of auditory selective attention. Neuron 2013, 77, 750–761. [Google Scholar] [CrossRef] [PubMed]
  17. Wang, W.; Shen, J.; Dong, X.; Borji, A. Salient Object Detection Driven by Fixation Prediction. In Proceedings of the IEEE Conference on Computer Vision and Pattern Recognition, Salt Lake City, UT, USA, 18–22 June 2018; pp. 1711–1720. [Google Scholar]
  18. Salimans, T.; Goodfellow, I.; Zaremba, W. Improved Techniques for Training GANs. arXiv 2016, arXiv:1606.03498. [Google Scholar]
  19. Kodali, N.; Abernethy, J.; Hays, J.; Kira, Z. On Convergence and Stability of GANs. arXiv 2018, arXiv:1705.07215. [Google Scholar]
  20. Ronneberger, O.; Philipp, F.; Thomas, B. U-Net: Convolutional Networks for Biomedical Image Segmentation. In International Conference on Medical Image Computing and Computer-Assisted Intervention; Springer: Berlin, Germany, 2015; pp. 234–241. [Google Scholar] [Green Version]
  21. He, K.; Zhang, X.; Ren, S.; Sun, J. Deep Residual Learning for Image Recognition. In Proceedings of the IEEE Conference on Computer Vision and Pattern Recognition, Las Vegas, NV, USA, 27–30 June 2016; pp. 770–778. [Google Scholar]
  22. Hua, X.; Wang, X.; Wang, D.; Ma, Z.; Shao, F. Multi-objective detection of traffic scene based on improved SSD. J. Opt. 2018, 221–231. [Google Scholar]
  23. Xia, G.; Bai, X.; Ding, J.; Zhu, Z.; Belongie, S.; Luo, J.; Datcu, M.; Pelillo, M.; Zhang, L. DOTA: A Large-scale Dataset for Object Detection in Aerial Images. In Proceedings of the IEEE Conference on Computer Vision and Pattern Recognition, Honolulu, HI, USA, 21–26 July 2017. (In Chinese). [Google Scholar]
  24. Liu, C.; Ke, W.; Qin, F.; Ye, Q. Linear Span Network for Object Skeleton Detection. In Proceedings of the European Conference on Computer Vision (ECCV), Munich, Germany, 8–14 September 2018; pp. 136–151. [Google Scholar]
  25. Cheng, G.; Zhou, P.; Han, J. Learningrotation-invariant convolutional neural networks for object detection in VHRoptical remote sensing images. IEEE Trans. Geosci. Remote Sens. 2016, 54, 7405–7415. [Google Scholar] [CrossRef]
  26. Zhang, Y.; Yuan, Y.; Feng, Y.; Lu, X. Hierarchical and Robust Convolutional Neural Network for Very High-Resolution Remote Sensing Object Detection. IEEE Trans. Geosci. Remote Sens. 2019, 57, 5535–5548. [Google Scholar] [CrossRef]
  27. Long, Y.; Gong, Y.; Xiao, Z.; Liu, Q. Accurate Object Localization in Remote Sensing Images Based on Convolutional Neural Networks. IEEE Trans. Geosci. Remote Sens. 2017, 55, 2486–2498. [Google Scholar] [CrossRef]
  28. Wang, X.; Hua, X.; Xiao, F.; Li, Y.; Hu, X.; Sun, P. Multi-Object Detection in Traffic Scenes Based on Improved SSD. Electronics 2018, 7, 302. [Google Scholar] [CrossRef]
  29. Zhang, D.; Han, J.; Zhao, L.; Meng, D. Leveraging Prior-Knowledge for Weakly Supervised Object Detection Under a Collaborative Self-Paced Curriculum Learning Framework. Int. J. Comput. 2018, 127, 363–380. [Google Scholar] [CrossRef]
  30. Laurent, I.; Koch, C.; Niebur, E. A Model of Saliency-based Visual Attention for Rapid Scene Analysis. IEEE Trans. Pattern Anal. Mach. Intell. 1998, 20, 1254–1259. [Google Scholar]
  31. Zhao, X.; Chen, B.; Pei, L.; Li, T.; Li, M. Hierarchical saliency: A new salient target detection framework. Int. J. Control Autom. Syst. 2016, 14, 301–311. [Google Scholar] [CrossRef]
  32. Bruce, N.D.; Tsotsos, J.K. Saliency, attention, and visual search: An information theoretic approach. J. Vis. 2009, 9, 5. [Google Scholar] [CrossRef] [PubMed]
  33. Liu, N.; Han, J.; Liu, T.; Li, X. Learning to Predict Eye Fixations via Multiresolution Convolutional Neural Networks. IEEE Trans. Neural Netw. Learn. Syst. 2018, 29, 392–404. [Google Scholar] [CrossRef] [PubMed]
  34. Pan, J.; Sayrol, E.; Giro-i-Nieto, X.; McGuinness, K.; O’Connor, N.E. Shallow and Deep Convolutional Networks for Saliency Prediction. In Proceedings of the IEEE Conference on Computer Vision and Pattern Recognition (CVPR), Las Vegas, NV, USA, 27–30 June 2016; pp. 598–606. [Google Scholar]
  35. Lee, G.; Tai, Y.W.; Kim, J. Deep Saliency with Encoded Low level Distance Map and High Level Features. In Proceedings of the IEEE Conference on Computer Vision and Pattern Recognition, Las Vegas, NV, USA, 27–30 June 2016. [Google Scholar]
  36. Wang, L.; Wang, L.; Lu, H.; Zhang, P.; Ruan, X. Saliency Detection with Recurrent Fully Convolutional Networks. In European Conference on Computer Vision; Springer: Berlin, Germany, 2016. [Google Scholar]
  37. Liu, N.; Han, J. DHSNet: Deep Hierarchical Saliency Network for Salient Object Detection. In Proceedings of the IEEE Conference on Computer Vision and Pattern Recognition, Las Vegas, NV, USA, 27–30 June 2016. [Google Scholar]
  38. Hou, Q.; Cheng, M.M.; Hu, X.; Broji, A.; Tu, Z.; Torr, P.H. Deeply Supervised Salient Object Detection with Short Connections. In Proceedings of the IEEE Conference on Computer Vision and Pattern Recognition, Honolulu, HI, USA, 21–26 July 2017. [Google Scholar]
  39. Yan, Q.; Xu, L.; Shi, J.; Jia, J. Hierarchical Saliency Detection. In Proceedings of the IEEE Conference on Computer Vision and Pattern Recognition, Portland, ON, USA, 23–28 June 2013; pp. 1155–1162. [Google Scholar]
  40. Jiang, H.; Wang, J.; Yuan, Z.; Wu, Y.; Zheng, L.; Li, S. Salient Object Detection: A Discriminative Regional Feature Integration Approach. In Proceedings of the IEEE Conference on Computer Vision and Pattern Recognition, Portland, OR, USA, 23–28 June 2013; pp. 2083–2090. [Google Scholar]
  41. Li, X.; Lu, H.; Zhang, L.; Ruan, X.; Yang, M.H. Saliency Detection via Dense and Sparse Reconstruction. In Proceedings of the IEEE International Conference on Computer Vision, Sydney, Australia, 1–8 December 2013; pp. 2976–2983. [Google Scholar]
  42. Uijlings, J.R.R.; Van De Sande, K.E.; Gevers, T.; Smeulders, A.W. Selective Search for Object Recognition. Int. J. Comput. Vis. 2013, 104, 154–171. [Google Scholar] [CrossRef] [Green Version]
  43. Song, G.; Leng, B.; Liu, Y.; Hetang, G.; Cai, S. Region-based Quality Estimation Network for Large-scale Person Re-identification. In Proceedings of the Thirty-Second AAAI Conference on Artificial Intelligence, New Orleans, LA, USA, 2–7 February 2017. [Google Scholar]
  44. Ballester, P.; Araujo, R.M. On the performance of GoogLeNet and AlexNet applied to sketches. In Proceedings of the Thirtieth Aaai Conference on Artificial Intelligence, Phoenix, AZ, USA, 12–17 February 2016. [Google Scholar]
  45. Zitnick, C.L.; Dollár, P. Edge Boxes: Locating Object Proposals from Edges. In Proceedings of the European Conference on Computer Vision, Zurich, Switzerland, 6–12 September 2014. [Google Scholar]
  46. Shi, G.; Xie, X.; Han, X.; Liao, Q. Visualization and Pruning of SSD with the base network VGG16. In Proceedings of the International Conference on Deep Learning Technologies, Chengdu, China, 2–4 June 2017. [Google Scholar]
  47. Cinbis, R.G.; Jakob, V.; Cordelia, S. Weakly Supervised Object Localization with Multi-Fold Multiple Instance Learning. IEEE Trans. Pattern Anal. Mach. Intell. 2017, 39, 189–203. [Google Scholar] [CrossRef]
  48. Han, Z.; Zhang, H.; Zhang, J.; Hu, X. Fast aircraft detection based on region locating network in large-scale remote sensing images. In Proceedings of the international conference on image processing, Beijing, China, 17–20 September 2017; pp. 2294–2298. [Google Scholar]
  49. Fu, C.; Liu, W.; Ranga, A.; Tyagi, A.; Berg, A. DSSD: Deconvolutional Single Shot Detector. arXiv: Computer Vision and Pattern Recognition. arXiv 2017, arXiv:1701.06659. [Google Scholar]
  50. Tong, L.; Zhang, J.; Lu, X.; Zhang, Y. SDBD: A Hierarchical Region-of-Interest Detection Approach in Large-Scale Remote Sensing Image. IEEE Geosci. Remote Sens. Lett. 2017, 14, 699–703. [Google Scholar]
  51. Redmon, J.; Farhadi, A. YOLOv3: An Incremental Improvement. arXiv 2018, 1804, 02767. [Google Scholar]
  52. Guo, Z.; Song, P.; Zhang, Y.; Yang, M.; Sun, X.; Sun, H. Aircraft Object Detection in Remote Sensing Images Based on Deep Convolution Neural Network. J. Electron. Inf. Sci. 2018, 40, 149–155. (In Chinese) [Google Scholar]
Figure 1. Architecture of our Network. The self-attention pre-screening fully convolutional network (SOSA-FCN) realizes pre-screening as in traditional detection methods by using the method of deep learning. After inputting a large-sized remote sensing image into SOSA-FCN, an attention map containing object location information is obtained. According to the attention map, candidate regions suspected of having objects are obtained. The candidate regions are sent to the accurate detection fully convolutional network (AD-FCN) network for accurate object detection. The task of real-time object detection in high-resolution large-scene remote sensing images is realized by using two cascaded networks.
Electronics 08 01151 g001
Figure 2. Architecture of our SOSA-Net which integrates the visual saliency detection strategy and introduces the conv-LSTM (long-term and short-term memory) network to optimize the self-attention feature graph, making the model’s attention to the objects in the image more in line with human eyes’ vision.
Electronics 08 01151 g002
Figure 3. Architecture of our AD-FCN. AD-FCN is mainly divided into three parts: feature extraction, feature fusion, and result output. In order to avoid the problems of over-fitting and gradient explosion that may occur in the training process, the initialization of the feature extraction network was completed by using the transfer learning method and the ResNet50 [21] model for reference. In the feature fusion part, the U-Net idea was used for reference. On the basis of FCN, the high-dimensional and low-dimensional features in the convolutional network are fused to realize pixel-level classification of images and improve detection accuracy. In the output part, the confidence score map of one channel, the rectangular frame boundary information map of four channels, and the object rotation angle map of one channel are obtained through three 1 × 1 convolution layers [6].
Electronics 08 01151 g003
Figure 4. Location of object mask and rotating rectangular frame. (a) Original image, (b) Object mask generated according to the true coordinates, (c) positioning sketch of the rotating rectangular frame.
Electronics 08 01151 g004
Figure 5. SOD results with precision and recall (P-R)-curve using three datasets.
Electronics 08 01151 g005
Figure 6. Qualitative results of SOSA-FCN. The first row shows the original images, the second row shows the fixation maps of the object, and the third row shows the attention feature maps of the object.
Electronics 08 01151 g006
Figure 7. Per-class frequency of error modes as well as average error across all classes for the AD-FCN.
Electronics 08 01151 g007
Figure 8. Results of our Network for three categories of objects (ship, building, car).
Electronics 08 01151 g008
Figure 9. Results of our Network for three categories of objects (aircraft, building, car).
Electronics 08 01151 g009
Figure 10. Some error results of our network.
Electronics 08 01151 g010
Table 1. Quantitative comparison of different fixation prediction (FP) models using different datasets.
MethodsAUC-JuddSIMShuffled AUC
DOTANWPU VHR-10DOTANWPU VHR-10DOTANWPU VHR-10
ITTI0.480.610.180.170.430.55
GBVS0.570.710.220.230.450.58
AIM0.520.640.20.190.480.66
Mr-CNN0.630.760.230.320.560.71
P-FCN0.750.830.310.380.610.75
Shallow-Net0.590.730.250.290.580.69
Deep-Net0.740.810.280.330.550.71
AS-Net0.760.850.360.410.620.74
SOSA-FCN0.780.870.410.460.660.75
CCNSSSpeed(s/1000x1000)
DOTANWPU VHR-10DOTANWPU VHR-10DOTANWPU VHR-10
0.230.310.821.054.3433.969
0.320.391.131.323.5324.032
0.160.220.710.985.3184.893
0.280.371.091.291.0280.798
0.360.461.181.330.2580.336
0.310.351.271.471.3251.135
0.370.411.221.410.9830.632
0.350.451.311.520.4520.398
0.420.511.291.490.1750.149
Table 2. The Fβ and mean absolute error (MAE) scores of salient object detection (SOD) for different datasets.
MethodsDOTAUCAS-AODNWPU VHR-10
FβMAEFβMAEFβMAE
DRFI0.6120.3580.7030.2980.7310.255
HS0.5720.4590.6110.3760.7690.223
P-FCN0.7650.1530.8040.1580.8420.138
RFCN0.7730.1270.7990.1010.8060.092
DHS0.7980.0980.8210.0890.8510.073
ELD0.7350.1120.7830.1130.8030.096
HEDS0.8030.0890.8320.0910.8580.085
AS-Net0.8150.0650.8450.0780.8680.063
DSSOD0.8140.0860.8510.0760.8760.066
SOSA-FCN0.8180.0610.8560.0780.8810.049
Table 3. Comparison among the proposed framework and other baselines detection strategies using the NWPU VHR-10 set in terms of mAP.
StrategiesAircraftShipStorage TankBallparkTennis CourtBasketball Court
SS-A36.3123.1246.2832.3536.7234.71
SS-V44.7225.4154.8236.2142.8342.62
SS-A-F41.8124.1552.4334.6238.4236.18
EB-A-F38.5326.1651.3132.5543.2537.33
EB-V-F43.2438.2366.5438.7346.3147.15
EB-V-F-CS51.7232.8156.8140.8652.2849.82
EB-V-F-BR47.8535.4163.5242.9152.4755.57
AD-FCN69.3861.8269.6662.5861.2373.21
Athletic fieldPortBridgeCarAvg.
35.7626.2219.3413.6130.442
43.7733.8525.4222.9337.258
41.9329.5127.6519.3234.602
40.1228.4224.8121.8434.432
46.7535.1334.3729.5242.597
38.6138.6231.2223.8141.656
47.4739.8536.8337.2645.914
75.2857.8353.7756.3864.114
Table 4. Comparison of the object detection performance using the DOTA dataset.
ModelMap (%)MAX RECALL (%)Pd (%)Speed (ms)
R2-CNN87.3297.1883.0317.63
FPN Faster R-CNN83.0493.0569.8524.26
MSCNN84.6591.8681.0233.48
DSSD54.2783.8643.6553.27
SDBD79.1992.3879.8435.73
F-RLN82.5390.1180.5246.18
C-SPCL85.2196.3386.1229.58
YOLOv365.6887.1257.9847.25
VPN83.0894.0382.8621.68
MDSSD85.3895.1383.2119.45
OURS92.3598.8285.7514.03
Table 5. Comparison of the object detection performance using the TGRS-HRRSD dataset.
ModelmAP (%)MAX RECALL (%)Pd (%)Speed (ms)
R2-CNN91.3598.4888.9316.13
FPN Faster R-CNN87.2496.5373.8222.36
MSCNN86.5395.4686.7222.18
DSSD56.4789.7953.1549.72
SDBD83.7997.2885.3448.63
F-RLN85.3694.4383.3343.69
C-SPCL91.6899.0391.0718.15
YOLOv369.4894.8264.7835.45
VPN89.2893.2388.7917.63
MDSSD90.3698.1589.2316.54
OURS94.6599.3690.9810.29

