Article

A High-Resolution Measurement System Designed for Semiconductor Microcalorimetry Sensors

1
Institute of Electronics, Faculty of Automatic Control, Electronics and Computer Science, Silesian University of Technology, 44-100 Gliwice, Poland
2
Institute of Automatic Control, Faculty of Automatic Control, Electronics and Computer Science, Silesian University of Technology, 44-100 Gliwice, Poland
*
Author to whom correspondence should be addressed.
Electronics 2019, 8(10), 1147; https://doi.org/10.3390/electronics8101147
Submission received: 9 September 2019 / Revised: 7 October 2019 / Accepted: 8 October 2019 / Published: 11 October 2019
(This article belongs to the Section Circuit and Signal Processing)

Abstract

:
The quality of measurements of non-electrical quantities not only depends on the sensor but also on the electronic system that is used for the conversion of the electrical signals to a digital form. Many research papers on the subject analyse the properties and characteristics of the sensors in detail but omit the properties of the instruments that are used to measure the characteristics. This paper concentrates on the problems concerning the design of an instrument for generating control signals and measuring the output signals of a semiconductor sensor. The measurement instrument is designed for a commercial heat flow microcalorimeter that is able to measure heat flows at the level of several µW. The novelty of this paper is the analysis of some of the undocumented properties of the sensor and the interactions between its components. The design of the instrument makes it possible to correctly measure the output signals of a microcalorimeter without the influence of the described effects. The added value of this paper is a detailed analysis of the resolution of the system and the factors that may affect it. The remarks contained in the paper can be useful for designers of other instruments that are designed for measuring non-electrical quantities.

1. Introduction

Most of the quantities that are measured in science and industry are non-electrical and, most often, they are converted into electrical quantities using specialised sensors and electronic devices. In the literature, one can find many examples from medicine [1], analyses of drive failures [2], audio signal processing [3], vibration analyses [4,5], noise reduction [6,7], astronomical aspects [8,9], frequency measurement [10] and many more. A very important issue when measuring non-electrical quantities is the method of data acquisition. For a chosen method and given process, a dedicated measurement device is designed, which is often integrated with the control equipment (a so-called measurement and control device) [11]. Often in the literature, no detailed aspects of the construction of acquisition devices are discussed, although the results that are obtained using these measuring devices are analysed. In such cases, it is assumed that the designed system for data acquisition did not introduce any additional distortions in the results obtained or that any distortions can be neglected. The possible negative impact of a measurement device on the analysed results (e.g., drift or oscillations) is rarely considered.
The heat that is generated or absorbed in chemical or biochemical reactions is an example of a non-electrical quantity that has to be measured in specific applications. The device that enables such measurements to be performed is called a calorimeter or microcalorimeter (in cases in which the size of the sample can be reduced to a volume of a few nanoliters to several microliters). These smaller samples can be analysed quickly (they can be warmed up or cooled down quickly) and their analysis is cheaper and faster. As a result, microcalorimeters are of great importance in biomedical applications [12,13], in analyses of chemical or biological processes [12,14,15,16] and in determining the thermal properties of various substances [17,18,19]. On the other hand, when the test samples are very small, the microcalorimeter must be very sensitive, which, in turn, results in an increase in the interference (e.g., thermal or electrical) from the environment that is not observable for conventional (i.e., large in mass compared to the test sample) calorimeters. Therefore, a measuring system that is dedicated to a microcalorimeter must be designed properly.
Among the different types of calorimeters, attention should be paid to heat flow calorimeters, which enable the heat of reaction to be measured, for example, heat that is generated in exothermic chemical reactions. In this type of calorimeter, three basic elements can be distinguished (Figure 1): a reaction chamber (an area where the heat is released or absorbed), an environment (usually at a constant temperature) and a conductor (between the reaction chamber and the environment). The conductor is equipped with a sensor for measuring the difference in temperature between the environment and the reaction chamber.
Heat flow microcalorimeters are designed in the form of IC-calorimeters (or chip calorimeters), for which the main element is a silicon membrane with a small thermal capacity. The drop of the liquid sample that is to be analysed is placed in the central part of the membrane (Figure 1a). The membrane is connected to the rim, which has two functions: it supports the microcalorimeter system mechanically and works as a heat sink for the heat that is generated in the central area of the membrane. The difference in temperature that arises between the central area of the membrane and the rim is most often measured by a thermopile (a series of connected semiconductor thermocouples), which is an integral part of the membrane. The output signal of the thermopile is the voltage that arises as a result of the difference in temperature between the cold (rim) and hot (centre of the membrane) ends of the thermocouples. This difference is proportional to the heat flow that is measured. In most cases, microcalorimeters have additional heaters with a known resistance, which are embedded in the central area of the membrane. The heaters can be used to calibrate the system or to supply energy to the sample. However, in case of a lack of galvanic isolation between the heaters and the thermopile, interactions may occur between these elements, which makes designing the measurement system more difficult.
Currently, some commercial heat flow microcalorimeters are available on the market [20]. These calorimeters have an advantage over traditional measurement systems, because all of the required electronics and equipment (including sensors) can be integrated in a portable package. For these calorimeters, it is necessary to design a dedicated measurement system that enables small heat flows (at the level of several mW) to be measured, while at the same time reducing the effects of any thermal or electrical interference, which is the major goal of this paper. The novelty presented in the article is the design (concept and implementation) and accurate analysis of a measurement system that is dedicated to heat flow microcalorimeters. An additional novelty is the proposals of design rules that should be considered during development of a measurement system that is dedicated to measure small non-electrical values. The paper is organised as follows. The next section presents the application of microcalorimeters with an emphasis on data acquisition systems and Section 3 describes a commercially available heat flow microcalorimeter. The design of a control and measurement system is presented in Section 4, while details of the dedicated metrological properties are given in Section 5. In Section 6, the authors present an example of the measurements and Section 7 presents the conclusions.

2. Overview of Measurement Systems Designed for Microcalorimeters

In the literature, one can find various applications of commercial heat flow calorimeters. In each case, the main issue is the design and implementation of a measurement and control system. In [21], the authors developed a measurement system that is dedicated to an XEN-NCM9924 microcalorimeter (Xensor Integration, Delfgauw, Netherlands), which obtained a noise of 5 μV for the 15 Hz measurement sampling frequency. The measurement system was equipped with a 24-bit analogue to digital converter (ADC), which provided a potentially very good resolution of the measurements. The authors also created dedicated software in LabVIEW, which was used for the data acquisition. The same type of microcalorimeter was used to measure the heat that was generated by chemical and biological reactions in [22]. The proposed measurement and control system included an additional proportional-integral-derivative (PID) controller that is designed for temperature stabilisation at the level of ±1 mK of the chip holder. However, advanced control algorithms might be more effective for this purpose [23]. The measurement and control system ensured the flexibility and simplicity of using a microcalorimeter, but very few details on its design were given. The possibility of using the measurement platform was tested by measuring the heat generated during mixing of propyl alcohol with deionized water at concentrations that ranged from 0% to 69% for the propyl alcohol. In turn, in [24], the authors determined the power sensitivity of 2.7 V/W and a heat detection limit of 70 nW for their measurement and control system, which was dedicated to heat flow microcalorimeters. A drawback of the presented solution is that this measurement system is not portable and cannot be used in a broad range of conditions. The article [25] presents the potential of microcalorimetry in the analysis of enzymatic reactions and microbial growth processes. The authors pointed out that the thermo-physical properties of the thermal power detectors of microcalorimeters are better suited for fast reactions and very small samples. These properties make it possible to perform measurements online, which was experimentally demonstrated for a commercial microcalorimeter. In [26], the authors focused on designing an algorithm that automates the search for the best operating point of a biological system. The paper describes the possibility of using a microreactor with a microcalorimeter to design, optimise and control a biotechnological process. The thermal effects that accompanied the biotechnological processes were measured using an XEN-NCM9924 microcalorimeter. The acquisition and storage of data was performed with LabVIEW (National Instruments, Austin, TX, USA) with the sample rate up to 10 Hz. The application of two different commercial microcalorimeters to analyse the chemical reactions was presented in [27]. The authors pointed out that the main problem during measurements is to reduce the uncertainty of the results that are obtained due to several factors. The aspects mentioned are the heat losses that occur at high temperatures, the dependence of the sensitivity on the temperature of the heaters and sensors, changes in the sensitivity due to changes in the intensity of the substance flow rate and losses in a mass sample due to evaporation. The authors did not present or analyse the control and measurement system that was used in their research. They also did not specify the sensitivity level of their measurement system. In [28], the authors proposed measurement methods for measuring temperature, thermal conductivity and the diffusivity of different liquids (e.g., water, alcohols) using a microcalorimeter. However, the measurement system was not presented and the accuracy of the measurements was not analysed. Another type of microcalorimeter that is available on the commercial market is a dual membrane microcalorimeter, which is dedicated for fast differential scanning calorimetry (DSC) [29]. The thin silicon nitride membranes permit scanning rates up to 10 kK/s when heating and up to 4 kK/s when cooling low mass samples (100 ng to 10 μg) in temperatures ranging from −100 °C to 450 °C. The power resolution in this application is usually between 0.1 μW and 0.5 μW. The authors also considered using a commercial XEN-NCM9924 microcalorimeter, but they pointed out that the accuracy of the temperature measurement on the thermopile is limited due to the comparable thermal resistance of the membrane and thermal resistance between the rim and the surrounding area (both about 50 K/W). In this case, the data acquisition system that was used was also not analysed. In [30], the authors proposed a method for reducing noise and improving the thermal response of a calorimetric biosensor system in order to determine the enzyme activity. They used the moving average filter to effectively reduce the noise signal from 30 mV to 0.2 mV. Moreover, different flow rates of the liquid samples were tested in order to determine the influence of the flow rate on the thermal response of the system. Because the flow rate varied between 0.1–0.5 mL/min, the temperature sensitivity of the calorimetric system also varied (between 0.8 mV/K and 1.184 mV/K). Then, the biosensor was successfully used to detect an enzyme inhibitor at the level of 0.01 mg/L. In this case, the authors used only one measurement sampling frequency-15 Hz. In paper [31], there is an overview of the research projects that were carried out by the Xensor team using commercial microcalorimeters. Neither the design of the measurement system nor the accuracy of the measurements were analysed in the work. In [32], various models of microcalorimeters were described for the research and experiments that were carried out using a commercial heat flow XEN-NCM9924 microcalorimeter. The possibilities for using the sensors in industrial applications were discussed, but again, details concerning the construction of the electronic measurement system were not given. More different types of calorimeters and microcalorimeters and their applications can be found in [33]. However, regarding measurement and control systems, the design best practices are not discussed, which is particularly important in the case of the sensitive microcalorimeters for test samples that are very small in volume. Finally, more recent applications of microcalorimetric devices can be found in [34,35,36].

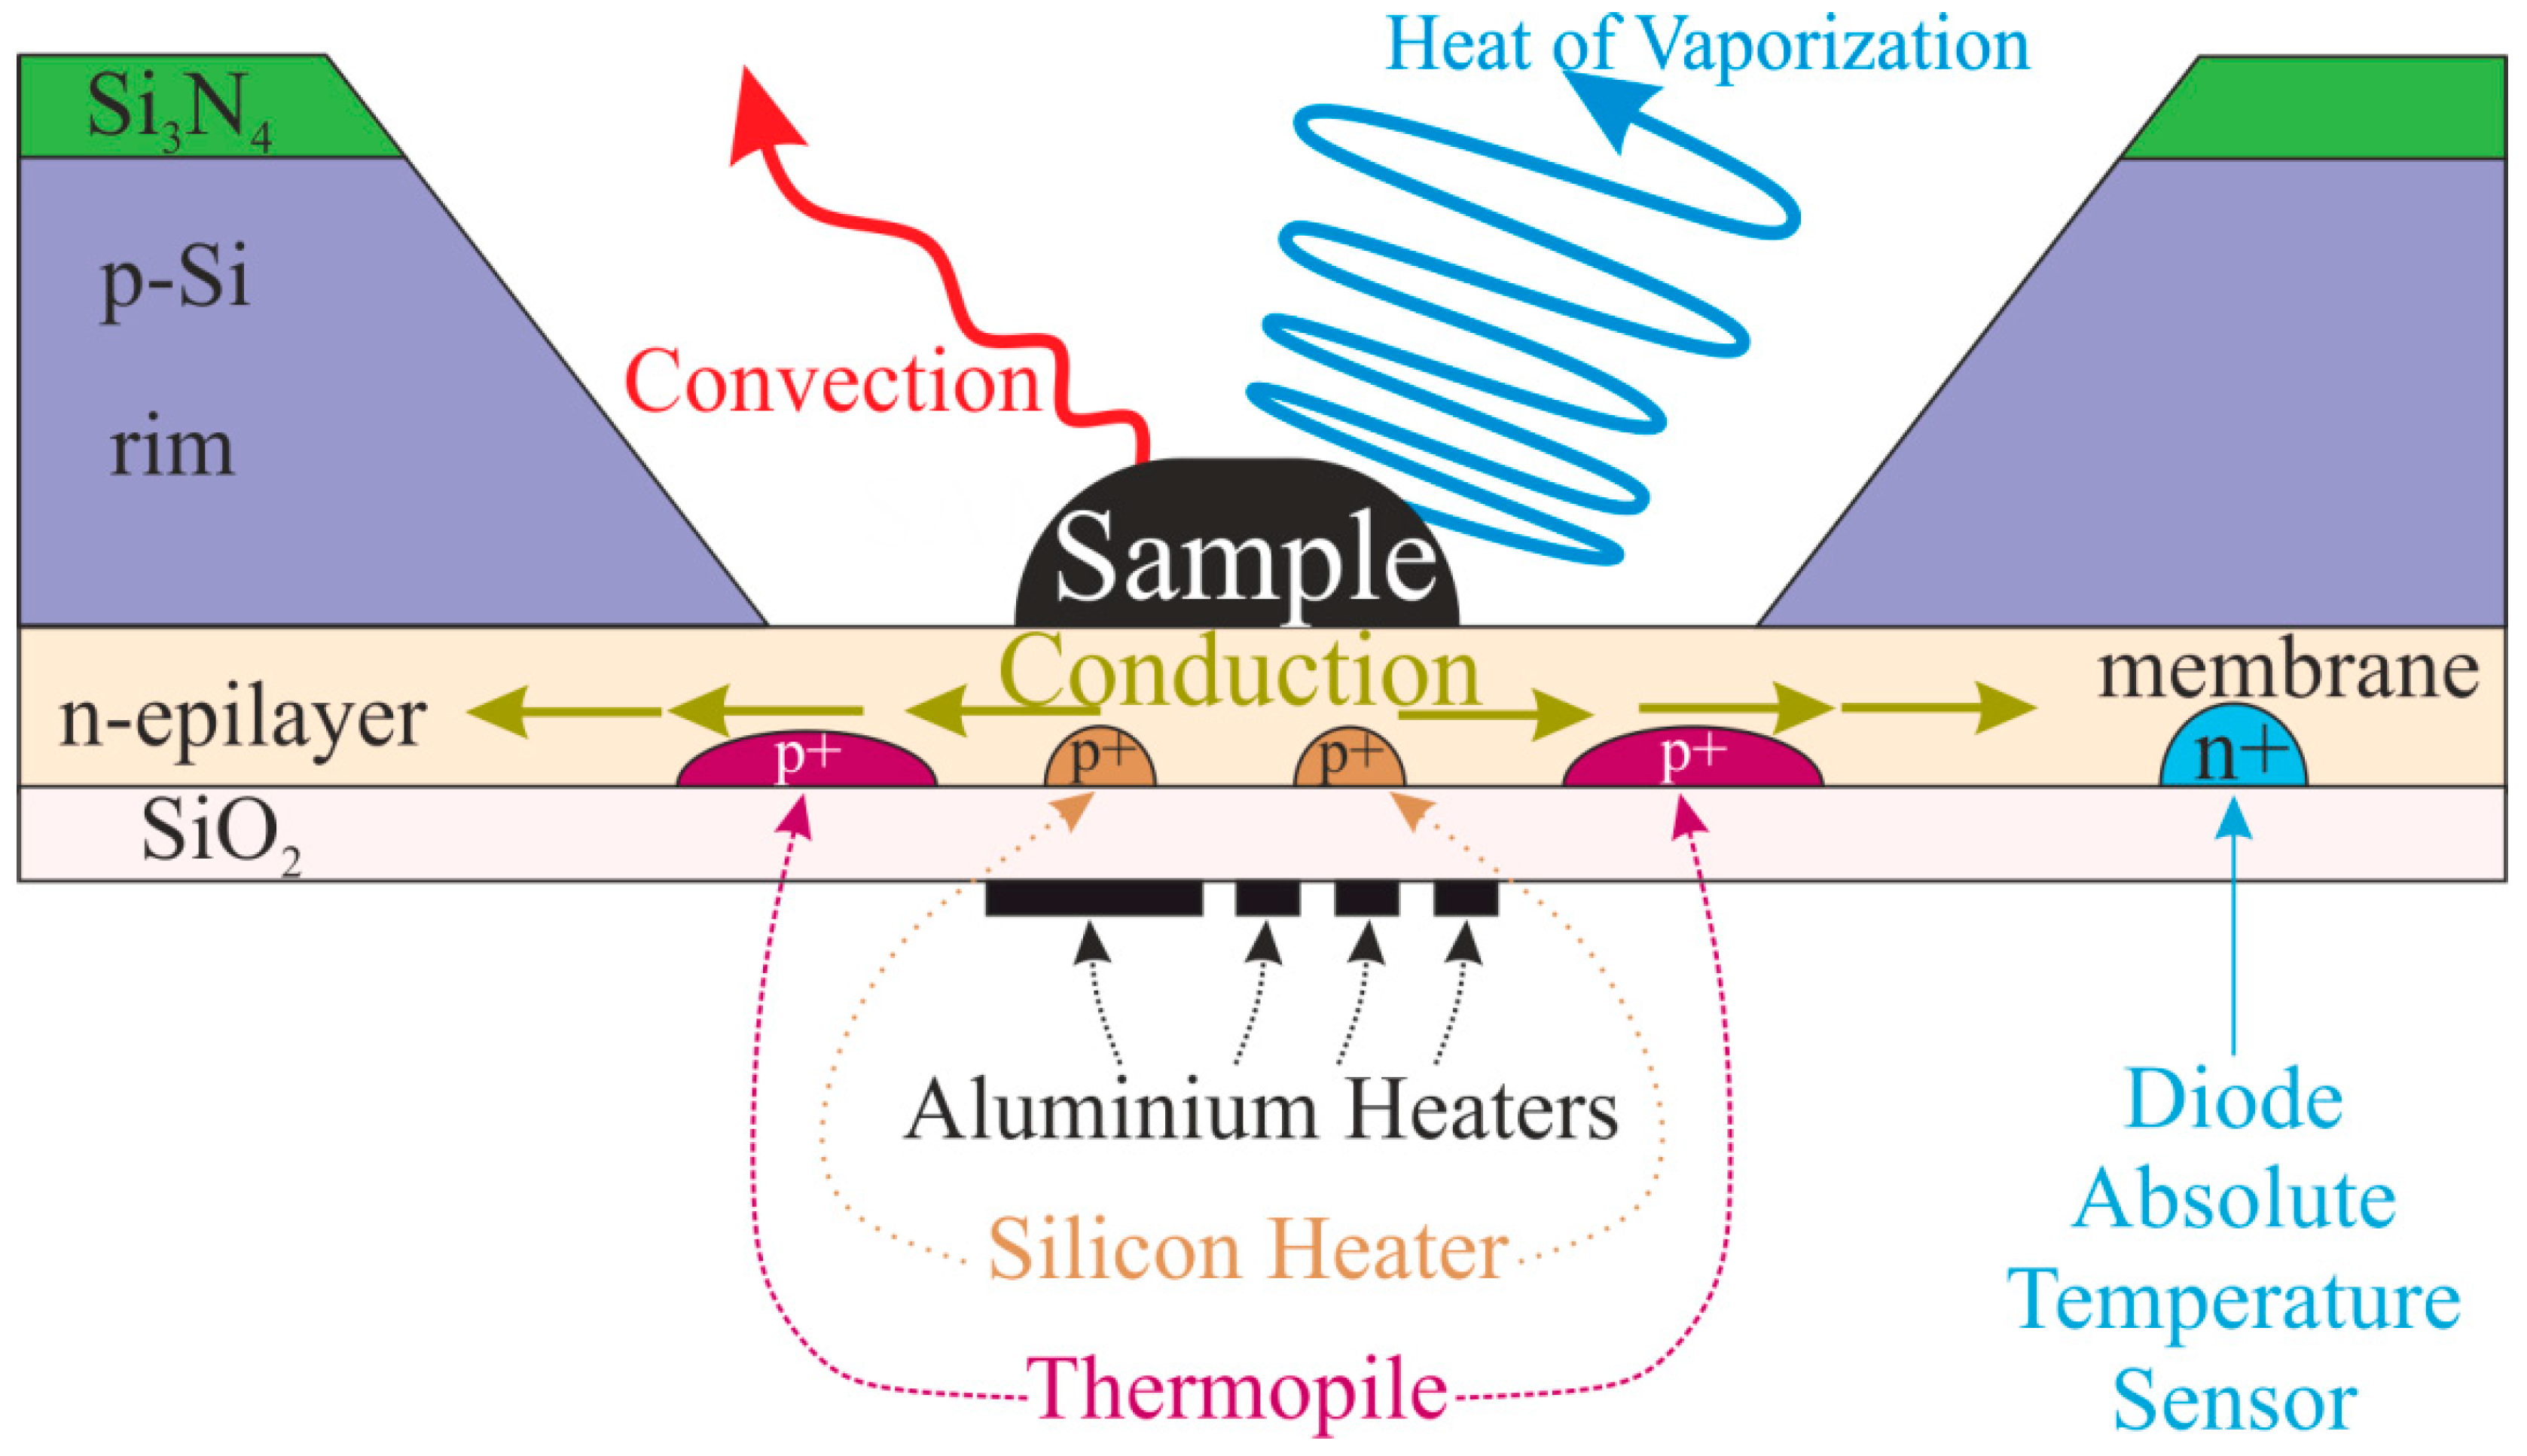
3. Construction and Properties of a XEN-NCM9924 Microcalorimeter

The XEN-NCM9924 sensor is one of the microcalorimeters offered by Xensor Integration Company. The element is fabricated in a ceramic PGA68 housing (Figure 1b). The silicon membrane is 8.3 × 8.3 mm in size and 22–45 µm thick. The bottom side of the membrane contains a stack of 160 Al-Si thermocouples that are called the thermopile and its sensitivity is approximately 50 mV/K. The thermopile enables the difference in temperature between the centre of the membrane and the rim (cold junction) to be measured. The membrane also contains two aluminium resistive heaters (with 280 Ω and 825 Ω resistances), which are dielectrically isolated from the silicon layer. The third semiconductor heater (with a 450 Ω resistance) is isolated from the substrate only with reverse-biased pn junctions. The absolute temperature of the cold junctions can be measured using a diode that is located outside the heating area. The basic parameters of an XEN-NCN9924 are presented in Table 1. A cross-section of the XEN-NCM9924 sensor is shown in Figure 2.

3.1. Undocumented Properties of the XEN-NCM9924 Microcalorimeter Interactions between the Elements

A preliminary analysis of the microcalorimeter revealed changes in the voltages that were measured in the thermocouple and in the diode. These changes were not caused by changes in the temperature but resulted from the incorrect control of the other elements that are embedded in the membrane structure. The following interactions were observed:
  • the influence of the heating resistors on the thermopile common mode voltage;
  • the influence of the diode current on the thermopile voltage;
  • the influence of the heating resistors on diode voltage.

3.1.1. Interactions between the Heating Resistors and the Thermopile

According to the technical documentation [20], the sensitivity of the thermopile is approximately 50 mV/°C. In typical applications, the membrane is heated up to 2 °C with respect to ambient temperature, which means that the thermoelectric voltage does not exceed 100 mV. The thermocouple internal resistance is 50 kΩ. Measuring the thermocouple voltage requires the use of a high input impedance acquisition system working in the differential mode. It has been observed that the measurement results are incorrect when a voltage measuring system with a grounded reference terminal is used. In measurement systems with a differential input, the range of acceptable common mode voltages must always be considered. It was observed that in the XEN-NCM9924 system, the common mode voltage around which the differential signal from the thermopile changes is close to the higher level of the potentials that supply the heater, regardless of the direction of the current that is flowing through the heating element. An equivalent diagram modelling the observed effect is shown schematically in Figure 3.
Because the heater and the thermopile are embedded in one silicone structure, parasitic pn junctions are formed (represented by the Dp symbols in Figure 3). A junction that is connected to the higher potential of the heater is forward-biased and enforces a certain common mode potential on the thermopile. The resistor Rp represents the leakage resistance between the heater and the thermopile. Attaching any of the thermopile terminals to the ground would cause a current flow through the resistances Rp and Rtp/2 and a distortion in the voltage measured on the thermopile.
The design of the power supply system for the heater and the thermopile voltage measurement must take into account the interactions that are described above. The idea of the proposed power supply system for the heater is shown in Figure 4.
For VDAC = 0, the voltage at both terminals of the heater is equal to reference voltage VREF. This configuration ensures that the heating power can be equal to zero, while the common mode voltage on the thermopile is approximately VREF. Reference voltage VREF is selected so that it is in the range of the common mode voltages that are acceptable by an ADC (in our case from 0.1 to 3.2 V). By using this solution, the thermopile output does not require conditioning. The digital to analogue converter (DAC) operates in the unipolar mode and when its output voltage is increased, voltage Vh- is decreased. Because the common mode potential of the thermopile is always close to the potential of the positive electrode of the heater, the measurement of the voltage on the thermopile is always correct even when there is a negative potential on the other electrode of the heater. The solution described was taken into account when designing the measurement and control system.

3.1.2. Interactions between the Diode and the Thermopile

It was observed that the current flowing through the diode affected the voltage on the thermopile. The diode is designed to measure the temperature of the cold ends of the thermocouples and is polarised with a constant current of 50 µA. A voltage drop to the level of 0.6 V results in about 30 μW power losses of the diode. The typical sensitivity of a microcalorimeter that is given by the manufacturer is about 1.3 V/W. Hence, even if the diode dissipates the power of 30 μW, the thermopile voltage drop should not exceed:
Δ V T H =   S t p · P D = 1.3   V W · 30   μ W = 39   μ V
where Stp is the effective sensitivity and PD is the power dissipated on the diode. The voltage drop that was observed on the thermocouple after connecting the current power source to the diode was at the level of a few millivolts, which cannot be explained by thermal effects, but only by leakage currents. To prevent the interaction between the diode and the thermopile, we decided to separate the measurements of the thermopile voltage (temperature of the membrane) and the diode voltage (temperature of the cold junctions). For this purpose, a commutation system was used that disconnected both diode terminals from the rest of the system for the duration of the thermopile measurements. This approach is acceptable because the thermal capacity of a microcalorimeter rim with an additional housing is much larger than the thermal capacity of its membrane and the temperature of the cold junctions can only be measured before and after a calorimetric experiment.

3.1.3. Interactions between the Heater and the Diode

During the tests of the microcalorimeter, a dependence was observed between the voltage supplying the heater and the voltage at the terminals of the diode. It was observed that after switching on the voltage supplying the heating element, the diode voltage increased by several millivolts. This effect cannot be explained by the thermal effects, since the temperature coefficient of the diode is about −2 mV/°C. It is also important to mention that the voltage increase on the diode occurred even if only one terminal of the heating element was connected to the power supply. The only explanation is once again the leakage currents. To avoid the problems that are related to the effects that were observed, it was decided to disconnect both ends of the heater when measuring the diode voltage. The commutation system, as in the previous case, was based on a relay.
The interactions described above not only occurred for the Rh semiconductor heating element, which is realised in the silicon structure with the diode and the thermopile, but also for the aluminium heaters, which are galvanically separated from the silicon structure. Therefore, the acquisition system for a microcalorimeter must operate in two modes:
  • normal mode-thermopile voltage measurement—heating element connected, diode disconnected;
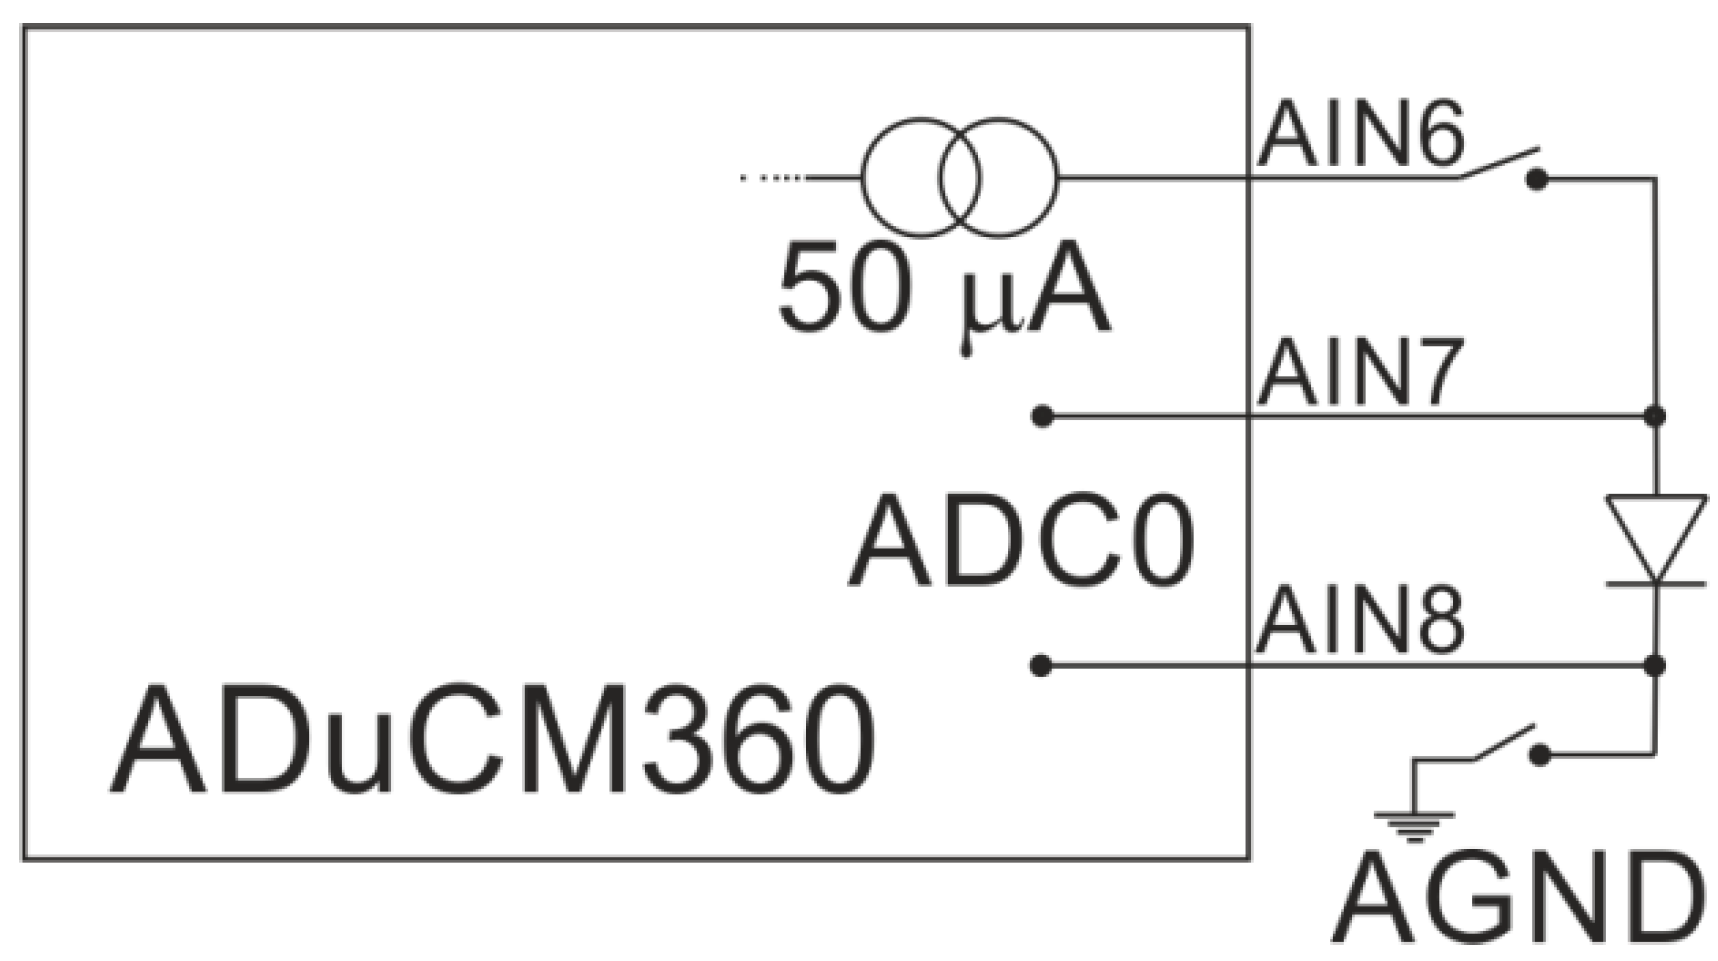
  • temperature measurement of cold junctions—diode connected to the measurement system and polarised with 50 µA current, heater disconnected, thermopile voltage not measured.
Switching between the operating modes is managed by a microcontroller that controls the relays.

4. Design of the Control and Measurement System

The device was designed to measure the heat flows using a semiconductor microcalorimeter sensor. Although the presented device was adapted specifically to the XEN-NCM9924 model from Xensor Integration [20], it can be easily adapted to other models. For the purpose of precise measurements, a special power supply part of the measurement system was designed and manufactured (Figure 5). The system consists of a power block, a heating element control block and a measurement block.
The control block supplies the voltage to the heater. A microcontroller DAC output is used to control this voltage. The voltage profile is selectable using the LabVIEW application. The application enables the power waveform to be set in a rectangular, stepped, linearly increasing and sinusoidal shape. After adapting the software, it is also possible to generate other waveforms.
The measuring block was implemented based on an ADuCM360 microcontroller [37], which contains two multichannel ADCs with a 24-bit resolution and a 12-bit DAC. One ADC was used to measure the signals from the microcalorimeter-the voltage on the thermopile and alternatively the voltage on the semiconductor temperature sensor. When measuring the voltage on the thermopile, the diode sensor is not available through the commutation circuit. When measuring the voltage on the diode sensor, the heaters are disconnected. Therefore, it is not possible to measure the temperature on the diode correctly during heating, but only when the microcalorimeter is cooled down after disconnecting the heaters. The second ADC is used to monitor the power that is supplied to the heater by alternately measuring the voltage and current on that element. Then, the current power and current resistance of the heater can be determined.
The control and measurement system is connected to a PC via an isolated USB interface. The application, which was created in LabVIEW, controls the commutation systems, the power that is supplied to the heaters and also records the measurement data.

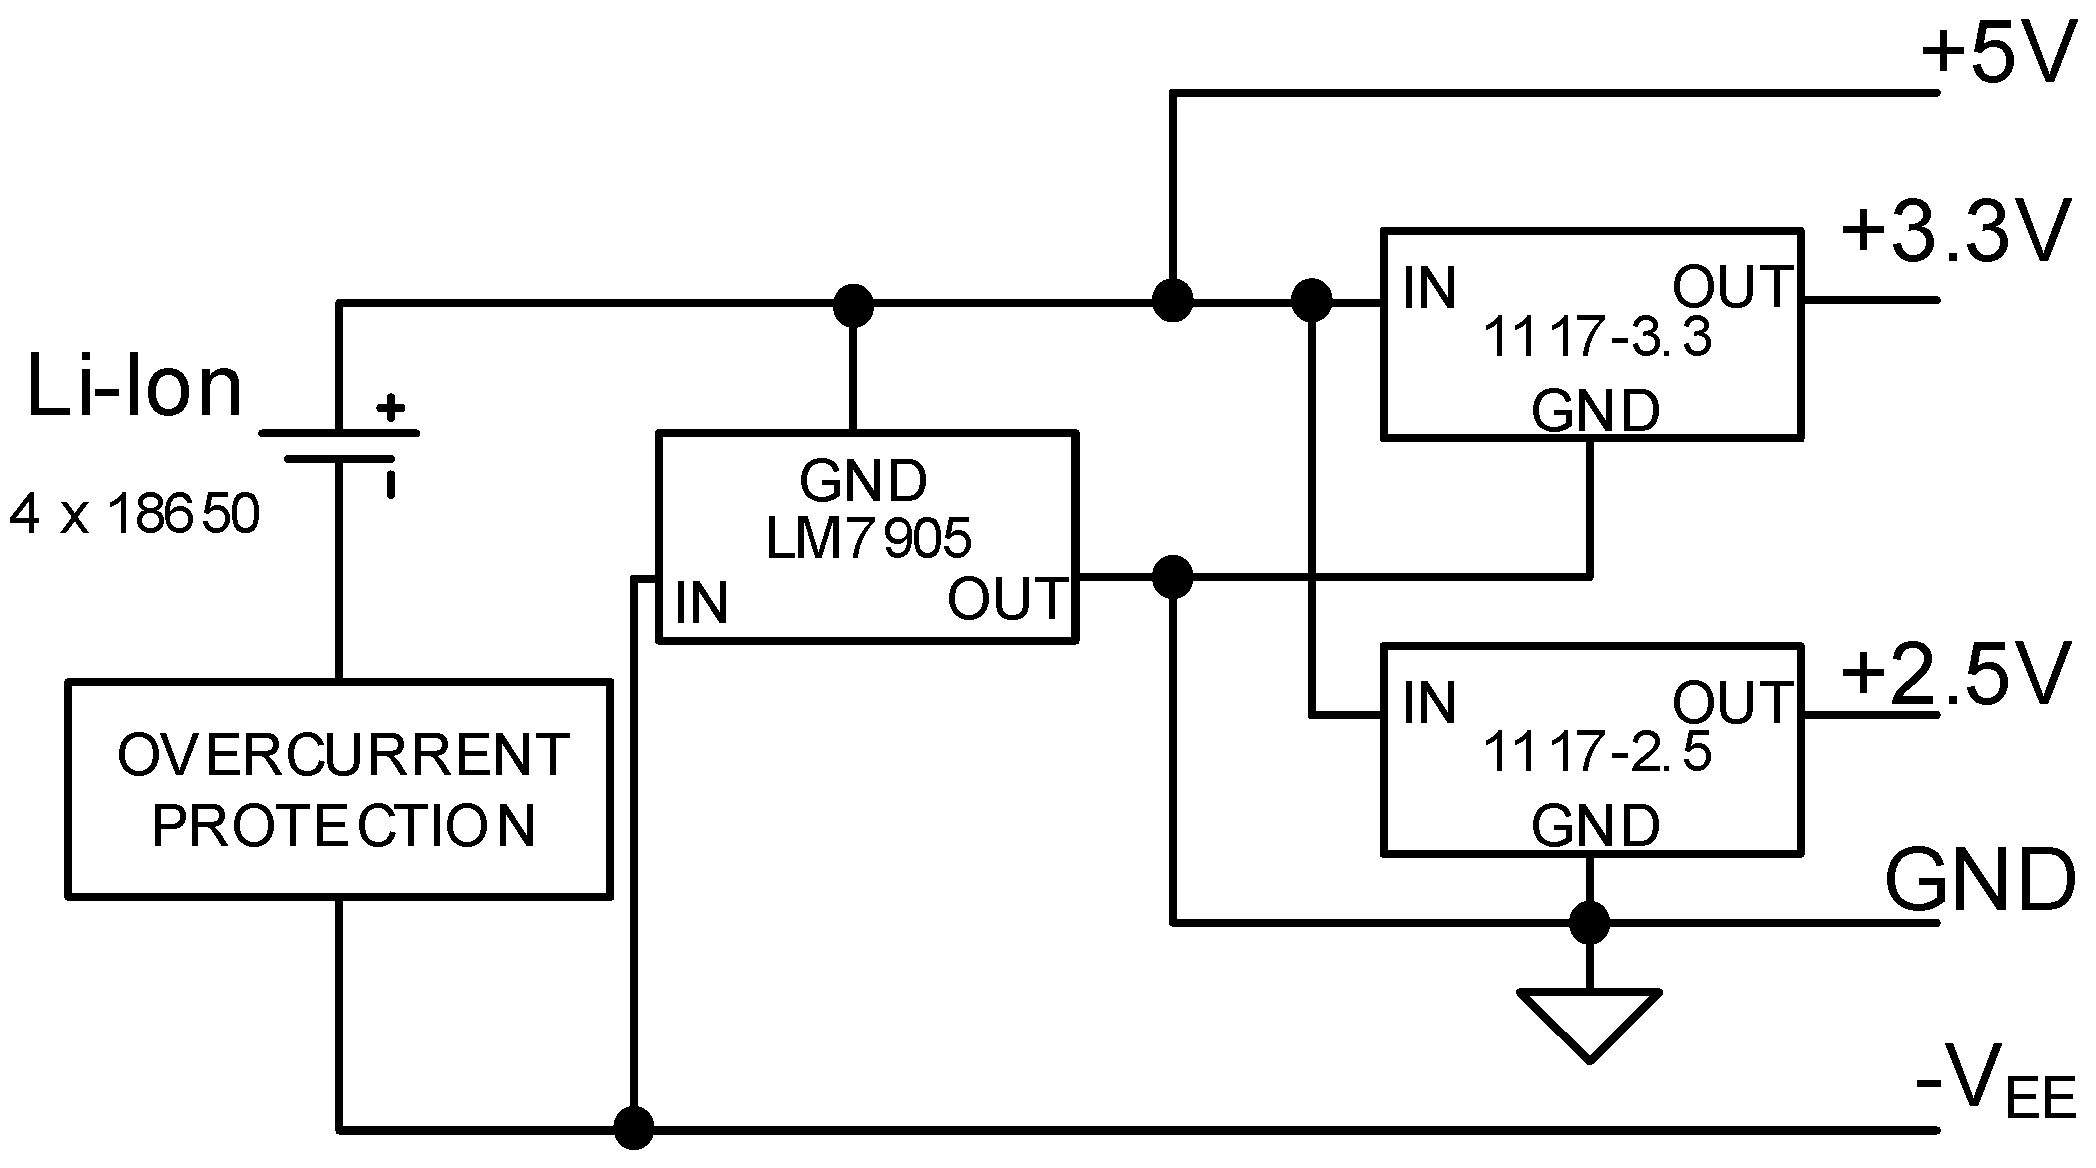
4.1. Power Supply System

In order to reduce the interference noise, a battery power supply was designed. For this purpose, four 18650-type lithium-ion cells with a nominal voltage of 3.7 V were used. For the proposed heater controller, both positive and negative voltages are required, but the negative voltage does not have to be stabilised. This was obtained by using an LM7905 stabiliser in the configuration that is shown in Figure 6. The 2.5 V and 3.3 V voltages were obtained using typical three-terminal low-dropout (LDO) LM1117 stabilisers.
The negative voltage VEE is not stabilised and can vary depending on the level of the cells charge. Its value also results from the applied overcurrent protection and reverse polarity protection. Slow variations in VEE are insignificant, because it is used only as a negative voltage to supply the operational amplifiers and buffer.
The power supply system is additionally equipped with a battery condition monitoring module, which consists of:
  • a comparator system with an adjustable threshold detecting battery voltage drop below 10 V (2.5 V per cell);
  • an LED that indicates the battery status.
An appropriately rescaled battery voltage is applied to the input of the ADC in the microcontroller. A binary output signal from the monitoring system is also delivered to the interrupt input terminal of the microcontroller.

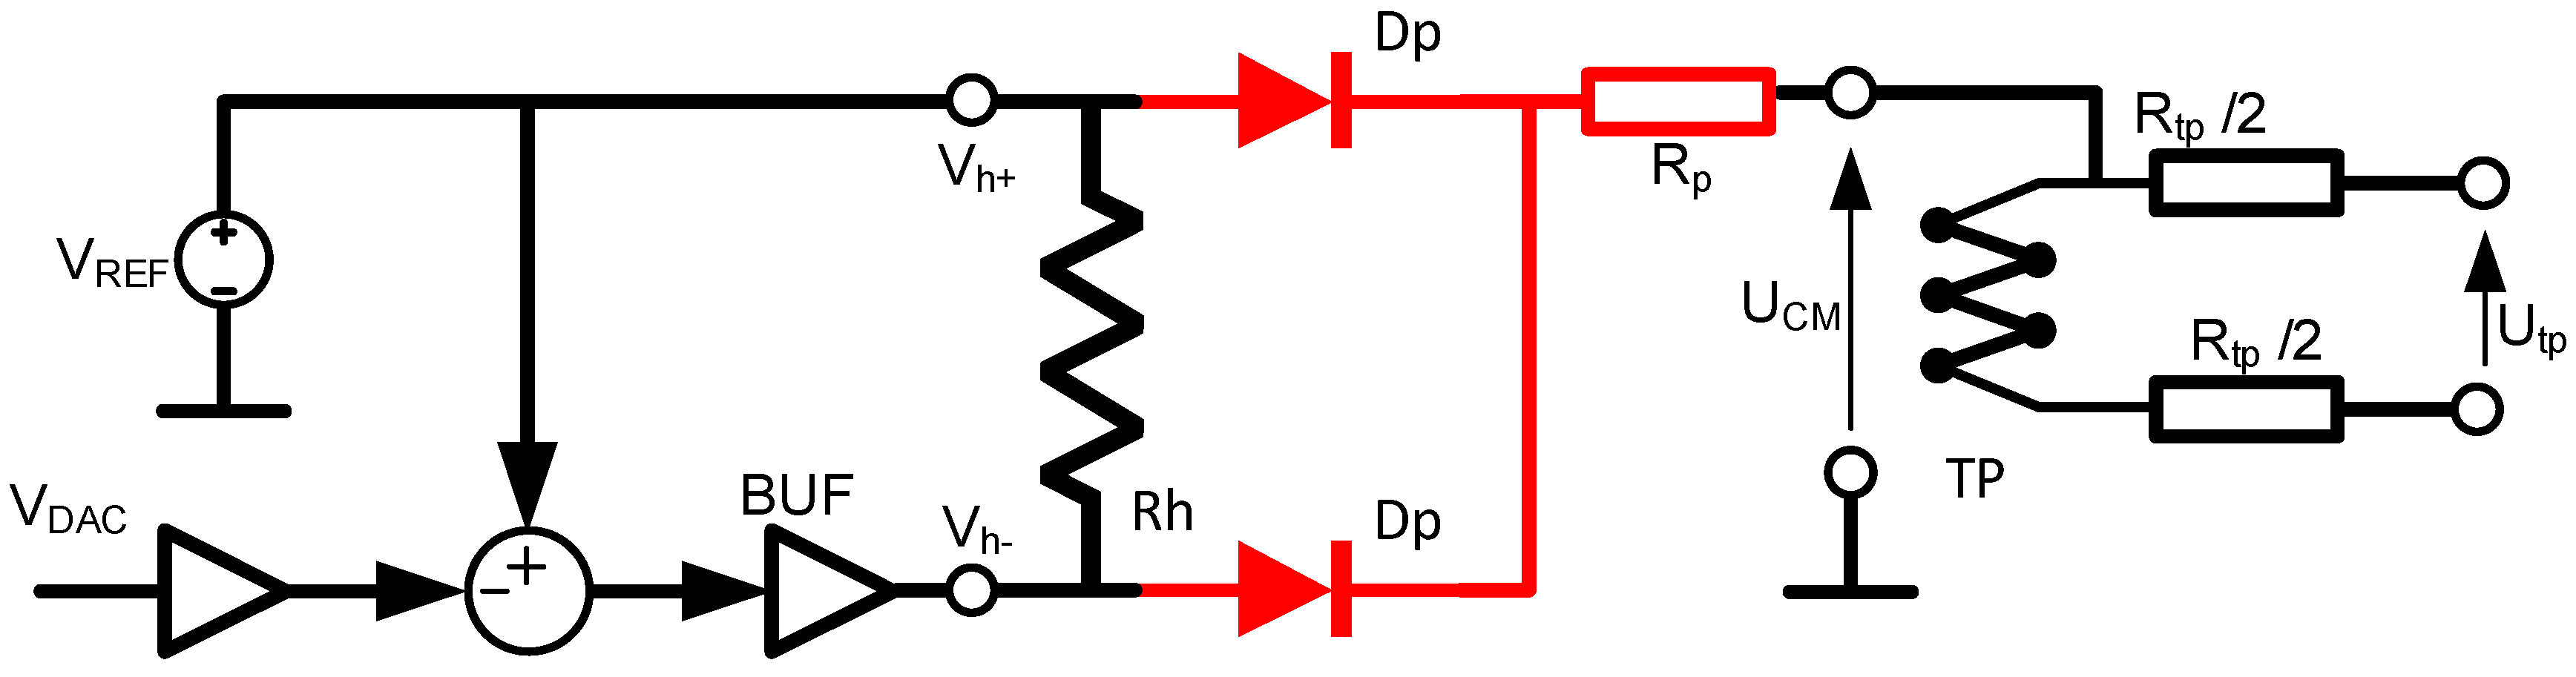
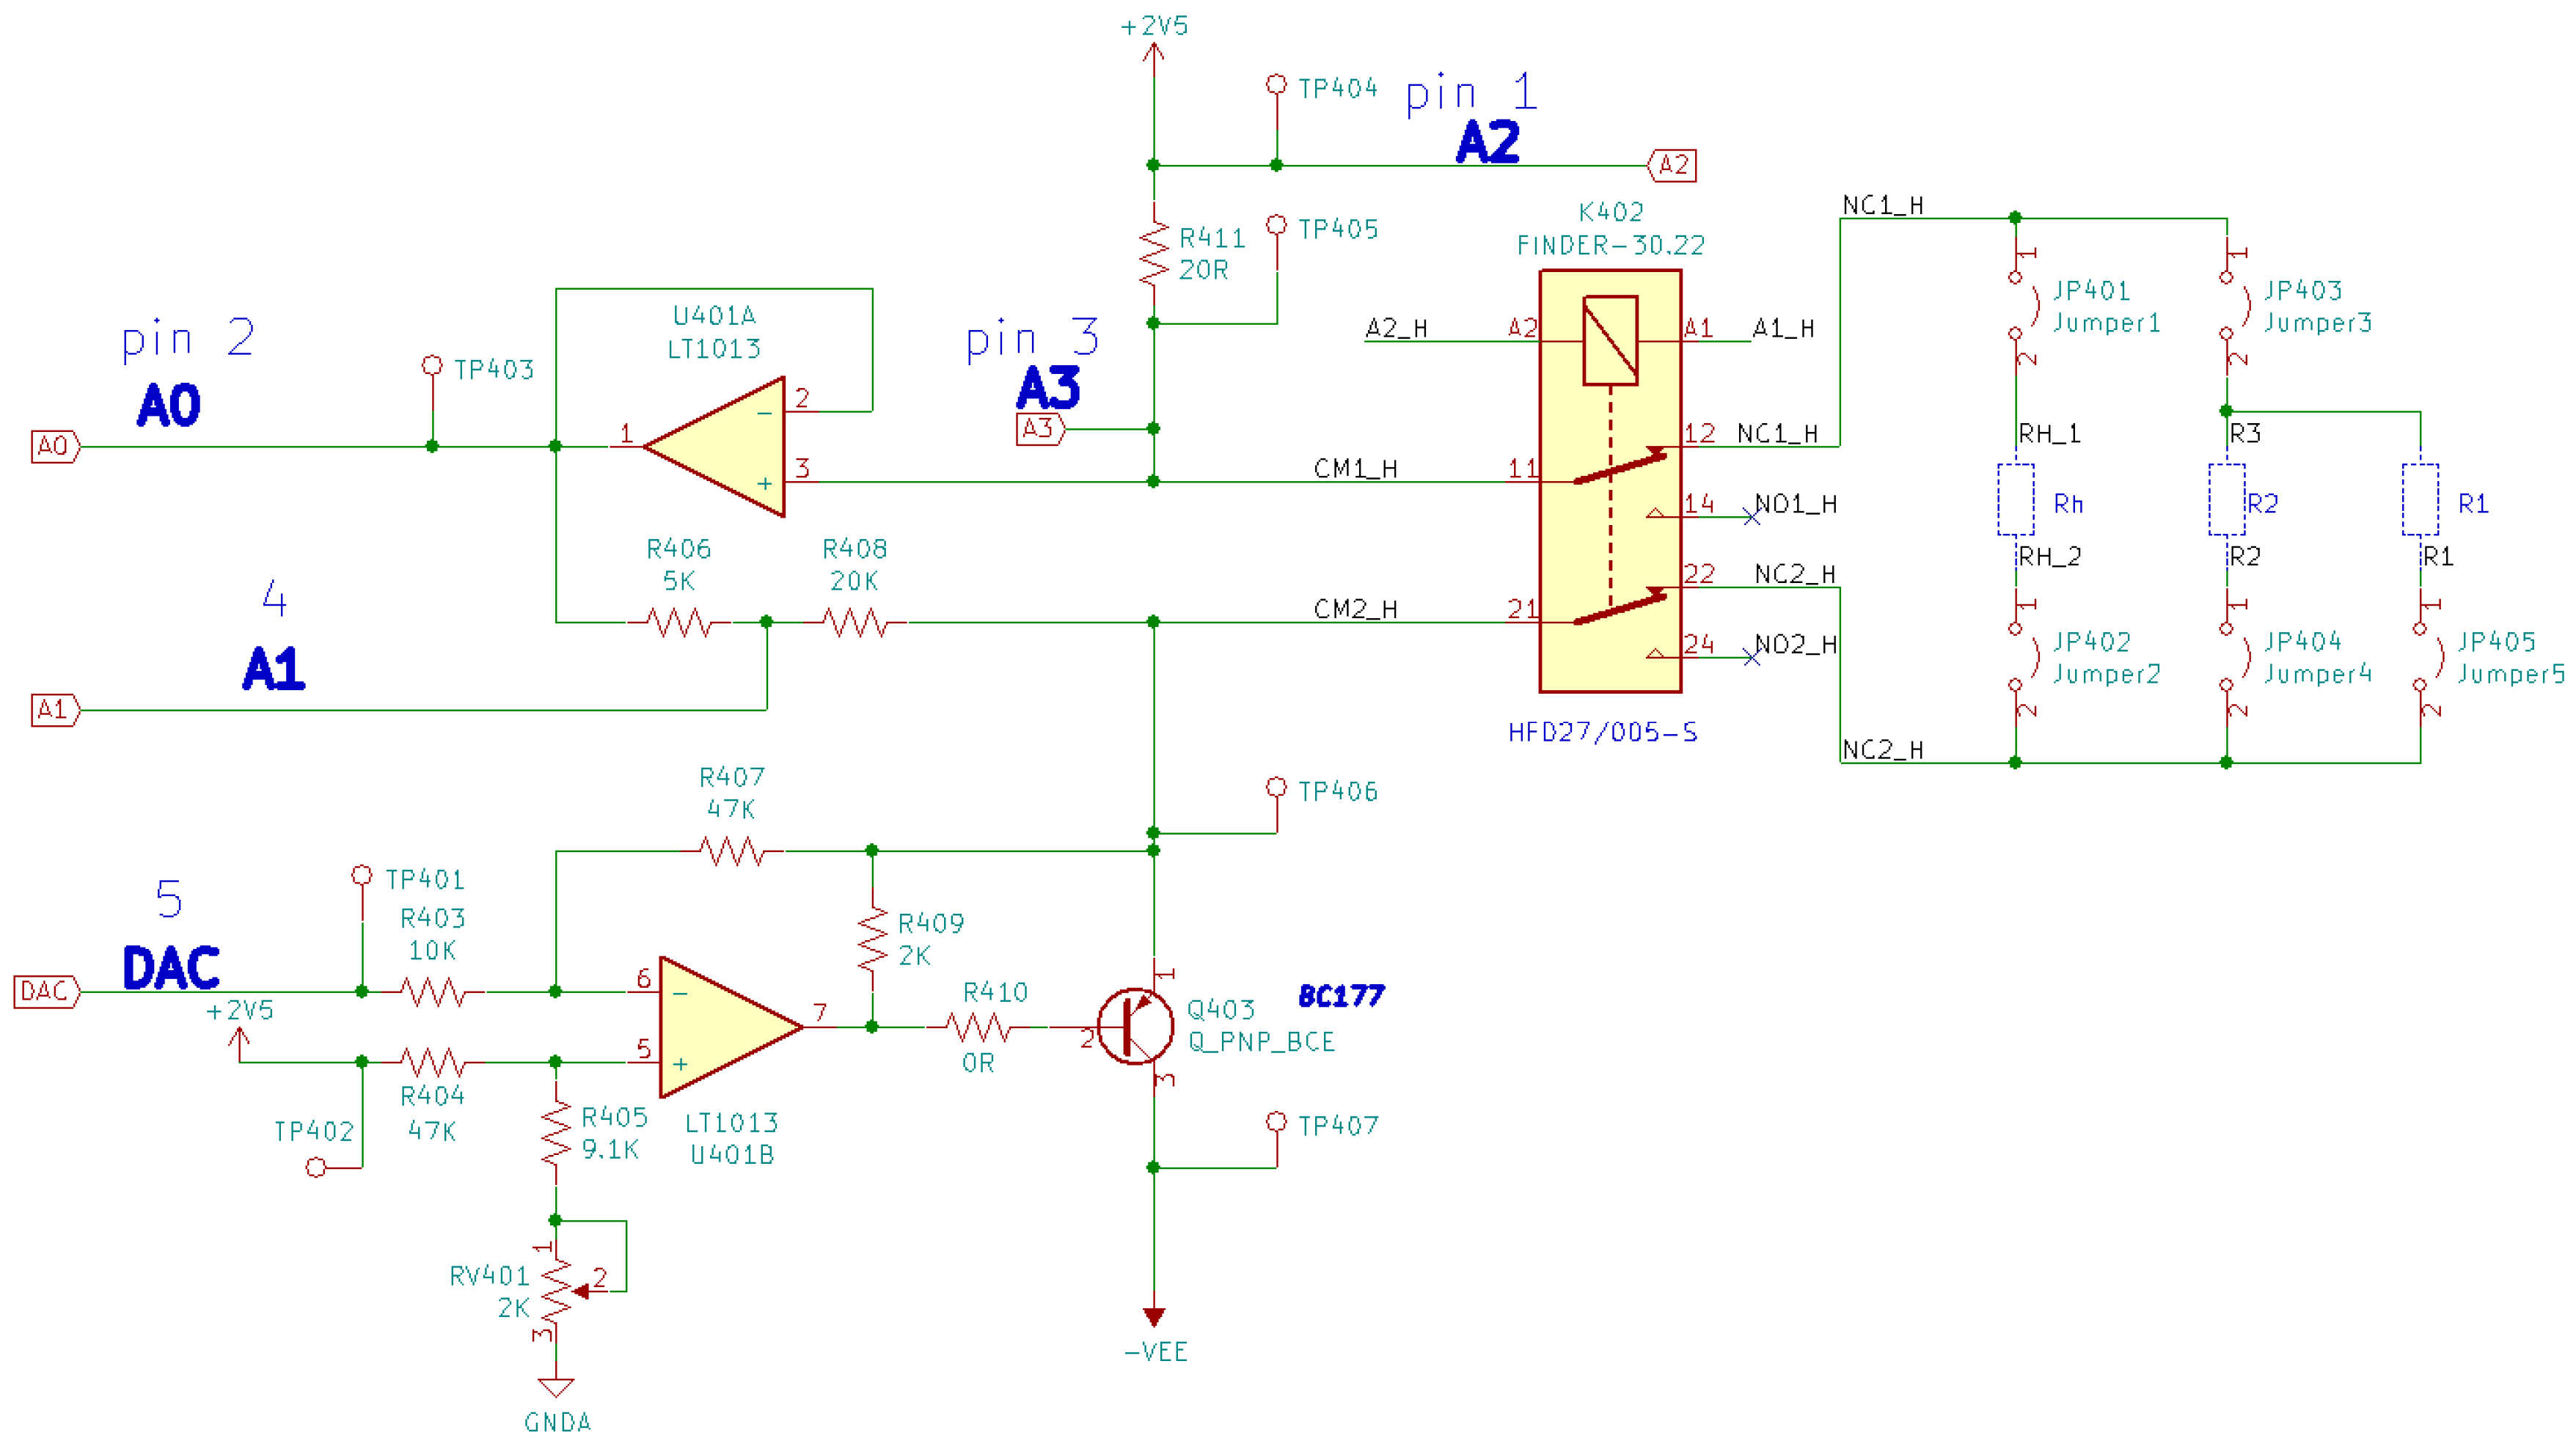
4.2. The Control System of the Heating Element

The heater control system was designed taking into account the interactions that were described in Section 3.1. The electrical scheme of the system is shown in Figure 7. The scheme was directly reproduced from electronic design automation (EDA) software without any simplifications.
The heater is connected to the terminals marked CM1_H and CM2_H (Figure 7) through the relay commutation circuit. The relay is controlled from the microcontroller. As was stated above, a XEN-NCM9924 microcalorimeter is equipped with three heating elements: two aluminium and one semiconductor (Table 1). The heater can be selected by the appropriate connection of the jumpers on the mainboard. The jumpers enable the connection of a single heating element as well as a parallel connection of any combination of the elements. A U401B amplifier (Figure 7) together with the surrounding resistors and transistor Q403 works as the control system for the heating element. The potential on pin TP406 (Figure 7) is equal to:
V T P 406 = V R E F · R 405 + R V 401 R 404 + R 405 + R V 401 · ( 1 + R 407 R 403 ) V D A C · R 407 R 403
The ratio R407/R403 determines the gain of the DAC output signal. Because the DAC output voltage varies from 0 to 1.2 V, the output voltage may vary by:
V D A C m a x · R 407 R 403 = 1.2 V · 47 k 10 k = 5.64 V  
Due to resistor R411 for measuring the current, the voltage on the heater changes in a narrower range.
The variable resistor RV401 enables tuning stand-by voltage on the heater for the output voltage of the DAC equal to zero. This can be achieved if the following condition is met:
R 407 R 403 = R 404 R 405 + R V 401
The system permits the current and voltage on the heater to be measured. The current of the element is measured by measuring the voltage drop on the R401 element (the voltage between terminals AIN2 and AIN3). The common mode voltage on this element is about 2.5 V, thus it is in the range that is acceptable by the ADC. However, there is no possibility to directly measure the heater voltage because the potential of the negative electrode can reach −2.6 V. This value is below the range that is acceptable by the converter. The problem was solved by using a voltage follower on a U401A amplifier and a voltage divider R406-R408 (Figure 7). The heater voltage is measured between the AIN0 and AIN1 terminals. Both potentials are in the range that is acceptable by the ADC and are within the entire control range of the heating power. Then, based on the voltage and current of the heater, the current power and current resistance of the heater are calculated in the microcontroller. As a result, a significant improvement in the accuracy of the power measurements was obtained compared to systems in which only the voltage or current is measured and the power is calculated based on the resistance that is given by the manufacturer without considering its dependency on the temperature.
The maximum offset voltage of an LT1013CP amplifier (Texas Instruments, Dallas, TX, USA) is 450 µV. Hence, the relative uncertainty in the heater voltage measurement is 90 ppm. The relative uncertainty in the measurements of the power and resistance of the heating element are similar. In turn, the maximum input bias current of the amplifier is 50 nA. Hence, the relative uncertainty that is caused by the input bias current is about 10 ppm, which is negligible.

4.3. The Diode Voltage Measurement

As was shown above, the diode to measure the absolute temperature is connected by the commutation circuit. A current of 50 µA, which is used to bias the diode is supplied by the microcontroller (pin AIN6). The voltage across the diode is measured by using the AIN7 and AIN8 terminals of the analogue multiplexer and the Ch0 channel of the ADC (ADC0). Because the four-wire sensing method is used, the voltage drops on the relay contacts do not affect the measurement results. The schematic of the diode measurement block is shown in Figure 8.

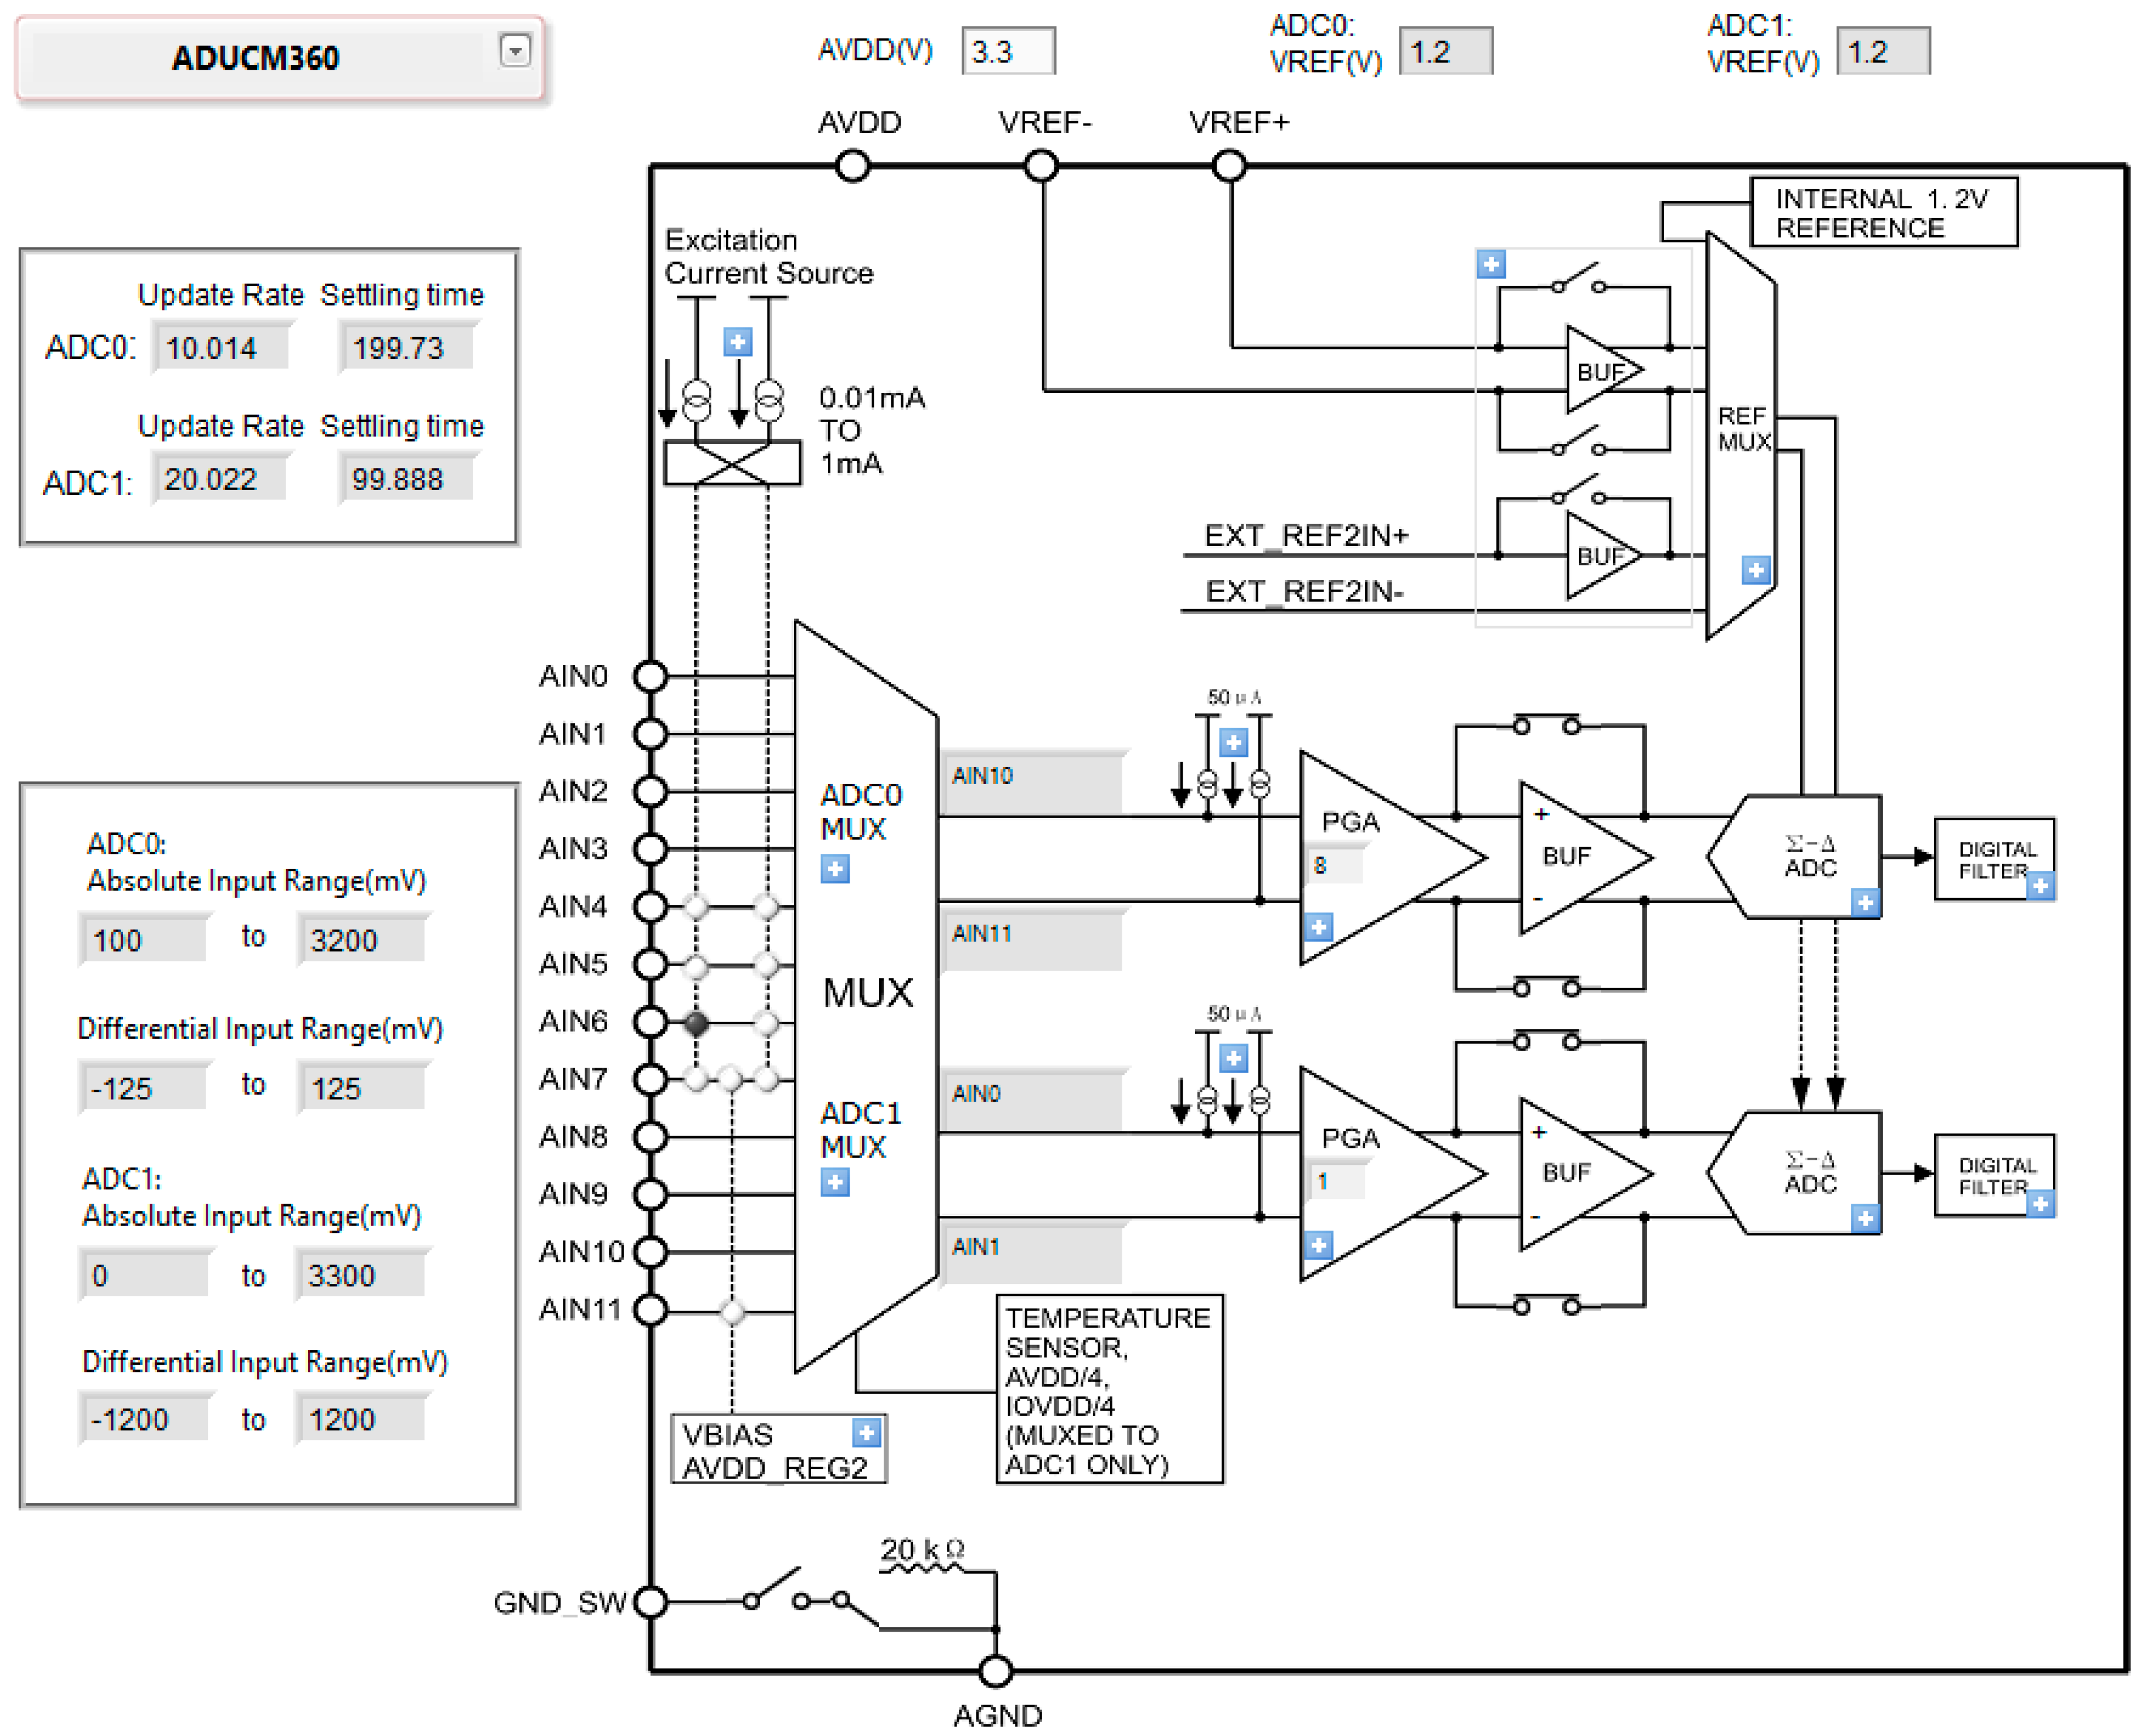
4.4. Configuration of the Analogue Part of the ADuCM360 Microcontroller

4.4.1. Configuration of the Analogue Inputs

The ADuCM360 microcontroller is equipped with two ADCs, each of which has an additional programmable gain amplifier (PGA) that enables gains from 1 to 128 to be selected. The measured signals are delivered from an analogue multiplexer, which allows any signal to be given to the converter in both the differential and single-ended modes. The selected input lines can be supplied from a programmable current source (PCS). The ADC0 channel of the converter is used to measure the voltage on the thermopile and diode. For the voltage measurements on the thermopile, the differential mode of the converter and gain 8 are used. This enabled voltages in the range of ±125 mV with a common mode component between 0.1 V and 3.2 V to be measured. This range corresponds to the differential and common mode voltages that occur on the thermopile, thus no conditioning of the voltage on the thermopile is required.
The voltage drop on the diode is measured by connecting the anode and cathode of the diode directly to inputs AIN7 and AIN8 of the multiplexer. When measuring the voltage on the diode, the PGA gain is set to 1 which accepts the common voltages being varied from 0 to 3.3 V. In effect, the signal from the diode does not require conditioning. The current source of 50 μA is switched on only when measuring the diode voltage. At the same time, the commutation relay connects the diode to the microcontroller.
The voltage and current of the heating element are measured alternately in channel Ch1 of the ADC (ADC1). The conditioning system that was described in Section 4.2 provides the appropriate range of differential and common mode voltages.
The ADuCM36x Tool (Analog Devices, Norwood, MA, USA) was used to configure the analogue inputs. After the configuration was created in a graphic form, the system generated the functions in the C language, which were attached to the processor firmware. The view of the main application window is shown in Figure 9.

4.4.2. Configuration of the Analogue Output

The ADuCM360 microcontroller is equipped with one 12-bit DAC. In the presented solution, the DAC is used to control the power that is supplied to the heating element. The converter is polarised with an internal reference voltage of 1.2 V. The output voltages can also vary from 0 to 1.2 V. The converter output is connected to the heater voltage conditioning system that was described in Section 4.2.

4.4.3. Data Transmission

Serial transmission was used for the data communication between the microcontroller and the PC. The TxD and RxD lines of a universal asynchronous receiver-transmitter (UART) interface are connected to a galvanic isolation system. A prototype board was designed to use 6N137 optocouplers and ADuM1201 transformer digital isolators. This made it possible to compare the disturbances that are generated using both insulation methods. On the uninsulated side, a typical UART/USB converter type FT232 is used. The data is transmitted at a standard speed of 115200 bps.
The processor sends the data in a text format. A convention was adopted in which the data can be either downloaded to a text file in the .csv format or processed online, for example, in LabVIEW. In the thermopile voltage measurement mode, each data frame contains a voltage value and a timestamp with a resolution of 1 ms.
The voltage sampling frequency can be switched to one of the following values: 10 Hz, 20 Hz, 50 Hz or 100 Hz. Switching is done by sending the appropriate one-character command to the microcontroller. Optionally, the measurement of the power of the heating element together with the voltage measurement on the thermopile is available. While the power measurement mode is activated, the voltage and current of the heating element are measured alternately. After the completion of each measurement cycle, a frame containing the voltage, current, resistance and power of the heater along with the time stamp is sent. The power of the heater can be controlled in one of several modes:
(a)
Step mode. In this mode, one of seven predefined voltages is provided to the heater terminals. The voltage is switched by sending a one-character command to the processor. Using this mode, the higher-level system (control device) can execute a square wave with any duty factor and selectable amplitude as well as a stepped waveform.
(b)
Linear power increasing mode. In this mode, a voltage that is proportional to the square root of time is applied to the heater. This represents a linear increase in power. Similarly, power that decreases linearly over time can be obtained. The linear increase or decrease in power is triggered by a one-character command.
(c)
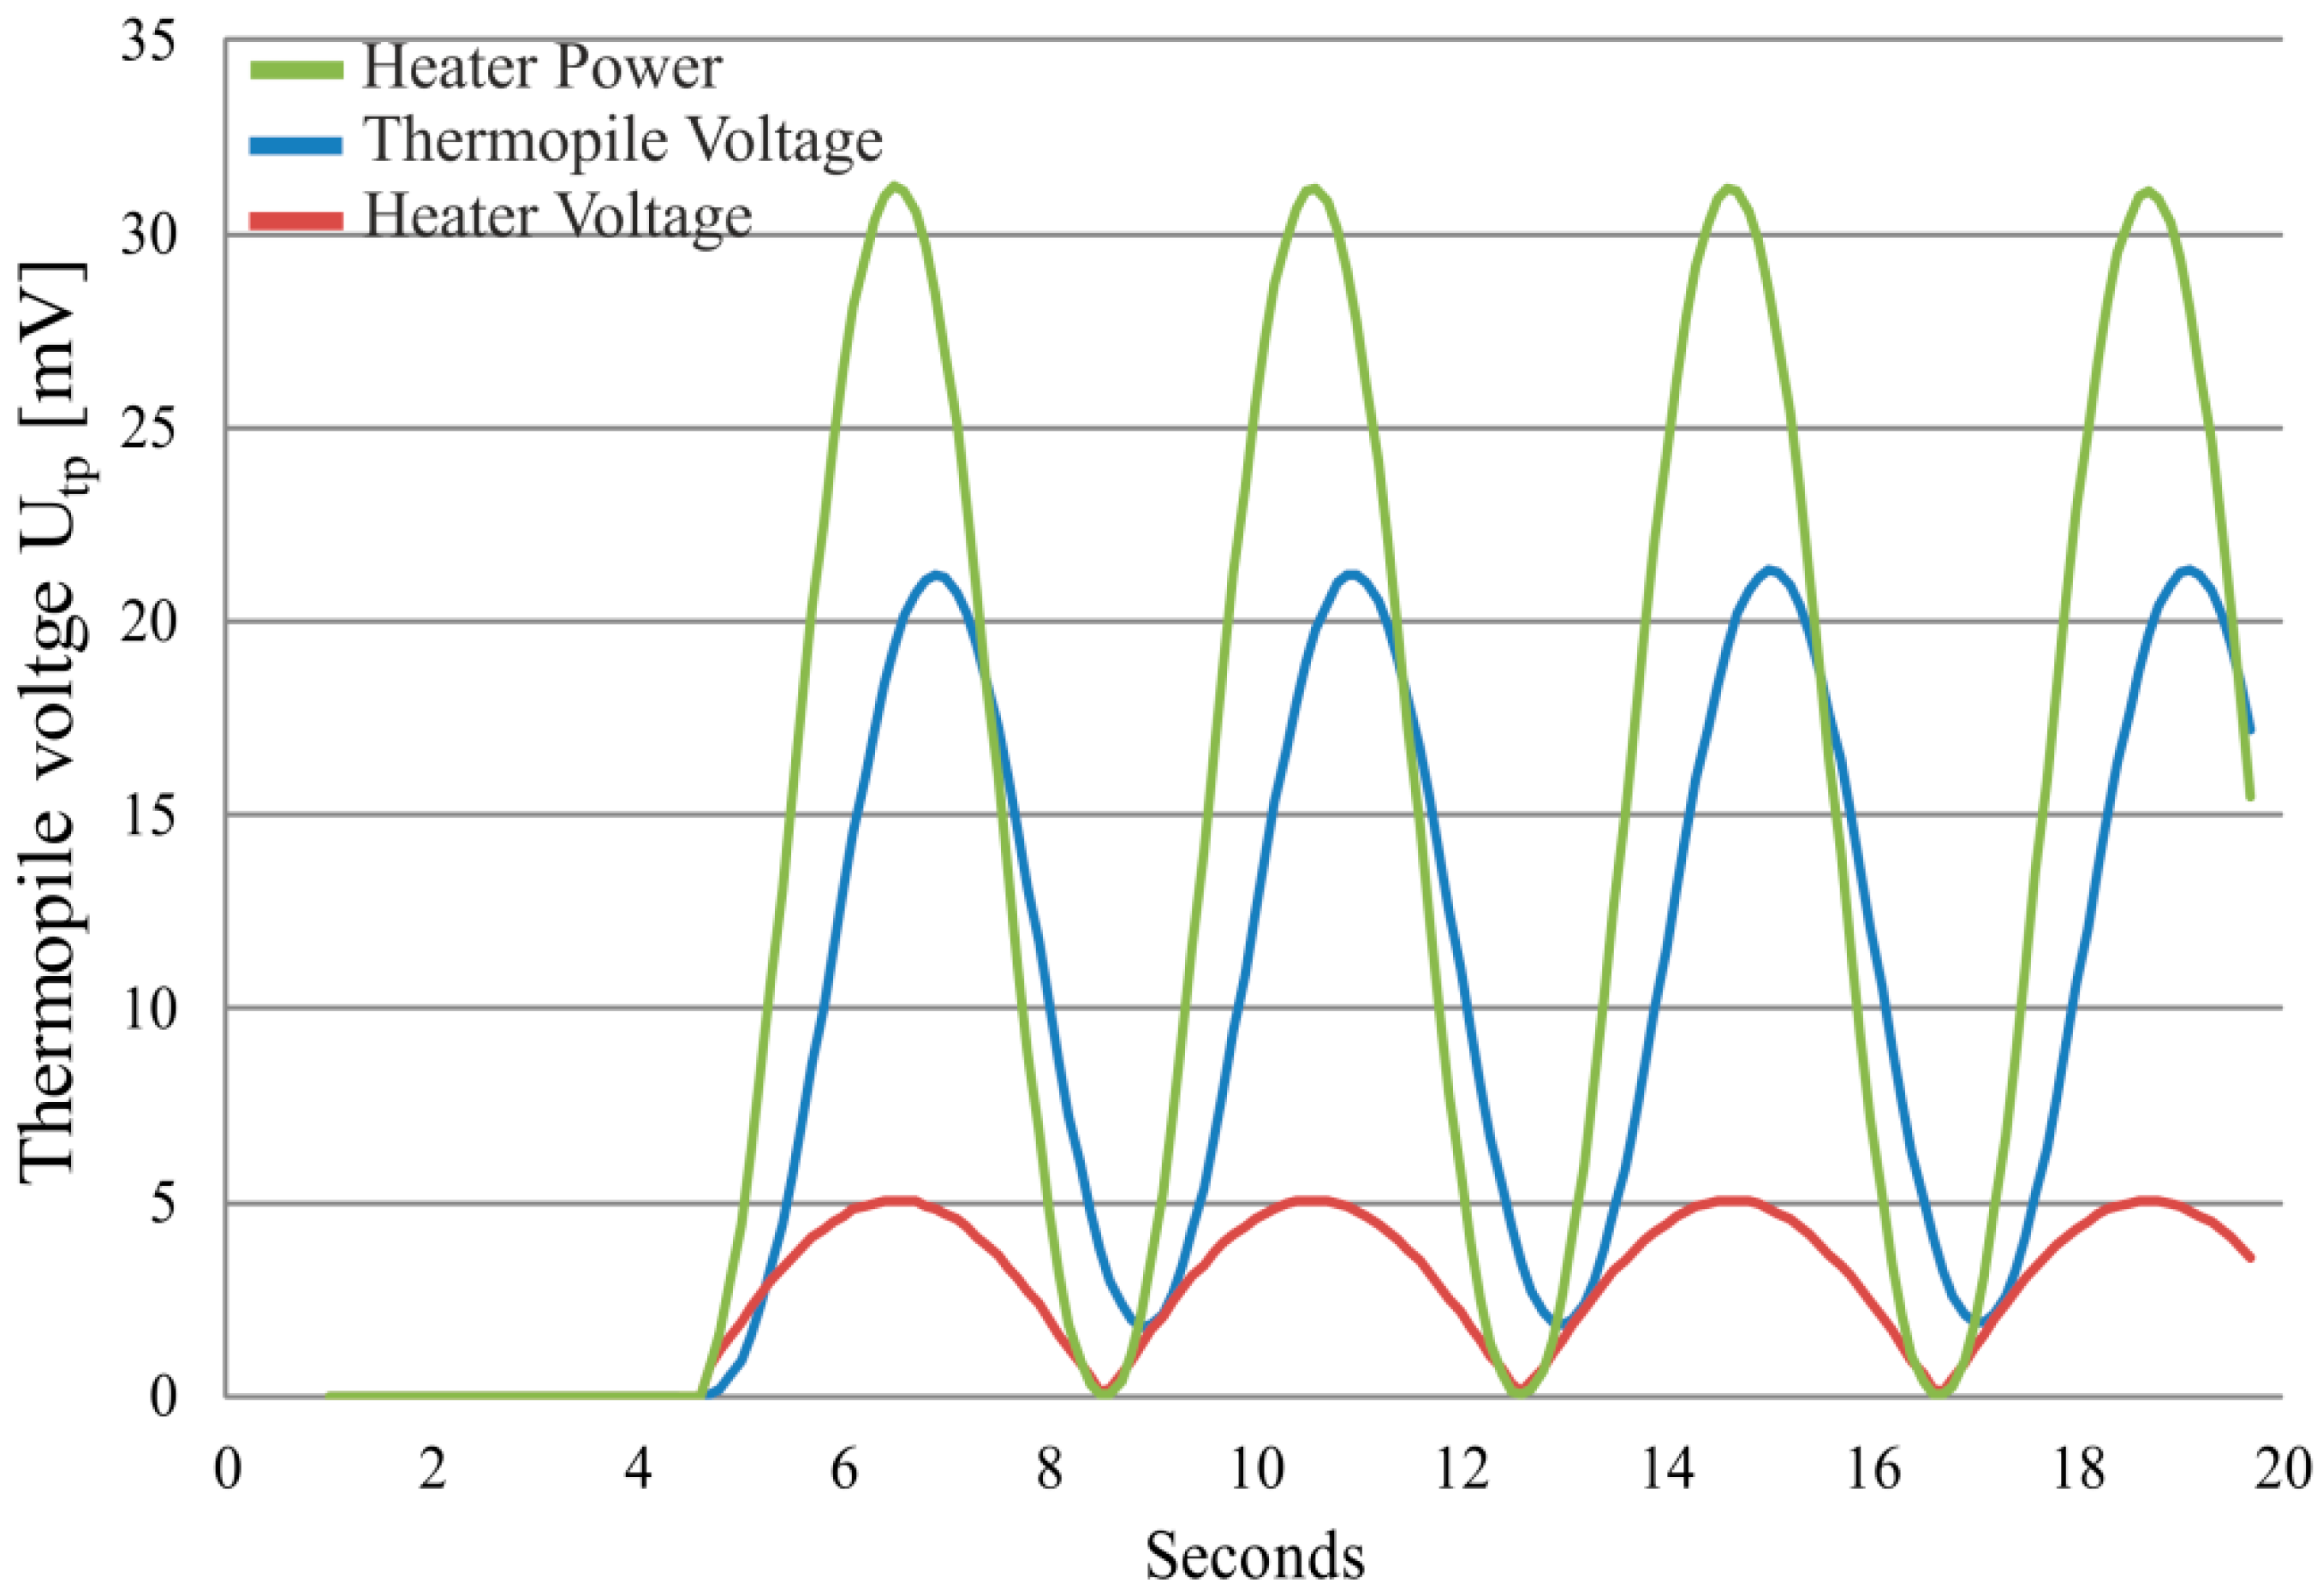
Sinusoidal mode. In this mode, the analogue output voltage is given in the form of a full-wave rectified sinusoidal waveform: U(t)= Um·|sin(πft)|. The power on the heater, therefore, has the form P(t)=P0-P0·cos(2πft). The frequency of the power changes ft can be 10 Hz or 2.4 Hz.
The start of the sinusoidal waveform is synchronized. As a result, when switching from the off state to the on state, the sinusoidal waveform always starts at zero. The sinusoidal waveform is generated at a sampling rate of 1 kHz. Subsequent samples are generated as the results of the solution of the oscillator difference equation. This method is characterised by a very low computational effort compared to counting the subsequent samples of the sine function, as well as a very small memory requirement compared to the look-up table solution.

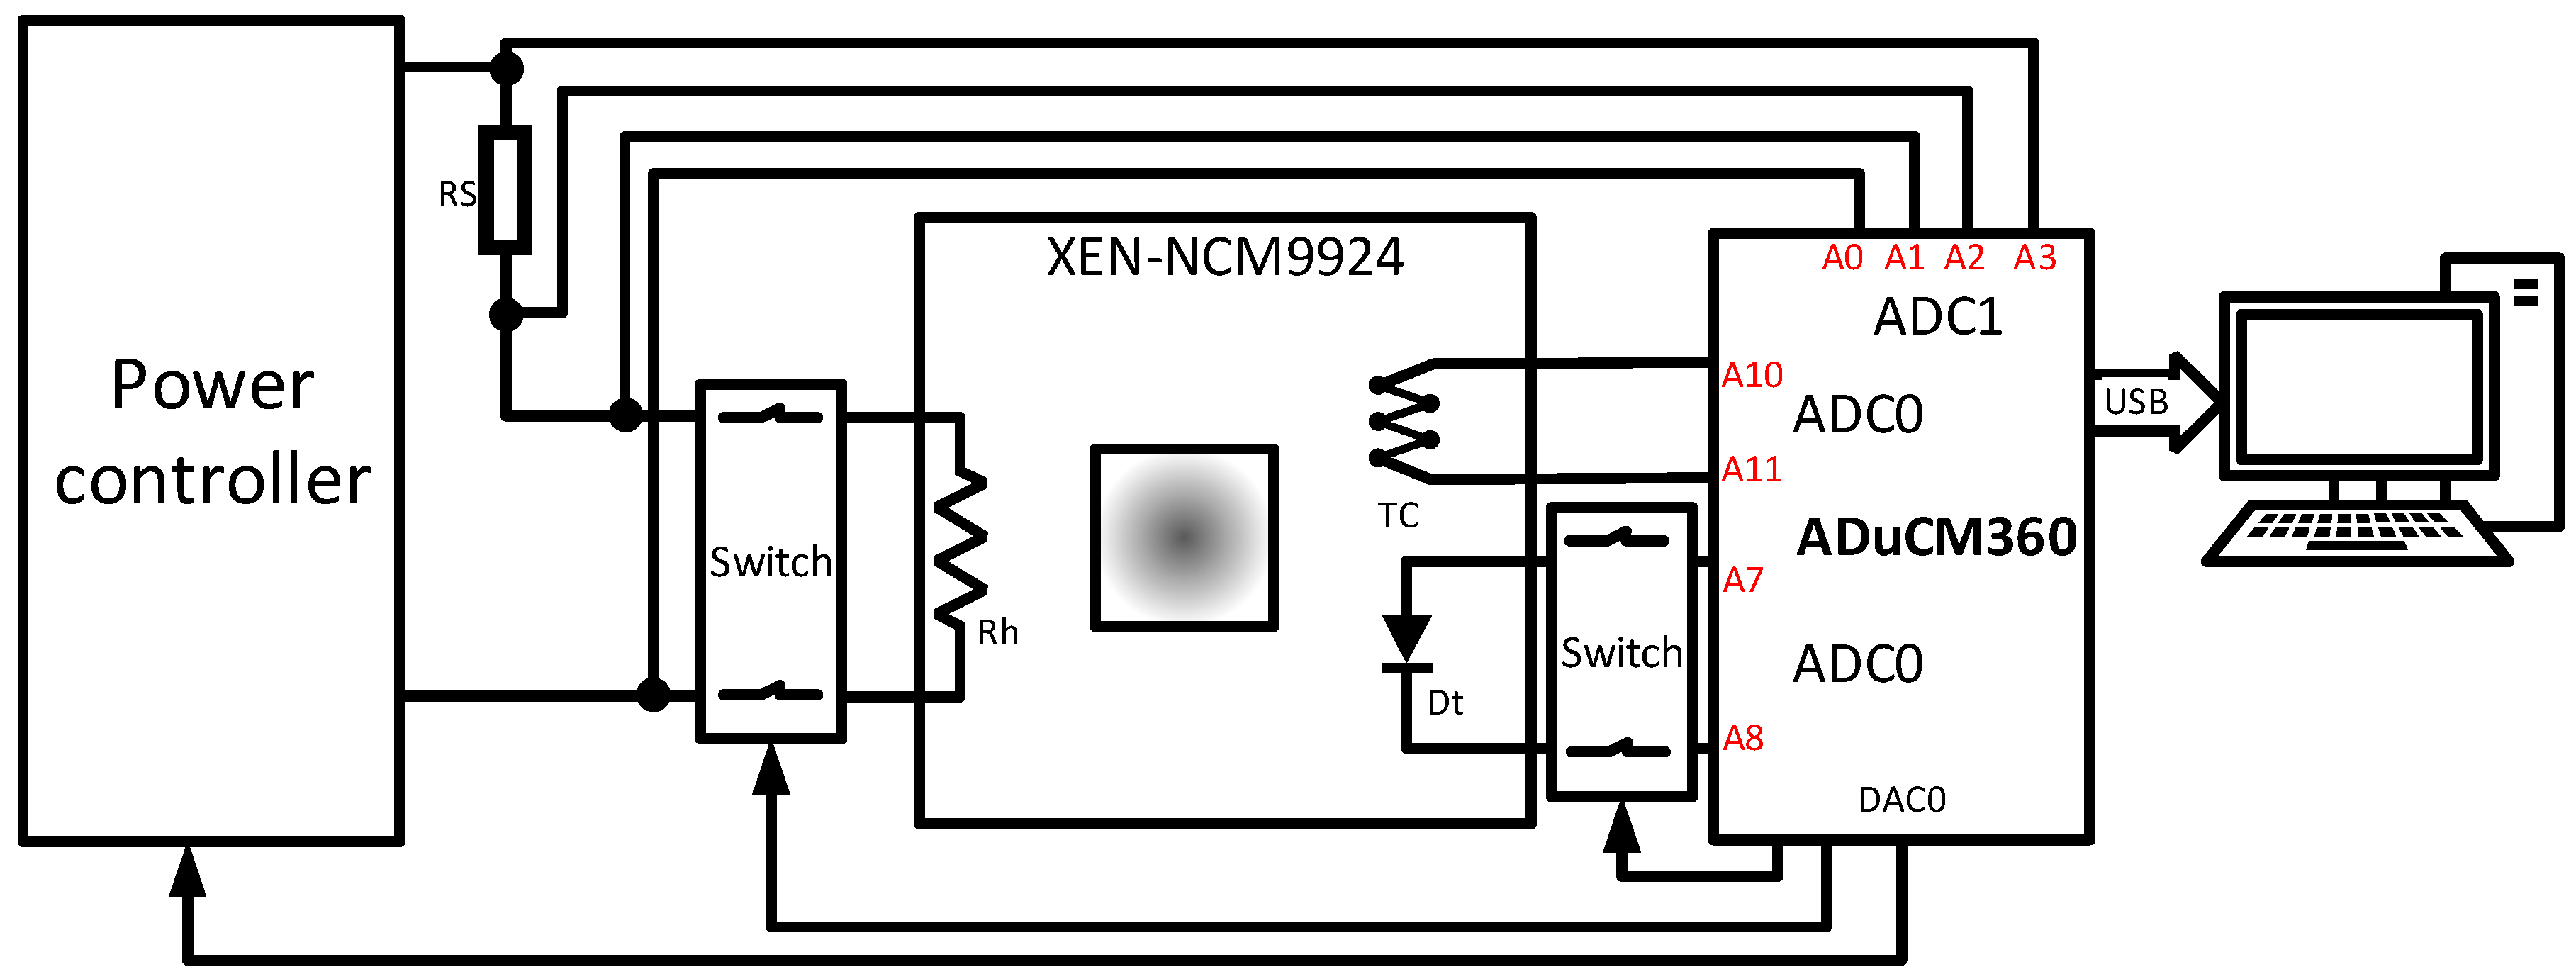
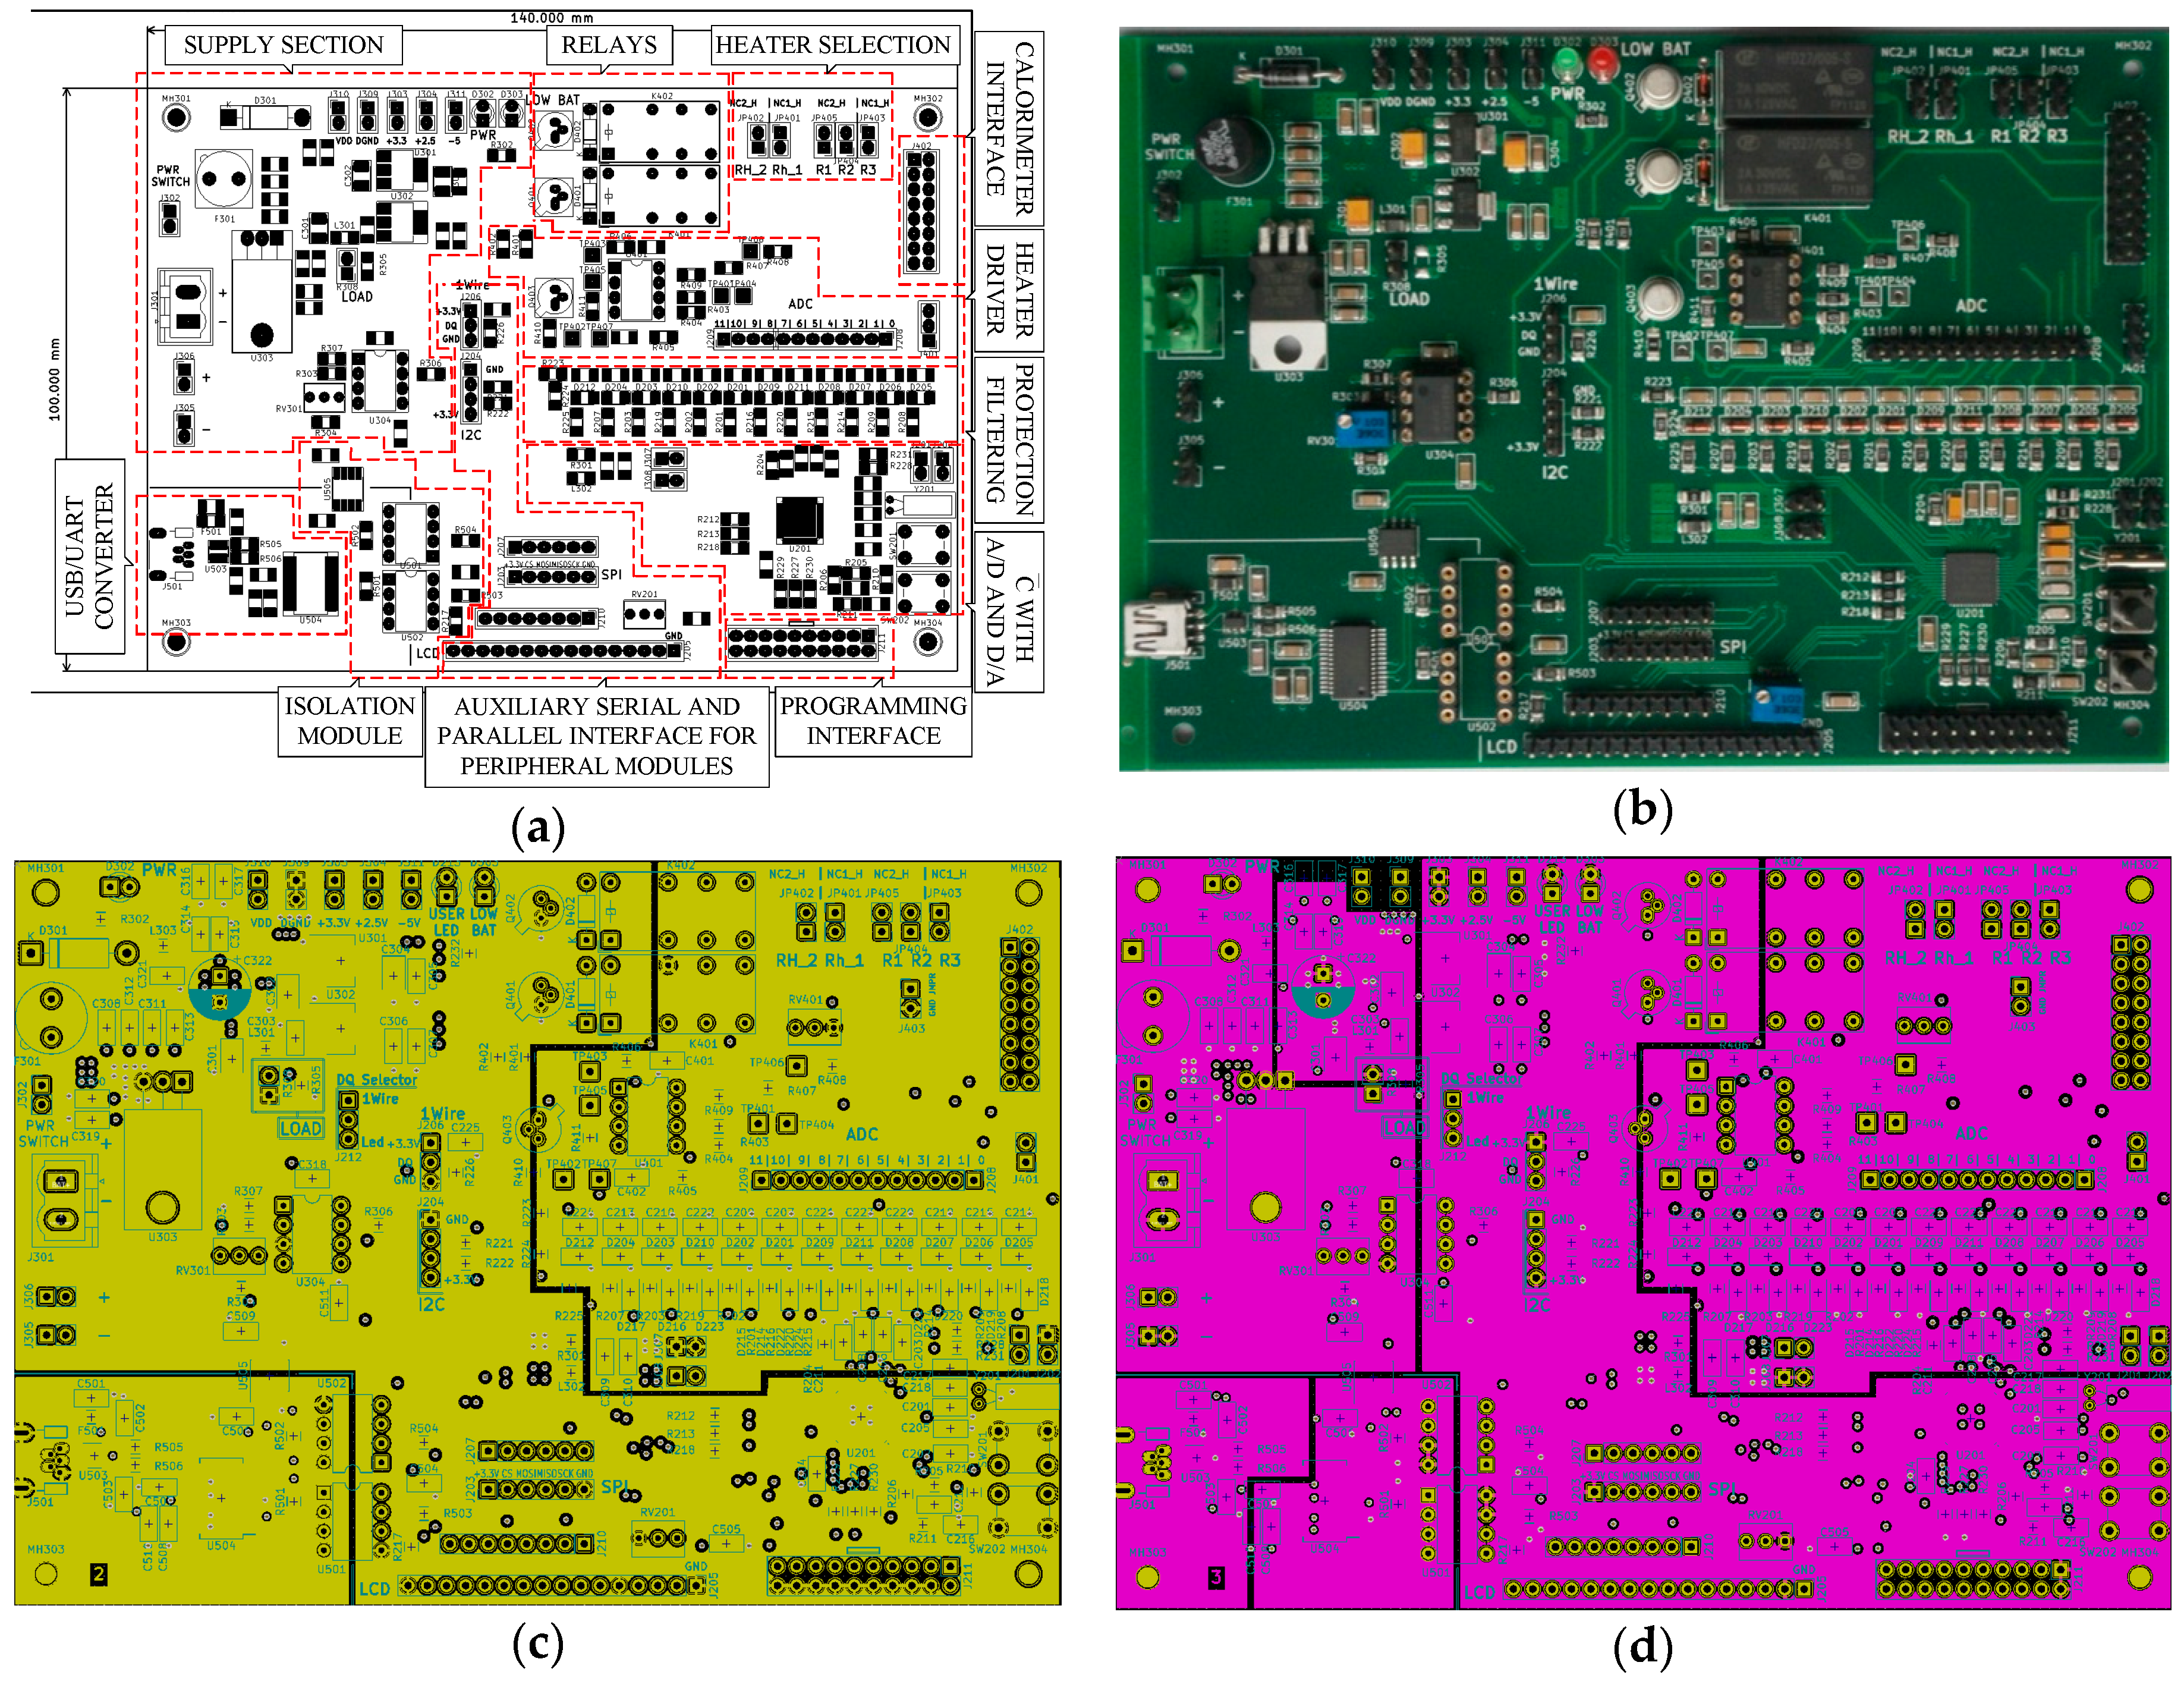
4.5. The Layout of the Microacalorimetry Control and Measurement System

The system was implemented on a four-layer printed circuit board (PCB). Figure 10a,b show the arrangement of the elements on a PCB. Figure 10c,d show the distribution of the voltage planes (Figure 10d) and ground planes (Figure 10c). All of the PCB layers of the control and measurement system were designed in accordance with good engineering practices [38,39]. The project took into account the impact of the control algorithms on the level of electromagnetic interference [40] and the influence of magnetic materials [41]. Figure 10a contains the specific division into functional blocks. In addition to the elements described above, the project of the PCB also provides the possibility of adding external measurement, recording and display devices via standard interfaces—SPI, I2C, 1-Wire and others. A connector was also added to connect an HD44780 compatible LCD display. The microprocessor can be programmed using both the SWD interface (standard ARM processor programming interface) as well as via a serial interface USB converter.

5. Metrological Properties of the Measurement System

Among the metrological properties of the data acquisition system of signals dedicated for calorimetric sensors, the most important is the resolution. By the resolution, we mean the smallest distinguishable change in the voltage on the thermopile. Knowing the thermopile sensitivity coefficient, which is expressed in mV/°C (e.g., for the XEN-NCM9924, it is 50 mV/°C [20]), the smallest distinguishable change in temperature can be determined.
Because the signals from the sensor (thermopile voltage and diode voltage) are not conditioned but are connected directly to the ADC inputs, all others metrological properties—linearity, long-term stability, distortions etc.—should by the same as specified in the documentation of the ADuCM360 [37].

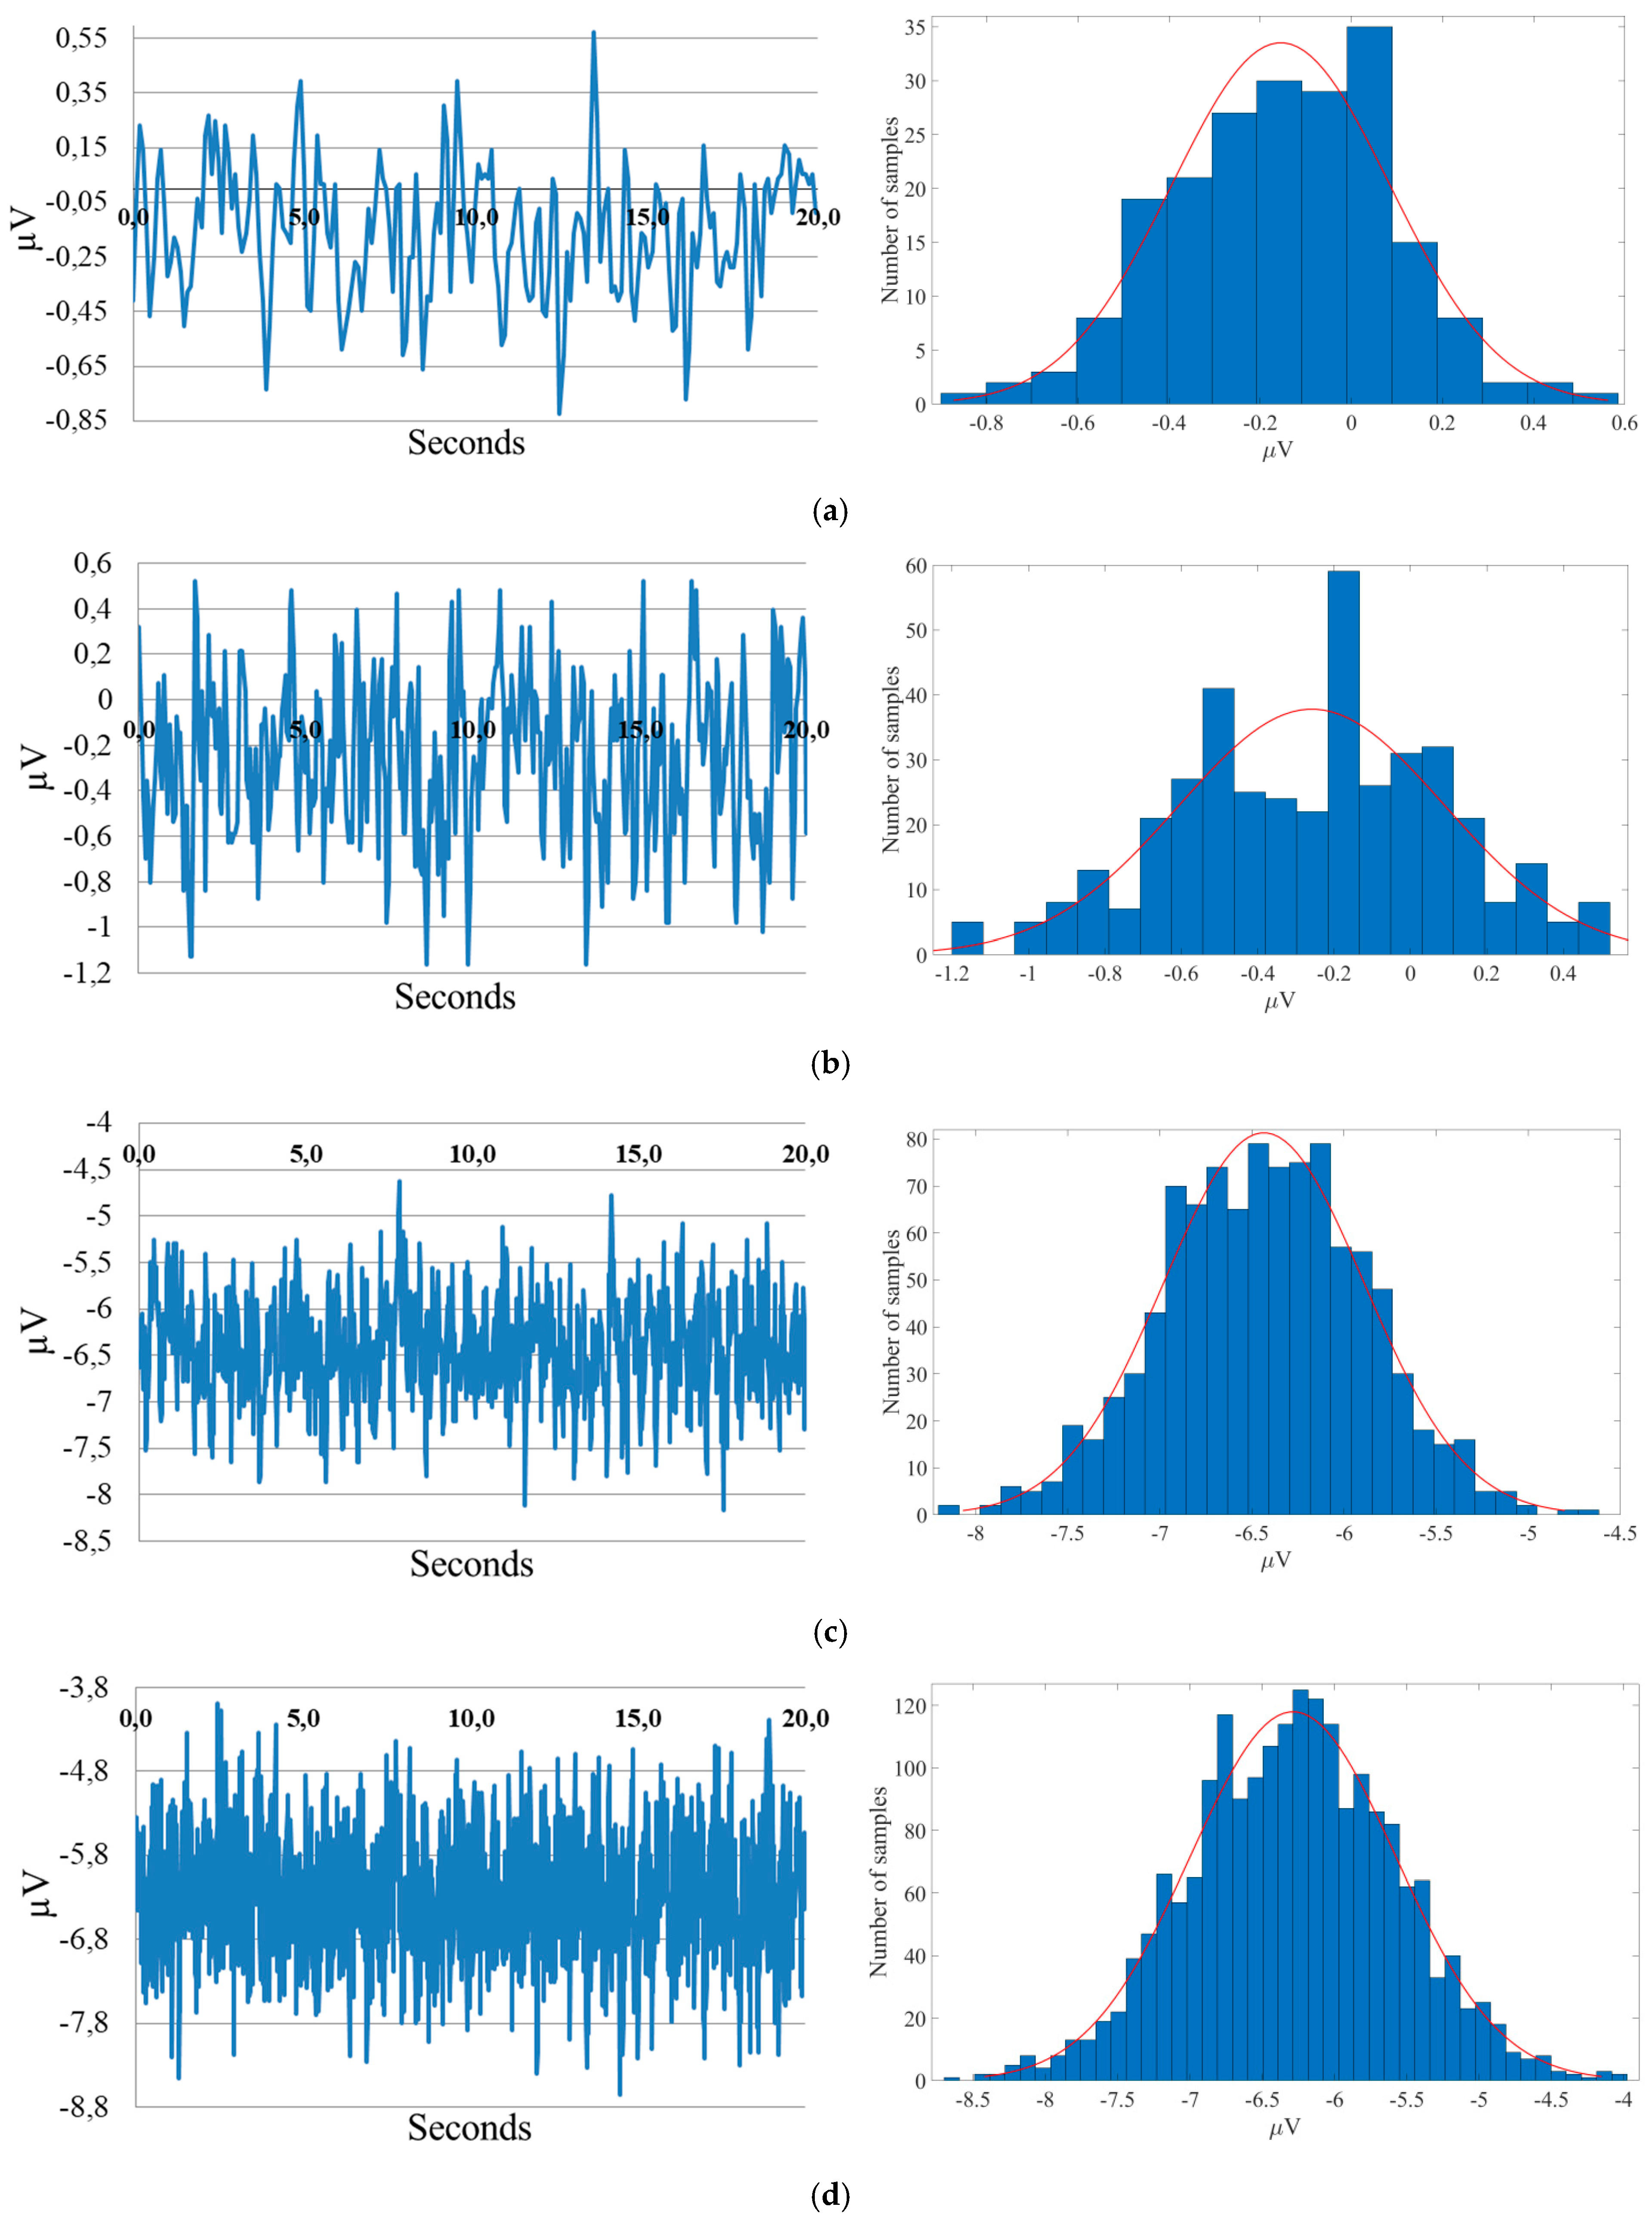
5.1. Resolution of the Analogue to Digital Converter

The measuring system that was designed used an ADuCM360 microcontroller that was equipped with two 24-bit ADC. The effective number of bits (ENOB) specified by the manufacturer [37] depends on the sampling frequency and amplification of the PGA input amplifier. For a gain set to 8 (used in a designed measurement system) and a sampling frequency of 50 Hz the ENOB parameter (stated by the ADuMC360 manufacturer [37]) is 19.0, while for 100 Hz ENOB it is 18.6.
Measurements were taken to determine the actual RMS noise of the analogue to digital converter and the effective number of bits in the designed system. The gain was set to 8 to obtain the measuring range of ±125 mV. A constant voltage, which was obtained from the reference voltage divider (Figure 11), was given on the short-circuited ADC inputs. A series of measurement results were recorded for 20 s at different sampling frequencies. The results of the registration are shown in Figure 12a–d for 10 Hz, 20 Hz, 50 Hz and 100 Hz, respectively. In Figure 12a–d, the waveforms along with their histograms are presented with the following parameters:
  • RMS noise;
  • peak-to-peak voltage Vp-p;
  • average voltage VOFFS;
  • ENOB—this value was determined in the same way as in the producer’s note for the ADuMC360 [37], according to:
    E N O B = l o g 2 ( 2 · I n p u t   R a n g e R M S   N o i s e )
It should be noted that at the sampling frequencies of 10 Hz and 20 Hz, the offset voltage was below 1 µV, while at 50 Hz and 100 Hz, it was about −6 µV. This is because at lower frequencies, the auto-zero mode (Chopper) was activated, while at higher frequencies it was switched off (following the manufacturer instructions [37]). In the datasheet [37], the manufacturer states that with the chopper function disabled, the offset error can be ±12 µV. The obtained value was, therefore, better than the stated one.
Based on the obtained results, it can be concluded that the RMS noise in the designed system was about 10% higher than the RMS noise value that was stated by the manufacturer. The RMS noise value increased in proportion to the square root of the sampling frequency, i.e., the spectral density of the noise was practically constant.

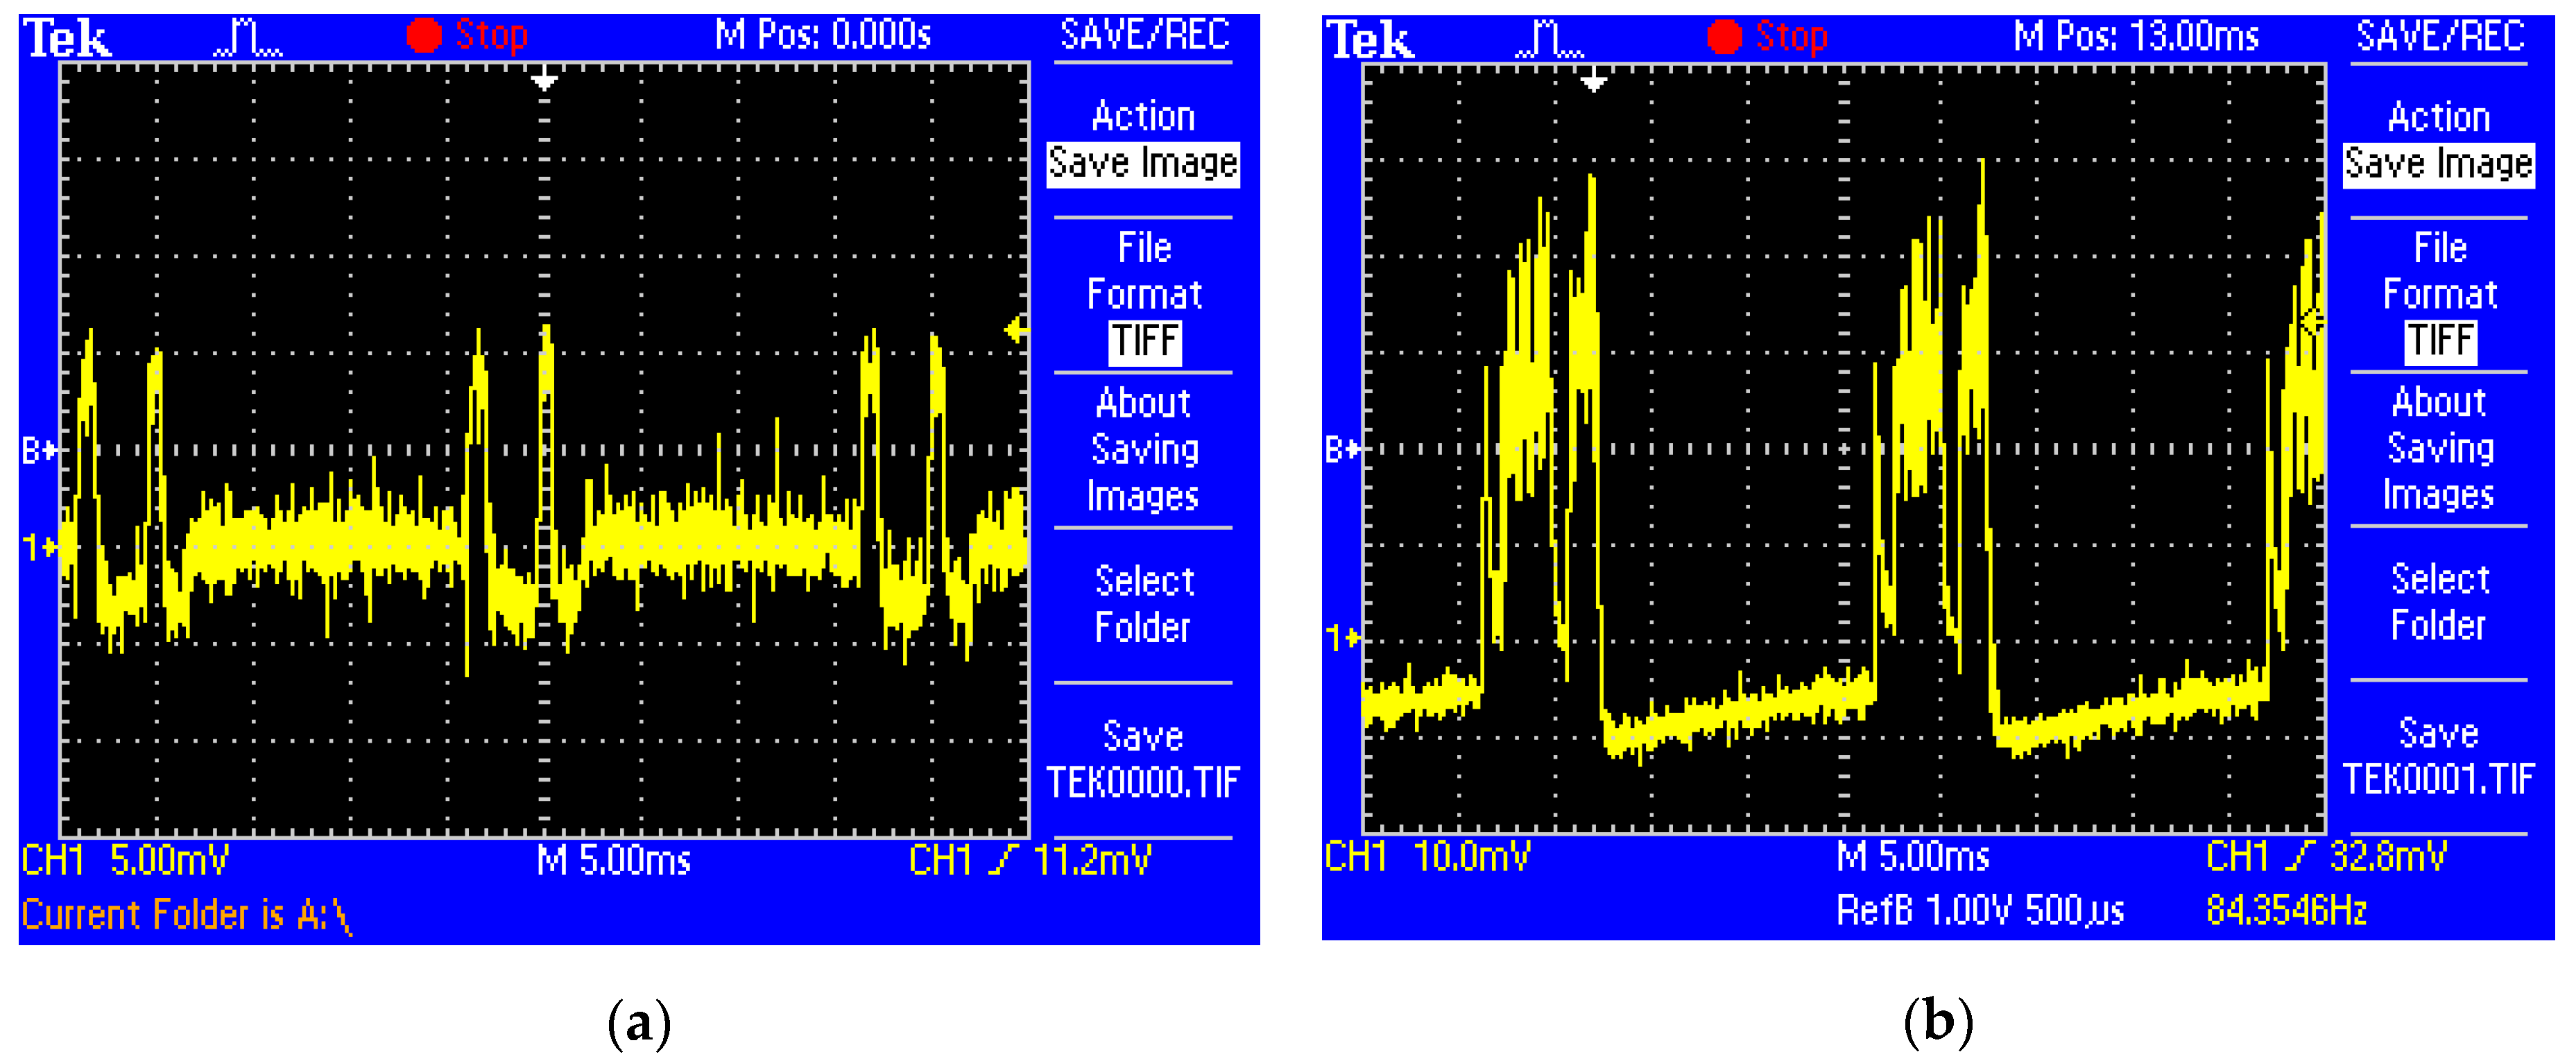
5.2. Impact of the Interference Connected with Data Transmission

The data acquisition system was designed to minimise the impact of any disturbances on the values that were measured. For this purpose, the following were applied:
  • battery power supply;
  • galvanic isolation of the communication interface;
  • the separation of the ground plane for the analogue and digital parts.
However, it is not possible to eliminate one source of disturbances-the digital signal that is connected with the data transmission between the microcontroller UART port and the galvanic isolation system. The other digital circuits such as the UART/USB converter are outside the galvanic barrier.
Interfusing of the disturbances related to data transmission was observed. It was observed that the highest level of interference occurred at the unstabilised voltage-VEE. The system was tested with two different separation systems:
  • separation using a 6N137 optocoupler;
  • separation using an ADuM1201 transformer digital isolator.
The voltage waveforms with the disturbances that were observed at -VEE terminal are shown in Figure 13a,b. The disturbances appeared at the same time as the UART data transmission from the microcontroller to the PC. It should be noted that an optocoupler introduces several (around four) times greater disturbances than a transformer digital isolator. The use of ADuM1201AR introduced a noise at the level of 15 mV and the 6N137 system at the level of 60 mV (Figure 13a,b). This was because in the circuit with the optocoupler, the transmission required switching the current of about 10 mA that controls the LED of the transmitter on and off. The current from the battery power supply caused visible voltage changes. The transformer digital isolator did not generate such large changes in the current during switching. The effect of data transmission on the measurement resolution of the thermopile voltage will be analysed in the next section.

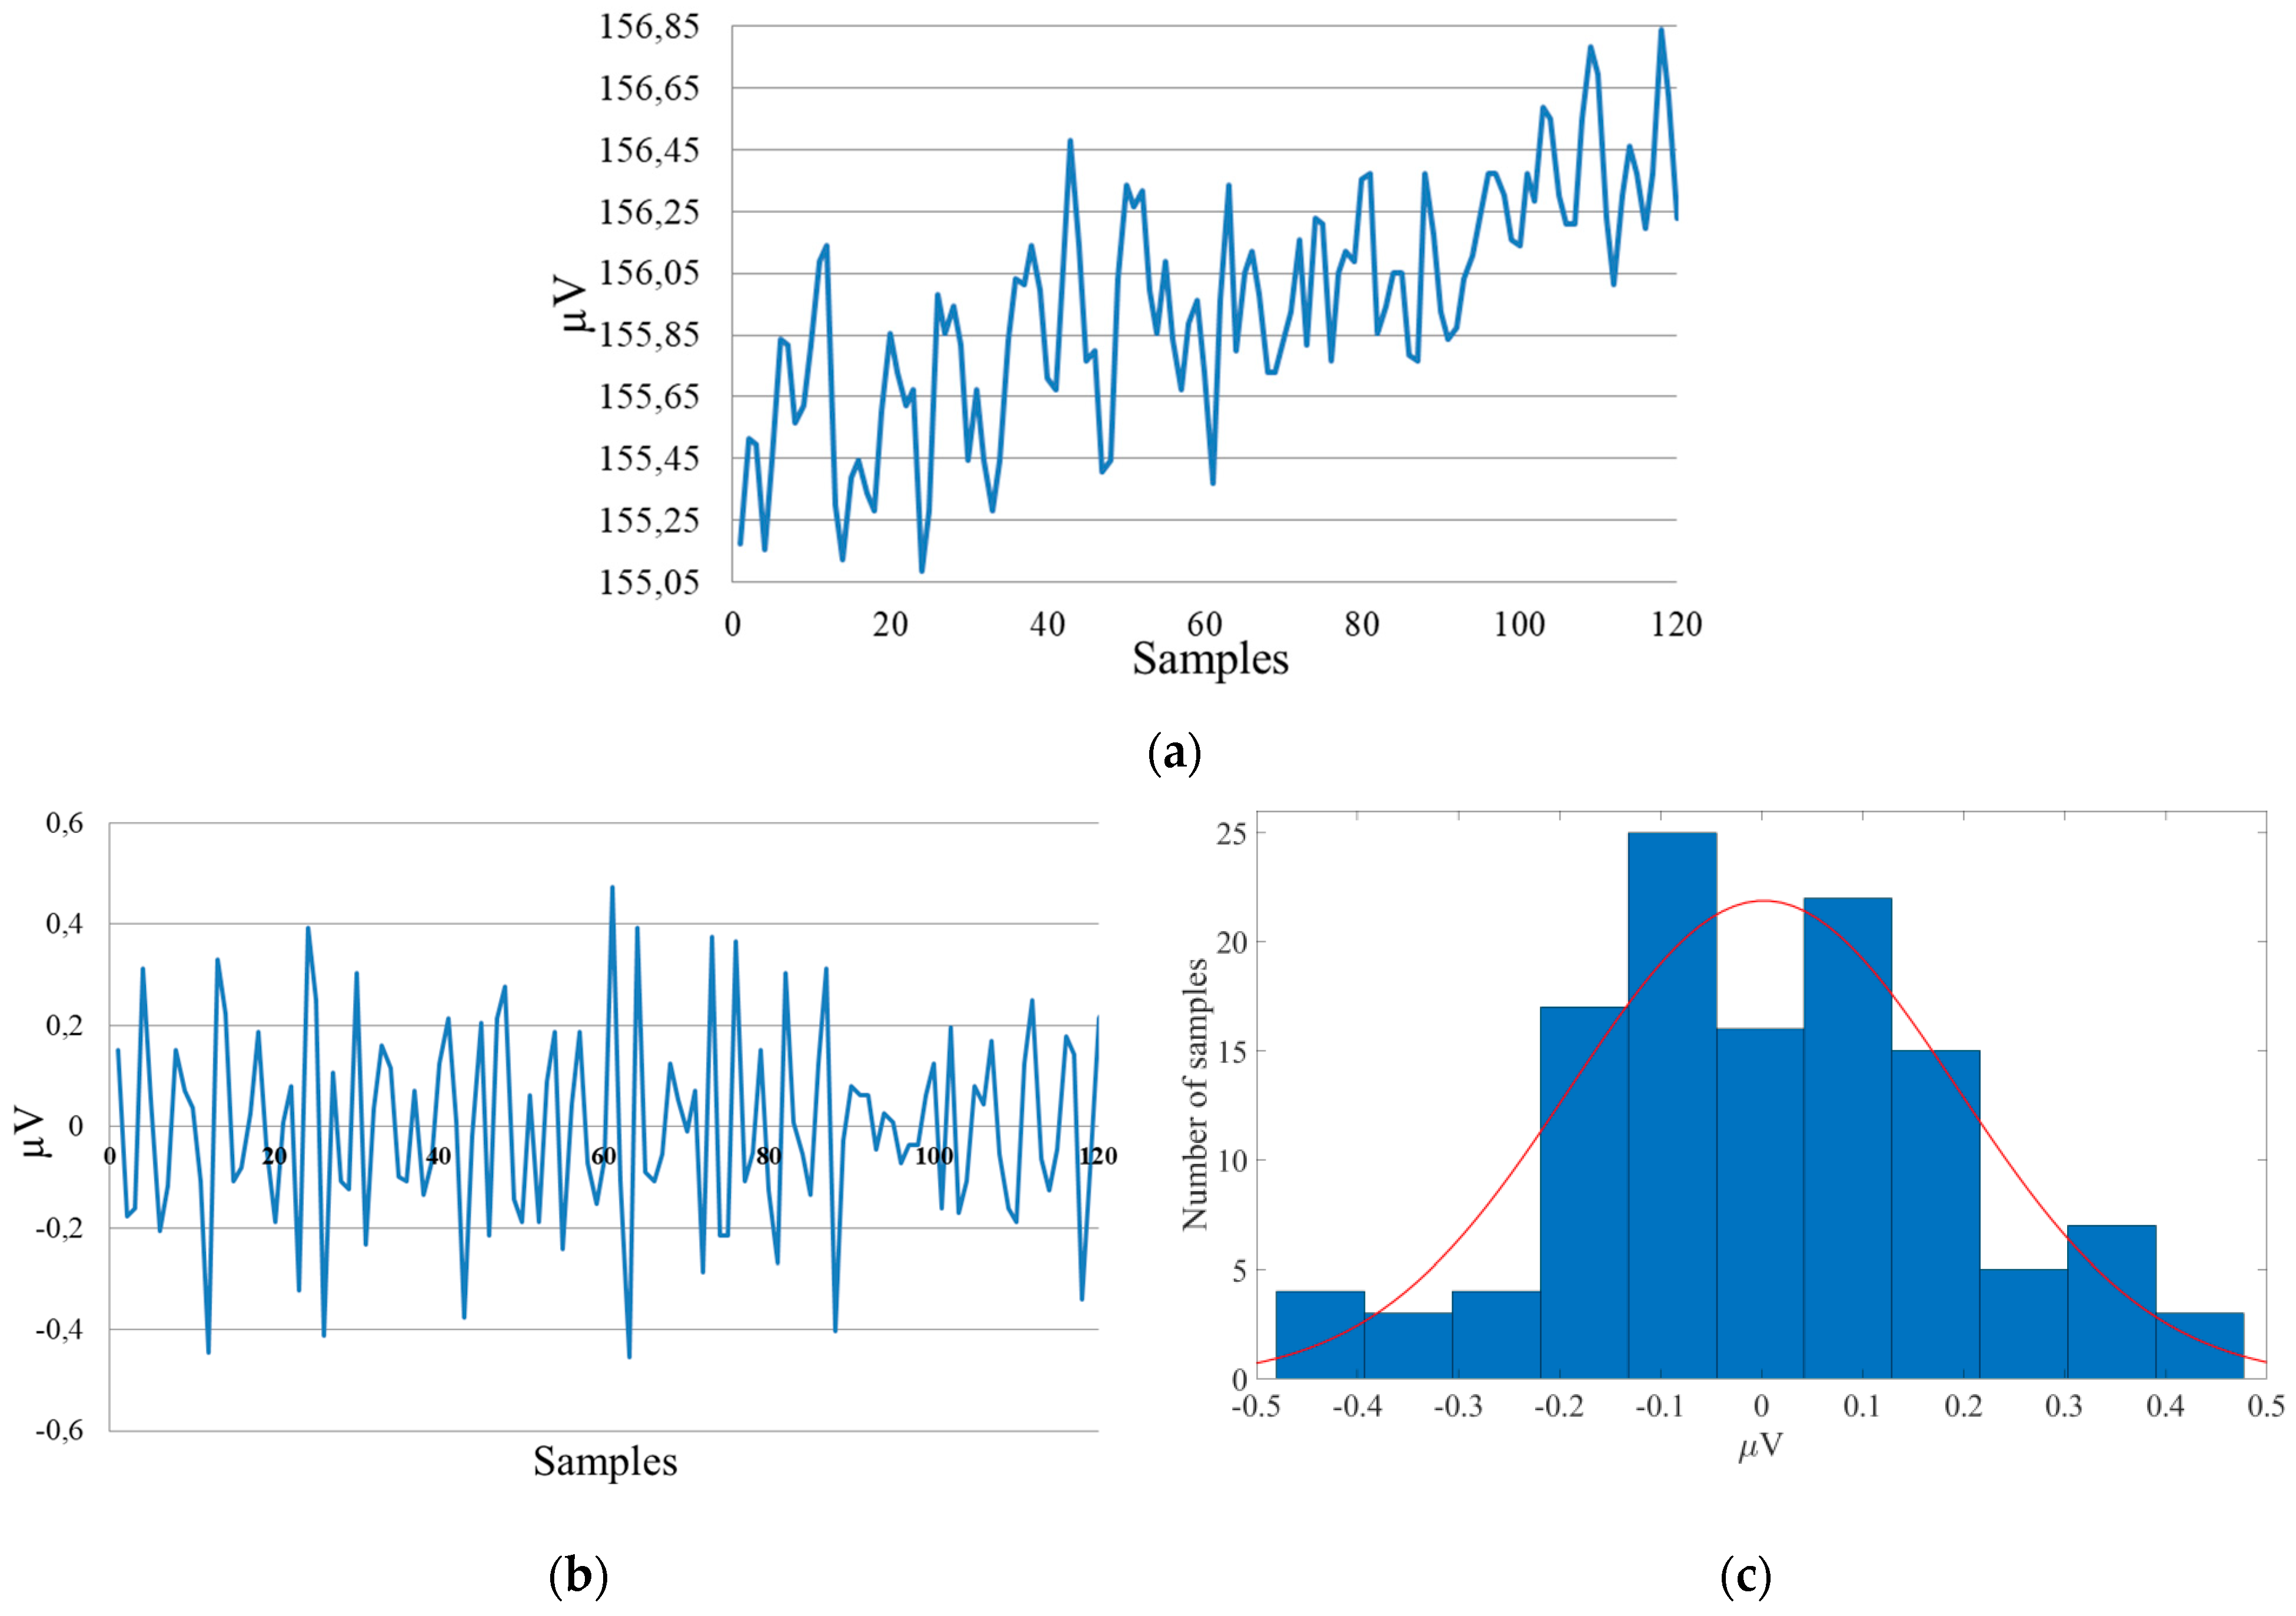
5.3. Evaluation of the Measurement Device Resolution

To assess the resolution of the signal from the thermopile, the microcalorimeter was attached to the measuring system. The voltage on the thermopile was recorded with the heating element switched off and at different sampling frequencies. An example of the voltage waveform on the thermopile is shown in Figure 14. This waveform was characterised by:
  • a constant voltage (in this case, it was around 156 µV);
  • a slow voltage change on the thermopile (drift) at the level of several µV;
  • voltage noise at the thermopile.
The first two effects were related to the thermal phenomena that occurred in the thermopile. The observed voltages correspond to a temperature difference of 3.3 × 10⁻³ °C. An analysis of these phenomena is beyond the scope of this paper.
In order to estimate the noise level of the measurement system with the thermopile, the slow-changing trend in waveform was subtracted from the waveform that was originally registered. For the measurement system, the following parameters were determined:
  • RMS noise;
  • peak-to-peak voltage Vp-p;
  • the ENOB.
The waveforms were recorded in the following system configuration:
  • measurements with the simultaneous transmission of data through the optocoupler isolator (6N137);
  • measurements with the simultaneous transmission of data through the transformer digital isolator (ADuM1201AR);
  • with the data transmission disabled (the data were collected in the microcontroller memory and then transmitted to the computer).
The results are shown in Table 2. An analysis of the results that is presented in Table 2 leads to the following conclusions:
  • the noise that was measured in the system that included the microcalorimeter (Table 2) was higher than the noise of the system with only the analogue to digital converter with shorted inputs (Figure 12a–d);
  • identically, in both cases (for the analogue to digital converter with shorted inputs (Figure 12a–d) and with a microcalorimeter system configuration (Table 2)), the effective value of the noise increased in proportion to the square root of the sampling frequency;
  • Galvanic isolation with the transformer digital isolator gave slightly less voltage noise than the optocoupler solution (Table 2);
  • turning off the digital transmission only slightly improved the resolution.
Based on the peak-to-peak noise value, the temperature measurement resolution was estimated at 2.6 × 10⁻⁵ °C with a sampling rate of 10 Hz up to 6.2 × 10⁻⁵ °C with a sampling frequency of 100 Hz.
In the case of using the active calorimetry system [33], the heat flow that is generated in a liquid sample (e.g., due to a chemical reaction) that is placed on a microcalorimeter membrane is measured. The sensitivity of the microcalorimetry sensor that is given by the manufacturer [20] is between 1.2 and 2.4 V/W. The power measurement resolution is therefore 1.2 µW at a sampling frequency of 10 Hz and 2.8 µW at a sampling rate of 100 Hz.

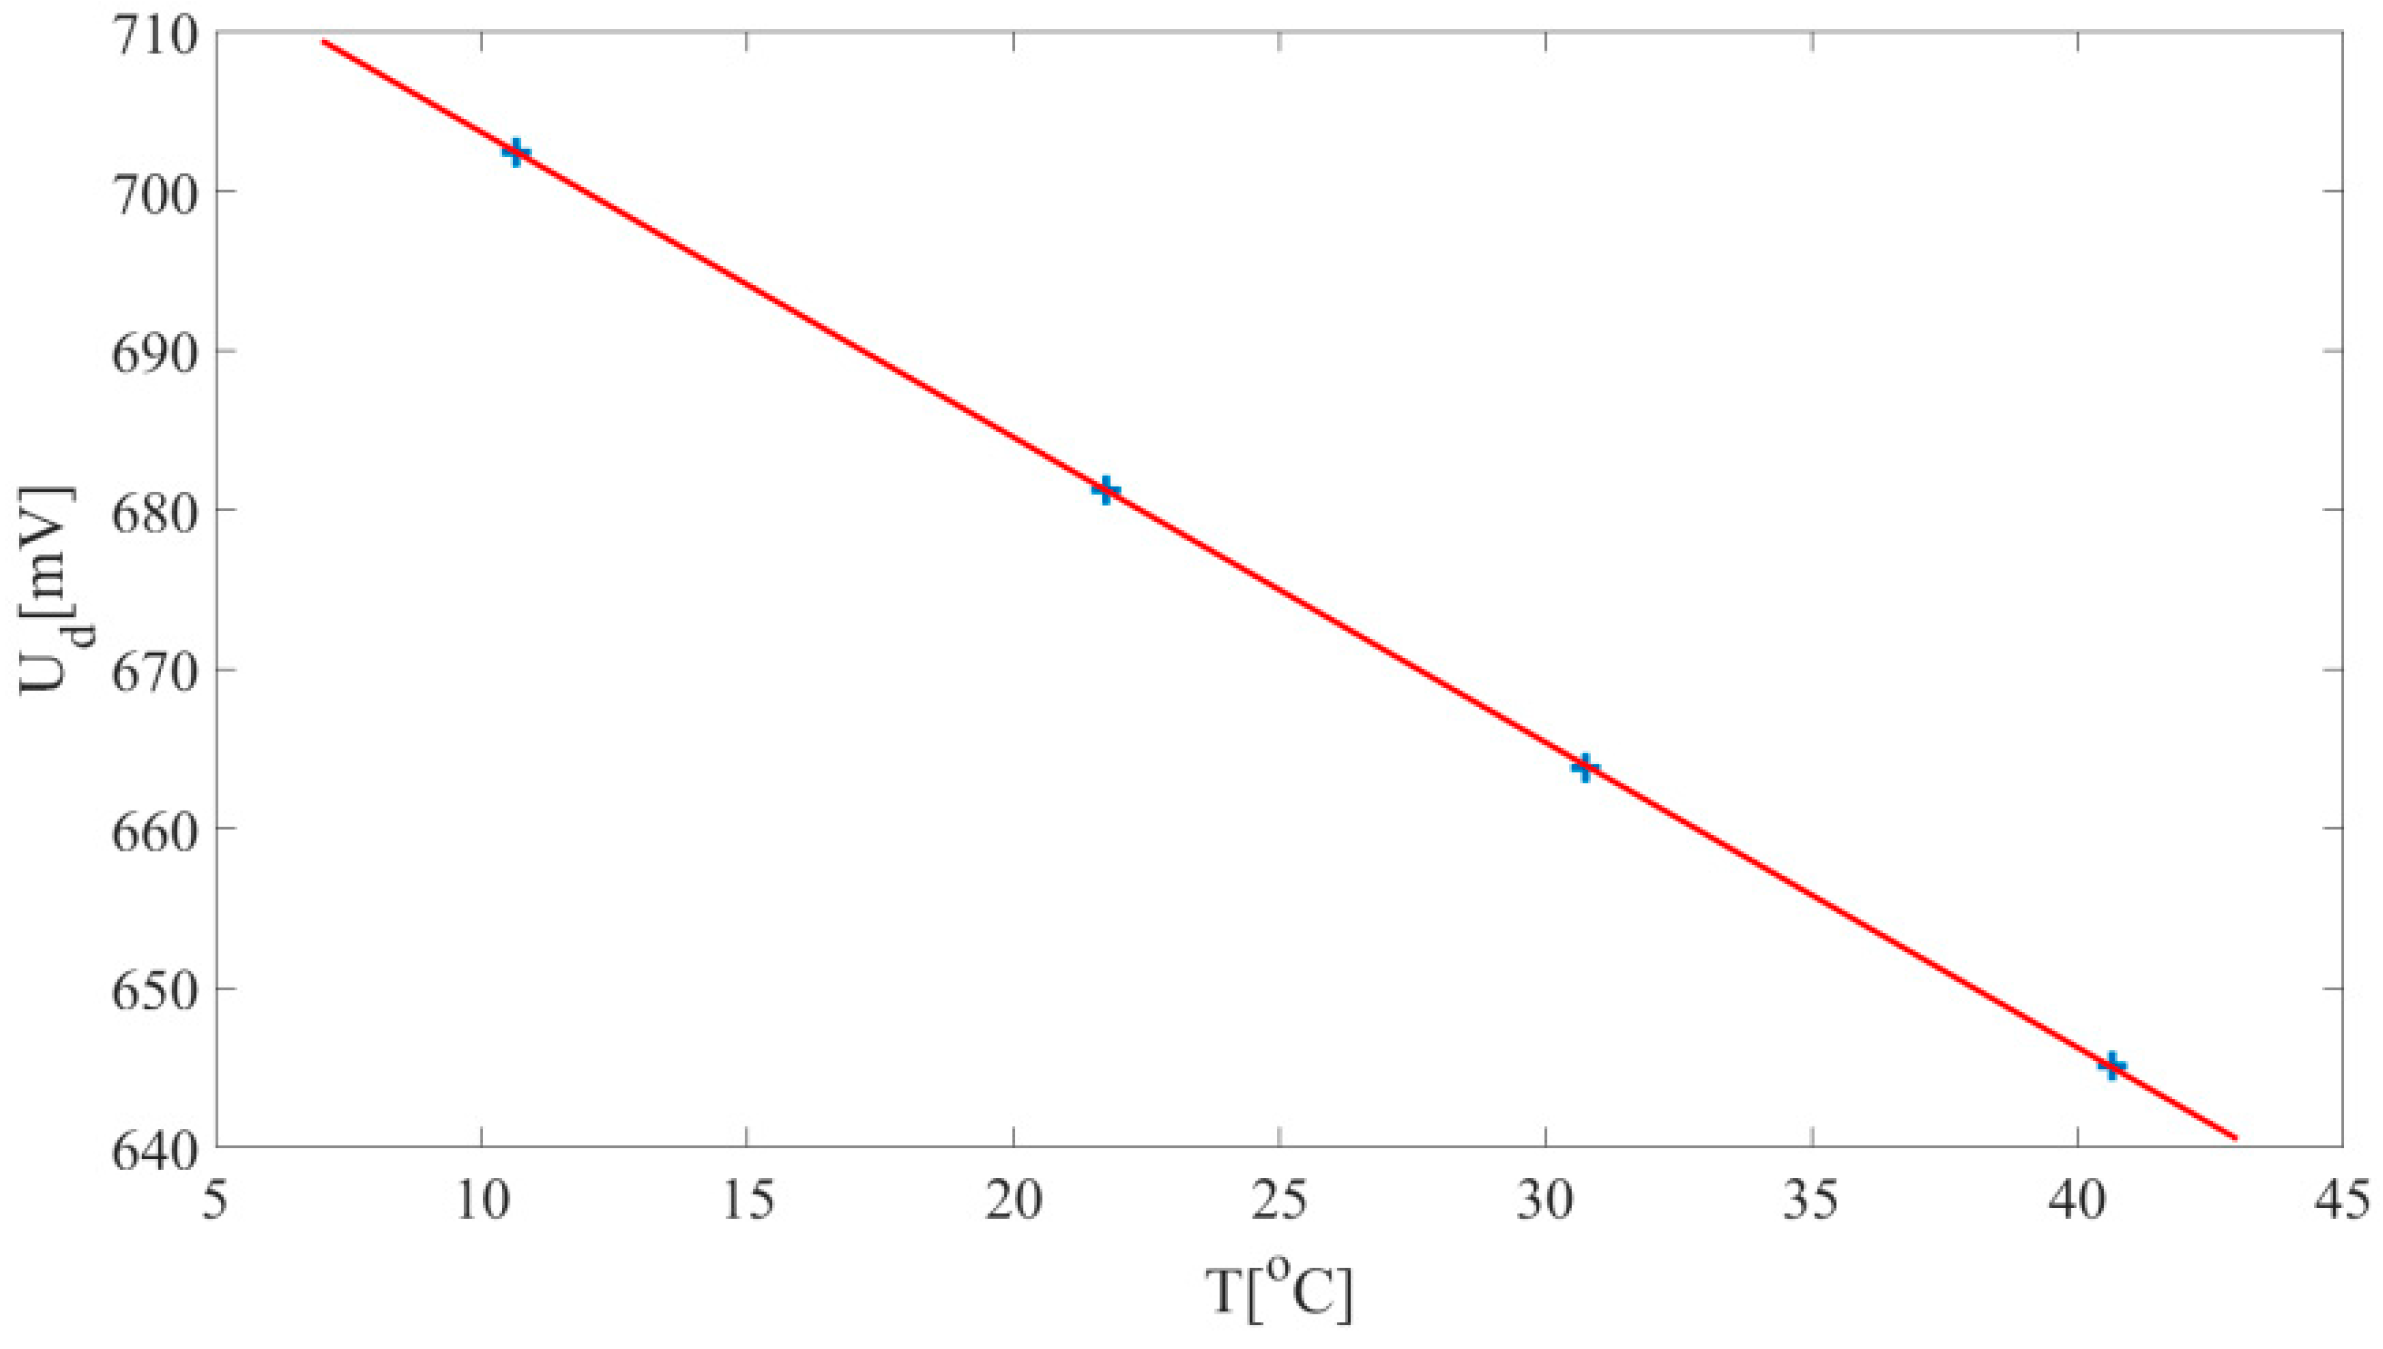
5.4. Diode Temperature Sensor Properties

In order to evaluate the properties of the diode temperature sensor, the microcalorimeter was tested in a climatic chamber. The voltage-temperature characteristics of a selected piece of XEN-NCM9924 microcalorimeter is presented in Figure 15. A good linearity of the characteristics can be observed. The temperature coefficient that was obtained from these characteristics was −1.9132 mV/°C, which is typical for silicon pn junctions. However, for three different pieces of the XEN-NCM9924, the voltage that was measured at the same ambient temperature varried from 644 mV to 662 mV. The voltage change corresponded to about a 10 °C temperature change. This leads to the conclusion that each piece of the microcalorimeter should be individualy calibrated using a reference thermometer.

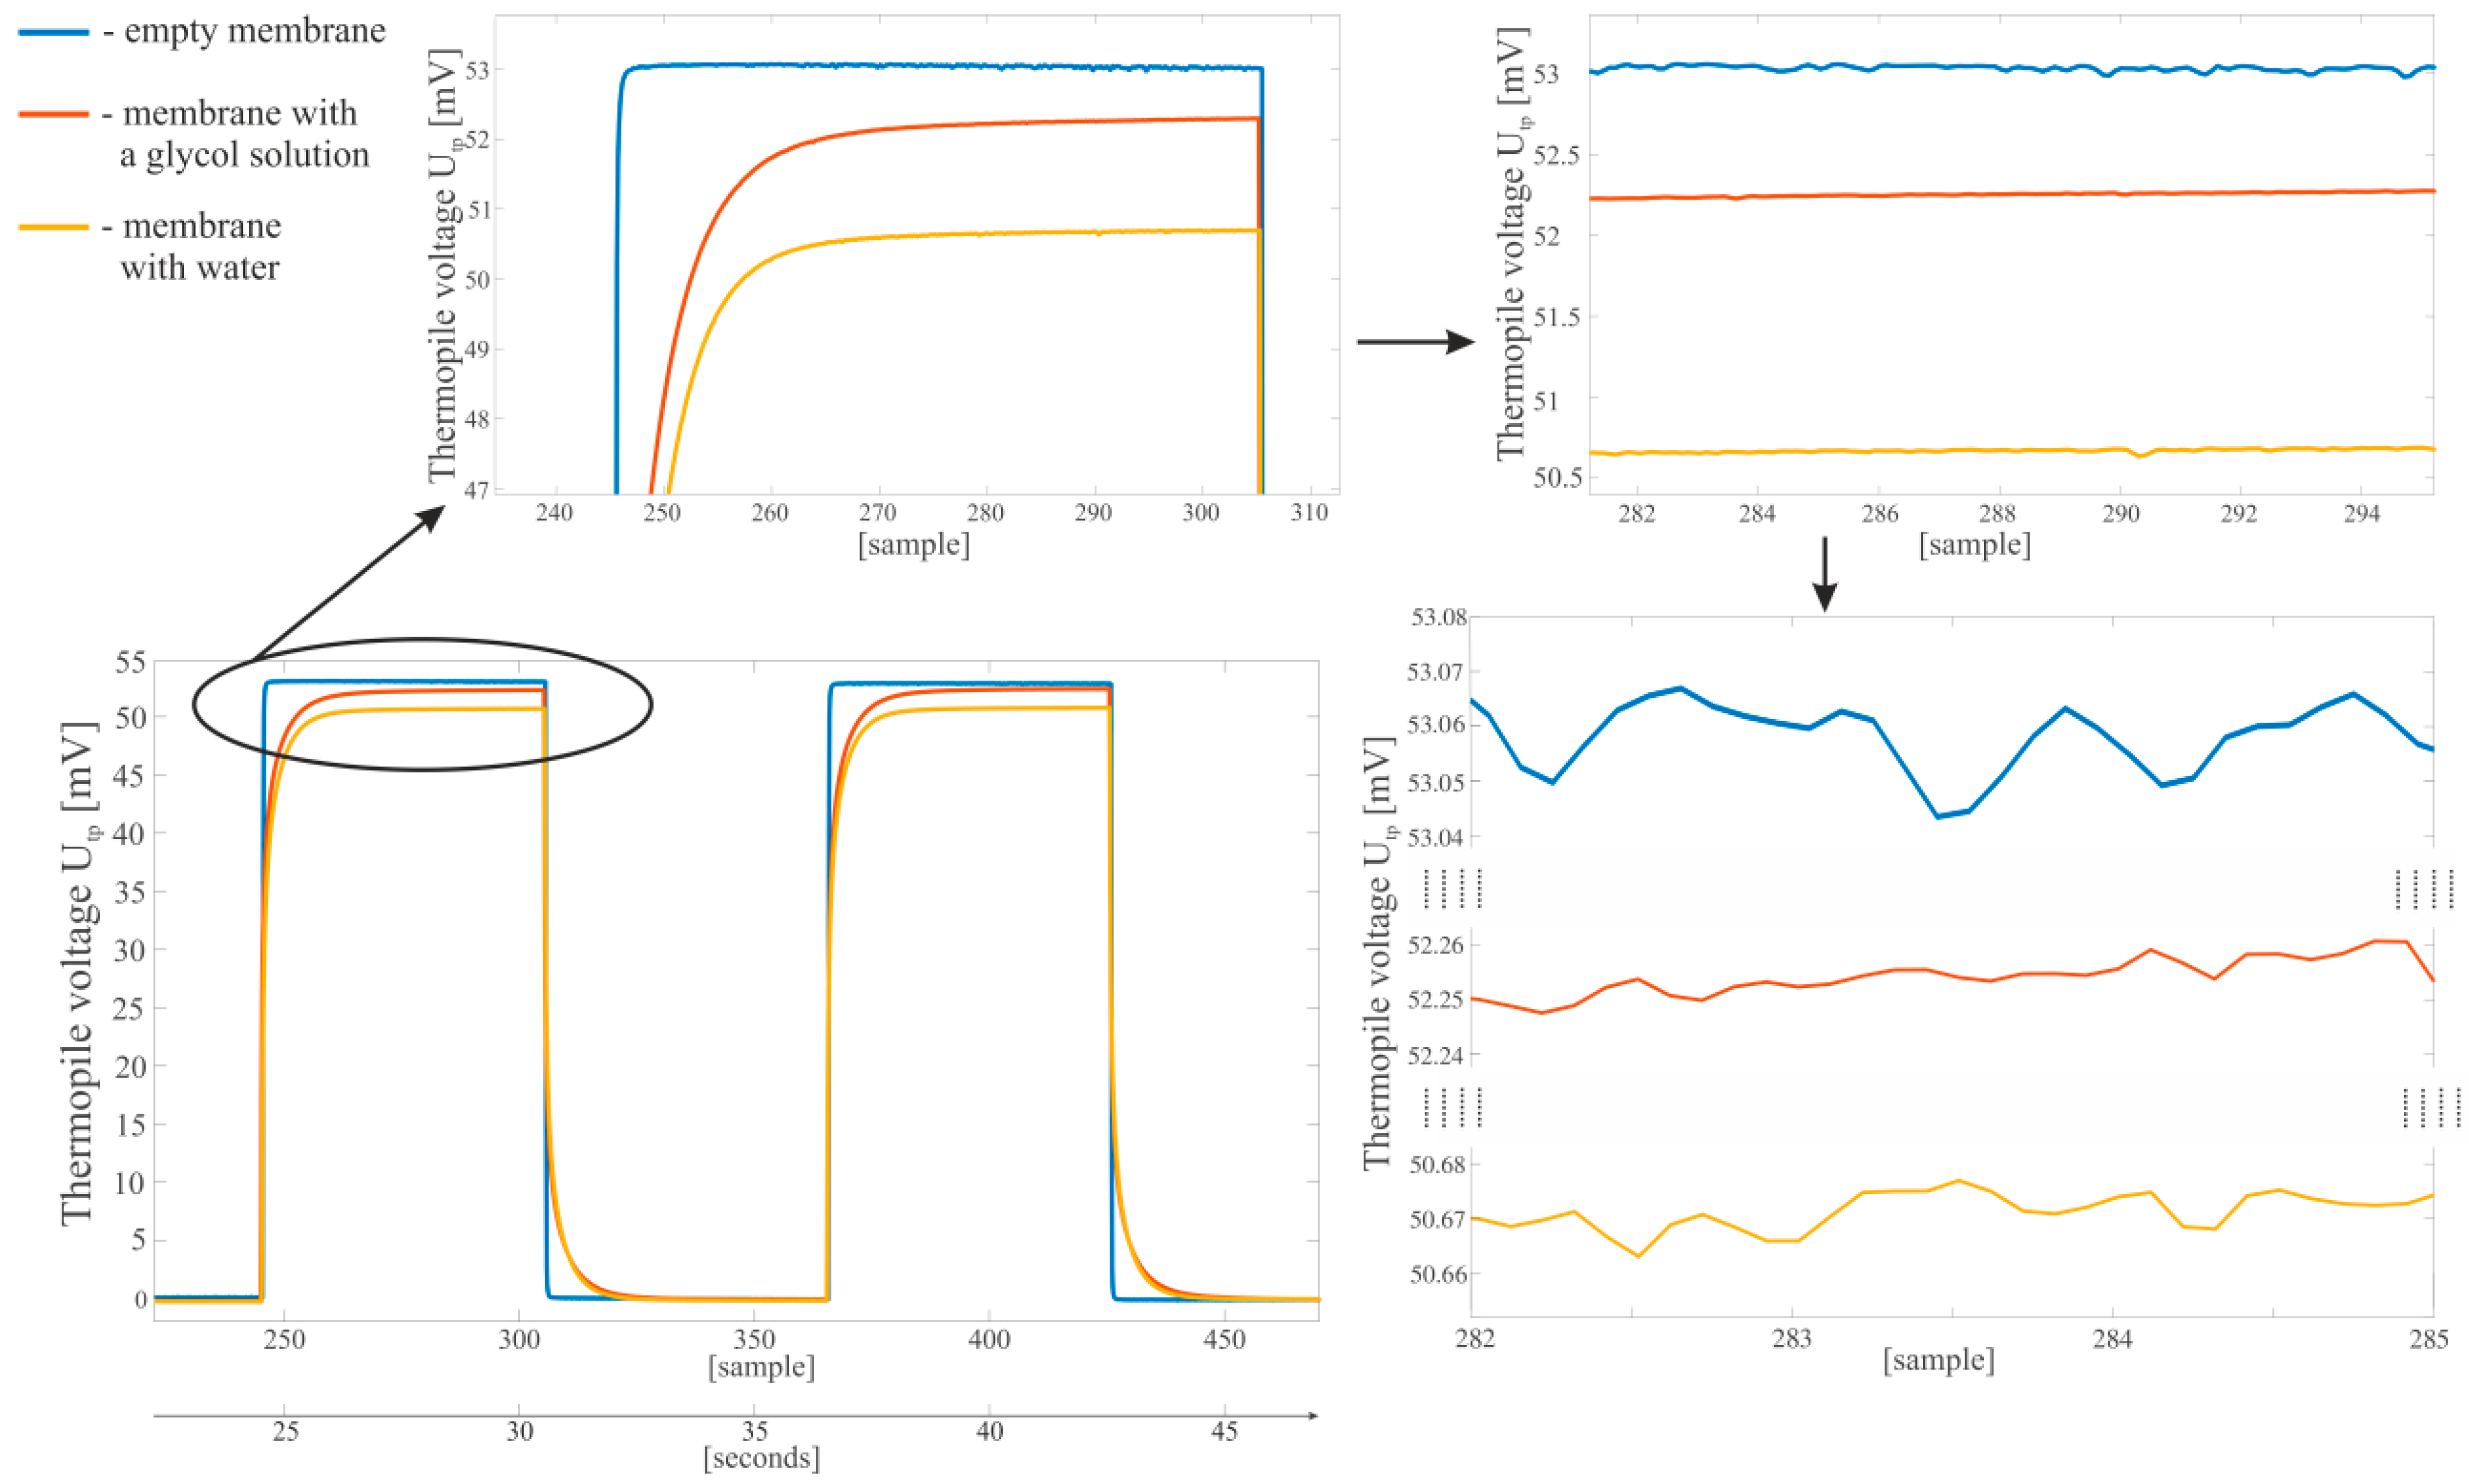
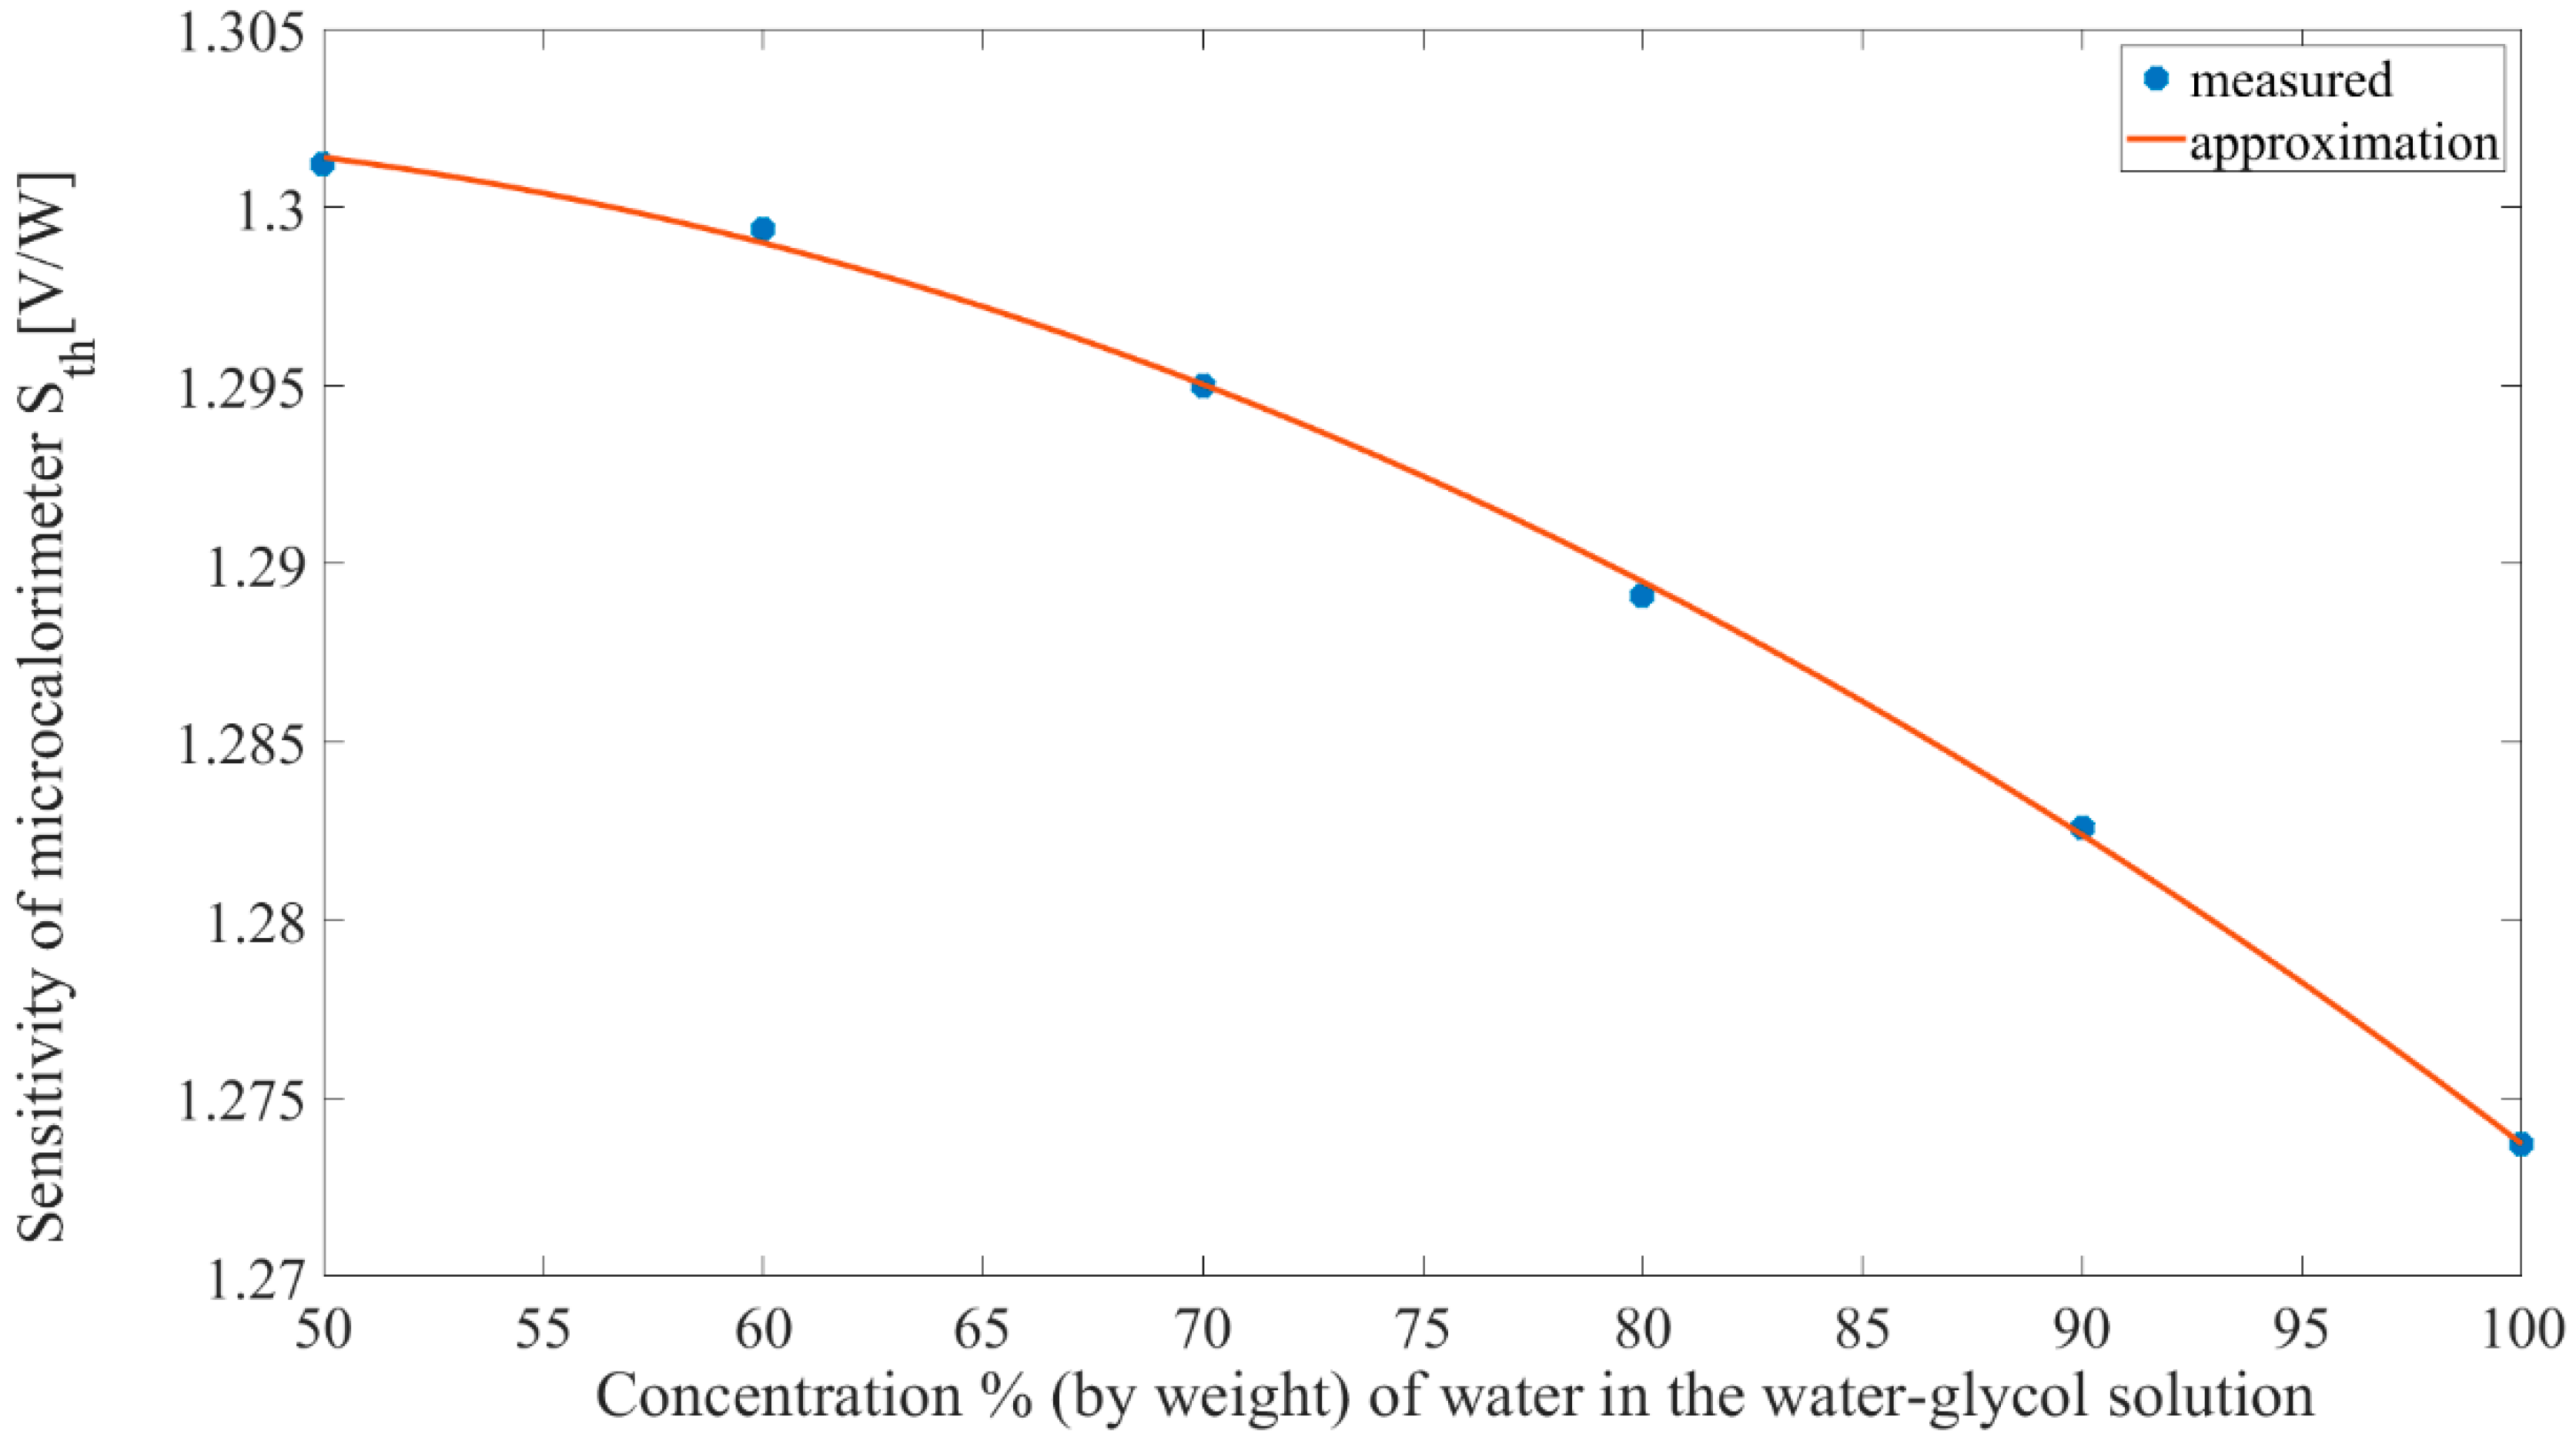
6. Examples of Application

A microcalorimeter can be used to determine the thermal properties of a liquid sample, which is placed on the central area of the membrane. By applying a step change in the heating power, the temperature response that is measured by the thermopile can be observed. Based on the characteristics of the response such as amplitude, rate of the increase, time constants etc., specific material properties (e.g., specific heat) can be determined. Figure 16 shows an example of the records of the response of a microcalorimeter to the heating power of a square wave. The waveforms were recorded with an XEN-NCM9924 microcalorimeter with an empty membrane as well as one with a 10 µL drop of distilled water and a 10 µL drop of a propylene glycol-water solution. Since the thermal capacities of water and glycol samples are different, differences in the time domain responses can be observed (Figure 16).
Figure 17 shows the response of a microcalorimeter to a sine wave excitation, which is typical for AC calorimetry [33]. The heater is powered by a sinusoidal waveform as described in Section 4.4.3c. Since the voltage on the thermopile is shifted in phases compared to the heater power, it is possible to determine the thermal properties of the sample [33].
The next example presents the application of the system for heat flow calorimetry in steady state conditions. A 10 µL drop of a propylene glycol-water solution was placed on the membrane while the heater was powered. At the steady-state some heat is transferred from the sample to the environment by convection and this also affects the sensitivity of the calorimeter Sth. Since the convective heat transfer between the glycol-water sample and the environment depends on the glycol content, the sensitivity of the calorimeter Sth can be used in the determination of propylene glycol concentration as shown in Figure 18.
Further analysis of the measurement data (Figure 16, Figure 17 and Figure 18) and the methods that can be used to determine the thermal properties of liquid samples will be the subject of future works.

7. Conclusions

The device described in the article enables the acquisition of measurement data in microcalorimetry. Basically, the device is dedicated to the XEN-NCM9924 microcalorimeter model but can easily be adapted to other types of microcalorimeter sensors. The project is a developmental solution from both the hardware and software sides. It is possible to connect additional measurement sensors, memory modules, external analogue to digital and digital to analogue converters, user interfaces and communication modules.
The ADuCM360 microcontroller provides 128 kB of Flash memory for the program, while the current version of the firmware requires about 12 kB. The mainboard is equipped with a standard programming interface SWD with the possibility to debug. Adding new functions and operating modes to the project is simple and fast.
Some recommendations can be made regarding the design of the data acquisition systems for the semiconductor sensors. The main problem that should be addressed during the design is the presence of any interactions between the modules that are included in the system on a chip (e.g., thermopile, heaters, diode temperature sensor). Not only must the differential voltage between the ends of the thermopile be considered but also the common mode voltage with which the measured signal will appear. The occurrence of a common mode voltage outside the range that is acceptable by the analogue to digital converter will result in incorrect measurements or even the lack of a measurement. The recommendations and good practices described in this paper allowed to design a portable voltage measuring device with a µV precision.
It has been shown that the correctness of the temperature measurement depends on the method by which the heating element is fed. It was also shown that some elements cannot work simultaneously in a commercial XEN-NCM9924 microcalorimeter. Therefore, it is necessary to use a commutation circuit that cuts off specified elements in certain states of the measurement device.
It was also observed that an important factor that affects the noise and measurement resolution in the device is the method that is used to transmit the digital data. Since it is not possible to disable the data transmission completely, the transmission system should be designed in such a way that the disturbances that it introduces are as small as possible. It was also shown that the transformer galvanic isolation system disturbs the measured signals to a lesser extent than a circuit that is based on an optocoupler.
The measurement device that was created and that is presented in the article will be used to test the properties of liquid samples as well as for testing chemical and biological processes.

Author Contributions

Conceptualisation A.M. and K.B.; Methodology A.M. and K.B.; Software A.M. and P.S.; Validation A.M., K.B., P.S. and D.C.; Formal analyses A.M. and K.B.; Investigation A.M. and K.B.; Resources A.M. and K.B.; Writing—original draft preparation A.M and K.B.; Writing—review and editing A.M., K.B., P.S.; Visualisation A.M. and K.B.; Supervision A.M. and K.B.; Funding acquisition A.M., K.B., P.S. and D.C.

Funding

This research was partially supported by the Polish Ministry of Science and Higher Education funding for the statutory activities of the Silesian University of Technology. Project “Development and implementation of innovative technology intensification of the combustion of solid fuels” co-financed by the Polish National Centre for Research and Development, national program–R&D works and commercialization of R&D–Regional Scientific and Research Agendas/2017 (contract no. POIR.04.01.02-00.068/17-00).

Acknowledgments

The calculations were performed using the IT infrastructure that was funded by the GeCONiI project (POIG.02.03.01-24-099/13).

Conflicts of Interest

The authors declare no conflicts of interest.

References

  1. Malcher, A.; Pietraszek, S.; Przybyła, T. Hybrid QRS detection circuit based on dynamic reconfigurable field programmable analog array. IFAC Proc. Vol. 2010, 43, 48–53. [Google Scholar] [CrossRef]
  2. Al-Naseem, O.; El-Sayed, M. Analysis of electrical and non-electrical causes of variable frequency drive failures. In Proceedings of the 9th IEEE International Symposium on Diagnostics for Electric Machines, Power Electronics and Drives (SDEMPED), Valencia, Spain, 27–30 August 2013; pp. 221–226. [Google Scholar]
  3. Falkowski, P.; Malcher, A. Audio signal processing based on dynamically programmable analog arrays. In Proceedings of the International Conference on Signal and Electronic Circuits (ICSES), Gliwice, Poland, 7–10 September 2010; pp. 29–32. [Google Scholar]
  4. Kasprzyk, J.; Krauze, P.; Budzan, S.; Rzepecki, J. Vibration control in semi-active suspension of the experimental off-road vehicle using information about suspension deflection. Arch. Control Sci. 2017, 27, 251–261. [Google Scholar] [CrossRef]
  5. Krauze, P.; Kasprzyk, J.; Kozyra, A.; Rzepecki, J. Experimental analysis of vibration control algorithms applied for an off-road vehicle with magnetorheological dampers. J. Low Freq. Noise Vib. Act. Control 2018, 37, 619–639. [Google Scholar] [CrossRef] [Green Version]
  6. Mazur, K.; Wrona, S.; Pawelczyk, M. Active noise control for a washing machine. Appl. Acoust. 2019, 146, 89–95. [Google Scholar] [CrossRef]
  7. Chraponska, A.; Wrona, S.; Rzepecki, J.; Mazur, K.; Pawelczyk, M. Active structural acoustic control of an active casing placed in a corner. Appl. Sci. 2019, 9, 1059. [Google Scholar] [CrossRef]
  8. Popowicz, A.; Malcher, A.; Bernacki, K.; Fietkiewicz, K. A Passive FPAA-Based RF Scatter Meteor Detector. Publ. Astron. Soc. Pac. 2015, 127, 152–160. [Google Scholar] [CrossRef] [Green Version]
  9. Popowicz, A. Analysis of dark current in BRITE nanostellite CCD sensors. Sensors 2018, 18, 479. [Google Scholar] [CrossRef]
  10. Oliwa, W.; Wieczorek, G. Fast and accurate frequency meter using the interpolated DFT method. Elektron. Elektrotechnika 2017, 23, 43–46. [Google Scholar] [CrossRef]
  11. Enchev, G.; Djagarov, N.; Grozdev, Z. Plug and play system for monitoring of electrical and non-electrical data. In Proceedings of the 20th International Symposium on Electrical Apparatus and Technologies (SIELA), Bourgas, Bulgaria, 3–6 June 2018; pp. 1–5. [Google Scholar]
  12. Mariana, F.; Buchholz, F.; Lerchner, J.; Neu, T.R.; Harms, H.; Maskow, T. Chip-calorimetric monitoring of biofilm eradication with antibiotics provides mechanistic information. Int. J. Med Microbiol. 2013, 303, 158–165. [Google Scholar] [CrossRef]
  13. Yi, F.; La Van, D. Nanoscale thermal analysis for nanomedicine by nanocalorimetry. Wiley Interdiscip. Rev. Nanomed. Nanobiotechnol. 2012, 4, 31–41. [Google Scholar] [CrossRef]
  14. Maskow, T.; Paufler, S. What does calorimetry and thermodynamics of living cells tell us? Methods 2015, 76, 3–10. [Google Scholar] [CrossRef] [PubMed]
  15. Gaddes, D.; Demirel, M.; Reeves, W.; Tadigadapa, S. Remote calorimetric detection of urea via flow injection analysis. Analyst 2015, 140, 8033–8040. [Google Scholar] [CrossRef] [PubMed] [Green Version]
  16. Braissant, O.; Wirz, D.; Göpfert, B.; Daniels, A. Biomedical use of isothermal microcalorimeters. Sensors 2010, 10, 9369–9383. [Google Scholar] [CrossRef] [PubMed]
  17. Toda, A.; Taguchi, K.; Nozaki, K. Fast limiting behavior of the melting kinetics of polyethylene crystals examined by fast-scan calorimetry. Thermochim. Acta 2019, 677, 211–216. [Google Scholar] [CrossRef]
  18. Abdelaziz, A.; Zaitsau, D.; Buzyurov, A.; Minakov, A.; Verevkin, S.; Schick, C. Fast scanning calorimetry: Sublimation thermodynamics of low volatile and thermally unstable compounds. Thermochim. Acta 2019, 676, 249–262. [Google Scholar] [CrossRef]
  19. Thomas, D.; Zhuravlev, Z.; Wurm, A.; Schick, C.; Cebe, P. Fundamental thermal properties of polyvinyl alcohol by fast scanning calorimetry. Polymer 2018, 137, 145–155. [Google Scholar] [CrossRef]
  20. Xensor Integration Webpage. Available online: http://www.xensor.nl/pdffiles/sheets/nanoliq.pdf (accessed on 9 September 2019).
  21. Choiński, D.; Wodołażski, A.; Skupin, P.; Stachańczyk, D.; Niedźwieź, M. Analysis of the thermal properties of a heat flow chip calorimeter using CFD. Appl. Therm. Eng. 2016, 96, 508–518. [Google Scholar] [CrossRef]
  22. Padovani, R.; Lehnert, T.; Gijs, M. A microcalorimetric platform for studying the heat produced by chemical reactions in microliter volumes. In Proceedings of the 19th International Conference on Miniaturized Systems for Chemistry and Life Sciences, Gyeongju, Korea, 25–29 October 2015; pp. 1861–1863. [Google Scholar]
  23. Kłopot, T.; Choinski, D.; Skupin, P.; Szczypka, D. Metamorphic controller for collaborative design of an optimal structure of the control system. In Proceedings of the International Conference on Cooperative Design, Visualization and Engineering, Lecture Notes in Computer Science, Seattle, WA, USA, 14–17 September 2014; pp. 230–237. [Google Scholar]
  24. Padovani, R.; Lehnert, T.; Trouillon, R.; Gijs, M. Nanocalorimetric platform for accurate thermochemical studies in microliter volumes. RSC Adv. 2015, 5, 97133–97142. [Google Scholar] [CrossRef]
  25. Lerchner, J.; Maskow, T.; Wolf, G. Chip calorimetry and its use for biochemical and cell biological investigations. Chem. Eng. Process. 2008, 47, 991–999. [Google Scholar] [CrossRef]
  26. Choiński, D.; Niedźwieź, M. From micro-scale reactors to macro-scale process control: Potential use of chip calorimetry. In Proceedings of the 18th International Conference on Methods & Models in Automation & Robotics (MMAR), Międzyzdroje, Poland, 26–29 August 2013; pp. 639–644. [Google Scholar]
  27. Carreto-Vazquez, V.H.; Liu, Y.S.; Bukur, D.B.; Mannan, M.S. Chip-scale calorimeters: Potential uses in chemical engineering. J. Loss Prev. Process Ind. 2011, 24, 34–42. [Google Scholar] [CrossRef]
  28. Parr, G.; Santagata-Iervolino, E.; van Herwaarden, A.; Wien, W.; Vellekoop, M. Thermal characterization of microliter amounts of liquids by a micromachined calorimetric transducer. In Proceedings of the IEEE 22nd International Conference on Micro Electro Mechanical Systems, Sorrento, Italy, 25–29 January 2009; pp. 535–538. [Google Scholar]
  29. Herwaarden, S.V.; Iervolino, E.; van Herwaarden, F.; Wijffels, T.; Leenaers, A.; Mathot, V. Design, performance and analysis of thermal lag of the UFS1 twin-calorimeter chip for fast scanning calorimetry using the Mettler-Toledo Flash DSC 1. Thermochim. Acta 2011, 522, 46–52. [Google Scholar] [CrossRef]
  30. Yuan, M.; Yu, J.; Cao, H.; Xu, F. Effective improvement in performance of a miniature FIA-calorimetric biosensing system via denoising column addition and flow rate optimization. Sens. Actuators B Chem. 2016, 229, 492–498. [Google Scholar] [CrossRef]
  31. van Herwaardena, S. Micro-sensors for Analysis Equipment: Research and Innovation. In Proceedings of the Eurosensor XXIV Conference, Linz, Austria, 5–8 September 2010; pp. 464–467. [Google Scholar]
  32. Padovani, R. Thermal Microsensors for in Vitro and in Vivo Monitoring of Chemical and Biological Processes. Ph.D. Thesis, École Polytechnique Fédérale de Lausanne (EPFL), Lausanne, Switzerland, 2016. [Google Scholar]
  33. Schick, C.; Mathot, V. Fast Scanning Calorimetry, Christoph Schick, 1st ed.; Springer International Publishing AG: Cham, Switzerland, 2016. [Google Scholar]
  34. Socorro, F.; de Rivera, P.J.R.; de Rivera, M.R.; de Rivera, M.R. Mathematical model for localised and surface heat flux of the human body obtained from measurements performed with a calorimetry minisensor. Sensor 2017, 17, 2749. [Google Scholar] [CrossRef] [PubMed]
  35. Bannov, A.; Prášek, J.; Jašek, O.; Zajíčková, L. Investigation of pristine graphite oxide as room-temperature chemiresistive ammonia gas sensing material. Sensors 2017, 17, 320. [Google Scholar] [CrossRef] [PubMed]
  36. Socorro, F.; de Rivera, P.J.R.; de Rivera, M.R. Calorimetry minisensor for the localised measurement of surface heat dissipated from the human body liquid nanocalorimeter. Sensors 2016, 16, 1864. [Google Scholar] [CrossRef] [PubMed]
  37. Analog Devices Webpage. Available online: https://www.analog.com/media/en/technical-documentation/data-sheets/ADuCM360_361.pdf (accessed on 9 September 2019).
  38. Shringarpure, K.; Pan, S.; Kim, J.; Fan, J.; Achkir, B.; Archambeault, B.; Drewniak, J. Sensitivity analysis of a circuit model for power distribution network in a multilayered printed circuit board. Trans. Electromagn. Compat. 2017, 59, 1993–2001. [Google Scholar] [CrossRef]
  39. Shen, Y.; Wang, H.; Blaabjerg, F.; Zhao, H.; Long, T. Thermal modeling and design optimization of PCB vias and pads. IEEE Trans. Power Electron. 2019. [Google Scholar] [CrossRef]
  40. Bernacki, K.; Rymarski, Z. Electromagnetic compatibility of voltage source inverters for uninterruptible power supply system depending on the pulse-width modulation scheme. IET Power Electron. 2015, 8, 1026–1034. [Google Scholar] [CrossRef]
  41. Bernacki, K.; Rymarski, Z.; Dyga, Ł. Selecting the coil core powder material for the output filter of a voltage source inverter. Electron. Lett. 2017, 53, 1068–1069. [Google Scholar] [CrossRef]
Figure 1. Scheme (a) and a photograph (b) of a XEN-NCM 9924 microcalorimeter [20].
Electronics 08 01147 g001
Figure 2. Cross-section of an XEN-NCM9924 microcalorimeter.
Electronics 08 01147 g002
Figure 3. A model of the interaction between the heater and the thermopile. The symbols that are used in the figure denote: Vh+ is the higher potential of the heater, Vh- is the lower potential of the heater, Rh is the heater resistance, Dp represents the parasitic pn junctions between the heater and the bulk, Rp is the leakage resistance between the heater and the thermopile, Tp is the thermopile, Rtp is the internal resistance of the thermopile and Utp is the thermopile voltage.
Electronics 08 01147 g003
Figure 4. The idea of a control system for the power supply for the heater, where Vref is the reference voltage, VDAC is the digital to analogue converter output voltage and BUF is the voltage follower.
Electronics 08 01147 g004
Figure 5. Block diagram of the power supply and data acquisition system.
Electronics 08 01147 g005
Figure 6. Simplified diagram of the power supply system.
Electronics 08 01147 g006
Figure 7. The electrical scheme of the heater control system.
Electronics 08 01147 g007
Figure 8. Four-wire diode voltage measurement circuit.
Electronics 08 01147 g008
Figure 9. A view of the ADuCM36x Tool—the analogue submodule configuration creator.
Electronics 08 01147 g009
Figure 10. (a) Placement of the elements and functional blocks on the printed circuit board (PCB), (b) a photograph of the control and measurement system, the plan for the distribution of the internal PCB layer of (c) the ground planes and (d) the voltage planes.
Electronics 08 01147 g010
Figure 11. The system configuration for determining the RMS noise and the effective number of bits in the measurement system.
Electronics 08 01147 g011
Figure 12. Signal waveforms and their histograms obtained in the designed system without the microcalorimeter connection with the short-circuited analogue to digital converter inputs for various sampling rates: (a) 10 Hz (RMS noise = 0.23733 µV, Vp-p = 1.4 µV, VOFFS = −0.16282 µV, effective number of bits (ENOB) = 20.006); (b) 20 Hz (RMS noise = 0.35181 µV, Vp-p = 1.7 µV, VOFFS = −0.24665 µV, ENOB = 18.878); (c) 50 Hz (RMS noise = 0.54404 µV, Vp-p = 3.5 µV, VOFFS = −6.4 µV, ENOB = 18.809); (d) 100 Hz (RMS noise = 0.7069 µV, Vp-p = 4.5 µV, VOFFS = −6.3 µV, ENOB = 18.432).
Electronics 08 01147 g012
Figure 13. Comparison of the data transmission noise levels that were measured using different types of isolation (a) ADuM1201AR, (b) 6N137.
Electronics 08 01147 g013
Figure 14. An exemplary voltage waveform on a thermopile for a sampling frequency of 10 Hz (a), voltage waveform after subtracting the drift (b) and its histogram obtained after subtracting the drift (c).
Electronics 08 01147 g014
Figure 15. The voltage-temperature characteristics of the absolute temperature sensor.
Electronics 08 01147 g015
Figure 16. Response of an XEN-NCM9924 microcalorimeter to pulses in the heating power—different zoom factors; 10 ms per sample.
Electronics 08 01147 g016
Figure 17. An example of using a designed measuring system in alternating current (AC) calorimetry.
Electronics 08 01147 g017
Figure 18. Dependency of the calorimeter sensitivity on the solution concentration.
Electronics 08 01147 g018
Table 1. The basic parameters of an XEN-NCM9924 microcalorimeter [20].
PropertyValue
membrane size8.3 × 8.3 mm2
membrane thickness22 μm
power sensitivity in air at 1013 mbar1.2–2.4 V/W
thermopile resistance50 kΩ
thermopile temperature sensitivity50 mV/K
heater resistance (R1-R3)0.25 kΩ (measured 0.278–0.281 kΩ)
heater resistance (R1-R2)
semiconductor heater resistance
1 kΩ (measured 0.824–0.826 kΩ)
0.44 kΩ (measured 0.448–0.451 kΩ)
Table 2. Comparison of the quality of the measurement results that were obtained for different sampling frequencies.
Sampling FrequencyOperating ParametersRMS Noise
[µV]
Vp-p
[µV]
ENOB
(Effective Number of Bits)
10 HzWithout transmission0.23211.37820.039
With transmission (6N137)0.28471.56119.744
With transmission (ADuM1201AR)0.24691.40519.949
20 HzWithout transmission0.32731.70419.543
With transmission (6N137)0.35842.05519.411
With transmission (ADuM1201AR)0.34581.78819.464
50 HzWithout transmission0.49812.54918.937
With transmission (6N137)0.55163.40818.789
With transmission (ADuM1201AR)0.53603.36818.831
100 HzWithout transmission0.64333.412118.5680
With transmission (6N137)0.72525.125318.3951
With transmission (ADuM1201AR)0.70914.603818.4275

