Article

Incremental Capacity Curve Peak Points-Based Regression Analysis for the State-of-Health Prediction of a Retired LiNiCoAlO2 Series/Parallel Configured Battery Pack

1
Power Electronics and Energy Conversion Laboratory, Department of Electrical Engineering, Soongsil University, Seoul 06978, Korea
2
Energy Storage and Conversion Laboratory, Department of Electrical Engineering, Chungnam National University, Daejeon 34134, Korea
*
Author to whom correspondence should be addressed.
Electronics 2019, 8(10), 1118; https://doi.org/10.3390/electronics8101118
Submission received: 31 August 2019 / Revised: 23 September 2019 / Accepted: 27 September 2019 / Published: 4 October 2019
(This article belongs to the Special Issue Challenges of Battery Management System)

Abstract

:
To recycle retired series/parallel battery packs, it is necessary to know their state-of-health (SOH) correctly. Unfortunately, voltage imbalances between the cells occur repeatedly during discharging/charging. The voltage ranges for the discharge/charge of a retired series/parallel battery pack are reduced owing to the voltage imbalances between the cells. To determine the accurate SOH of a retired series/parallel battery pack, it is necessary to calculate the total discharge capacity using fully discharging/charging tests. However, a fully discharging/charging test is impossible owing to the reduced voltage range. The SOH of a retired series/parallel battery pack with a voltage imbalance should be estimated within the reduced discharging/charging voltage range. This paper presents a regression analysis of the peak point in the incremental capacity (IC) curve from the fresh state to a 100-cycle aging state. Moreover, the SOH of the considered retired series/parallel battery pack was estimated using a regression analysis model. The error in the SOHs of the retired series/parallel battery pack and linear regression analysis model was within 1%, and hence a good accuracy is achieved.

1. Introduction

In recent years, with the increased use of electric vehicles (EVs), hybrid electric vehicles (HEVs), energy storage system (ESSs), and renewable energy storage system (RESSs), the development of a high-power and high-capacity lithium secondary battery have become active [1]. Because the output power of one cell is limited, multiple cells are connected in series and parallel according to the size of the voltage, current, and capacity of the application. When a battery pack consists of multiple cells, a voltage imbalance occurs between the cells. When such a battery pack is charged and discharged over many cycles, the above-mentioned cell-to-cell voltage imbalance occurs owing to the temperature variation, parasitic resistance, and cell aging. A voltage imbalance between each cell not only degrades the overall capacity utilization efficiency of the battery pack, but also accelerates the aging. Moreover, the full discharge/charge of a battery pack without balancing the voltage difference can lead to an overcharge/overdischarge. A cell-balancing circuit is used to prevent the voltage deviation between cells. However, because of the high manufacturing cost and power loss, it is inefficient.
In the case of electric transportation (ET), when the capacity of the battery pack is reduced to 80% of the fresh capacity, it should be replaced due to safety concerns [2]. Moreover, it is expected that the use of numerous retired series/parallel battery packs in ETs will increase significantly within five years. Lithium secondary batteries contain toxic substances. Therefore, it is difficult to recycle such a retired series/parallel battery pack in an eco-friendly manner. Recently, it was suggested that the retired series/parallel battery packs could be used in ETs in a small-scale RESS or residential ESS. This strategy can be applied for peak reduction in an ESS with a lower current rate rather than in a frequency regulation energy storage system (FRESS) with a high dynamic performance. The recycling methods of retired series/parallel battery packs are classified into direct reusing methods and disassembly/assembly reusing methods. A direct reusing method saves the time and cost of the screening and design of new battery packs. However, the application-specific optimization and battery management systems (BMSs) are difficult. A disassembly/assembly reusing method needs time and money for the screening and design of new battery packs. However, the application-specific optimization and design of a BMS is relatively easy. For efficient recycling of retired series/parallel battery packs, it is necessary to determine their state of health before disassembling. It is necessary to calculate the discharge capacity using a fully discharging/charging test to obtain the accurate state-of-health (SOH) of a retired series/parallel battery pack. However, a fully discharging/charging test is impossible owing to the reduced voltage range caused by the voltage imbalance. Thus, the SOH of a retired series/parallel battery pack within the voltage imbalance should be estimated based on the information of the reduced discharging/charging voltage range.
SOH estimation methods are classified into capacity-based methods and resistance-based methods. Both methods are based on the ratio of the fresh battery state and current battery state values. However, because of the non-linear characteristics of a battery and difference of the charging/discharging profile according to the application, it is difficult to estimate battery SOH accurately. Hence, there have been several methods for the estimation of battery SOHs, such as the direct measurement method, equivalent circuit model (ECM)-based methods, black box model (BBM)-based methods, and the incremental capacity method.
The direct measurement method directly measures the reference parameter value for estimating the SOH using an experiment, such as a full discharge/charge test, hybrid pulse power characterization (HPPC), dynamic stress test (DST), and electrochemical impedance spectroscopy (EIS). The full discharge/charge, HPPC, and DST methods use a separate test profile to extract the current capacity and dynamic characteristics of the battery within the available voltage operation range [3,4]. The EIS is a method of measuring the impedance according to the frequency response characteristics of the battery using a separate device, and the measured impedance is extremely accurate [5,6]. The direct measurement using experimental methods has a good accuracy but is limited as an off-line method. The methods of SOH estimation using partial capacity and impedance information in a short range of voltage or state-of-charge (SOC) to overcome the off-line method of direct measurement are known [7]. Unfortunately, these parameters are highly sensitive to the accuracy of the measuring equipment and different operating conditions.
An ECM-based method is a method of estimating the capacity or impedance using an estimation algorithm based on an ECM, such as the extended Kalman filter (EKF) and observer algorithm [8,9,10,11,12]. An ECM is a physical representation of the electrochemical properties of a battery [13]. The accuracy of this method depends on the accuracy of the ECM. However, an ECM-based method is complicated owing to a large number of matrix computation and difficulty in the software/hardware configuration of the actual BMS [12]. A BBM-based method learns with large amounts of data and builds the model on its own, without relying on system parameters, like by the support vector regression (SVR) and neural network (NN) algorithm [14,15,16,17]. Compared to a model-based method, the computational complexity is low, but there are disadvantages in collecting various useful data for the correct learning of the BBM to obtain the desired result [15]. An incremental capacity (IC)-based method is a differential analysis using the voltage and current information measured during battery usage in an application. The IC value can be calculated as the ratio of the amount of the differential in the voltage to that in the capacitance in the same duration [18,19]. The IC curve is a factor that intuitively represents the battery’s redox reaction, which is an important parameter to determine the capacity degradation of the battery [19,20]. With this method, the voltage plateaus in the discharging/charging curve and can be transformed into clearly identifiable peaks in the IC and differential voltage (DV) curve. The peaks in an IC curve represent the phase equilibria, whereas a DV curve represents the phase transitions [19,21]. Each peak in the curve has unique features, such as intensity and position, and it represents a specific electrochemical process occurring in the cell [19,22]. The extracted peak values and shape and position variation of the peaks are closely related to the battery capacity degradation, and therefore, can be used for monitoring battery aging. Furthermore, the changes of the IC curve peak point according to the battery aging is not affected by the various aging conditions, such as the depth of discharge (DOD), temperature, C-rate, and charging/discharging profile according to the application [22,23,24]. This IC-based method requires a few calculations, and they can be extracted in online applications [2].
This paper presents a regression analysis of the peak point in an IC curve from the fresh state to a 100-cycle aging state. And, the battery used in this research was a 12S28P retired series/parallel battery pack consisting of lithium nickel cobalt aluminum oxide (NCA) cells for a frequency regulation energy storage system (FRESS). First, the aging cycle test of the NCA cells was performed from the fresh state to the 100-cycle state. Second, the IC curve was extracted from the aging cycle test datasets. Third, to solve the measurement noise problems, the low-pass filter (LPF) smoothing method was used to obtain a smooth IC curve. Fourth, the peak point in the IC curve for the SOH estimation of the 12S28P retired NCA series/parallel battery pack was selected. Moreover, for comparison with the peak point in the IC curve method, analysis of the directly measured partial capacity in a short voltage range was performed. Fifth, the change in the IC curve peak point and directly measured partial capacity in the reduced voltage range caused by the aging cycle was modeled using linear regression analysis. Finally, using linear regression analysis, two aging models were experimentally verified on the 12S28P retired NCA series/parallel battery pack datasets.

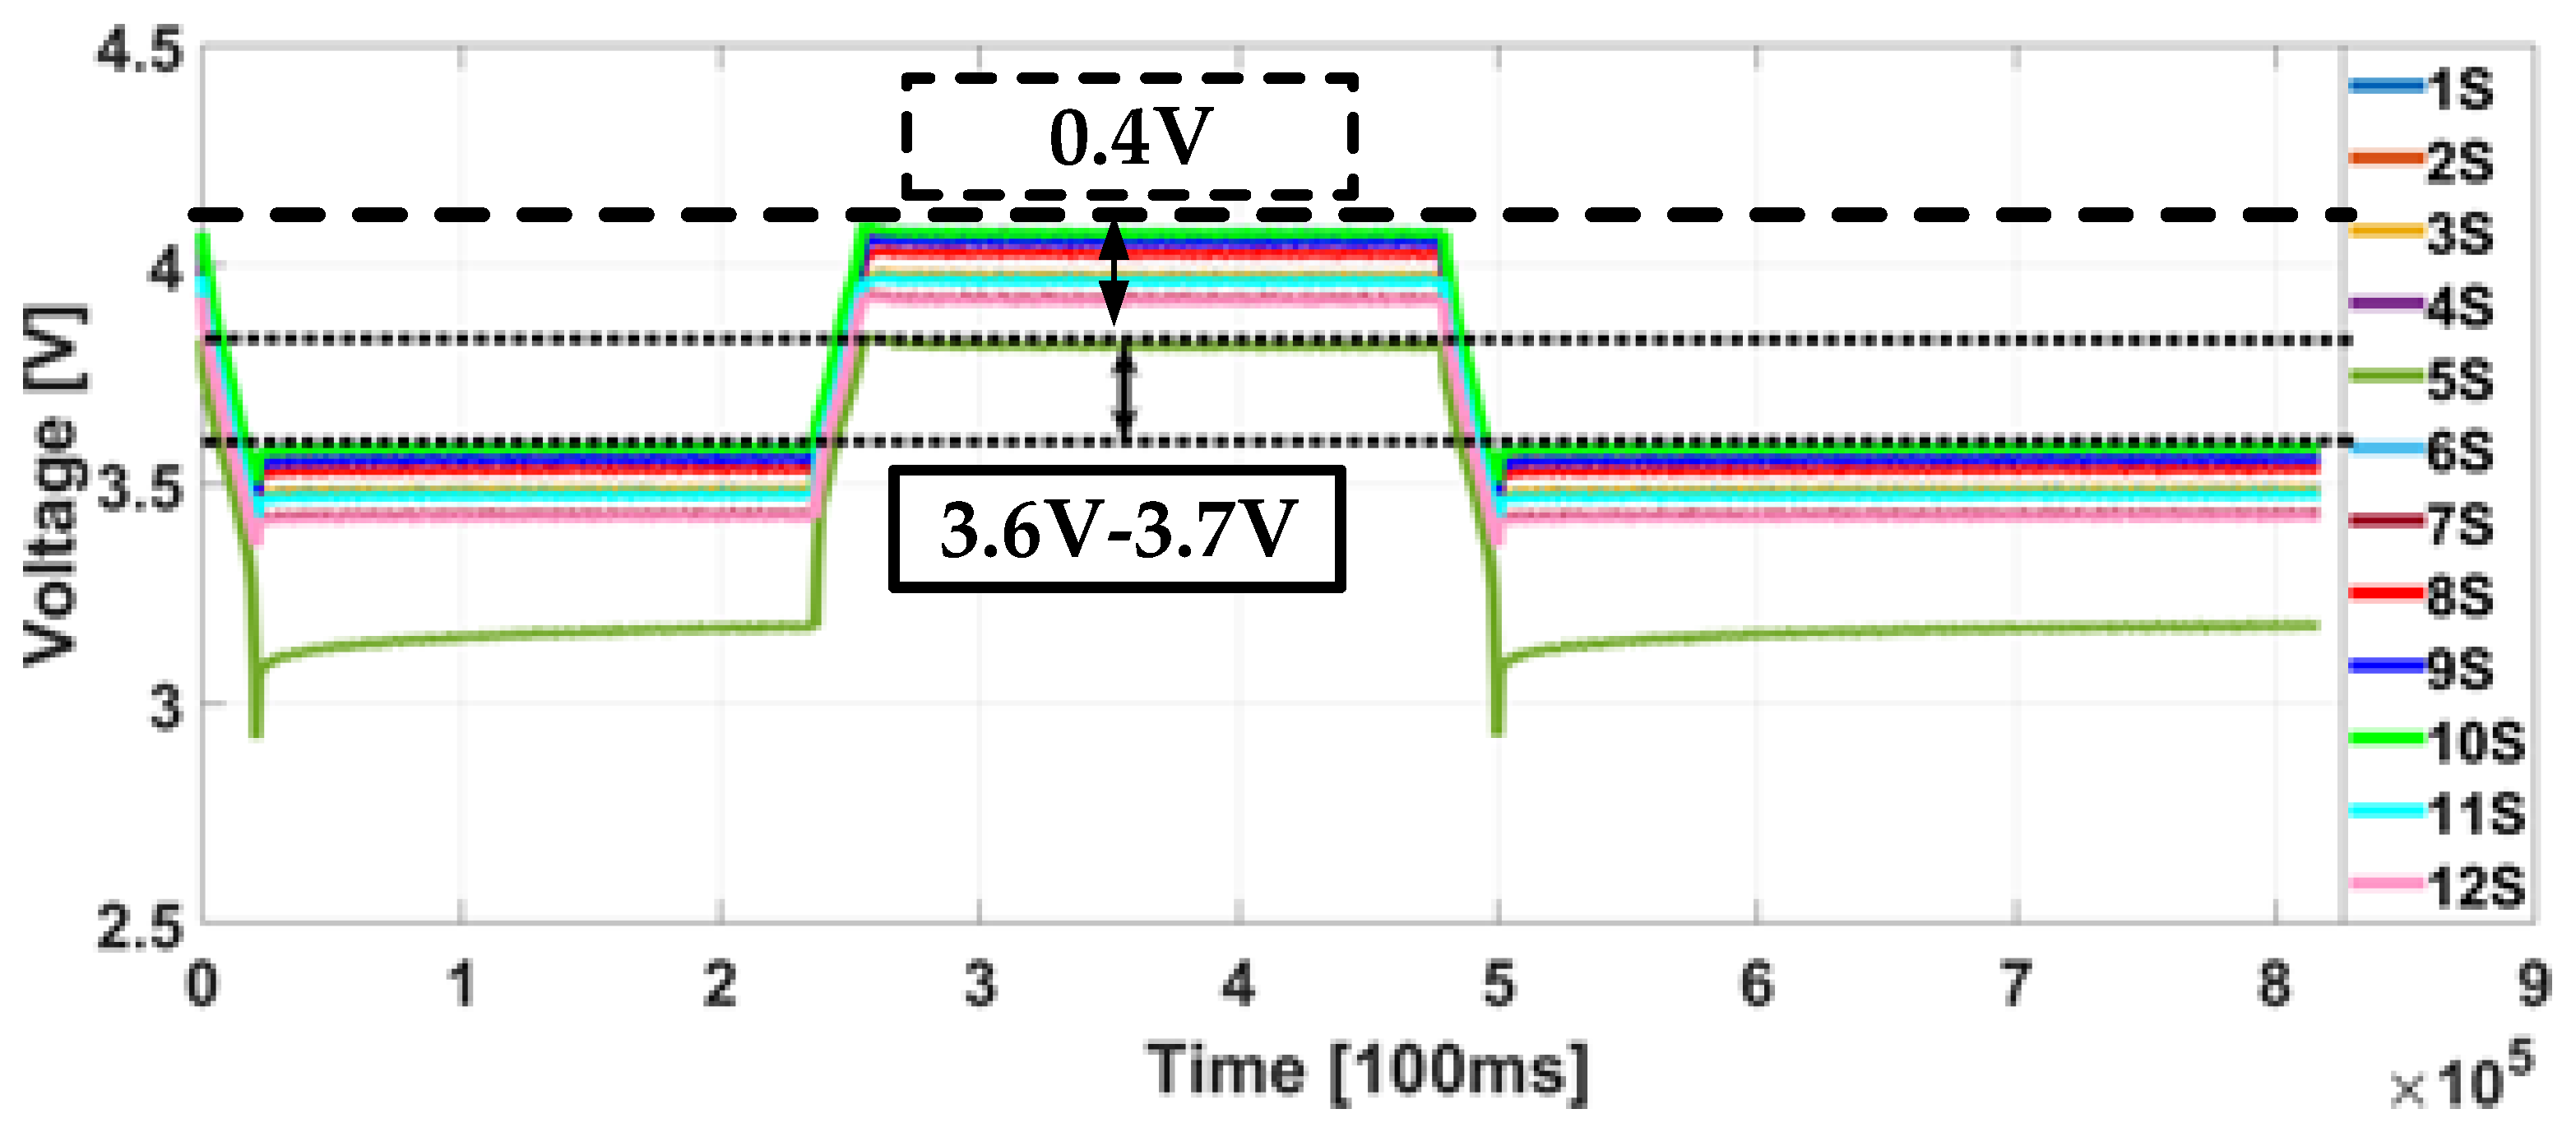
2. Voltage Imbalance of the NCA Retired Series/Parallel Battery Pack

2.1. Experimental Result of the Fresh Series/Parallel Battery Pack

The voltage imbalance of a battery pack mainly occurs between its series connections. As a battery pack repeatedly charges/discharges, this voltage imbalance is caused by the power loss due to the resistance between the series-connected terminals and difference in the temperature. Figure 1 shows the NCA series/parallel battery pack for a FRESS used for an experiment. This battery pack consisted of 336 NCA high-power cells with 12 series connections and 28 parallel connections. One NCA cell had a nominal capacity of 2.0 Ah, a cut-off voltage range of 4.2 V to 2.5 V, and a maximum discharge current rate of 15C-rate (30 A). In comparison, the 12S28P battery pack had a nominal capacity of 56 Ah, a cut-off voltage range of 49.5 V to 36 V, and maximum discharge current rate of 840 A. Figure 2 shows the aging current profile with the maximum current at a 4C-rate and response of the voltage in the experiment. Moreover, Figure 3 shows 12 discharging/charging voltages for each representative cell, measured using a voltage sensor, in the fresh tray consisting of 28 parallel-connected cells according to the aging current profile. It can be seen that the maximum voltage difference was 0.015 V, which is very small.

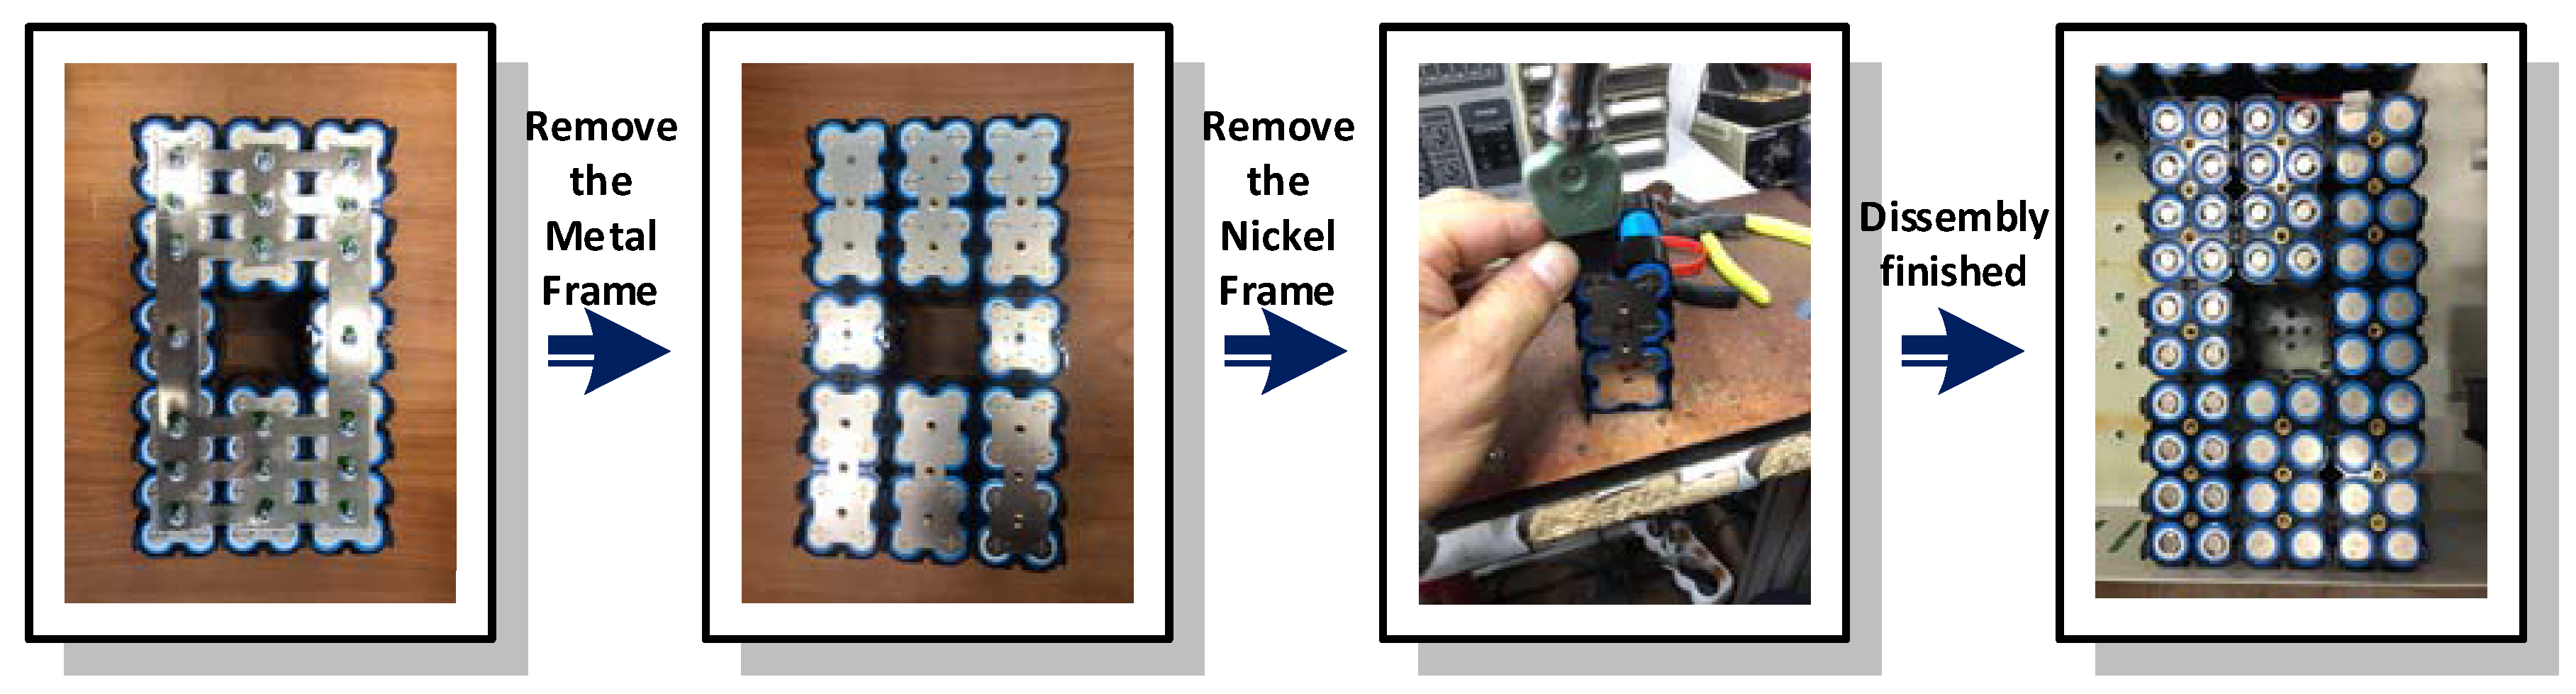
2.2. Experimental Result of the Retired Series/Parallel Battery Pack

The retired series/parallel battery pack was aged according to the aging profile presented in Figure 2. Moreover, there was no information about the aging process and current status datasets of the selected retired series/parallel battery pack. Therefore, a full discharge/charge test was conducted to determine the current status of the aged battery pack. Figure 4 shows 12 discharging/charging voltages for each representative cell, measured using a voltage sensor, in the retired series/parallel battery pack consisting of 28 parallel-connected cells in a full charging and discharging 1C-rate experiment according to the cut-off voltage range of the fresh battery pack. It can be confirmed that the 7th, 10th, and 12th series stages with 28 parallel connections were overdischarged owing to the large voltage difference. Moreover, the 7th series stage was shorted to 0 V. Therefore, the retired series/parallel battery pack with a voltage imbalance should be used with consideration of the condition of each cell. Moreover, the discharge/charge range of the retired series/parallel battery pack in which the voltage imbalance occurred was narrowed to prevent the overdischarge/overcharge. It is necessary to calculate the discharge capacity using a fully discharging/charging test to determine the accurate SOH of the retired series/parallel battery pack. However, a fully discharging/charging test was impossible owing to the reduced voltage range caused by the voltage imbalance. Therefore, the SOH of the retired series/parallel battery pack within the voltage imbalance should be estimated using the information from the reduced discharge/charge voltage range.

2.3. Aging Cycle Test of the NCA Cell

It is necessary to determine the calendar-life data of the battery from the fresh state to the retired state to design the aging model of the retired series/parallel battery pack. However, there was no data of the battery pack during the aging period. Therefore, three fresh NCA cells were used for the aging cycle test. The experiments were performed on a three-channel MACCOR 4300K battery test system (Maccor, KR) with a current range of 0–15 A and voltage range of 0–5 V, as shown in Figure 5. The voltage and current accuracies were ±0.02% and ±0.05%, respectively. The data acquisition system had a time resolution of maximum 10 ms. The aging cycle test was performed in the temperature chamber within 25 °C. The 1C-rate (2 A) constant current (CC)-constant voltage (CV) full discharge/charge profile used to age the cells is presented in Figure 6a. The CC-CV full discharge/charge aging test was performed 100 times, and the capacity degradation for a particular slope according to the aging cycle test is presented in Figure 6b. The cells datasets of the aging cycle test were used for the capacity degradation modeling to estimate the SOH of the aged battery pack.

3. Incremental Capacity (IC) Curve Acquisition

3.1. Original IC Curve

An IC curve is widely used as a practical factor to analyze the capacity degradation of a battery and can be obtained from the discharge/charge state under the CC condition. Moreover, the IC is calculated using the capacity difference divided by the voltage difference for the same time, as shown in Equation (1). Figure 7 is an IC curve of cell no. 1 in the discharge state. Moreover, the sampling time of the IC curve dataset was 1 s. However, it was difficult to obtain the peaks based on the IC method because the parameter values had measurement noise.
Δ Q Δ V = d Q d V = I d t d V

3.2. Smoothing of the IC Curve

As is commonly done, a first-order LPF was used to smooth the measurement noise of the IC curve [19]. Equation (2) represents the discrete form of a first-order LPF, where yn−1 is the previous result of the LPF and τ is the value of the time constant, which determines the cut-off frequency (fcut) of the LPF, as presented in Equation (3). Here, xn is the input value of the LPF and ts is the sampling time of the input value. As τ increases, fcut becomes lower. Moreover, the IC curve becomes smoother, as presented in Figure 8. Because ts was 1 s, the fcut was lower than 1 Hz. The noise of the IC curve was properly removed at 100τ, when the τ was applied in the range from 10 to 150. Therefore, a first-order LPF of 100τ was used to remove the measurement noise in the IC curve in this research.
y n = τ τ + t s y n 1 + t s τ + t s x n
τ = 1 2 π f c u t

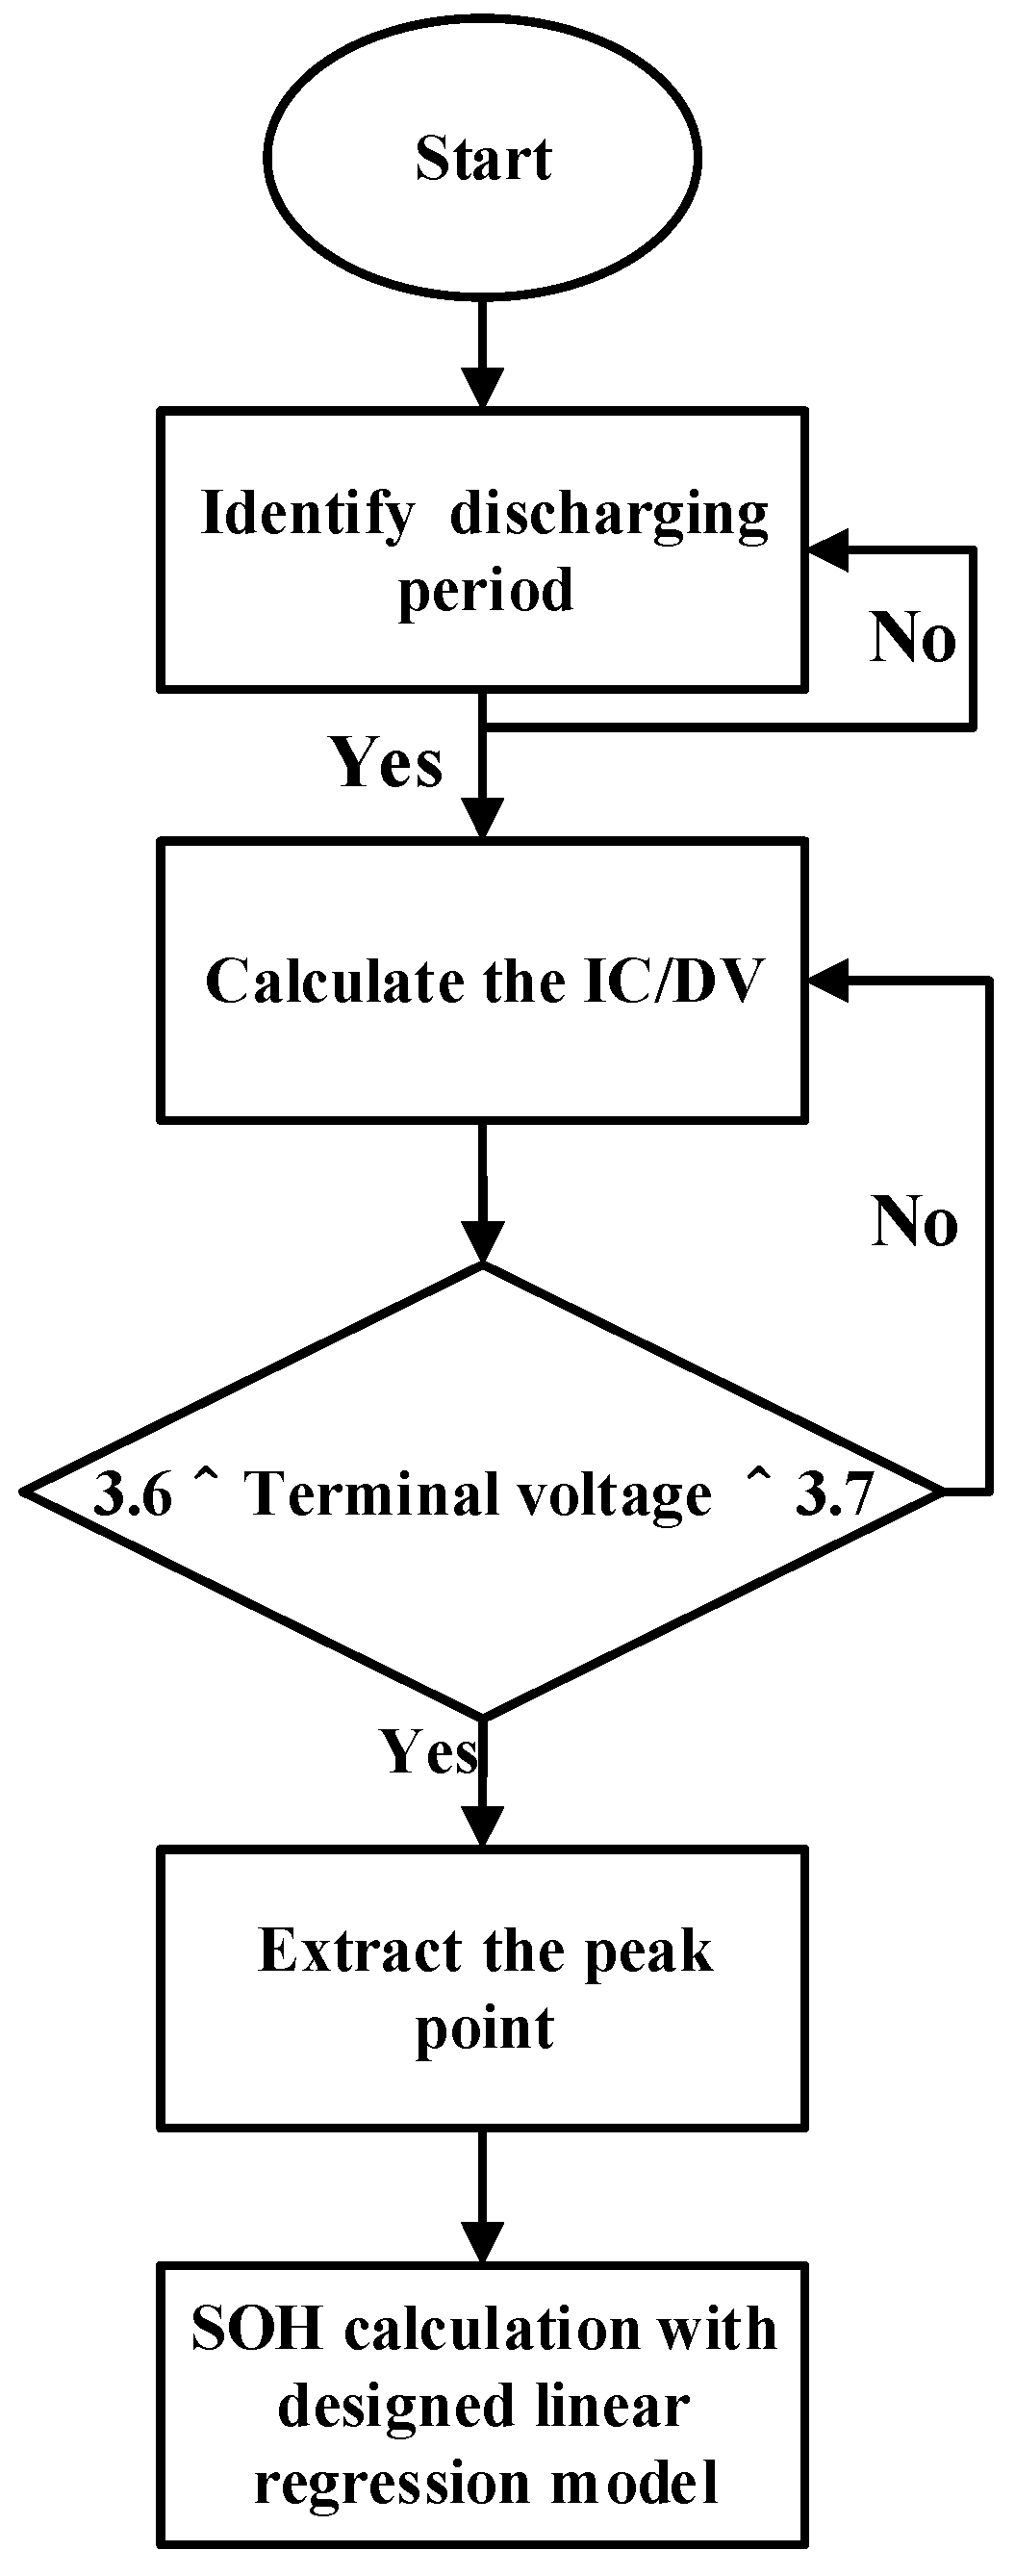
4. Design of the Aging Model

4.1. Selection of the IC Curve Peak Point

The voltage operation range of the 12S28P NCA retired series/parallel battery pack was narrowed by the voltage imbalance to prevent the overdischarge/overcharge, as presented in Figure 9. The voltage operation range of the 12S28P NCA fresh battery pack was from 36–49.5 V, and for the retired series/parallel battery pack, it was from 40.8 V to 40 V. In the 12 series-connected stages, the normal discharge/charge range was from 3.6 V to 3.8 V. Therefore, the SOH of the retired series/parallel battery pack should be calculated using the information in the voltage operation range of 3.8–3.6 V. Figure 10 shows the IC curve peak point of a fresh cell no. 1 for 100 cycles according to the aging cycle test. It was confirmed that a total of three peak points and two valley points occurred in the full discharge/charge range. However, all five points cannot be used to estimation of SOH due to voltage imbalance in the battery pack. As the maximum voltage difference increases, the number of available IC curve peak points decreases. The maximum chargeable voltage and the maximum dischargeable voltage decrease by the magnitude of the maximum voltage difference. So, the retired battery pack used in this paper has a 0.4V of maximum voltage difference and voltage operation range of 3.6–3.8V, as shown in Figure 9. And, the available IC curve peak point is only valley point 1. Furthermore, the IC curve peak point changed with a decreasing capacity, depending on the type of battery. However, the storage capability information of most lithium-ion batteries were determined by the degree of the redox reaction at the negative electrode of the battery [24,25]. The same applied to the NCA series batteries used in this paper. With the five points shown in Figure 10, the storage capability range at the cathode of the battery was peak point 1 and valley point 1 [24,25]. So, the valley point 1 in the IC curve occurring between 3.6 V and 3.7 V satisfied the common discharge/charge voltage operation range of the retired series/parallel battery pack and available factor of capacity fading, as shown in Figure 10. In this study, the IC curve valley point 1 of fresh cell no. 1 was used as a factor for the capacity-degrading model of the retired series/parallel battery pack. Figure 11a is the IC curve valley point 1 of fresh cell no. 1 according to the aging cycle test with 100 cycles. It was confirmed that the IC curve valley point 1 increased with the number of aging cycle tests.

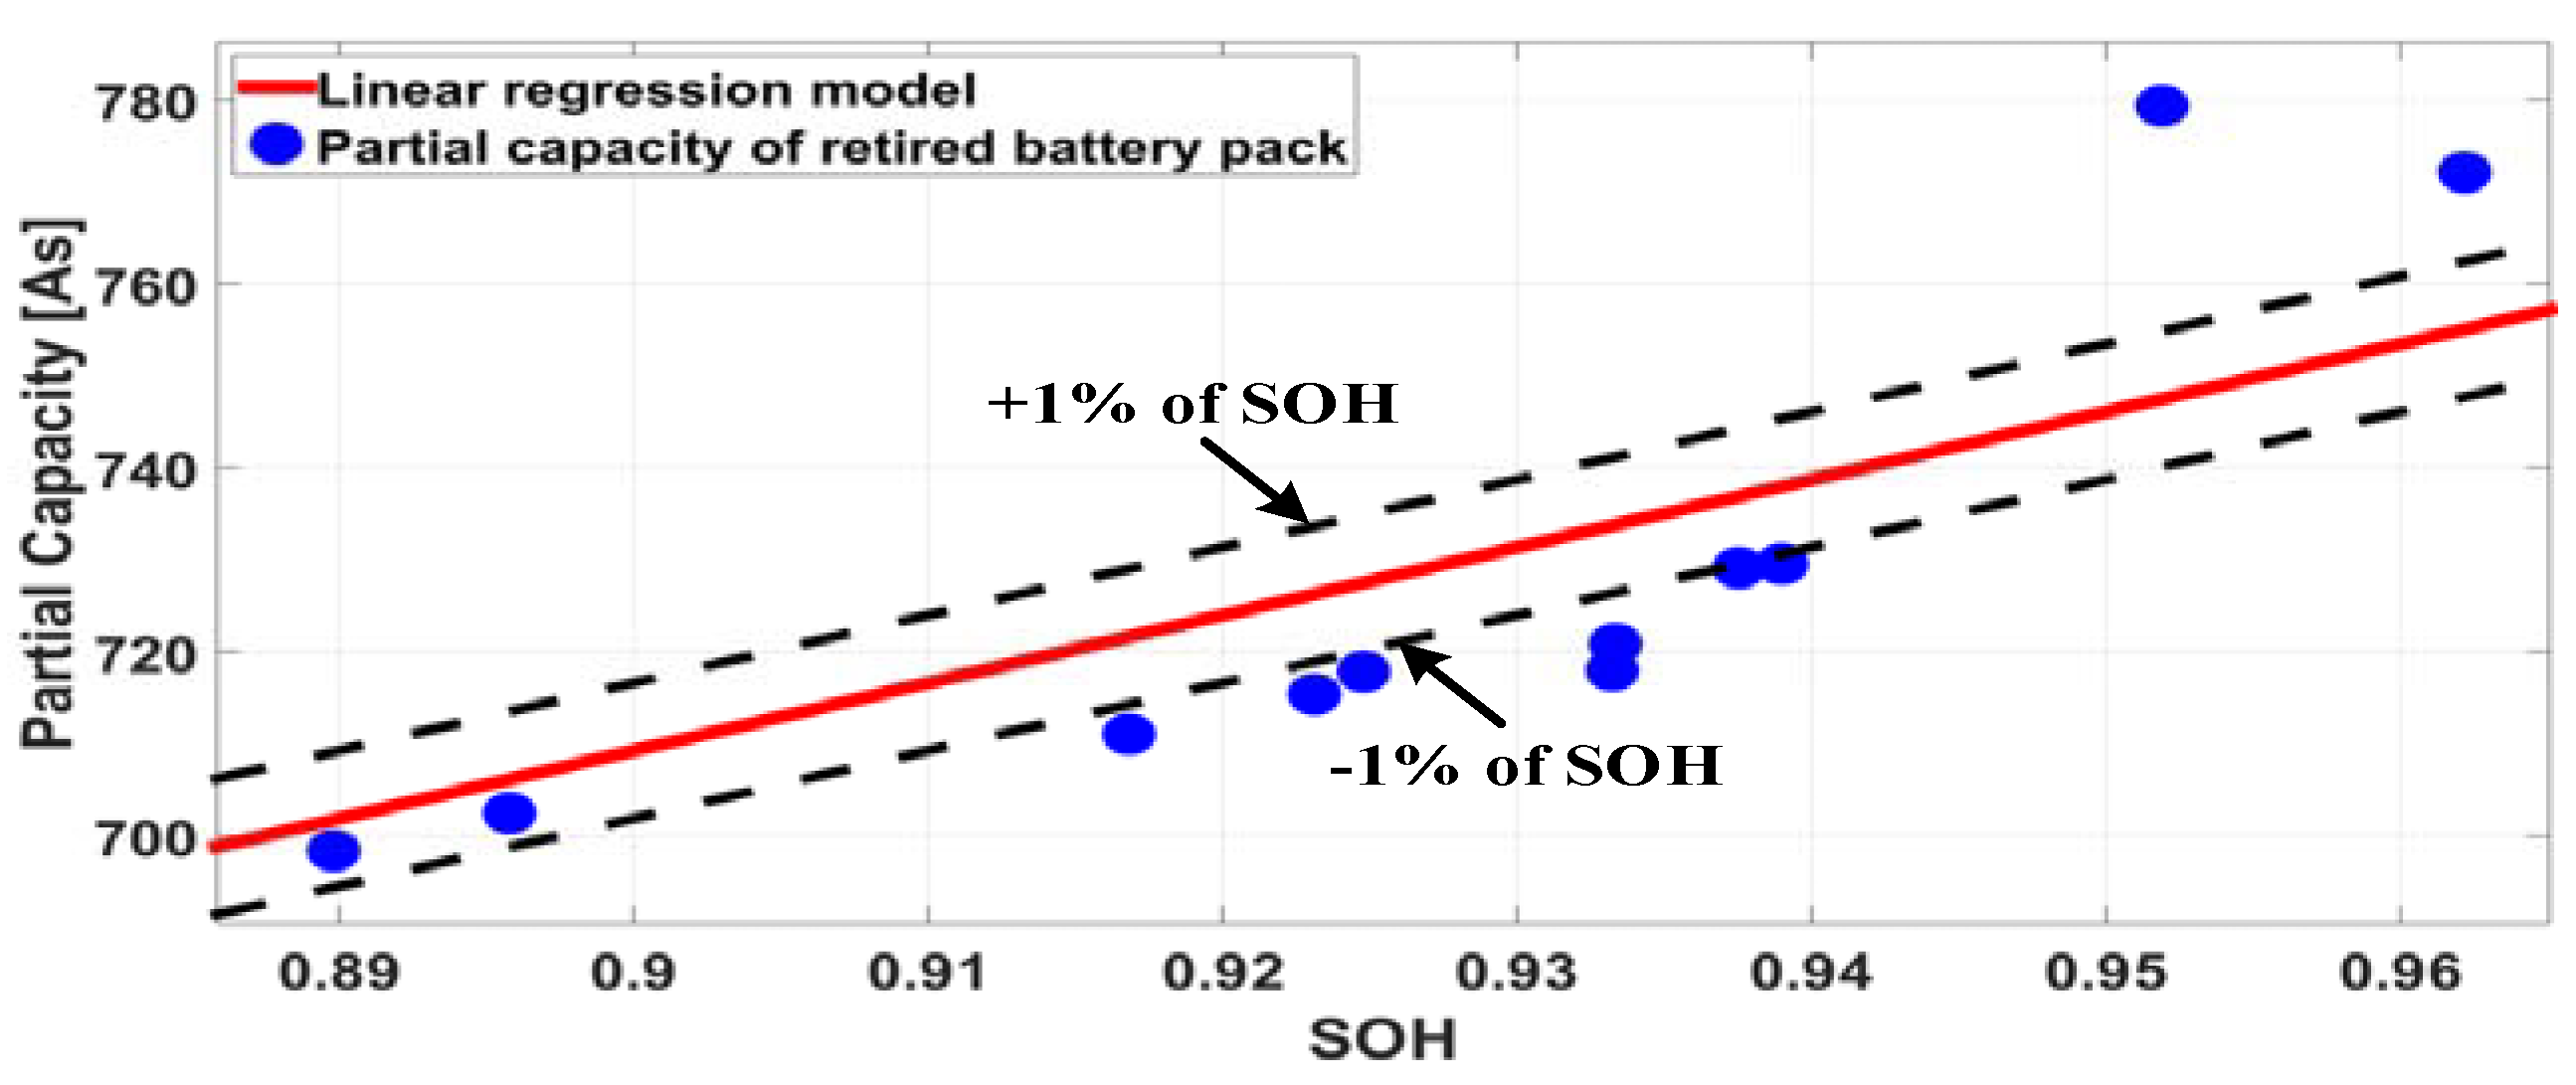
4.2. Analysis of the Partial Capacity in the Short Voltage Range

The analysis of the tendency of the directly measured capacity value was performed in the same voltage range to compare the tendency of an IC curve peak point with that found in Section 4.1. Figure 12 shows the tendency of the directly measured capacity value of cell no. 1 within the voltage range from 3.6 V to 3.7 V. It was confirmed that the partial capacity value of cell no. 1 in this short voltage range decreased with the number of aging cycle tests. This tendency indicated that the partial capacity value in the short voltage range decreased as the capacity value in the full operating voltage range decreased. Therefore, the directly measured partial capacity value of cell no. 1 in the short voltage range was also suitable for use as a factor of the capacity fading model.

4.3. Linear Regression Method

Linear regression analysis is a statistical analysis method for identifying the relationship between independent and dependent variables [26,27]. A linear regression model with one independent variable is called a simple linear regression model, and with two or more independent variables, it is called a multiple linear regression model. In this study, a simple linear regression model was used to model the capacity degradation of the retired series/parallel battery pack. To determine the applicability of linear regression analysis, correlation analysis should be performed to confirm the relationship between the independent and dependent variables. Correlation analysis is a method of determining the linear relationship between independent and dependent variables. Moreover, the correlation coefficient, r, is a statistic that shows the linear correlation between two variables, as expressed in Equation (4) [26]. The x and y denote independent and dependent variables, respectively, x ¯ and y ¯ are the average values of the independent and dependent variables, respectively, and n is the number of data points.
r = ( x x ¯ ) ( y y ¯ ) n 1 ( x x ¯ ) 2 n 1 ( y y ¯ ) 2 n 1
y i = α + β x + ε i
A correlation coefficient, r, value close to the absolute value of 1 indicates that there is a strong relationship between the independent and dependent variable. Equation (5) represents a simple linear regression model [26]. The above equation expresses the effect of an independent variable, x, on a dependent variable, y. The influence of the independent variable, x, on the dependent variable, y, is expressed as an equation. The effect of x is represented by the magnitude and sign of the regression coefficient, β. The regression coefficient, α, implies that the change in y does not affect the change in x. Moreover, the error term ε includes all of the influences except the influence of x on y.
Because the regression curve given in Equation (5) cannot represent the data of the entire population, the fitted regression equation given in Equation (6) is used [26]. The fitted regression curve is the linear regression line of the measurement from the specimen. The values of the errors, ei, and sum of squared errors (SSE) represent the difference between the fitted regression line, ŷi, and actual data, yi, as expressed in Equations (5) and (6) [26]. Calculating a and b to minimize the SSE leads to the linear regression equation that best represents the relationship between x and y. The least-squares method is used to minimize the SSE, as presented in Equations (7) and (8) [26]. The regression coefficients, α and β, are calculated to minimize the SSE using the partial differentiation method. Following the regression coefficient calculation, the coefficient of determination, R2, is calculated, as given in Equations (6), (10), and (11) [26]. The sum of squares (SSR) represents the unexplained variance from the linear regression equation of the total variance. The coefficient of determination is a variable that can be explained using the estimated regression equation of the total variance of the variables. The coefficient of determination has a value between 0 and 1
A coefficient of determination, R2, close to the value of 1 indicates a strong relationship between the variables and estimated regression equation.
e i = y i y ^ i = y i α β i
SSE = i = 1 n e i 2
b = i = 1 n ( x i x ¯ i ) ( y i y ¯ i ) i = 1 n ( x i x ¯ i ) 2
a = y ¯ b x ¯
SSR = i = 1 n ( y ^ y ¯ ) 2
R 2 = SSR SSR + SSE
The results of the linear regression modeling according to the IC curve peak points and partial capacity of cell no. 1 are shown in Figure 13 and Figure 14. Figure 13a and Figure 14a shows the IC curve peak points and partial capacity of cell no. 1, respectively, according to the SOH changes. In Section 4.1 and Section 4.2, it was confirmed that the IC curve valley point 1 and partial capacity of cell no. 1 increased and decreased as the capacity decreased according to the aging cycle test, as shown in Figure 11b and Figure 12b. The capacity decrease was indicative of the SOH decrease. The SOH can be calculated using Equation (12), where Capacitycurrent is the discharge capacity of the battery in the current state and Capacityfresh is the discharge capacity of the battery in the fresh state.
Therefore, the changes in the IC curve valley point 1 and the partial SOC of cell no. 1 according to the SOH decreases presented in Figure 11b and Figure 12b and Equation (11) are shown in Figure 13a and Figure 14a. The datasets in Figure 13a and Figure 14a were used to estimate the linear regression equation. First, the correlation coefficient, r, was calculated using Equation (4), and the results were 0.9796 and 0.9864. It was confirmed that the partial capacity of cell no.1 had a slightly higher correlation with SOH than the IC curve valley point 1 of cell no. 1 had with SOH. However, the resulting values of both the parameters were large. Therefore, the independent variables of the IC curve valley point 1 and partial capacity of cell no. 1 and dependent variable SOH had a strong correlation, as seen through the linear regression analysis. Moreover, Figure 13b and Figure 14b show a linear equation for these datasets. It was confirmed that the IC curve valley point 1 and the partial capacity of cell No.1 had negative and positive regression coefficients, respectively, as the SOH decreased.
S O H c u r r e n t = C a p a c i t y c u r r e n t C a p a c i t y f r e s h
The coefficient of determination, R2, was calculated using Equation (12), and the results were 0.9774 and 0.9849. It was confirmed that the partial capacity of cell no. 1 had a slightly larger coefficient of determination, R2, than that of the IC curve valley point 1 of cell no. 1. These values of the coefficient of determination, R2, indicating that the relationship between the variables and estimated regression. The linearity of x and y is high according to the R2 is close to 1. Therefore, it was confirmed that the derived linear regression equations of the two methods were suitable for use as battery aging models without further statistical verification.

5. Experimental Results

5.1. Results of Cell Datasets

Figure 15 exhibits the calculation step of the SOH using a linear regression model. The IC curve was calculated in the discharge interval, and the IC curve peak value was extracted in the terminal voltage range between 3.6 V and 3.7 V. Moreover, the extracted IC curve peak point was used as the input value of the linear regression model to calculate the SOH, as shown in Figure 12b. The directly measured partial capacity was also extracted in the terminal voltage range between 3.6 V and 3.7 V. The comparison of the linear regression model of cell no. 1 and the real SOH according to the IC curve peak point of cell nos. 2 and 3 as a reference value is shown in Figure 16 and Figure 17. Furthermore, the numerical comparison results of the SOH obtained using the linear regression model of cell no. 1 and a real SOH as a reference value are listed in Table 1 and Table 2. The error of the SOH was calculated using Equation (13). SOHreal was calculated using the real capacity value obtained using an off-line experiment. SOHmodel was calculated using the linear regression model. Figure 18 shows the error in the SOH using the IC curve peak point and partial capacity according to the aging cycle. It was confirmed that the maximum errors in the SOH with the IC curve peak point and partial SOC were 0.9771% and 0.8653%. All the accuracy is within 1%. Furthermore, it was confirmed that the average error in the estimated SOH was also within 1%, as shown in Figure 18. Therefore, it was confirmed that both the designed aging models with the IC curve peak point and partial capacity exhibited a good accuracy in the cell-based verification.
S O H e r r o r = | ( S O H r e a l S O H m o d e l ) × 100 |

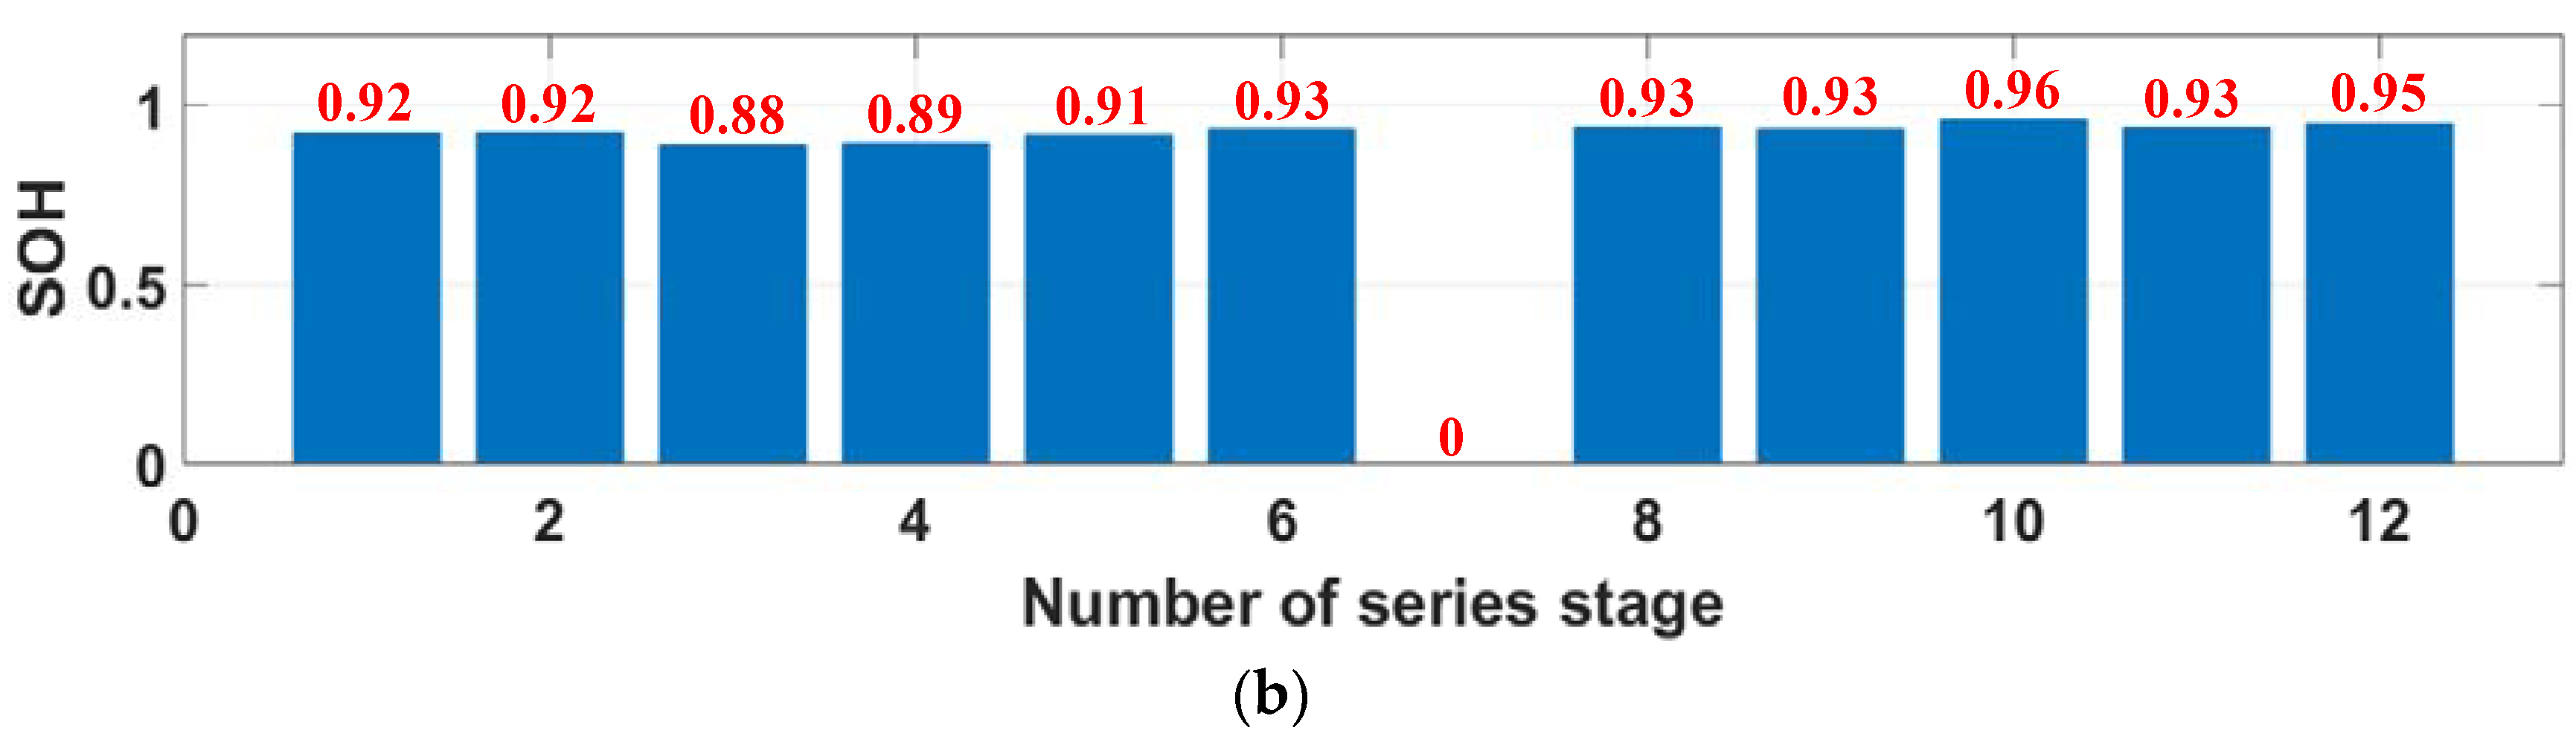
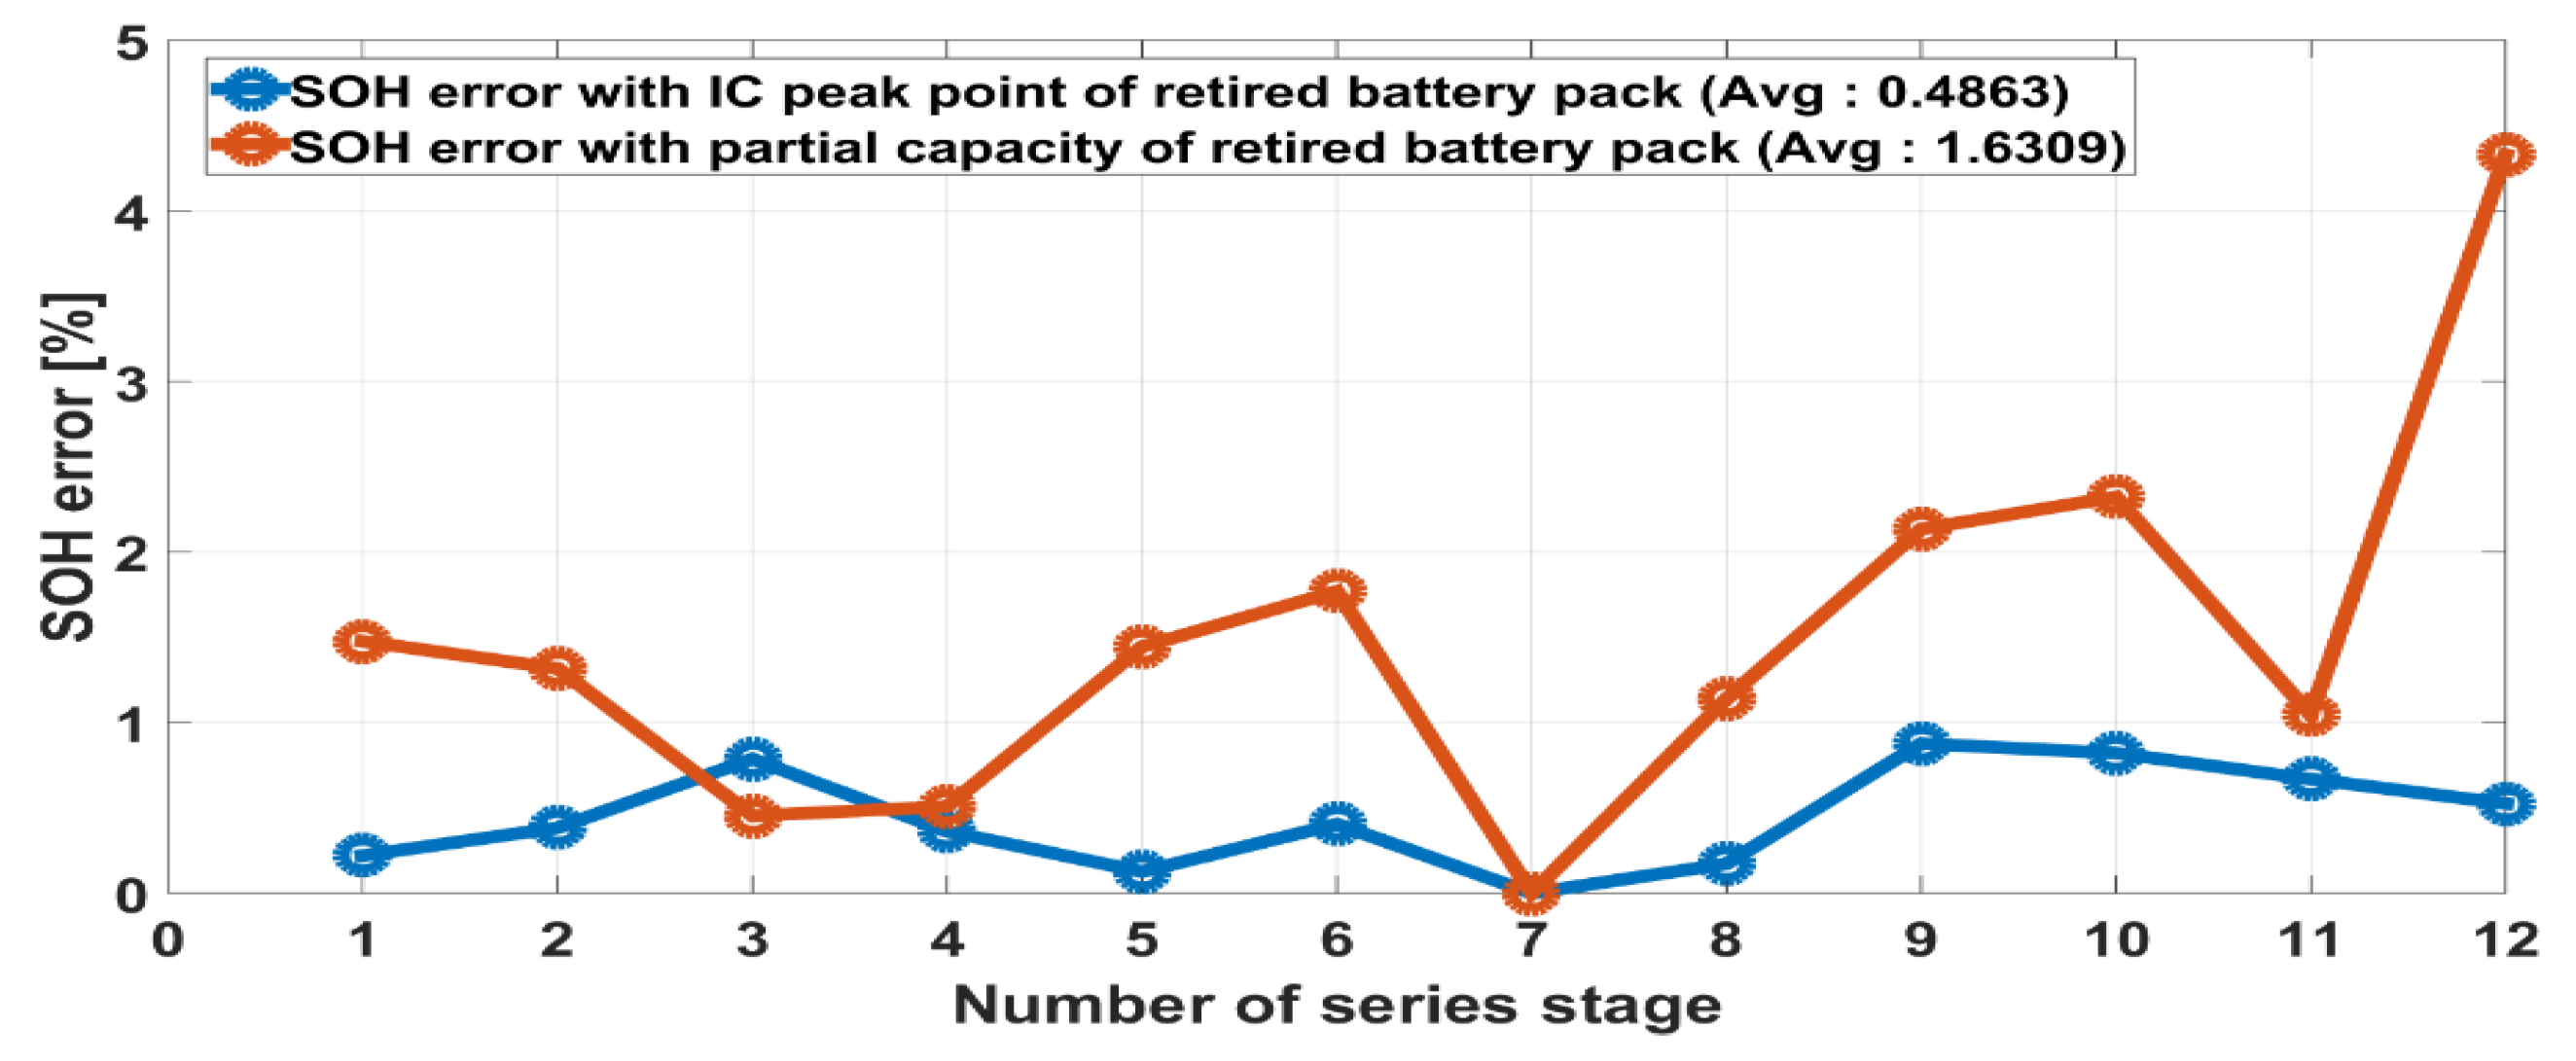
5.2. Results of the Retired Series/Parallel Pack Datasets

Figure 19 shows the IC curve valley point 1 of the 12 series-connected stages of the retired series/parallel battery pack using the datasets in Figure 4. The 7S series stage of the short circuit was excluded. These datasets in Figure 19 were used to estimate the SOH of the retired series/parallel battery pack based on the capacity fading model shown in Figure 13b. The value of the off-line current capacity was needed to verify the estimated SOH value of the retired series/parallel battery pack. However, it was impossible to perform a full discharge/charge of a retired series/parallel battery pack with a voltage imbalance. Therefore, this retired pack was disassembled, as shown in Figure 20. Following the disassembly of the retired series/parallel battery pack, a full discharge/charge test was conducted to obtain the value of the current capacity. These current capacities and SOHs of the 12 series-connected stages of the disassembled retired series/parallel battery pack are presented in Figure 21. It was confirmed that an imbalance in the SOH was caused by the imbalance in the voltage in the 12 series-connected stages.
The maximum and minimum values of the SOH were 0.96 and 0.88, respectively, and the maximum difference in the SOH was 0.08. By converting this value of the SOH error to a percentage, it was confirmed that there was a very large SOH difference of 8%. If this retired series/parallel battery pack continues to be used, the speed of the SOH imbalance and voltage imbalance will increase. Therefore, it is important to estimate the current SOH of the series-connected stage of the retired series/parallel battery pack.
Figure 22 and Figure 23 show the comparison of the linear regression model of cell no. 1 and datasets of the IC curve peak point and partial capacity according to the real SOH value of the 12 series-connected stages of the retired series/parallel battery pack. Moreover, Table 3 and Table 4 show the numerical results of Figure 22 and Figure 23. It was confirmed that the maximum error in the SOH from the IC curve peak point method and partial capacity method was 0.7867% and 4.3288%, respectively, and the maximum error in the SOH from the partial capacity method was extremely large. Figure 24 shows the error in the SOH obtained with the IC curve peak point and partial capacity according to the number of the 12 series-connected stages of the retired series/parallel battery pack. It was confirmed that the average errors in the estimated SOH using the IC curve peak point method and partial capacity method were 0.4863% and 1.6309%, respectively. The SOH error value with the IC curve peak point method was within 1%, but the result for the partial capacity method had a large value of over 1% of the target of the retried battery pack. These results suggest that the directly measured partial capacity method was not suitable for the different aging conditions of the battery. The aging profiles of the unit fresh NCA cell and fresh NCA series/parallel battery pack were different, as shown in Figure 2 and Figure 5. Moreover, the capacity fading model for the SOH estimation was built with the unit cell information, but the retired series/parallel battery pack had a different aging history than of the unit cell. Also, the retired series/parallel battery pack had a difference in the depth of discharge between the series terminals owing to the voltage imbalance, as shown in Figure 9. It is necessary that the aging model is designed with the data under the same aging condition for the application to estimate the SOH with the partial capacity method, in which the battery is used. However, the IC curve peak point method closely matched with the phase transition during the Li+ intercalation and de-intercalation process [18]. This process is directly related to the capacity fading of the battery. Therefore, the IC curve peak point method was suitable for the various aging conditions of the battery. Thus, the SOH estimation method using the capacity fading model via the linear regression analysis according to the IC curve peak point and SOH in the narrowed discharge/charge operation voltage range was sufficient.

5.3. Results of the Retired Cell Datasets

In Section 5.1 and Section 5.2, the datasets used for verification came from batteries with the aging period before 80% SOH. Batteries with the aging period before 80% SOH are not retired batteries. The battery pack used in Section 5.2 was a short-circuited battery due to the large cell-to-cell voltage imbalance, but was not sufficient to verify the battery SOH values after 0.8. The additional verification was performed with the 600 CC-CV cycle test using retired cell datasets to verify the aging period after 80% SOH of the proposed SOH estimation model, as shown in Figure 25. Furthermore, Figure 26 and Figure 27 show the comparison between the linear regression model of cell no. 1 and datasets of the IC curve peak point and partial capacity according to the real SOH value of the retired cell. Furthermore, the numerical comparison results of the SOH obtained using the linear regression model of cell no. 1 and a real SOH as a reference value are listed in Table 5 and Table 6. It was confirmed that the maximum error in the SOH from the IC curve peak point method and partial capacity method were 1.303744% and 3.625032%, respectively, and the maximum error in the SOH from the partial capacity method was extremely large. Figure 18 shows the error in the SOH obtained with the IC curve peak point and partial capacity according to the number of the aging cycle. It was confirmed that the average errors in the estimated SOH using the IC curve peak point method and partial capacity method were 0.4967% and 2.0158%, respectively. The SOH error value with the IC curve peak point method was within 0.5%, but the partial capacity method has a large error value of over 2% of the target of the retired battery pack. These results suggest that the directly measured partial capacity method was not suitable for the retired battery below a SOH of 0.8. Furthermore, the IC curve peak point method was suitable for the retired battery of the aging period after 80% SOH. Thus, the SOH estimation method using the capacity fading model via the linear regression analysis according to the IC curve peak point and SOH for recycling of retired battery was effective.

6. Conclusions

This paper proposed a SOH estimation method for a retired series/parallel battery pack with a voltage imbalance. The voltage imbalance and narrowed voltage operation range were confirmed using the discharge/charge tests of the 12S28P NCA retired series/parallel battery pack. Moreover, an IC curve peak point method was proposed to estimate the SOH using the information of the narrowed voltage operation range. The linear regression analysis method was performed with the IC curve peak point and SOH value based on the capacity information of the fresh cell according to a 100-cycle aging test to build the capacity fading model. First, to verify the capacity fading model using linear regression analysis, the datasets of other cells according to the 100-cycle aging test were used. All the errors in the SOH were within 1%, and it was confirmed via the linear regression model that the capacity fading model had a good accuracy. The directly measured partial capacity analysis in a short voltage range was performed to be compared with the result of the IC curve peak point. Moreover, all the errors in the SOH were within 1%, and it was confirmed by the linear regression model that the partial capacity model had a good accuracy using cell-based verification. Second, to verify the capacity fading model of cell no. 1 via linear regression, datasets of the 12 series-connected stages of the retired series/parallel battery pack were used. Moreover, the result of the error in the SOH was within 1%. However, the result of the error in SOH with the partial capacity method was over 1%. Therefore, it was confirmed by the linear regression analysis that the capacity fading model with the IC curve peak point was suitable for SOH estimation of a retired series/parallel battery pack with a voltage imbalance. If the SOH was estimated in the units of a retired series/parallel battery pack with voltage imbalances without disassembling it, then the time and cost of the capacity-based screening for recycling the retired series/parallel battery pack were effectively reduced. Moreover, it was easy to determine whether the retired series/parallel battery pack could be used. Finally, to verify the capacity fading model by linear regression analysis after the aging period of SOH 80%, the datasets of other cells according to the 600-cycle aging test were used. The result of the error in SOH with the IC curve peak point method was within 0.5%. However, the result of the error in SOH with the partial capacity method was over 2%. Therefore, it was confirmed via the linear regression analysis that the capacity fading model with the IC curve peak point was suitable for SOH estimation of a retired cell after the aging period of 80% SOH. The future works will require verification in the aging intervals after the 80% SOH value of the retired battery pack. This future work will for the SOH estimation of recycled retired series/parallel battery packs.

Author Contributions

H.L. conceived and designed the experiment; H.L. performed the experiment; visualization: H.L. analyzed the theory; H.L. wrote the manuscript; J.P. and J.K. participated in research plan development and revised the manuscript.; supervision was done by J.P. and J.K.; All authors contributed to the manuscript.

Funding

This work was supported the Korea Institute of Energy Technology Evaluation and Planning (KETEP) grant funded by the Korea government (MOTIE) (20182410105280) and the National Research Foundation of Korea (NRF) grant funded by the Space Core Technology Development Project (No. NRF-2017M1A3A3A03016056).

Conflicts of Interest

The authors declare no conflicts of interest.

References

  1. Lee, C.G.; Park, J.H.; Kim, J.H. Construction of Frequency Regulation RESS based on Advanced Cell Grouping Combined with the DWT. In Proceedings of the IEEE Transportation Electrification Conference, Busan, Korea, 1–4 June 2016. [Google Scholar]
  2. Casals, L.C.; Barbero, M.C. Reused second life batteries for aggregated demand response services. J. Clean. Prod. 2019, 212, 99–108. [Google Scholar] [CrossRef]
  3. Xiong, R.; Li, L. Towards a smarter battery management system: A critical review on battery state of health monitoring methods. J. Power Sources 2018, 405, 18–29. [Google Scholar] [CrossRef]
  4. Omar, N.; Van, M.J. Power and life enhancement of battery-electrical double layer capacitor for hybrid electric and charge-depleting plug-in vehicle applications. Electrochim. Acta 2010, 55, 7524–7531. [Google Scholar] [CrossRef]
  5. Murariu, T.; Morari, C. Time-dependent analysis of the state-of-health for lead-acid batteries: An EIS study. J. Energy Storage 2019, 21, 87–93. [Google Scholar] [CrossRef]
  6. Kwiecien, M.; Badeda, J. Determination of SoH of Lead-Acid Batteries by Electrochemical Impedance Spectroscopy. Appl. Sci. 2018, 8, 873. [Google Scholar] [CrossRef]
  7. Sarasketa-Zabala, E.; Martinez-Laserna, E. Realistic lifetime prediction approach for Li-ion batteries. Appl. Energy 2016, 162, 839–852. [Google Scholar] [CrossRef]
  8. Tudoroiu, R.E.; Zaheeruddin, M. Real-Time Implementation of an Extended Kalman Filter and a PI Observer for State Estimation of Rechargeable Li-Ion Batteries in Hybrid Electric Vehicle Applications—A Case Study. Batteries 2018, 4, 19. [Google Scholar] [CrossRef]
  9. Sepasi, S.; Ghorbani, R. Inline state of health estimation of lithium-ion batteries using state of charge calculation. J. Power Sources 2018, 299, 246–254. [Google Scholar] [CrossRef]
  10. Wassiliadis, N.; Adermann, J. Revisiting the dual extended Kalman filter for battery state-of-charge and state-of-health estimation: A use-case life cycle analysis. J. Energy Storage 2018, 19, 73–87. [Google Scholar] [CrossRef]
  11. Ning, B.; Cao, B. Adaptive sliding mode observers for lithium-ion battery state estimation based on parameters identified online. Energy 2018, 153, 732–742. [Google Scholar] [CrossRef]
  12. Wang, Q.; Feng, X. Power battery state of charge estimation based on extended Kalman filter. J. Renew. Sustain. Energy 2019, 11, 014302. [Google Scholar] [CrossRef]
  13. Song, Z.; Hofmann, H. Parameter identification of lithium-ion battery pack for different applications based on Cramer-Rao bound analysis and experimental study. Appl. Energy 2018, 231, 1307–1318. [Google Scholar] [CrossRef]
  14. Yang, D.; Wang, Y. State-of-health estimation for the lithium-ion battery based on support vector regression. Appl. Energy 2018, 227, 273–283. [Google Scholar] [CrossRef]
  15. Sbarufatti, C.; Corbetta, M. Adaptive prognosis of lithium-ion batteries based on the combination of particle filters and radial basis function neural networks. J. Power Sources 2017, 344, 128–140. [Google Scholar] [CrossRef]
  16. Meng, J.; Cai, L. Lithium-ion battery state of health estimation with short-term current pulse test and support vector machine. Microelectron. Reliab. 2018, 88–90, 1216–1220. [Google Scholar] [CrossRef]
  17. Chang, W.Y.; Chang, P.C. Application of Radial Basis Function Neural Network, to Estimate the State of Health for LFP Battery. Int. J. Electr. Electron. Eng. 2018, 7, 1–6. [Google Scholar]
  18. Li, X.; Wang, Z. State-of-health estimation for Li-ion batteries by combing the incremental capacity analysis method with grey relational analysis. J. Power Sources 2019, 410–411, 106–114. [Google Scholar] [CrossRef]
  19. Li, Y.; Monema, M.A. A quick on-line state of health estimation method for Li-ion battery with incremental capacity curves processed by Gaussian filter. J. Power Source 2018, 373, 40–53. [Google Scholar] [CrossRef]
  20. Li, X.; Wang, Z. Prognostic health condition for lithium battery using the partial incremental capacity and Gaussian process regression. J. Power Sources 2019, 421, 56–67. [Google Scholar] [CrossRef]
  21. Feng, X.; Weng, C. Incremental Capacity Analysis on Commercial Lithium-Ion Batteries using Support Vector Regression: A Parametric Study. Energies 2018, 11, 2323. [Google Scholar] [CrossRef]
  22. Zhang, Y.C.; Briat, O. Efficient state of health estimation of Li-ion battery under several ageing types for aeronautic applications. Microelectron. Reliab. 2018, 88–90, 1231–1235. [Google Scholar] [CrossRef]
  23. Dubarry, G.; Baure, A. Devie. Durability and Reliability of EV Batteries under Electric Utility Grid Operations: Path Dependence of Battery Degradation. J. Electrochem. Soc. 2018, 165, 773–783. [Google Scholar] [CrossRef]
  24. Elie, R.; Ali, S. Innovative Incremental Capacity Analysis Implementation for C/LiFePO4 Cell State-of-Health Estimation in Electrical Vehicles. Batteries 2019, 5, 37–50. [Google Scholar]
  25. Peter, K.; Andreas, J. Calendar Aging of NCA Lithium-Ion Batteries Investigated by Differential Voltage Analysis and Coulomb Tracking. J. Electrochem. Soc. 2017, 164, 6066–6074. [Google Scholar]
  26. Peter, C.A.; Ewout, W.S. The number of subjects per variable required in linear regression analyses. J. Clin. Epidemiol. 2015, 68, 627–636. [Google Scholar] [Green Version]
  27. Kristopher, J.P.; Patrick, J. Computational Tools for Probing Interactions in Multiple Linear Regression, Multilevel Modeling, and Latent Curve Analysis. J. Educ. Behav. Statics 2006, 31, 437–448. [Google Scholar]
Figure 1. A 12S28P LiNiCoAlO2 (NCA) series/parallel battery pack for frequency regulation energy storage system (FRESS).
Electronics 08 01118 g001
Figure 2. Discharging/charging current profile for the aging and experimental voltages of the fresh 12S28P NCA series/parallel battery pack: (a) discharging/charging current profile for aging, and (b) experimental discharging/charging voltage.
Electronics 08 01118 g002
Figure 3. Difference in 12 cell voltages of each representative cell, measured using a voltage sensor, in the fresh battery pack consisting 28 parallel-connected cells according to the discharging/charging current profile for aging (4C-rate).
Electronics 08 01118 g003
Figure 4. Difference in 12 cell voltages of each representative cell, measured using a voltage sensor, in the retired series/parallel battery pack consisting of 28 parallel-connected cells according to the discharging/charging current profile for aging (1C-rate).
Electronics 08 01118 g004
Figure 5. Experimental apparatus for the aging cycle test of the NCA cell.
Electronics 08 01118 g005
Figure 6. Aging cycle test of the NCA cell considering a 1C-rate (100 times) and its experimental result (capacity degradation): (a) basic discharging/charging current profile for aging (CC-CV), and (b) capacity degradation considering a 1C-rate (100 times).
Electronics 08 01118 g006
Figure 7. Experimental apparatus for the aging cycle test of the NCA cell.
Electronics 08 01118 g007
Figure 8. Smoothing of the IC curve using a low-pass filter (LPF).
Electronics 08 01118 g008
Figure 9. Discharging/charging voltages of 12 cells in the retired series/parallel battery pack, especially in the narrowed operating voltage range.
Electronics 08 01118 g009
Figure 10. IC curve and three detailed peak points and two valley points of the fresh cell no. 1 according to the aging cycle test.
Electronics 08 01118 g010
Figure 11. IC variation with respect to the cycle and discharge capacity at IC curve valley point 1 according to the aging cycle test (no. 1 cell): (a) cycle and (b) discharge capacity.
Electronics 08 01118 g011
Figure 12. Variation in partial capacity with respect to the cycle and discharge capacity in the short voltage range (3.6–3.7 V) according to the aging cycle test on the no. 1 cell: (a) cycle and (b) discharge capacity.
Electronics 08 01118 g012
Figure 13. IC variation with respect to the SOH according to the IC curve valley point 1 (no. 1 cell): (a) experimental IC curve valley point 1, and (b) comparison between the linear regression model and experimental IC curve valley point 1 (R2 = 0.9774).
Electronics 08 01118 g013
Figure 14. Variation in the partial capacity with respect to the SOH according to the IC curve valley point 1 in the short voltage range (3.6–3.7 V) (no. 1 cell): (a) experimental IC curve valley point 1, and (b) comparison between the linear regression model and experimental IC curve valley point 1 (R2 = 0.9849).
Electronics 08 01118 g014aElectronics 08 01118 g014b
Figure 15. Block diagram of the linear regression model-based SOH estimation.
Electronics 08 01118 g015
Figure 16. Comparison between the linear regression model based on the IC curve peak point of cell no. 1 and a real SOH based on two IC curve peak points of cell nos. 2 and 3.
Electronics 08 01118 g016
Figure 17. Comparison between the linear regression model based on the partial capacity of cell no. 1 and a real SOH based on two partial capacities of cell nos. 2 and 3.
Electronics 08 01118 g017
Figure 18. Comparison of four SOH errors (SOH error = Real SOH − Model SOH): (1) between the linear regression model SOH (cell no. 1) and the real SOH (cell nos. 2 and 3) considering the IC curve peak points, and (2) between the linear regression model SOH (cell no. 1) and a real SOH (cell nos. 2 and 3) considering partial capacities.
Electronics 08 01118 g018
Figure 19. IC curve valley point 1 of the 12 series-connected stage of the retired series/parallel battery pack.
Electronics 08 01118 g019
Figure 20. Disassembling of the retired series/parallel battery pack.
Electronics 08 01118 g020
Figure 21. Discharge capacity and SOH of the 12 series-connected stages of the disassembled retired series/parallel battery pack using a full discharge/charge test (7S series stage of the short circuit): (a) discharge capacity and (b) SOH.
Electronics 08 01118 g021aElectronics 08 01118 g021b
Figure 22. Comparison between the linear regression model based on the IC curve peak point of cell no. 1 and a real SOH based on the IC curve peak point of the 12 series-connected stages of the retired series/parallel battery pack.
Electronics 08 01118 g022
Figure 23. Comparison between the linear regression model based on the partial capacity of cell no.1 and a real SOH based on the partial capacity of the 12 series-connected stages of the retired series/parallel battery pack.
Electronics 08 01118 g023
Figure 24. Comparison of two SOH errors (SOH error = Real SOH − Model SOH) between the linear regression model SOH (cell no. 1) and a real SOH (12 series-connected stages of the retired series/parallel battery pack) considering the IC curve peak point and partial capacity.
Electronics 08 01118 g024
Figure 25. SOH of the retired cell according to the 1C-rate CC-CV aging cycle test (600 times).
Electronics 08 01118 g025
Figure 26. Comparison between the linear regression model based on the IC curve peak point of cell no. 1 cell and a real SOH based on the IC curve peak point of the retired cell.
Electronics 08 01118 g026
Figure 27. Comparison between the linear regression model based on the partial capacity of cell no. 1 and a real SOH based on the partial capacity of the retired cell.
Electronics 08 01118 g027
Table 1. Numerical results for the comparison between the linear regression model based on the IC curve peak point of cell no. 1 and a real SOH based on two IC curve peak points of cell nos. 2 and 3 cells (SOH error = Real SOH − Model SOH).
CellCell No. 2 SOH InformationCell No. 3 SOH Information
CycleReal SOHModel SOHSOH Error (%)Real SOHModel SOHSOH Error (%)
10.9650900.9660020.0912310.9901650.9853050.486000
100.9575250.9547040.2820940.9817650.9760400.572500
200.9505200.9469480.3572280.9750200.9652490.977100
300.9445300.9370650.7465170.9693850.9648790.450600
400.9398800.9361450.3734530.9641800.9562110.796900
500.9340800.9294400.4640220.9593850.9524790.690600
600.9302300.9264270.3802690.9551050.9480510.705400
700.9255000.9222250.3275110.9508950.9417570.913800
800.9219000.9211740.0725710.9471600.9407250.643500
900.9180150.9158190.2196300.9433250.9394660.385900
1000.9148650.9154340.0568760.9397600.9377370.202300
Table 2. Numerical results for comparison between the linear regression model based on the partial capacity of cell no.1 and a real SOH based on two partial capacities of cell nos. 2 and 3 (SOH error = Real SOH − Model SOH).
CellCell No. 2 SOH InformationCell No. 3 SOH Information
CycleReal SOHModel SOHSOH Error (%)Real SOHModel SOHSOH Error (%)
10.9650900.9634190.1670700.9901650.993270−0.310501
100.9575250.9552780.2246840.9817650.987842−0.607760
200.9505200.9471370.3382950.9750200.976987−0.196778
300.9445300.9389950.5534070.9693850.974274−0.488908
400.9398800.9362820.3597770.9641800.968846−0.466667
500.9340800.9254270.8652590.9593850.963419−0.403426
600.9302300.9254270.4802590.9551050.957991−0.288685
700.9255000.9200000.5500000.9508950.955278−0.438315
800.9219000.9172860.4613700.9471600.949850−0.269074
900.9180150.9172860.0728700.9433250.947137−0.381204
1000.9148650.9145720.0292400.9397600.947137−0.737704
Table 3. Numerical results for comparing between the linear regression model based on the IC curve peak point of cell no.1 and a real SOH for the IC curve peak point of the 12 series-connected stages of the retired series/parallel battery pack (SOH error = Real SOH − Model SOH).
Number of Series Connected StageReal SOHModel SOHSOH Error (%)
1S0.9231100.9209010.220840
2S0.9247750.9209390.383523
3S0.8898150.897681−0.786691
4S0.8957850.899409−0.362452
5S0.9168250.9155650.125961
6S0.9333650.9293140.405027
8S0.9389950.9372690.172511
9S0.9332200.9244520.876734
10S0.9621800.970388−0.820893
11S0.9375200.9308290.669058
12S0.9518950.957149−0.525449
Table 4. Numerical results for the comparison between the linear regression model based on the partial capacity of cell no. 1 and a real SOH based on the partial capacity of the 12 series-connected stages of the retired series/parallel battery pack (SOH error = Real SOH − Model SOH).
Number of Series Connected StageReal SOHModel SOHSOH Error (%)
1S0.923110.9083451.476536
2S0.9247750.9116011.317391
3S0.8898150.8852780.453685
4S0.8957850.8907060.507944
5S0.9168250.9023741.445051
6S0.9333650.9156721.769336
8S0.9389950.9276121.138306
9S0.933220.9118722.134754
10S0.962180.9854142.323384
11S0.937520.9270691.04508
12S0.9518950.9951834.328818
Table 5. Numerical results for comparison between the linear regression model based on the IC curve peak point of cell no.1 and a real SOH for the IC curve peak point of a retired cell (SOH error = Real SOH − Model SOH).
CycleReal SOHModel SOHSOH Error (%)
10.9866390.9866390.867415
300.9750.9750.576596
600.963050.963050.007766
900.941250.941250.753881
1200.9310.9310.226191
1500.912650.912650.264107
1800.896990.896991.303744
2100.8930.8930.849753
2400.8910.8910.458948
2700.874750.874750.268324
3000.8687560.8687560.31217
3300.848250.848250.66615
3600.85820.85820.968274
3900.8239130.8239130.103044
4200.822250.822250.130594
4500.8174380.8174380.631443
4800.810.810.633386
5100.80.80.585745
5400.784950.784950.333081
5700.77950.77950.01941
6000.7706950.7706950.469788
Table 6. Numerical results for the comparison between the linear regression model based on the IC curve peak point of cell no. 1 and a real SOH for the IC curve peak point of the retired cell (SOH error = Real SOH − Model SOH).
CycleReal SOHModel SOHSOH Error (%)
10.9866390.9924690.583047
300.9750.9838260.882632
600.963050.9695390.648867
900.941250.941680.042978
1200.9310.9366390.563908
1500.912650.9294841.68344
1800.896990.9124211.543112
2100.8930.9170282.402849
2400.8910.9351294.41289
2700.874750.897492.273982
3000.8687560.8952652.650909
3300.848250.87732.904986
3600.85820.8768111.86114
3900.8239130.8601633.625032
4200.822250.8510852.883548
4500.8174380.8466082.917037
4800.810.8311672.116689
5100.80.8125511.255088
5400.784950.80812.315041
5700.77950.804832.533039
6000.7706950.7930122.231771

