Article

The Effectiveness of TMDS Coding in Counteracting the Non-Invasive Acquisition of Graphic Data

Electromagnetic Compatibility Department, Military Communication Institute, 05-130 Zegrze Poludniowe, Poland
*
Author to whom correspondence should be addressed.
Electronics 2019, 8(10), 1063; https://doi.org/10.3390/electronics8101063
Submission received: 14 August 2019 / Revised: 17 September 2019 / Accepted: 18 September 2019 / Published: 20 September 2019
(This article belongs to the Section Computer Science & Engineering)

Abstract

:
Modern video display terminals commonly use digital video signals. Transition minimized differential signaling (TMDS) coding implemented in video signal transmission using DVI (Digital Visual Interface) standard is commonly used. The aim of the coding scheme adopted by this solution is to eliminate the constant component of the electrical signal, increase the resistance to electromagnetic (EM) interference, and reduce electronic interference between cables. Professionals and hobbyists interested in the problems relating to protecting information against electromagnetic infiltration believe that TMDS coding, in contrast to the VGA (Video Graphics Array) analogue standard, significantly improves the electromagnetic security of processed graphic information. This paper shows a comparison of the abovementioned standards in terms of information protection against electromagnetic infiltration. The paper presents the results of computer simulations and studies dealing with practical compromising emanations for DVI standard and its susceptibility to electromagnetic radiation spying. The obtained results show that the commonly expressed ideas of digital standards being fully secure are false. The obtained test results show that the level of electromagnetic protection can be increased by using appropriate pairs of colors for the text and background. This solution has to be connected with a mode that smooths the edges of graphic signs. Then, the number of frequencies in which valuable emissions exist can be limited. In this paper, pairs of colors for which the level of protection of information can be increased are shown. The authors present their analyses on the basis of the method of colors. The method is connected to possibilities of selection of smoothing modes of edges. As Windows is the most commonly used system in classified work stations (so-called TEMPEST computers), this operating system was considered from the viewpoint of the protection of processed information.

1. Introduction

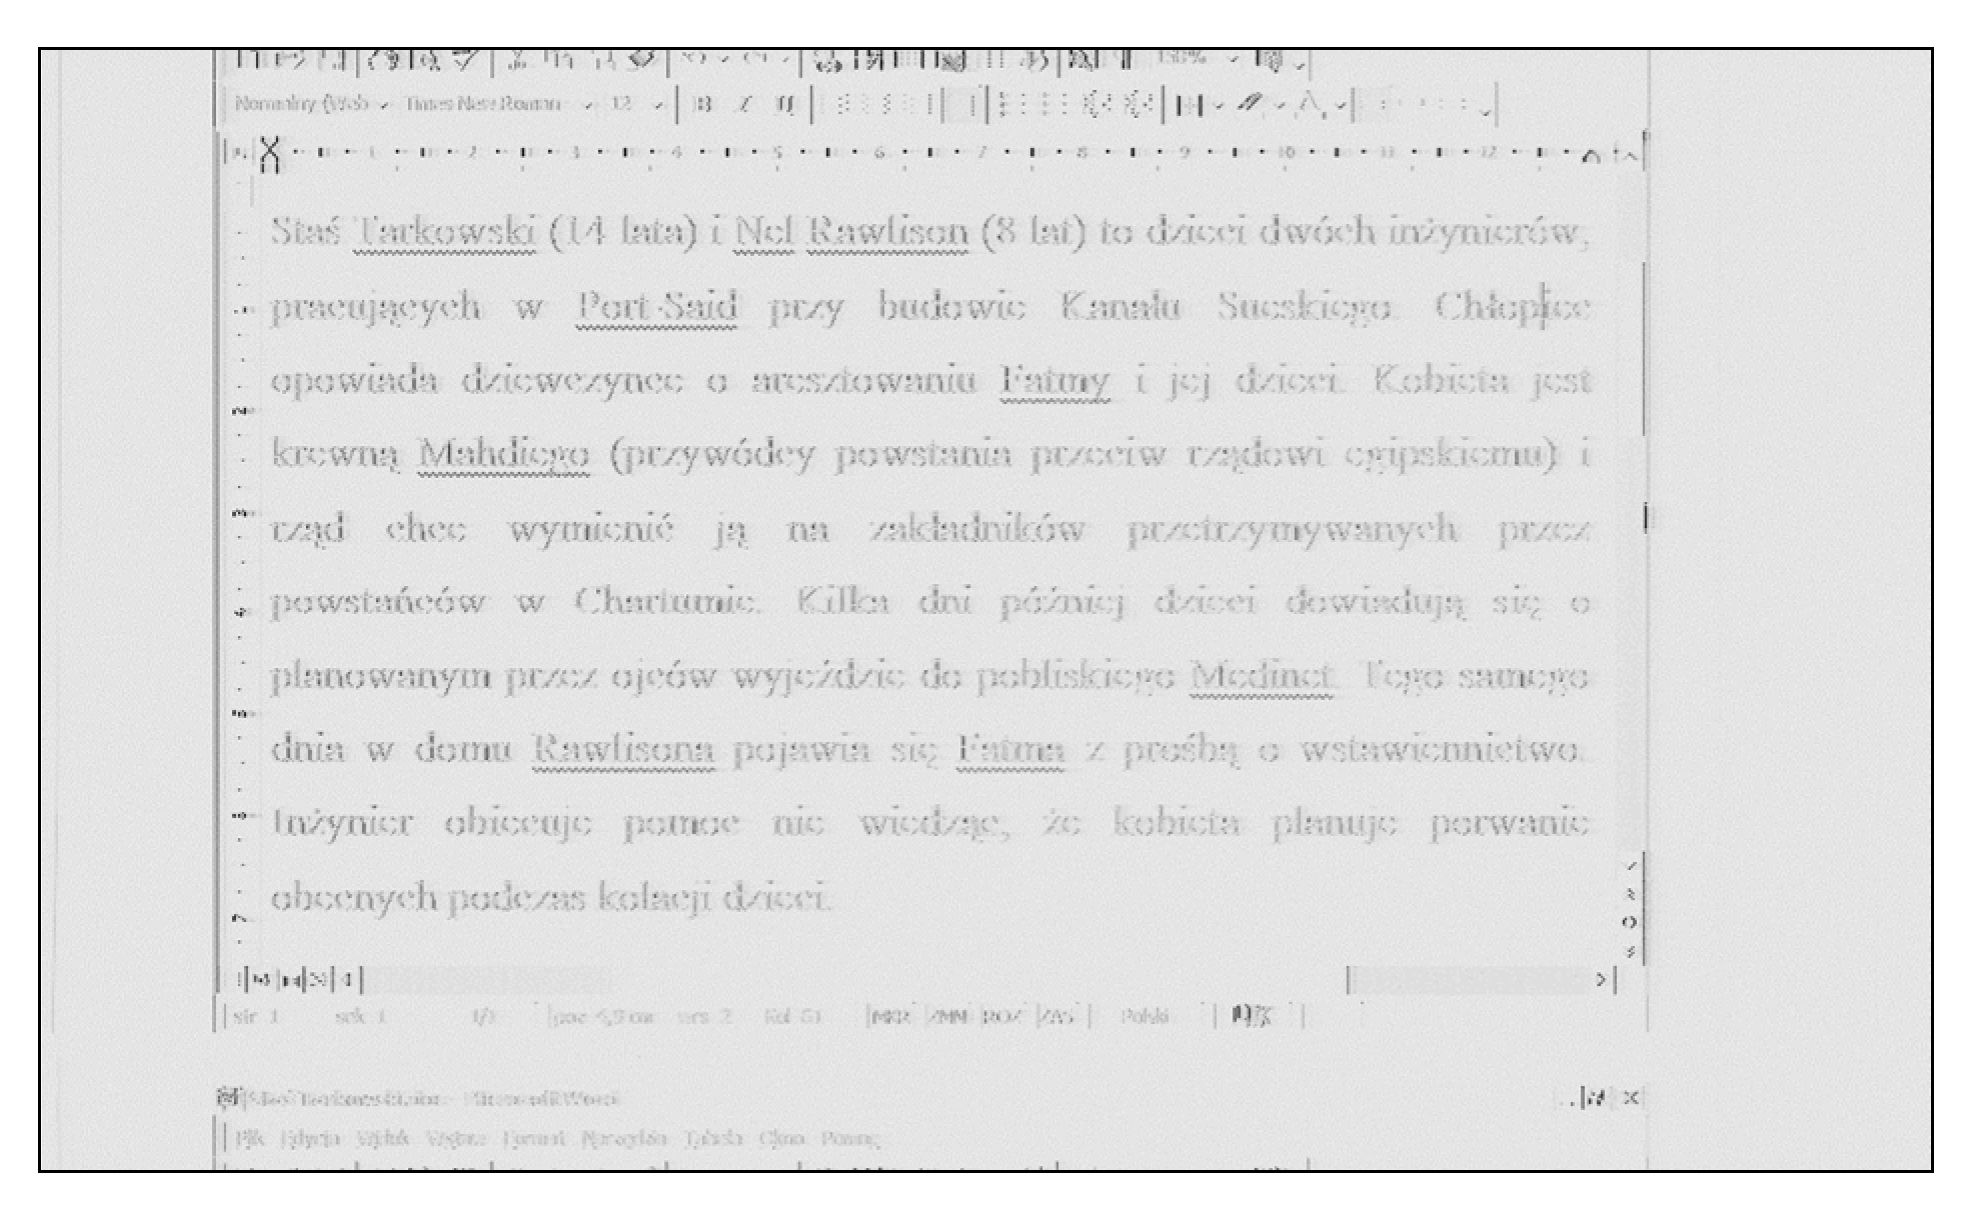
Because electronic devices are commonly used to process data, the risk related to the potential for electromagnetic radiation spying and non-invasive data acquisition still exists (Figure 1) [1,2,3,4,5,6,7,8].
This is dangerous because it leaves no trace of “intrusion”, and the loss of data is discovered too late. As newly available data acquisition methods appear, we need new methods to counteract this phenomenon [9,10,11]. This is especially true when a growing number of new technological achievements are used to process data. Currently, it is common to process text data and transmit it to a device for graphic imaging by using the DVI digital standard [12]. Cathode ray tube (CRT) monitors [13] have been replaced by liquid crystal (LCD) displays. To allow users to operate a LCD panel in a more comfortable way, it is required to use software technology to improve the appearance of fonts displayed on the screen. Font edge smoothing mechanisms are being introduced in operating systems. Windows OS versions use the ClearType solution. In general, the solution adds specific stains on both sides of fonts. Practical impacts of the abovementioned compromising emanations signals will be presented below.
The risk of electromagnetic information infiltration can appear as a result of electromagnetic fields being generated by an electronic device that processes encoded data in the form of electrical signal changes [14,15,16]. We can minimize the abovementioned risk by:
  • restricting the potential uncontrolled propagation and reducing the resulting electromagnetic emissions (spatial separation, screening, filtration) [17];
  • appropriately forming the sources of those emissions (i.e., by reducing their effectiveness) [2,18,19,20].
In the first case, the levels of electromagnetic emissions are reduced to levels where any attempt to retrieve data from recorded emissions and present it in a graphical form (images) fails [21,22]. Forming a source of compromising emanations without having a significant impact on their absolute values results in losing their distinctive features (correlation with processed information), and thus, the data retrieved from the recorded compromising emanations and presented in graphical form remains illegible and useless (e.g., safe font) [23,24]. In this case, another advantage is the opportunity to reduce the energy radiated in the form of an electromagnetic field. This can be achieved by reducing both the changes in signal amplitude and by limiting the range of changes in the values of those amplitudes [2].
The whole device filtration and screening method is a classic approach, and is the most frequently used method for the electromagnetic protection of processed data [25,
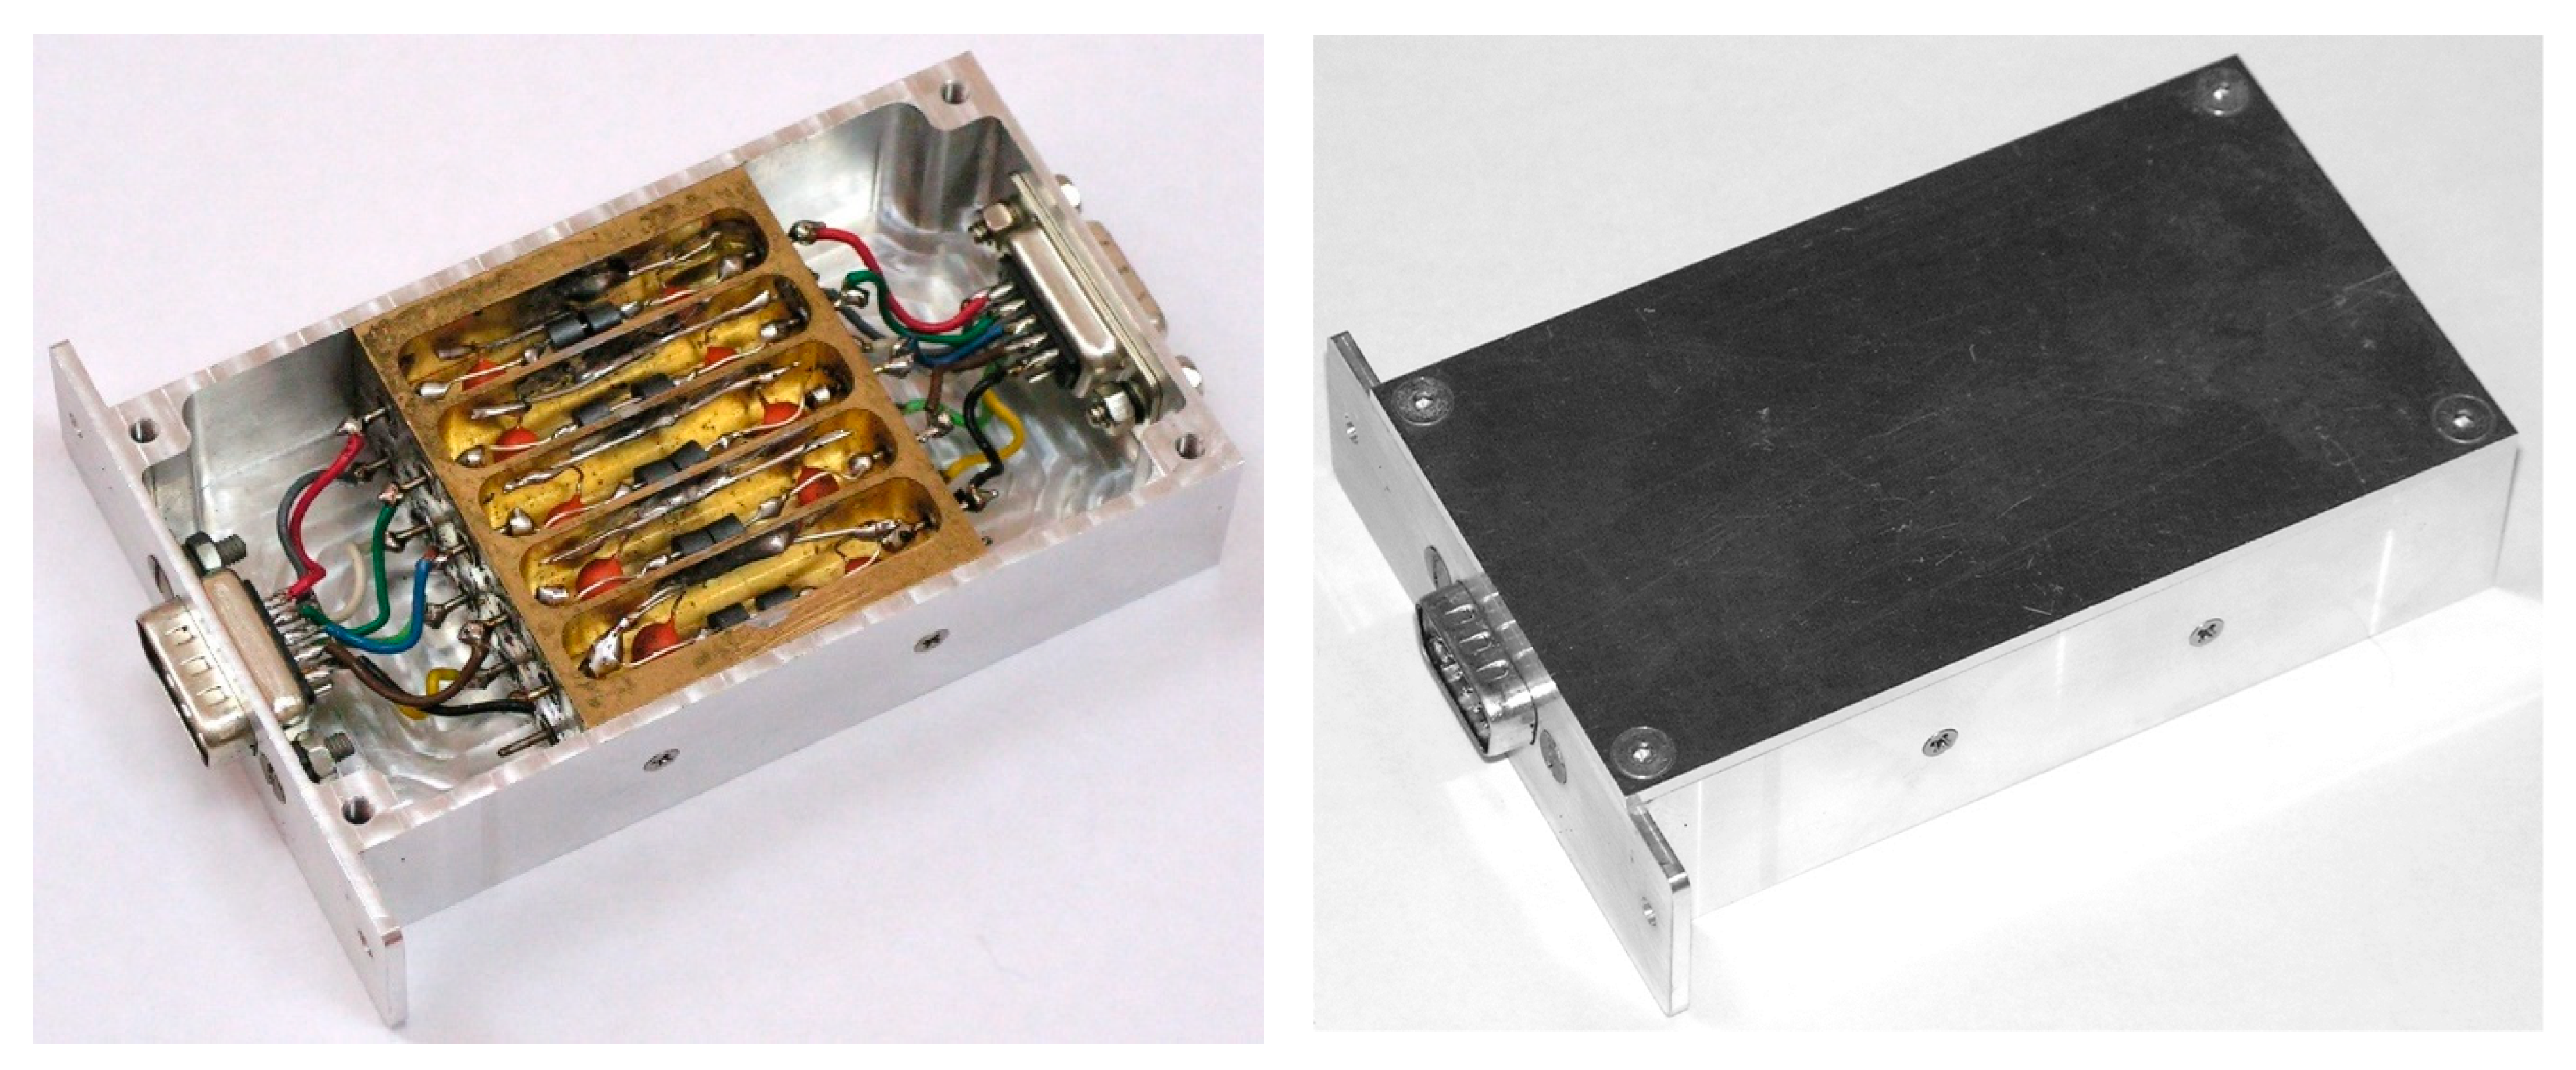
26]. However, because of the impact on the appearance and weight of devices, we are looking for alternative solutions. For the VGA analogue standard, this protection adopts the form of video signal filtration. This solution has been presented by Kuhn [1,3] and by the authors of this paper in the form of the so-called filtration forming module (Figure 2) [26].
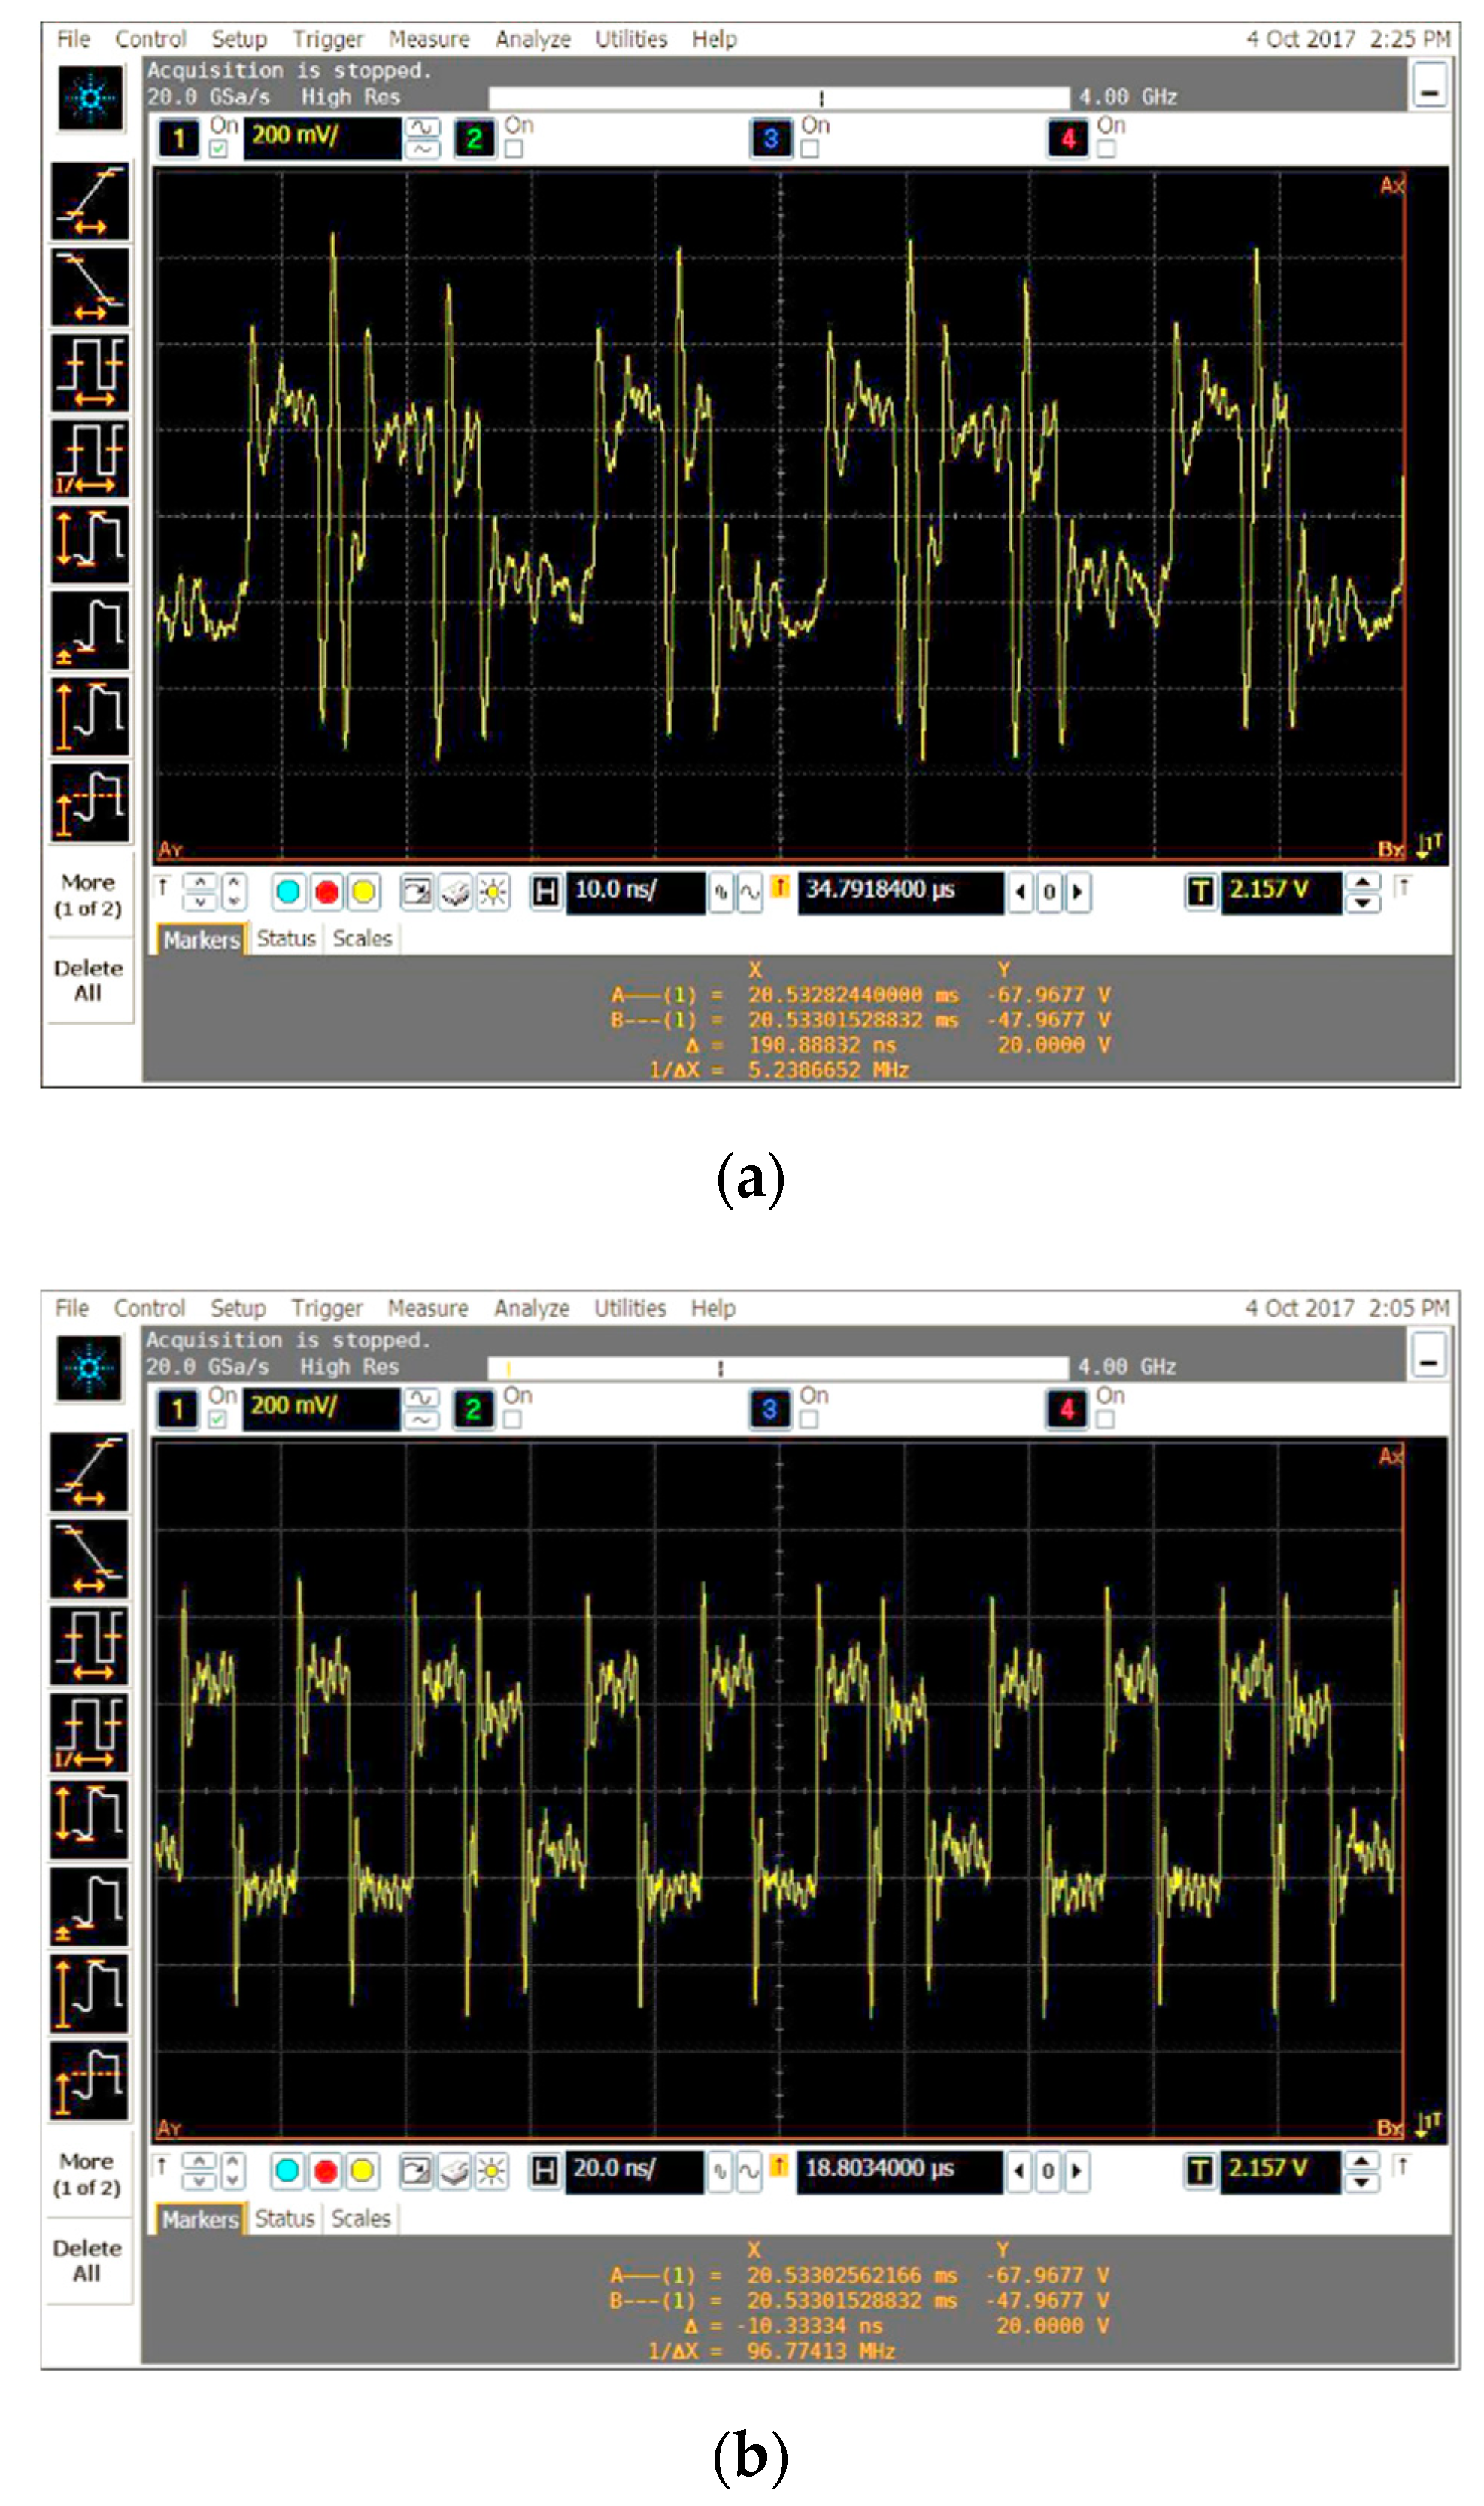
The aim of the abovementioned methods is to limit a signal spectrum by removing higher frequency components. Kuhn suggests removing 30% of the upper spectral frequency components. Those procedures increase the rise and fall time for electrical signals (as observed in the form of electrical signal voltage fluctuations that are subject to significant reduction (Figure 3)) used to convey the processed information. This solution results in blurred vertical and diagonal edges of fonts displayed on the computer screen. The analogue source (VGA) electromagnetic infiltration process then becomes significantly more difficult (side channel attacks (SCAs) for radiated emissions have the nature of a high-pass filter, where higher components propagate much better. These are the higher components that are mainly responsible for retrieving information).
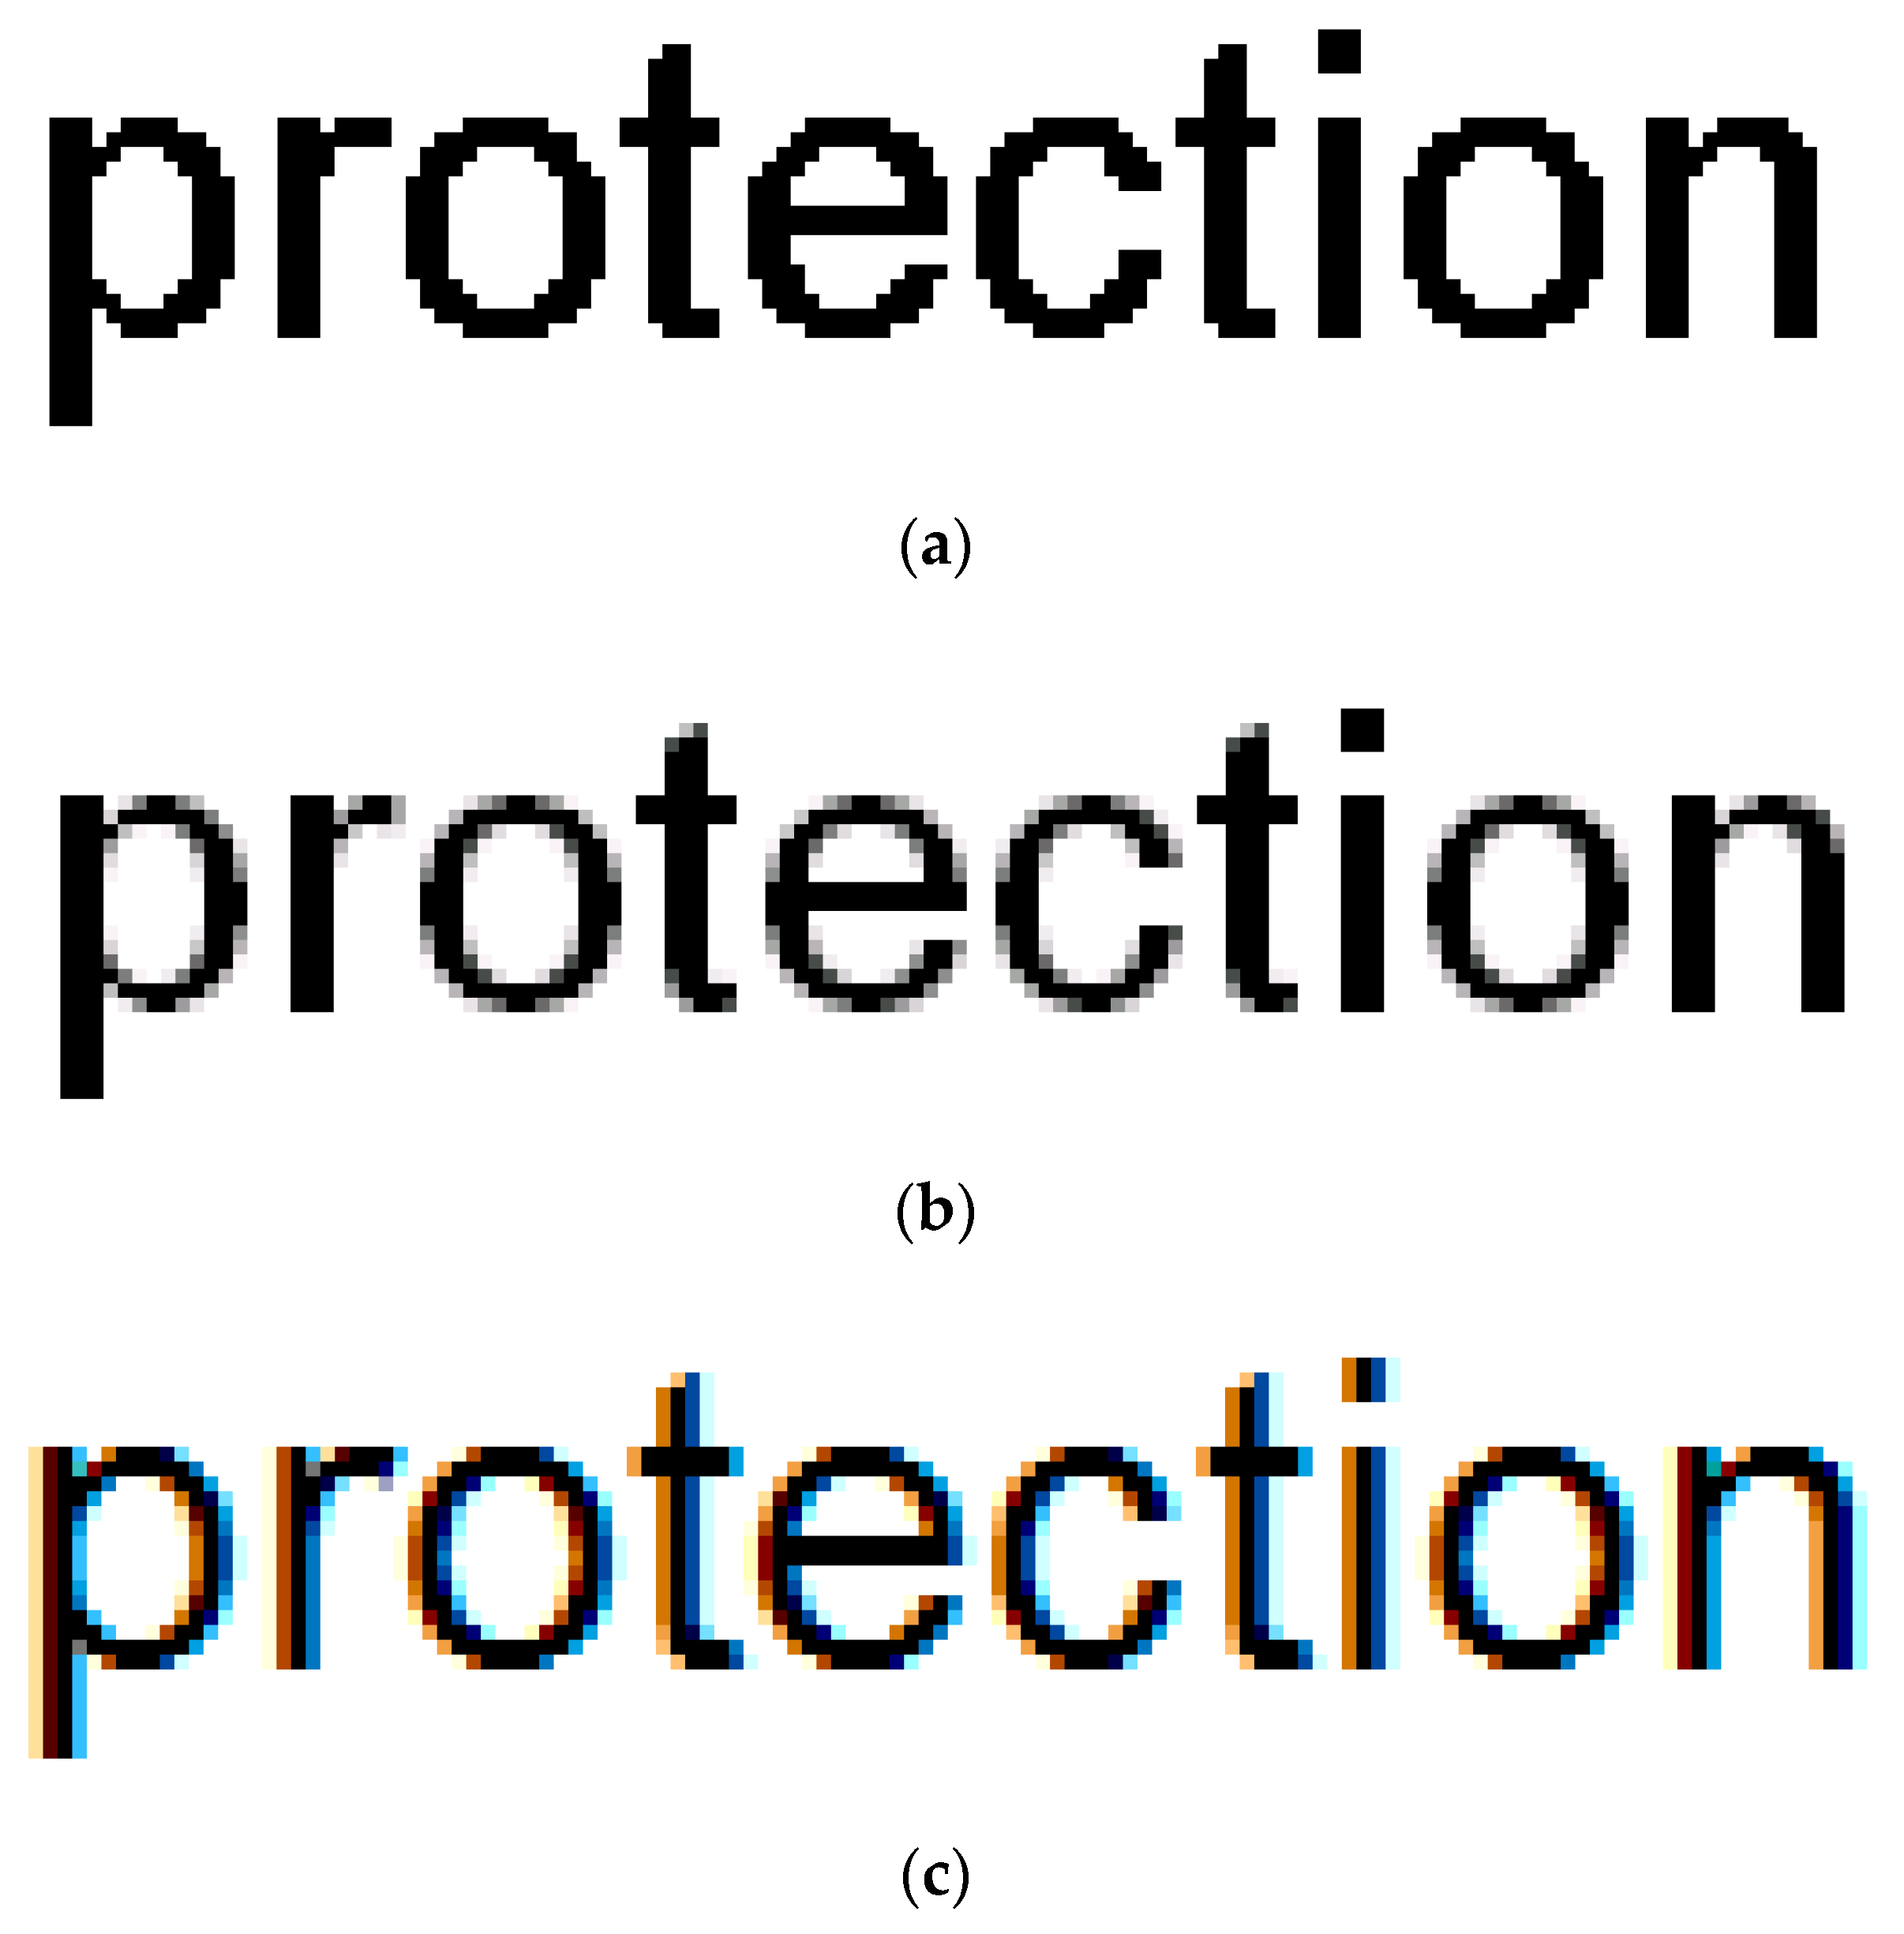
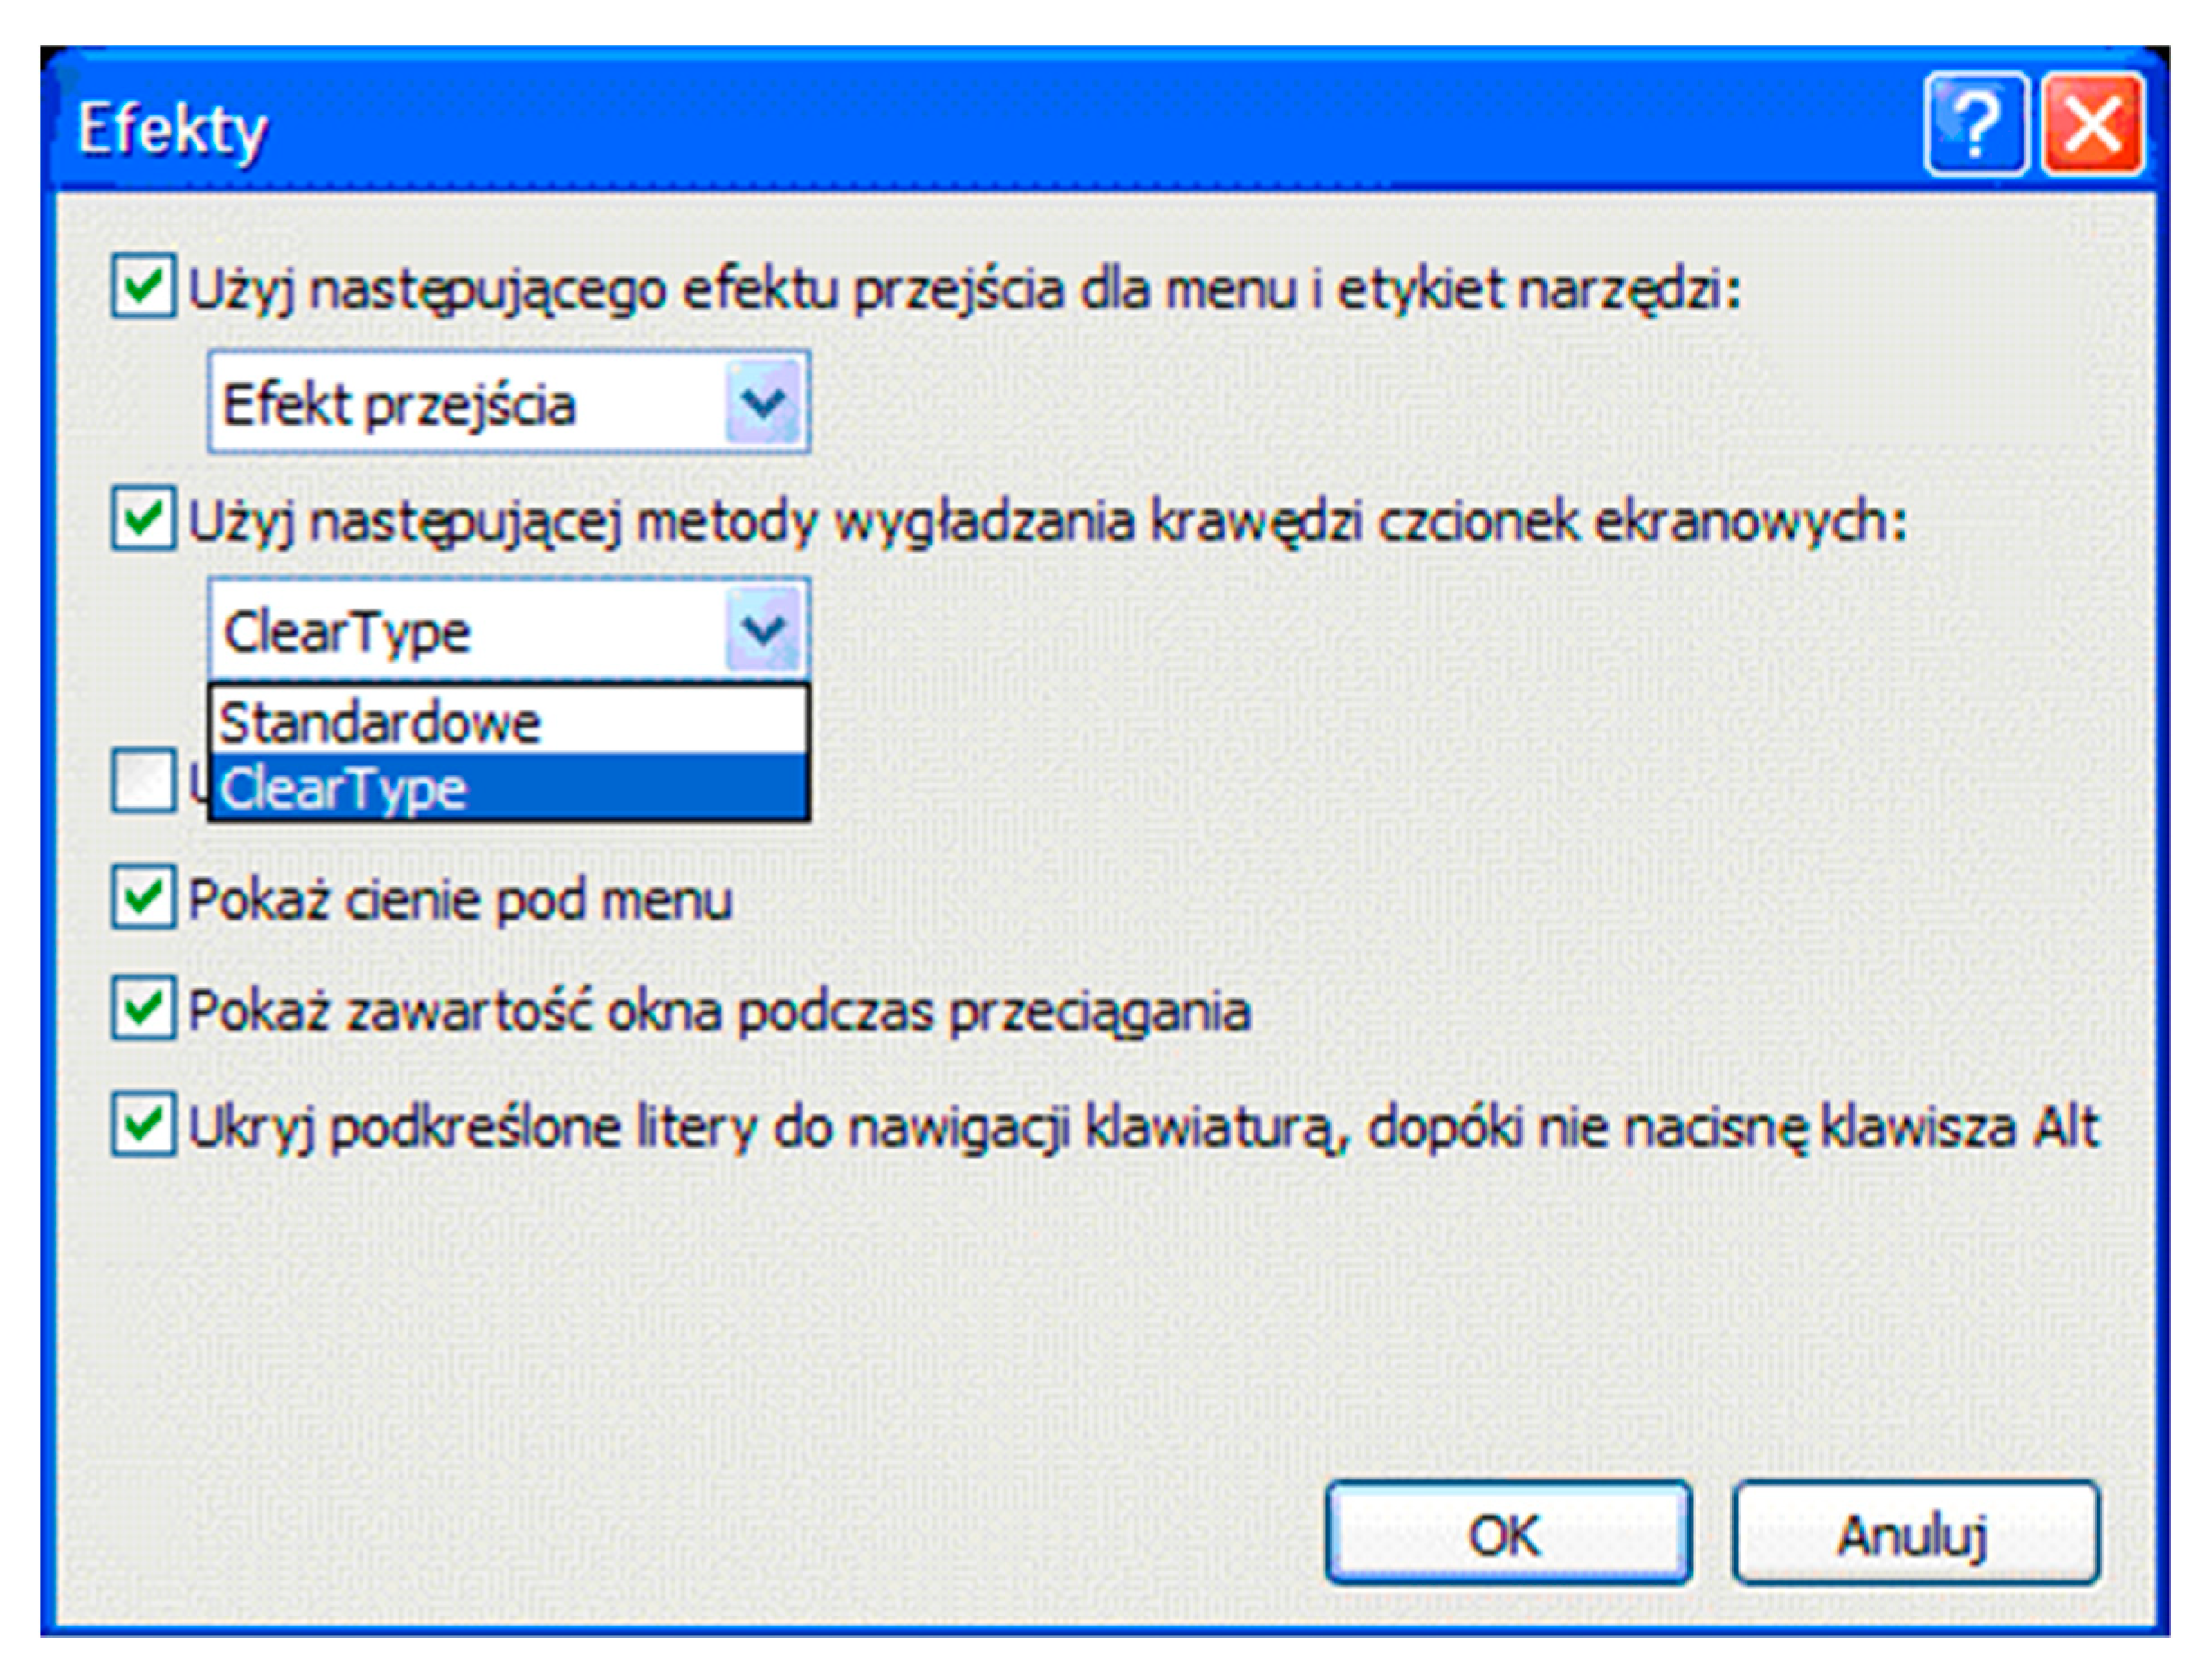
Similar effects are also obtained when using the abovementioned solution in the form of ClearType or Standard smoothing options. Enabling one of the options results in a slight blur of font edges (soft transition of colors from the background color and the font color for vertical and diagonal edges (ClearType) or only for the diagonal edges (Standard), Figure 4), which improves the quality of characters displayed on LCD screens. Grey scale discolorations (Standard smoothing mode) or discolorations for various colors (ClearType smoothing mode) are added for this purpose. The smoothing option can be disabled, but only in Windows XP OS, where the procedure is fully effective. When starting from Windows 7 it is impossible to fully disable the font edge smoothing.
The solution involving restricting the video signal spectrum can be used only in VGA analogue standard mode, where a significant signal spectrum limitation will result in blurred characters being displayed, but it will not stop the operation (e.g., by shutting down the monitor). However, this solution is not universal.
Because of changes in electrical parameters combined with the changes in displayed image parameters, it would be necessary to change the filter parameters accordingly, which, consequently, makes the process more difficult to perform. In the case of digital signals, even a slight change in signal parameters may result in final device malfunctions. In the DVI standard, this is expressed by displaying misshaped pixels or by shutting down the monitor [27].
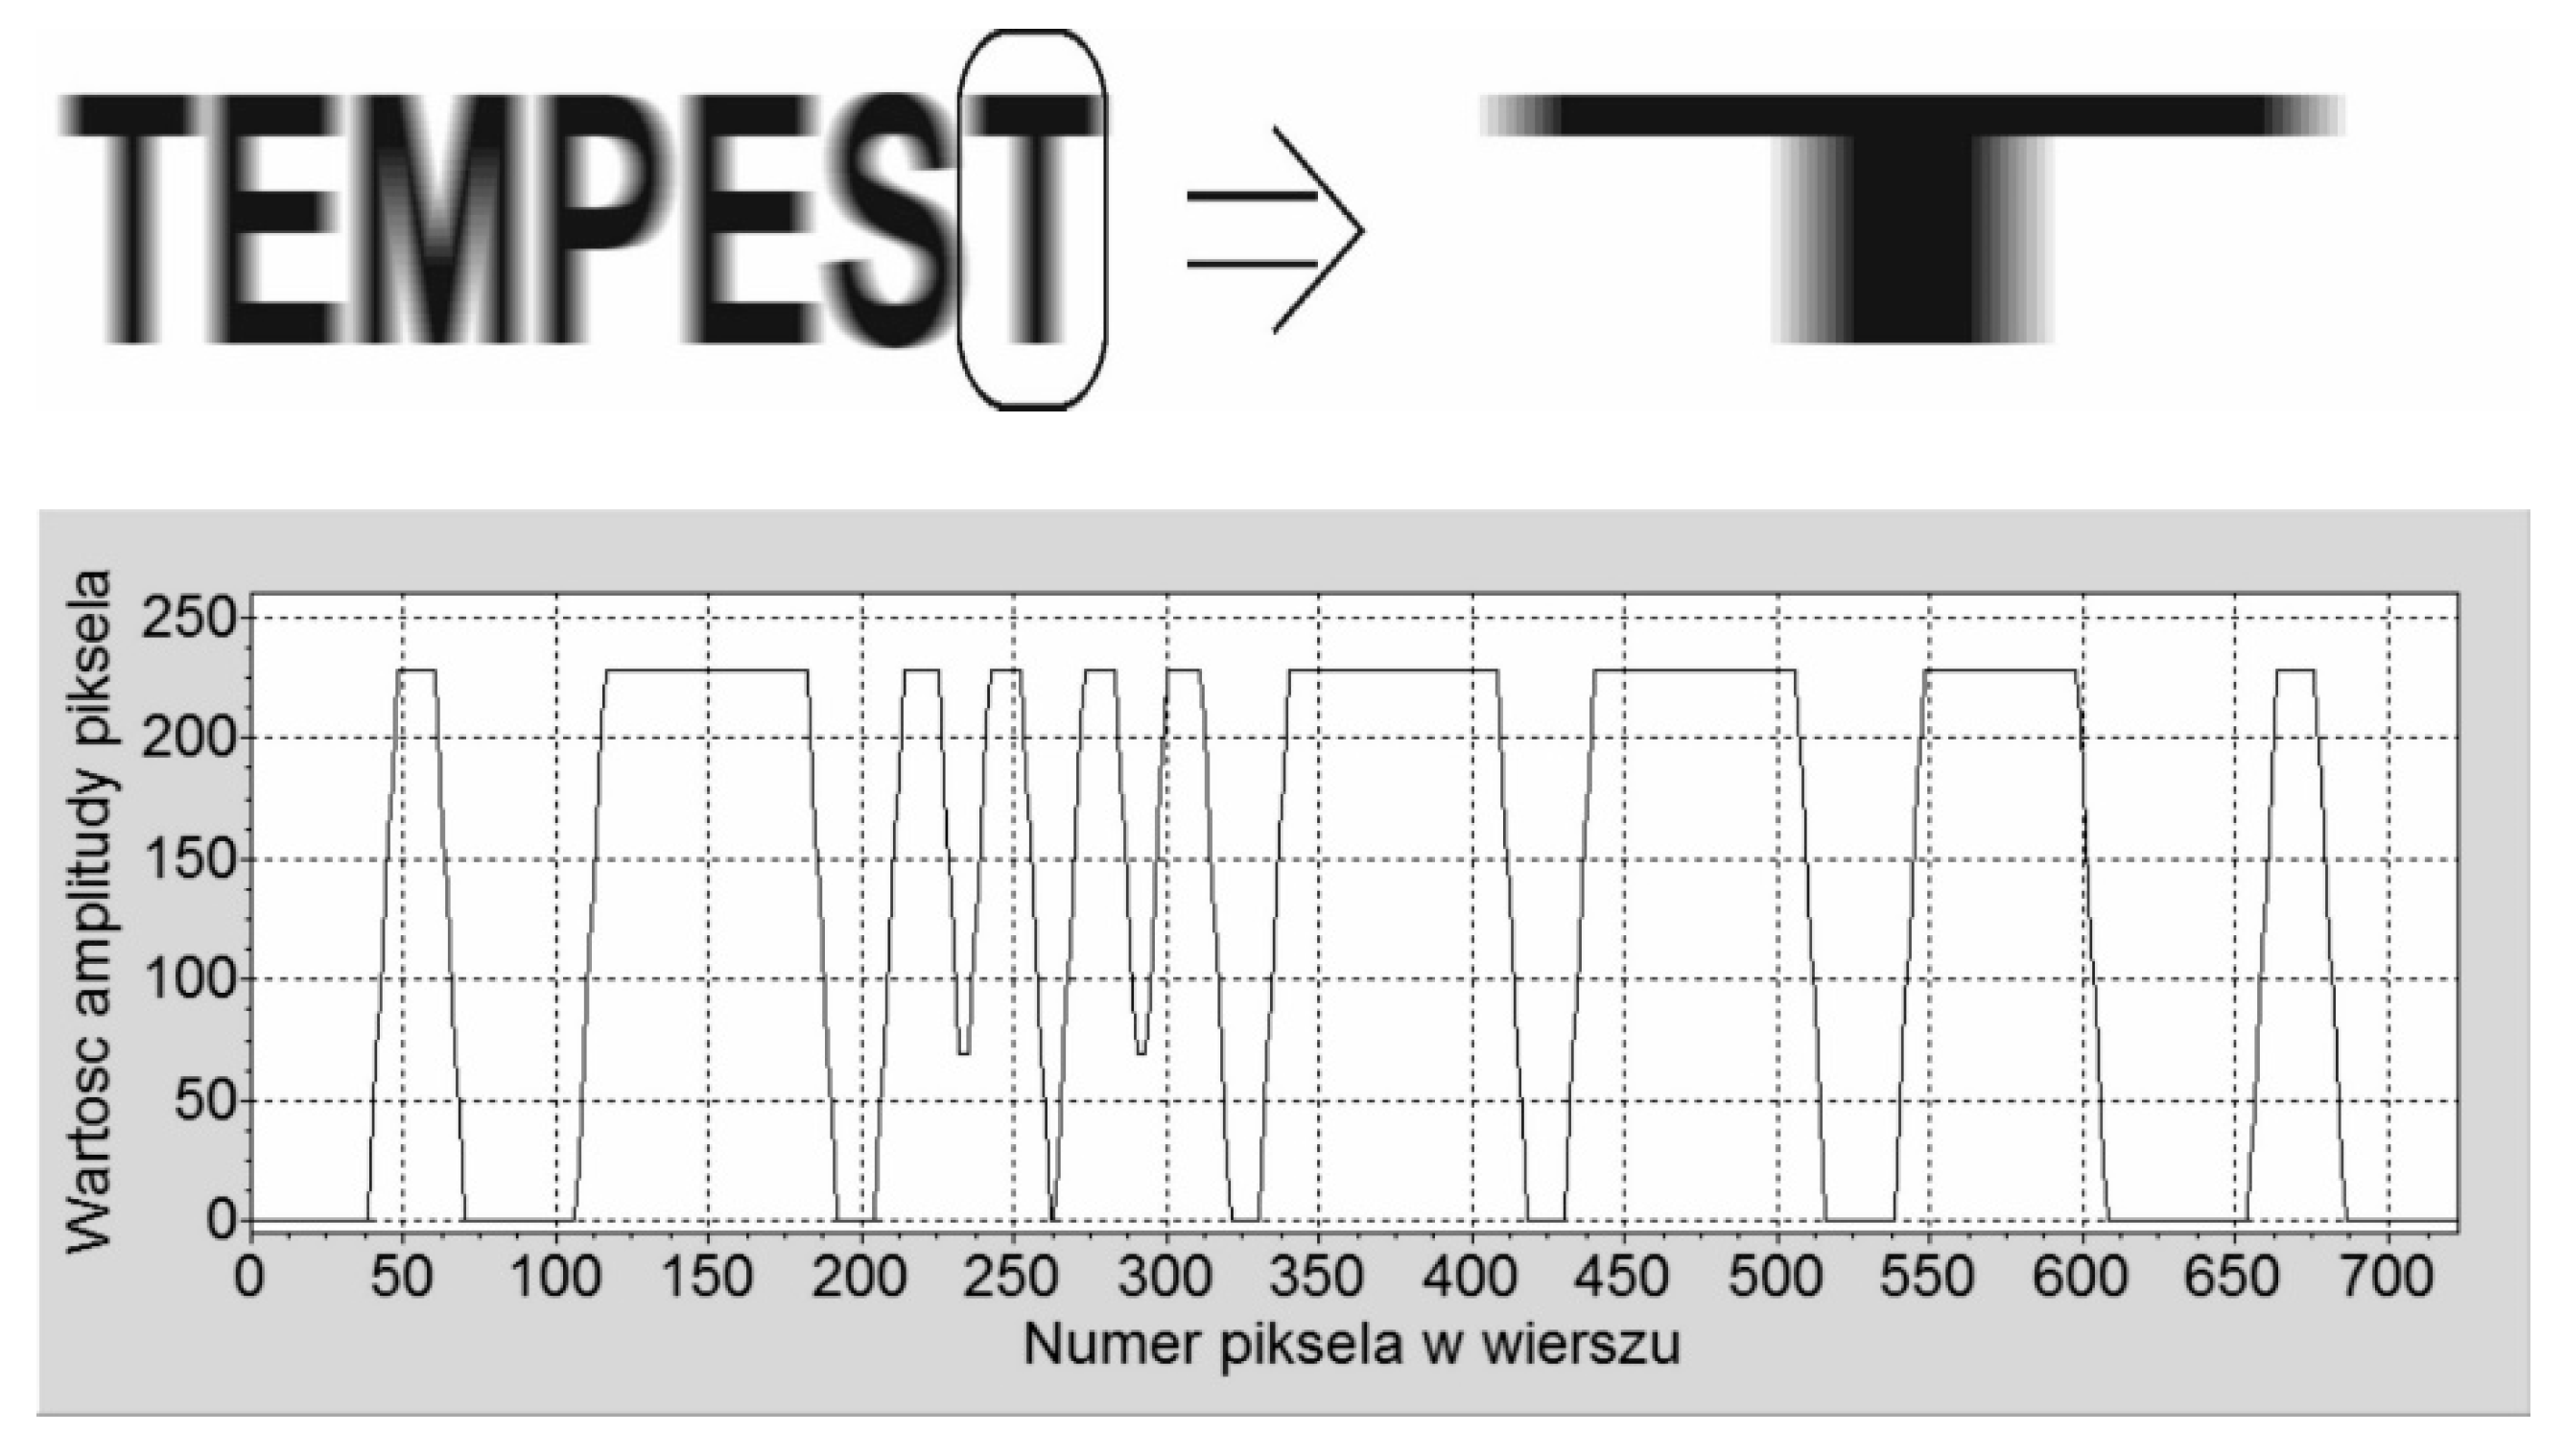
Another significant method for protecting information includes using specially designed desktop fonts [10], referred to as secure fonts or TEMPEST fonts. This method is important because of its versatility. The fonts used in electromagnetic protection of processed text data have been found to be effective for VGA, DVI standard, and laser printers [10,23,28]. In addition, they are resistant to the optical character recognition method implemented in the commonly used OCR (Optical Character Recognition) software. The secure fonts are composed of only vertical and horizontal lines of various widths. They do not include any diagonal lines or any kind of decorative components. The characters look similar, yet at the same time are distinguishable and allow text data to be edited. The weak distinctive features of fonts that allow us to tell the difference between them disappear after passing through SCAs. By using a visual analysis (basic method for assessing compromising emanations) supported by correlative analysis, it is impossible to identify individual characters. In spite of the high resistance to electromagnetic infiltration shown by secure fonts, their introduction may face resistance from users caused by the discomfort that may be encountered in the initial stage of use.
The main purpose of this article is to present the risk of the loss of information, which is processed in IT devices using the digital DVI standard. This risk is connected with the possibility of non-invasive data acquisition using valuable emissions, of which the digital standard is a source. Simultaneously, a new solution in the form of the colors method is presented, which could support the protection of processed information. In the case of text data, pairs of colors for texts and backgrounds were selected, which decrease the sensitivity of the source of valuable emissions to electromagnetic infiltration processes.

2. Transition Minimized Differential Signaling (TMDS) Coding

Many ordinary users and IT system administrators share the view that the use of the DVI standard effectively eliminates the risk of electromagnetic information leakage. This belief is related to the fact that DVI is a digital standard that uses digitally encoded signals for transmission, and to decode information it is necessary to recover their original bit structure. However, many results of practical experiments show that the use of the DVI standard does not completely eliminate the risk of electromagnetic eavesdropping.
It should be remembered that the development of the DVI interface was associated with the emergence of modern digital displays, for which there was a need to create an interface for sending broadband signals from a digital source to a digital information receiver. The main purpose of using TMDS encoding and LVDS (Low-Voltage Differential Signaling) transmission was to ensure undistorted, error-free transmission between them. The 8-bit coding used was intended to reduce the level and interaction of electromagnetic emissions arising from changes in signals, but not to encrypt information.
However, as in the case of VGA video signals, it turns out that electromagnetic information capture boils down to recognizing the moment the signal (color information) changes, not its value. An additional consideration is the fact that DVI interface signals are transmitted in accordance with the VGA interface rules (VESA (Video Electronics Standards Association) and Industry Standards and Guidelines for Computer Display Monitor Timing).
Let us take a closer look at the process of creating a DVI signal. The 8-bit data generated in the graphics card is in the following form:
q l = a 7 × 2 7 + a 6 × 2 6 + a 5 × 2 5 + a 4 × 2 4 + a 3 × 2 3 + a 2 × 2 2 + a 1 × 2 1 + a 0 × 2 0
where ak is 1 or ak is 0 (k = 0, ..., 7), also l = 0, ..., 255, using specific rules (XOR operations, XNOR, bits stuffing) these are processed to 10-bit form, whose examples are shown in the Table 1. In practice, it is as shown in Figure 5.
By analyzing the above presented examples for numbers written in TMDS code (Table 1) that determine display of the abovementioned colors on a screen, we can find that even a slight disorder in its logic sequence can disable its recovery and reading of data from the resulting string of numbers “0” and “1”.
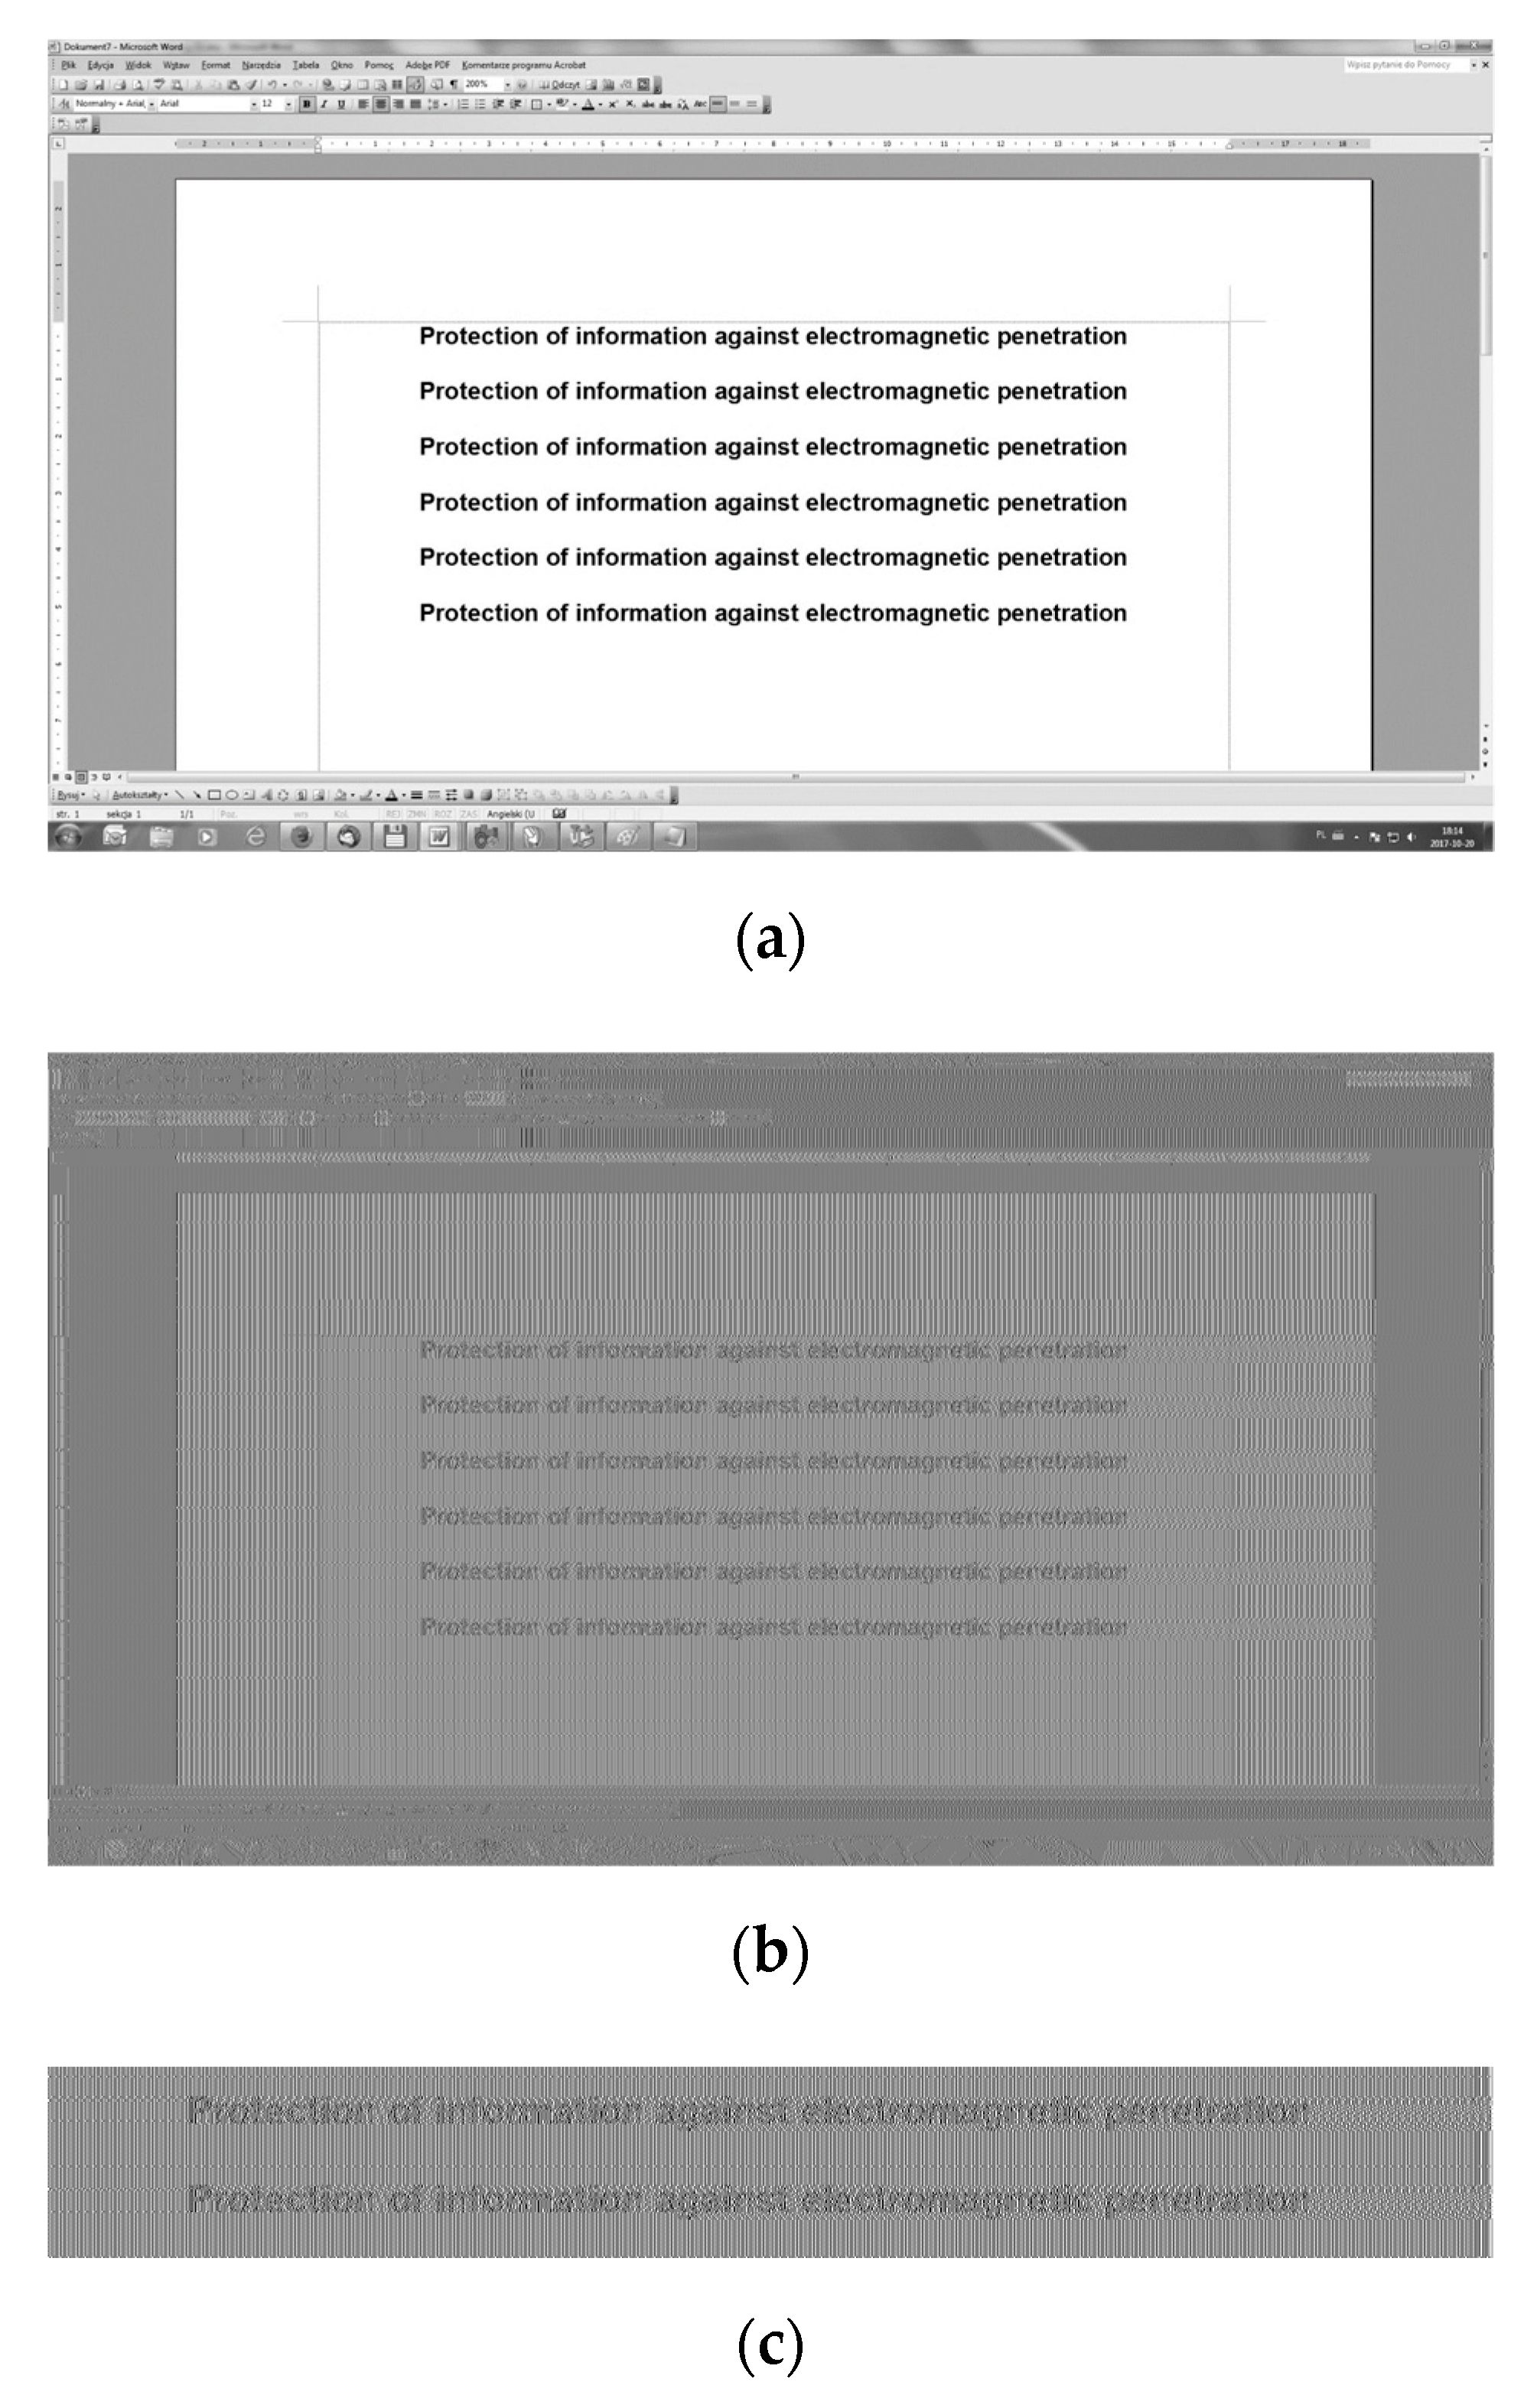
Furthermore, the image obtained from the TMDS algorithm coded signal is almost invisible to the eye, which confirms that the example image is subject to TMDS coding, as shown in Figure 6a. Its form after coding (see computer simulation), and subsequently after recovering from the resulting original signal, is presented in Figure 6b. Any attempts to read the processed text fail.
However, this does not mean that TDMS encoding (i.e., DVI standard) is resistant to electromagnetic radiation spying [1]. An electrical signal in the form of zeroes and ones arranged in sequence is a source of compromising emanations.
The radiated emission propagates in the space around the source and is subject to SCA (i.e., a filter acting the same way as a high-pass filter). As a result of such original signal distortions, the high-pass filtration of the (TMDS) coded signal, and the effect of the reception band of the measuring receiver (signal module), the form of compromising emanations becomes fully usable in the process of electromagnetic infiltration [29]. Figure 7 presents the image obtained from the signal shown in Figure 6b subjected to the abovementioned operations (calculating the derivative, i.e., the operation equal to the effect of a high-pass filter and calculating a signal module). The above-presented example shows that the transition of a coded video signal compliant with the TMDS algorithm through SCA makes it invisible to the human eye without having to decode the digital signal. Therefore, the DVI standard, similar to the VGA standard, must be subject to electromagnetic protection, contrary to belief regarding its security.

3. Materials and Methods

3.1. Theoretical Analysis

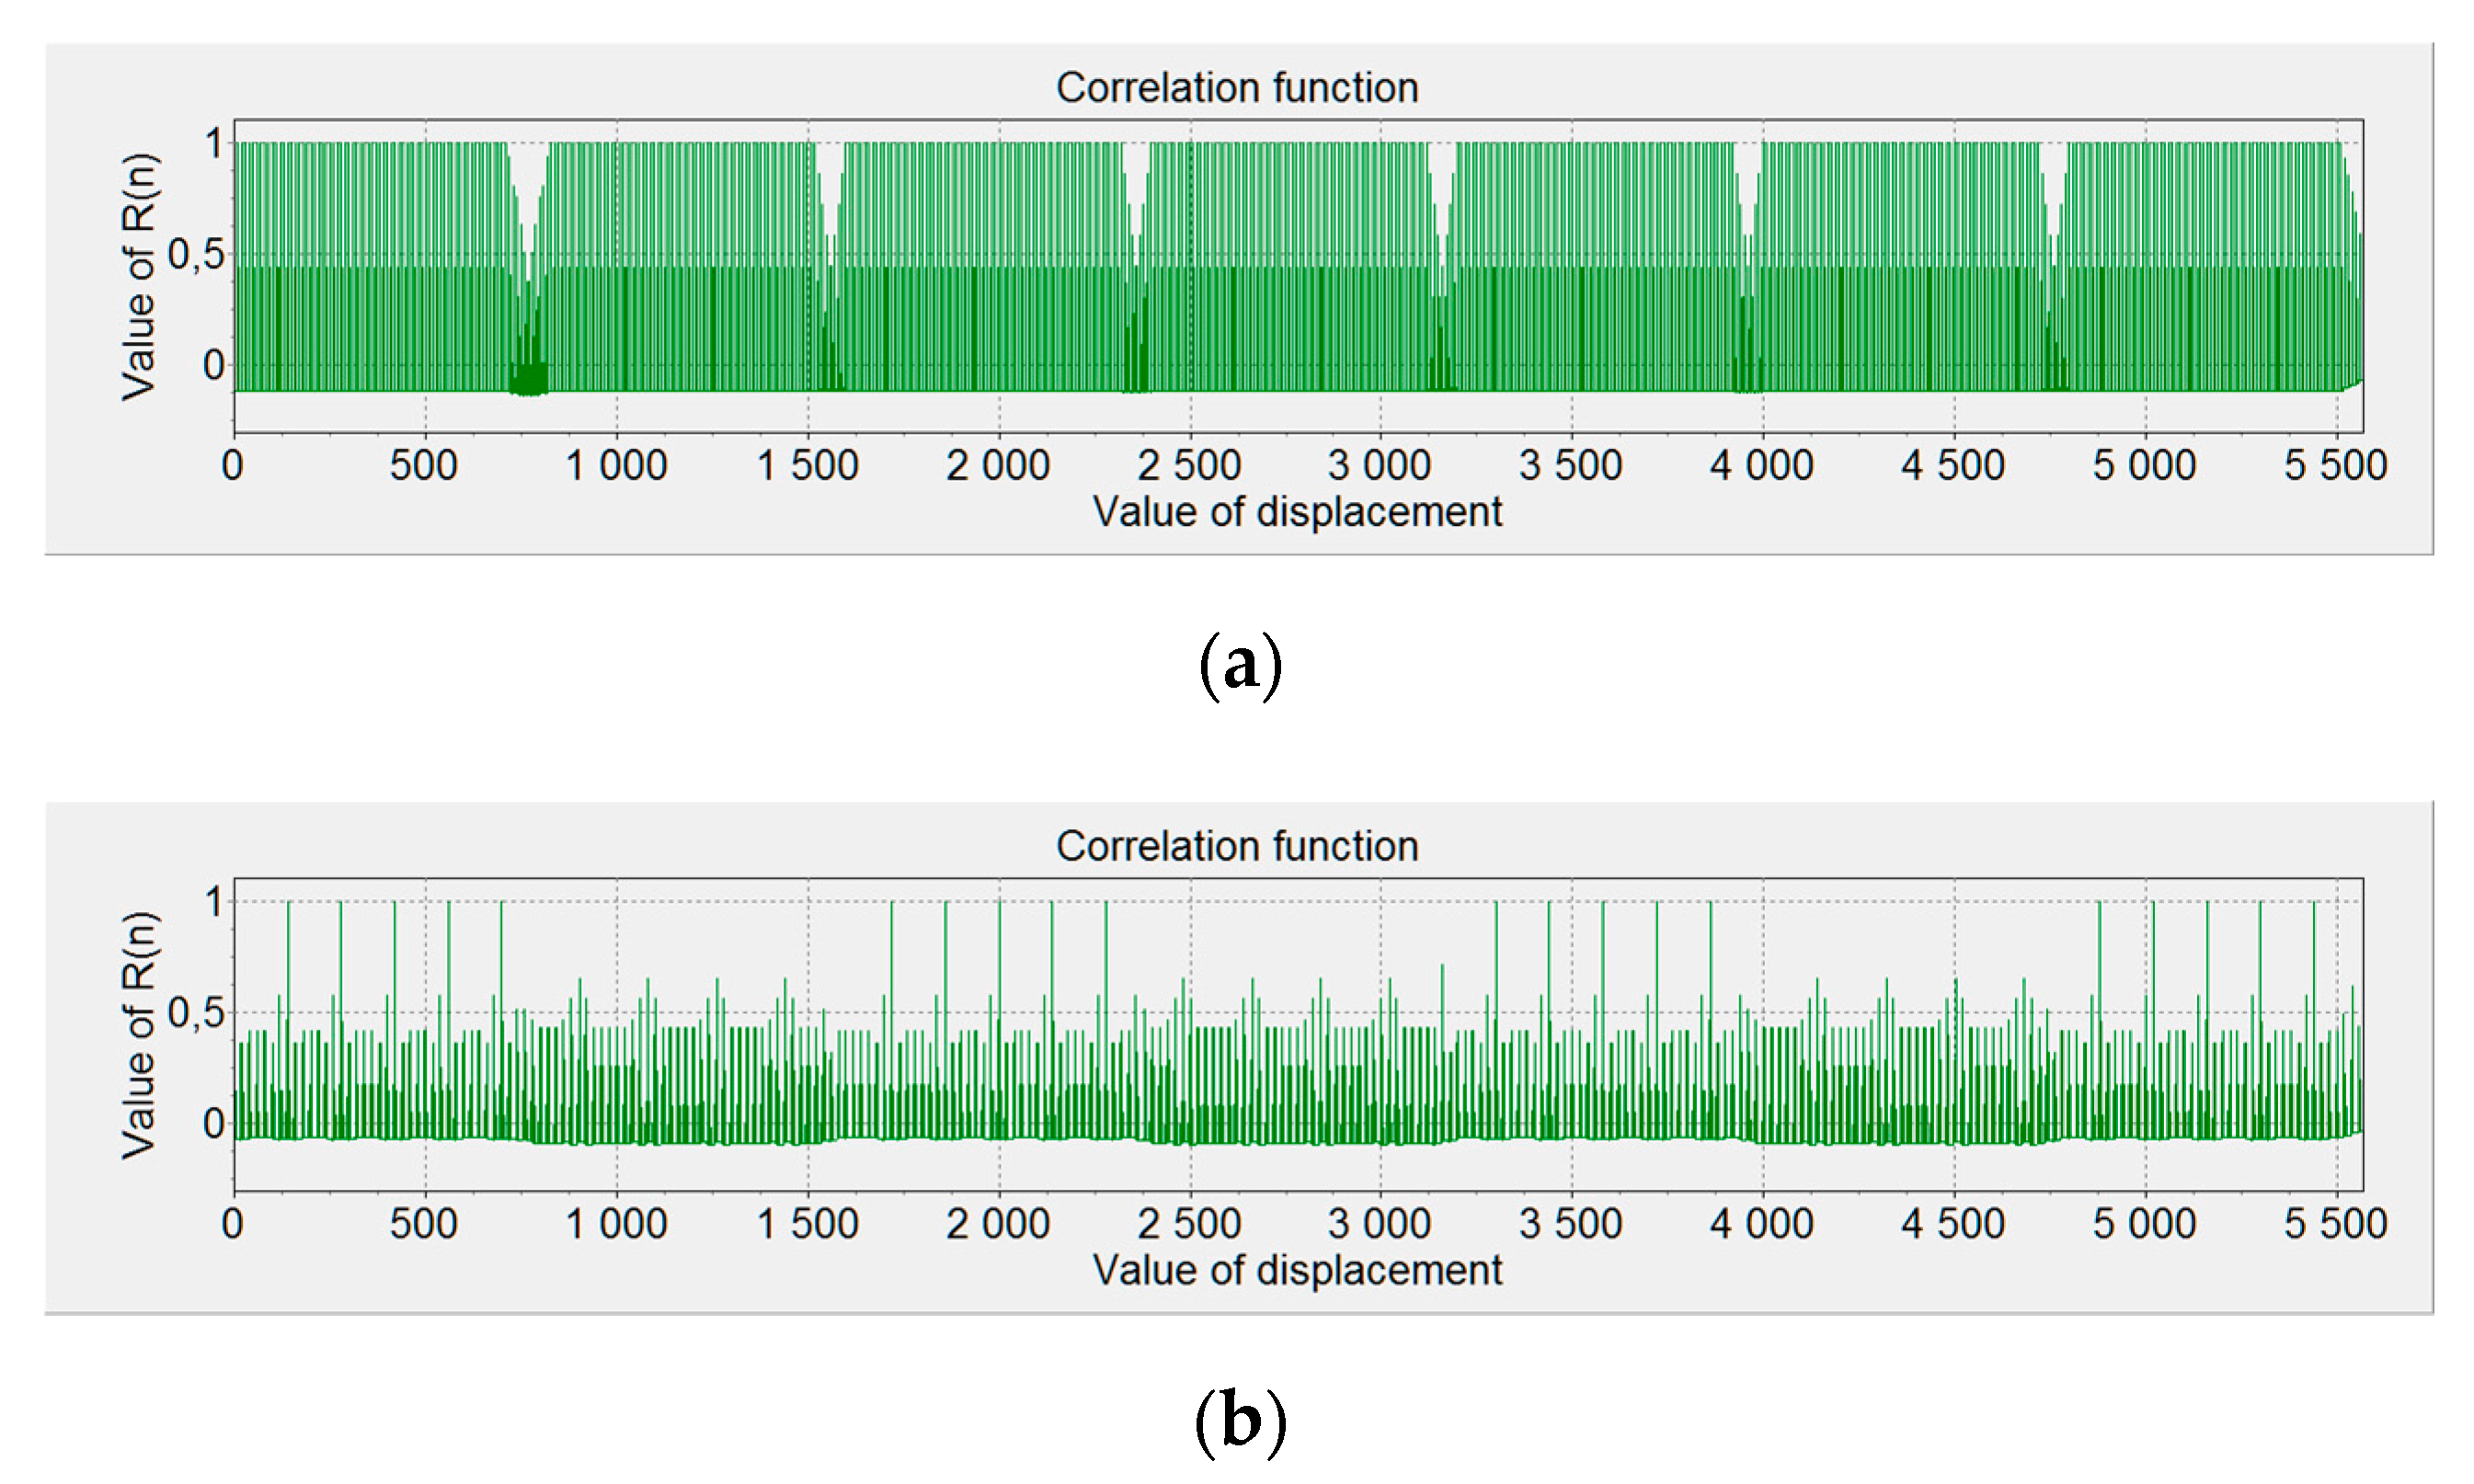
Most commonly, confidential information takes the form of text data. Typical applications, including MS Office with Word text editor, are used to process the data. Processing means editing, saving, and printing the text by using mainly black characters on a white background. However, the combinations of color pairs are diverse, and the user can customize them. For the purposes of this study, the color set was limited to the grayscale palette. The test results were supposed to provide an answer to the question of whether the option to choose a font and background color can result in increasing or reducing the level of processed text data electromagnetic protection, and additionally, whether there are any color pairs for which the electromagnetic protection level is higher than for others. The study covers the following two aspects:
  • matching the colors of character–background pairs;
  • the impact of selecting the available font smoothing option from the system level.
The x video signal bit structure using the TMDS coding for selected number pairs from the interval ranging from 0 to 255 (saturation level for individual colors) is similar. Then, it can be assumed that the value of correlation between y signals specified at the output of a theoretical SCA will adopt significant values. Computer simulations to determine those pairs for defining the forms of y compromising emanation signals were performed. The derivative was calculated, covering the z signal (“0” and “1” strings) to provide it. This signal is generated artificially and consists of doubling each x signal bit (therefore, the number of bits in the signal is 2N):
z n = x m
where n = 0, 1, ..., 2N − 1, and
m = n 2
presents an integral part by dividing n by 2. Finally, we obtain the z string with a doubled number of each bit, as presented in Table 2.
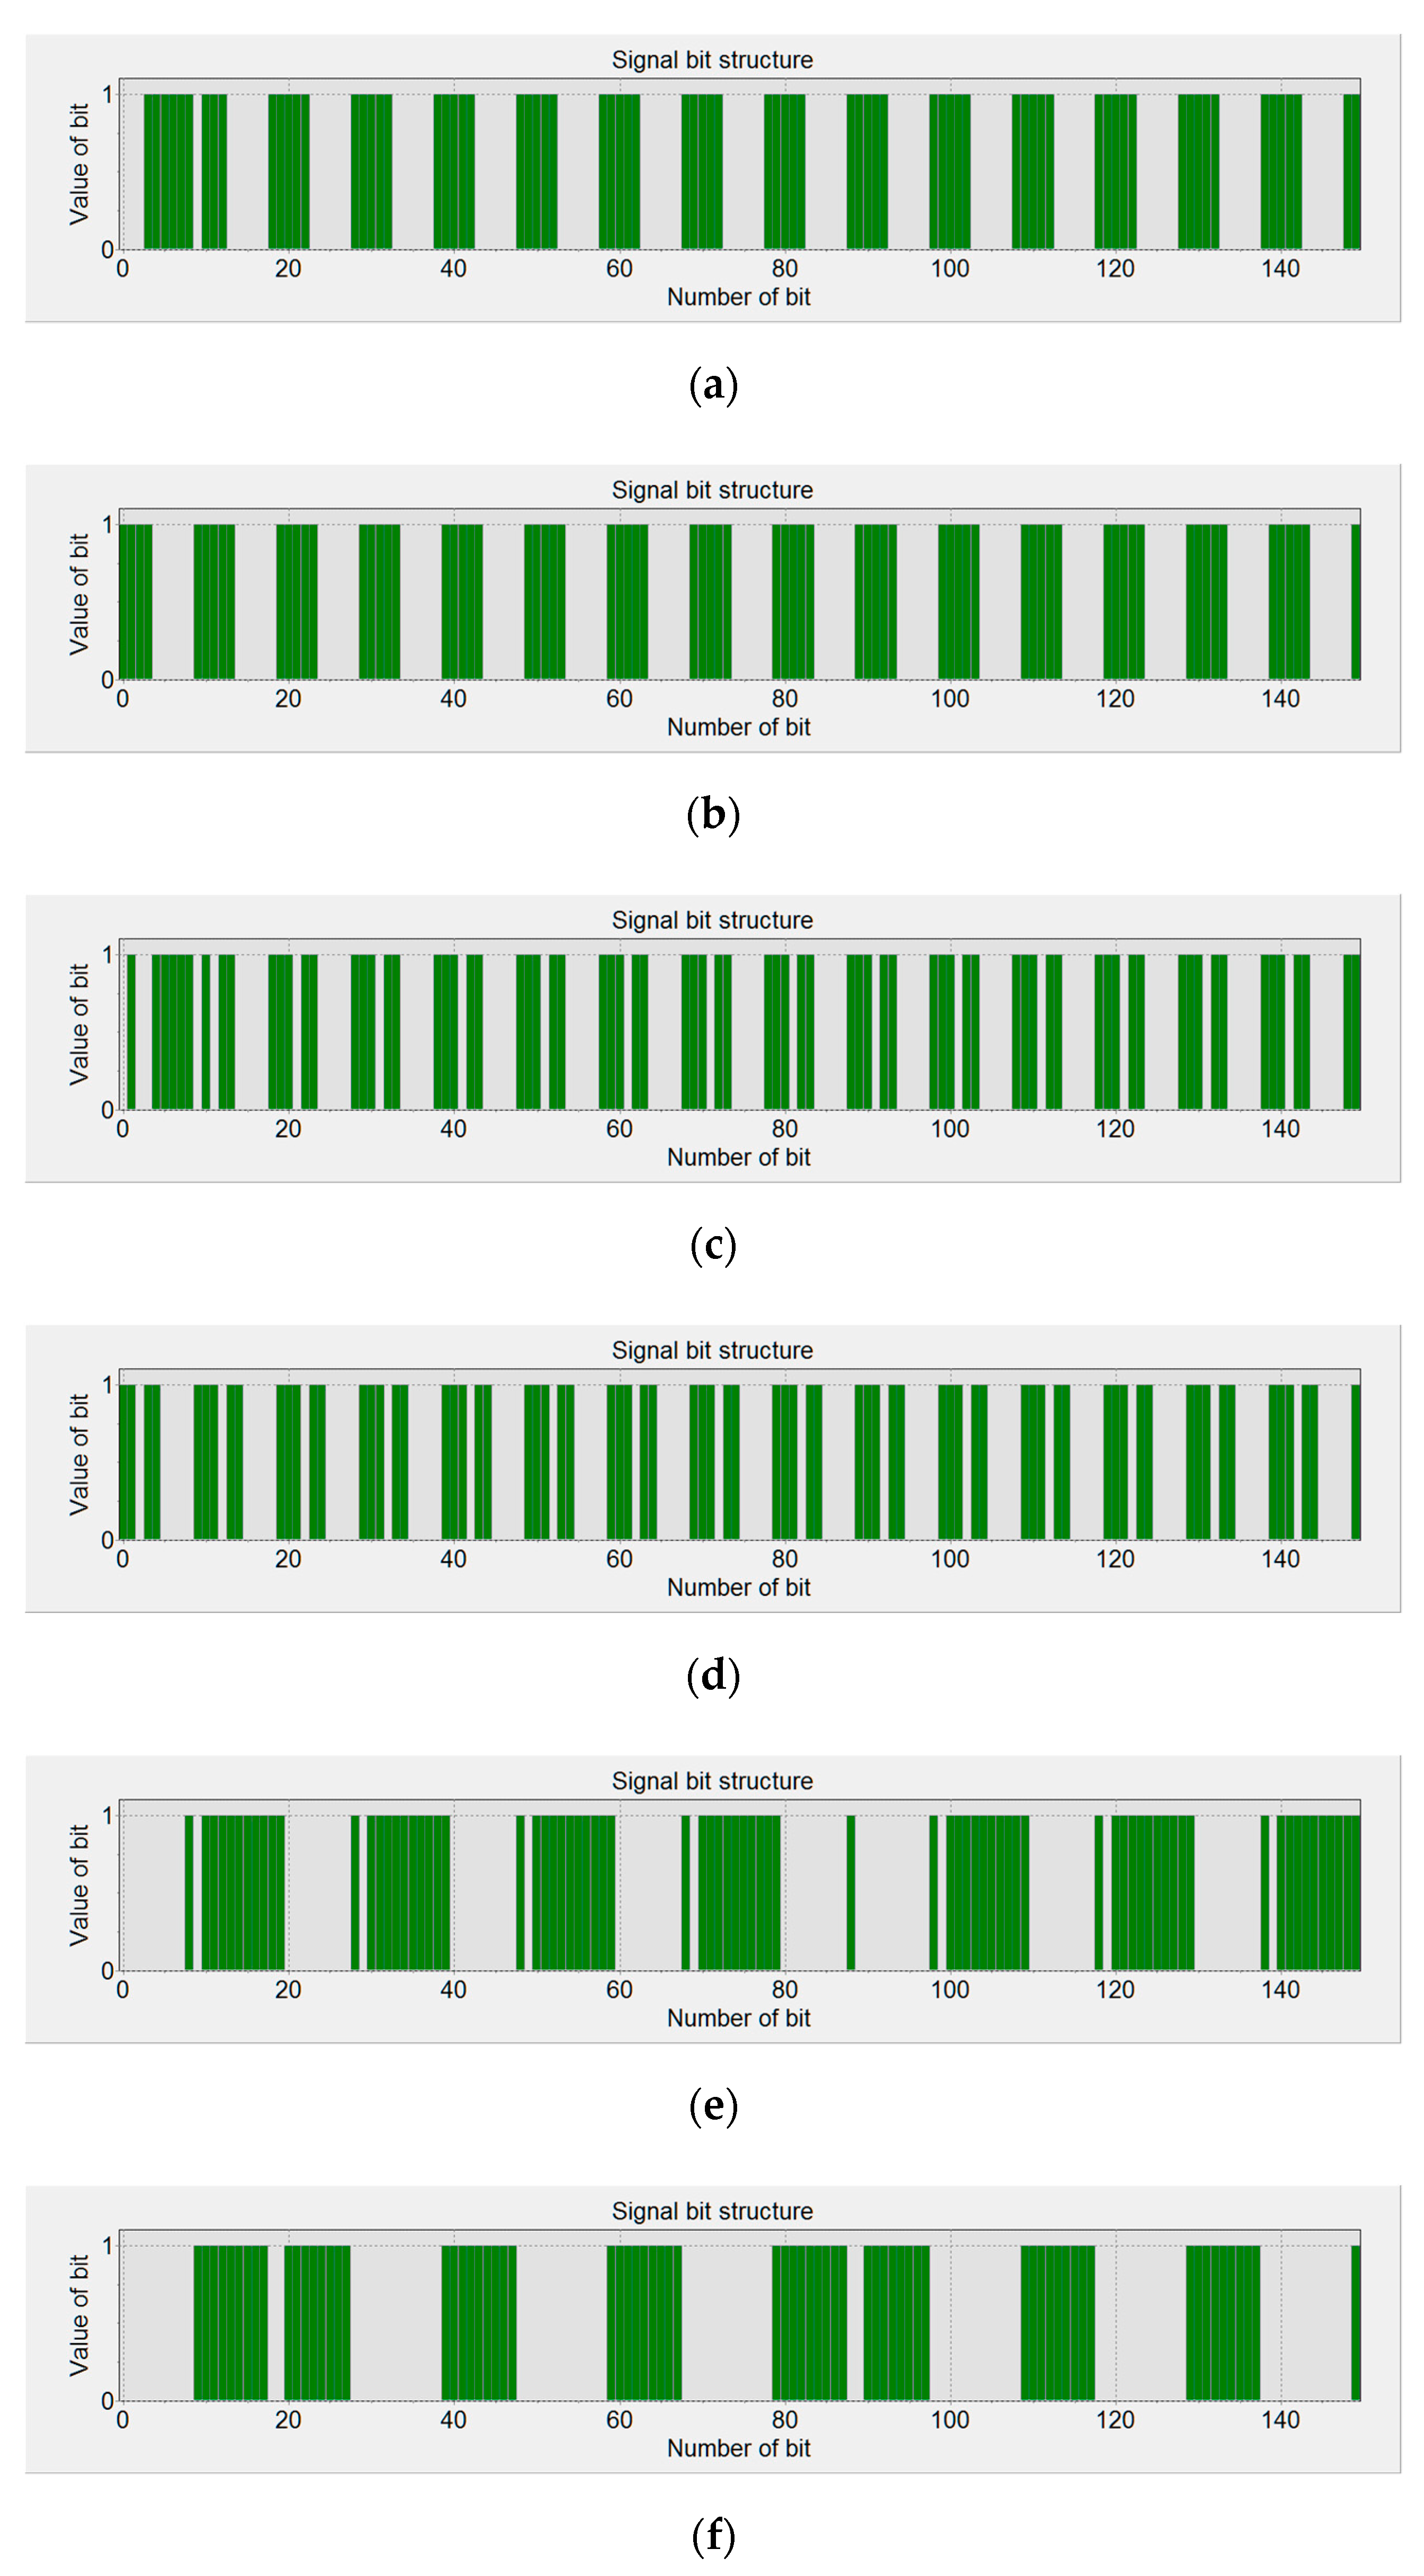
In practice, this appears as follows:
  • sequence xn/2 of bits “0” and “1”: {0, 0, 0, 1, 1, 0, 0, 1, 0, 0};
  • sequence zn of bits “0” and “1” after number of bits has been doubled: {0, 0, 0, 0, 0, 0, 1, 1, 1, 1, 0, 0, 0, 0, 1, 1, 0, 0, 0, 0}.
The derivative from the z signal is calculated by considering the following conditions:
y n 1 = | z n 1 z n n 1 n | = | z n 1 z n | , n = 1 2 N 1
and
y 2 N 1 = z 2 N 1
where N defines the number of original image bits obtained in TMDS coding of each pixel of the abovementioned image containing the processed data.

3.2. Experimental Setup and Measurement Procedure

In order to verify the hypothesis presented above, the DVI standard signals corresponding to the text presented on the monitor screen were subjected to both theoretical analysis and practical experiments. In the first stage of operations, the purpose of these verifications was to check whether DVI standard signals could be a source of electromagnetic compromising emanations. The second stage involved checking whether the quality of these signals can be influenced by the appropriate selection of background and font colors, as well as the smoothing option.
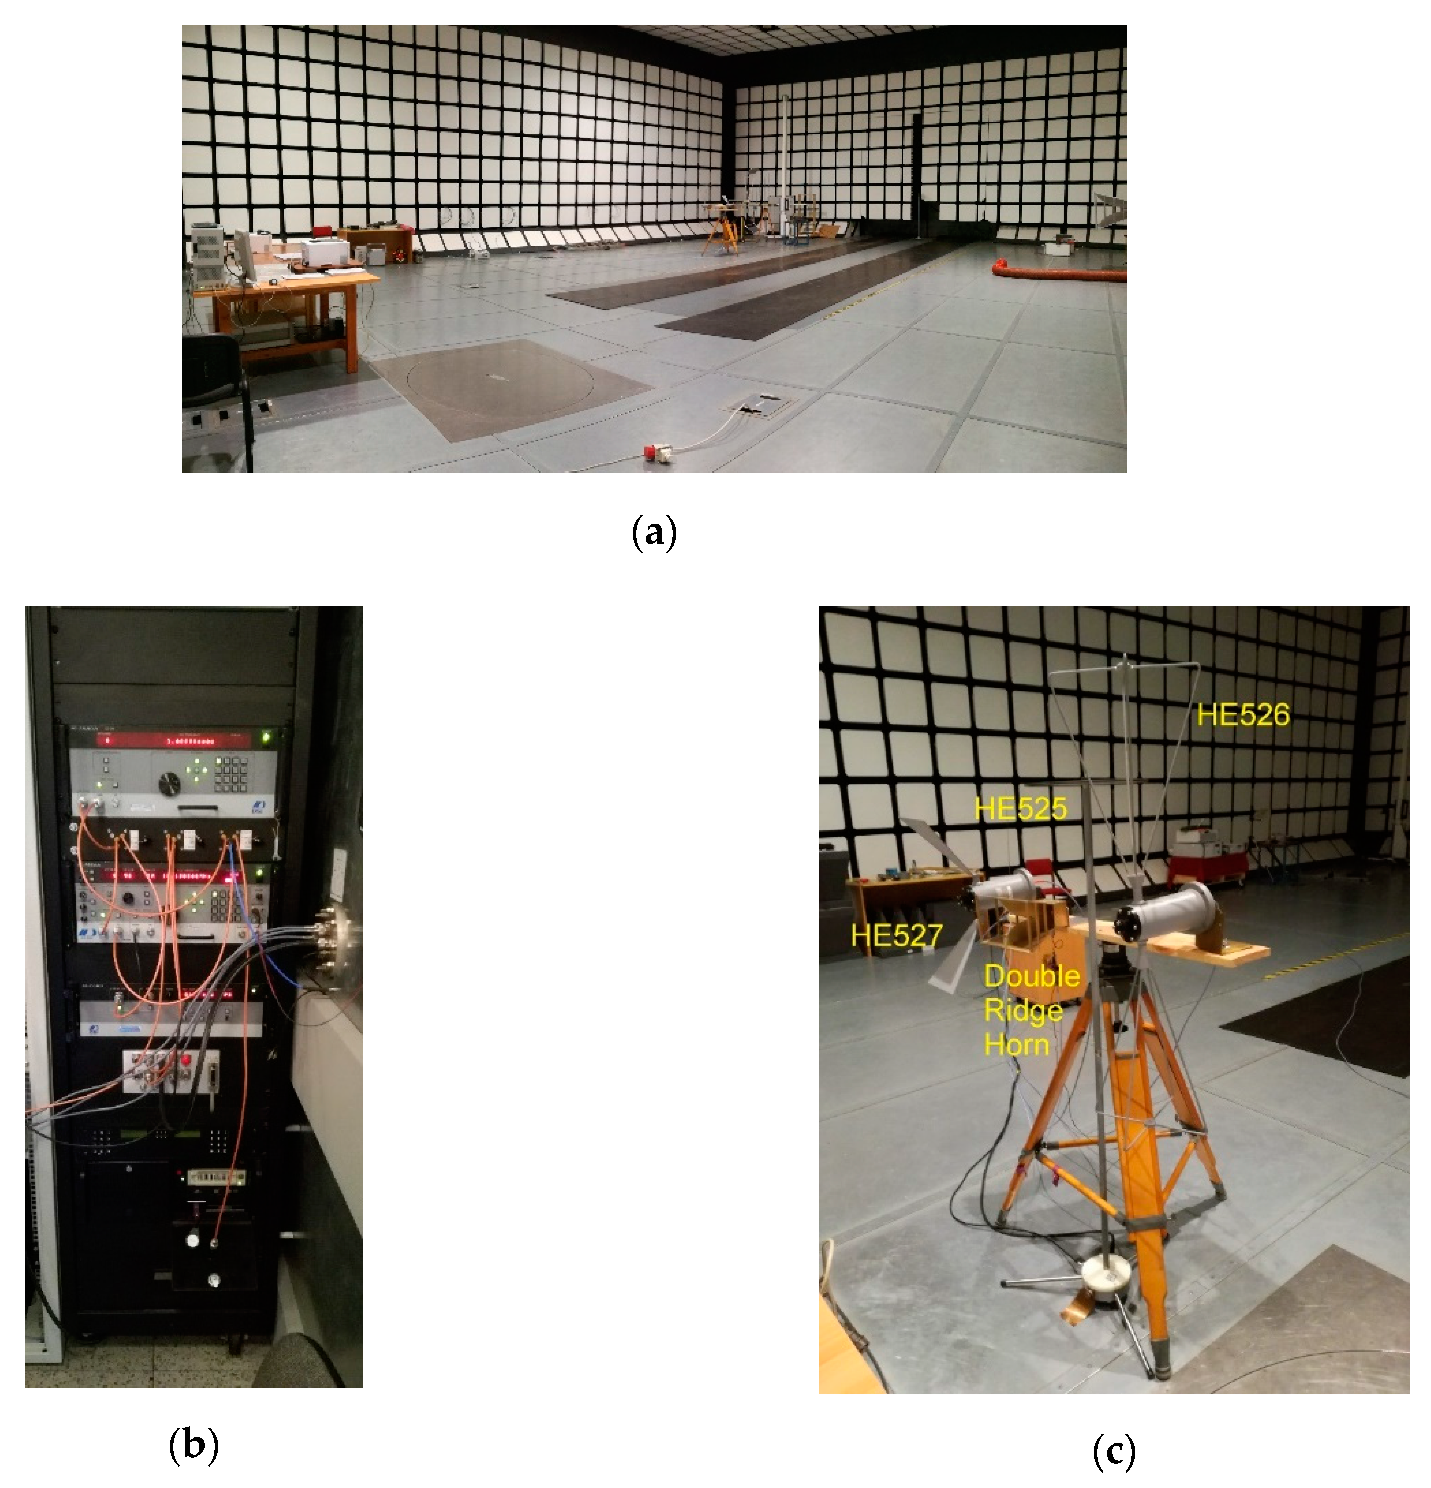
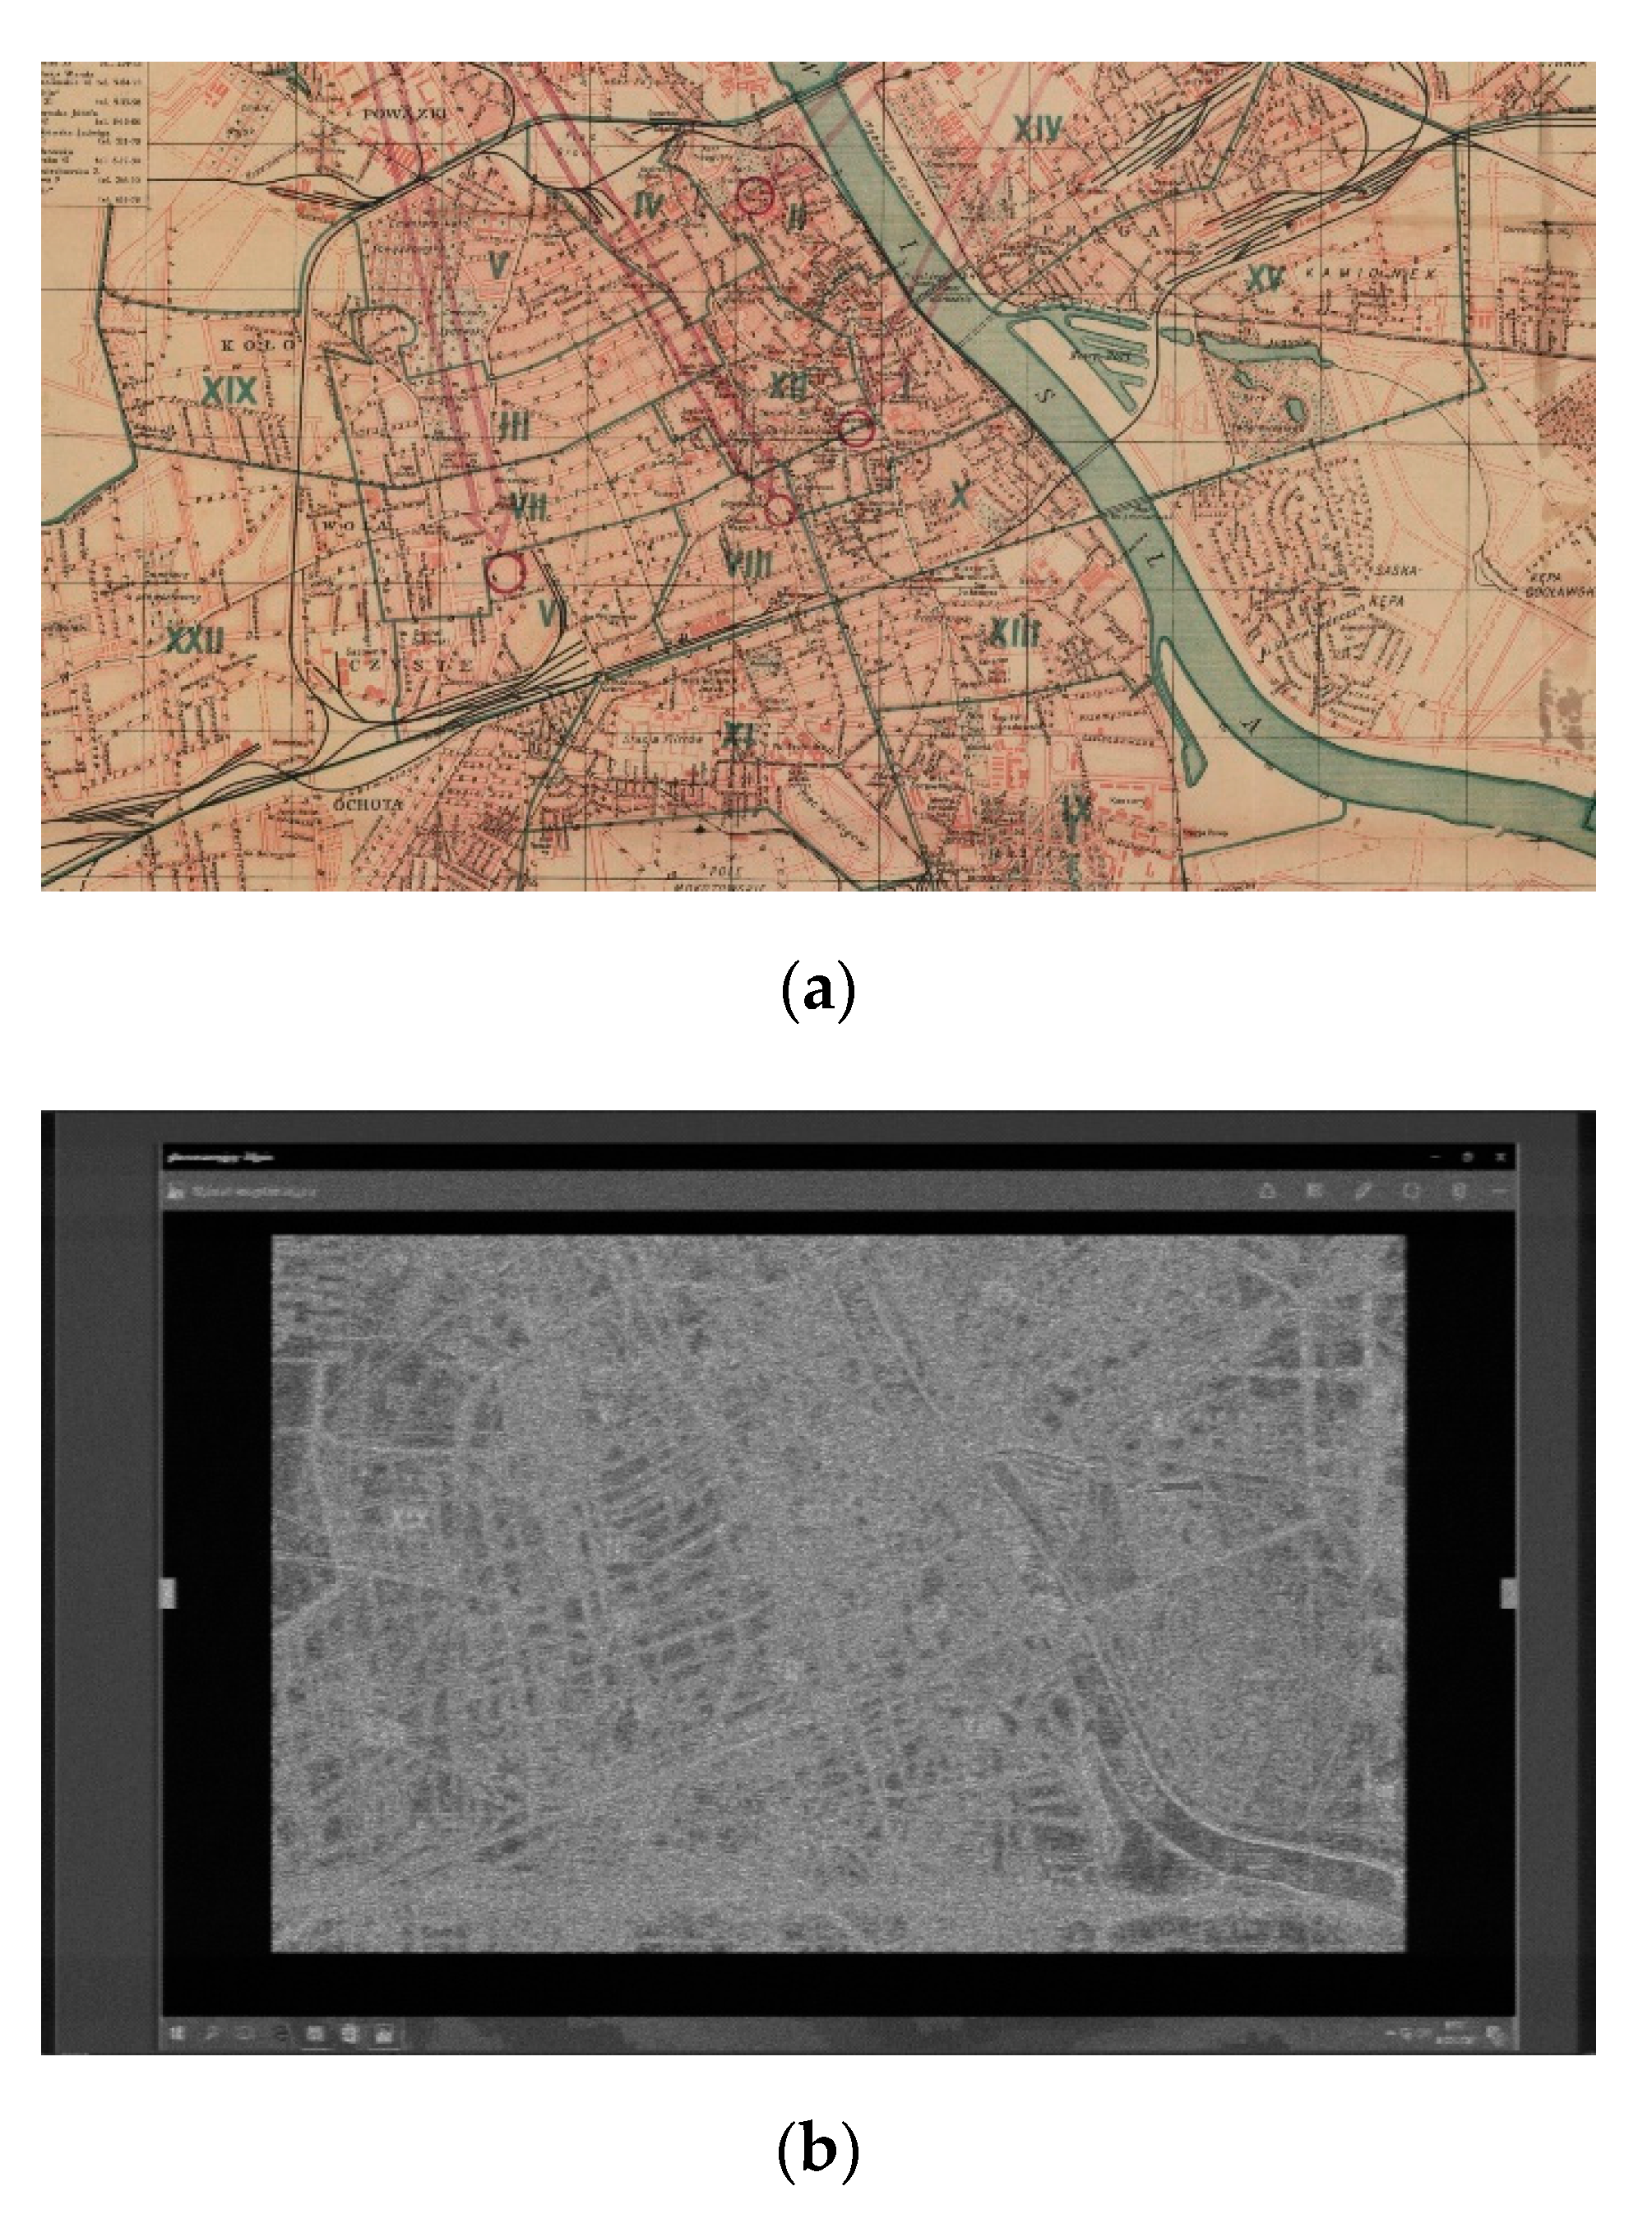
Practical experiments were carried out in an anechoic chamber (Figure 8a), in which shielding in the frequency range from 1 MHz to 10 GHz ensures suppression of external electromagnetic fields at the level of 100 dB. In this case, only emissions with DVI standard as the source were measured. The electromagnetic emissions arising due to the operation of the DVI interface were recorded using the DSI-1550A receiver (Figure 8b), along with a DSI-1580A microwave downconverter (up to 22 GHz) and a set of R&S (Rohde and Schwarz) AM524 low-noise antenna systems (100 Hz–1 GHz). The EMCO double ridge horn antenna with an amplifier was used in the frequency range above 1GHz (Figure 8c). To visualize received electromagnetic emissions in real time, a hardware raster generator (HRG) was used [30]. This is an external source of vertical and horizontal synchronization signals used to determine the operating conditions of the monitor, whose video path is controlled by the received emission [31]. Additionally, an AD converter Signatec PDA-1000 (up to 1 Gs/s) was used to record the signals being tested. Experiments were carried out using the following measurement bandwidths: 50 MHz, 100 MHz, and 200 MHz. During tests, the monitor and the DVI interface cable were connected to the special (Tempest class) computer central unit (electromagnetically shielded). This allowed us to eliminate the computer impact on the recorded signals of video-signal-correlated emissions [32,33,34]. The data displayed on the monitor included the following text: “protection”. The measurement distance was 1 m and met the requirements presented in document MIL-STD-461G, “Requirements for the Control of Electromagnetic Interference Characteristics of Subsystems and Equipment”.
The authors carried out many tests relating to the safety of digital video standards. Such tests lasted a very long time, often taking several days. During these tests, frequencies of valuable emissions were searched. The quality of the signals and possible reconstruction of the information were considered. Attempts at reconstruction of information were realized in real time using a hardware raster generator (HRG). The HRG was the source of the vertical and horizontal frequencies that allowed primary information to be reconstructed. The selected valuable emissions were recorded. Next, the signals were used to reconstruct information (for this purpose, a software raster generator was used) in the form of images, which were included in this paper.
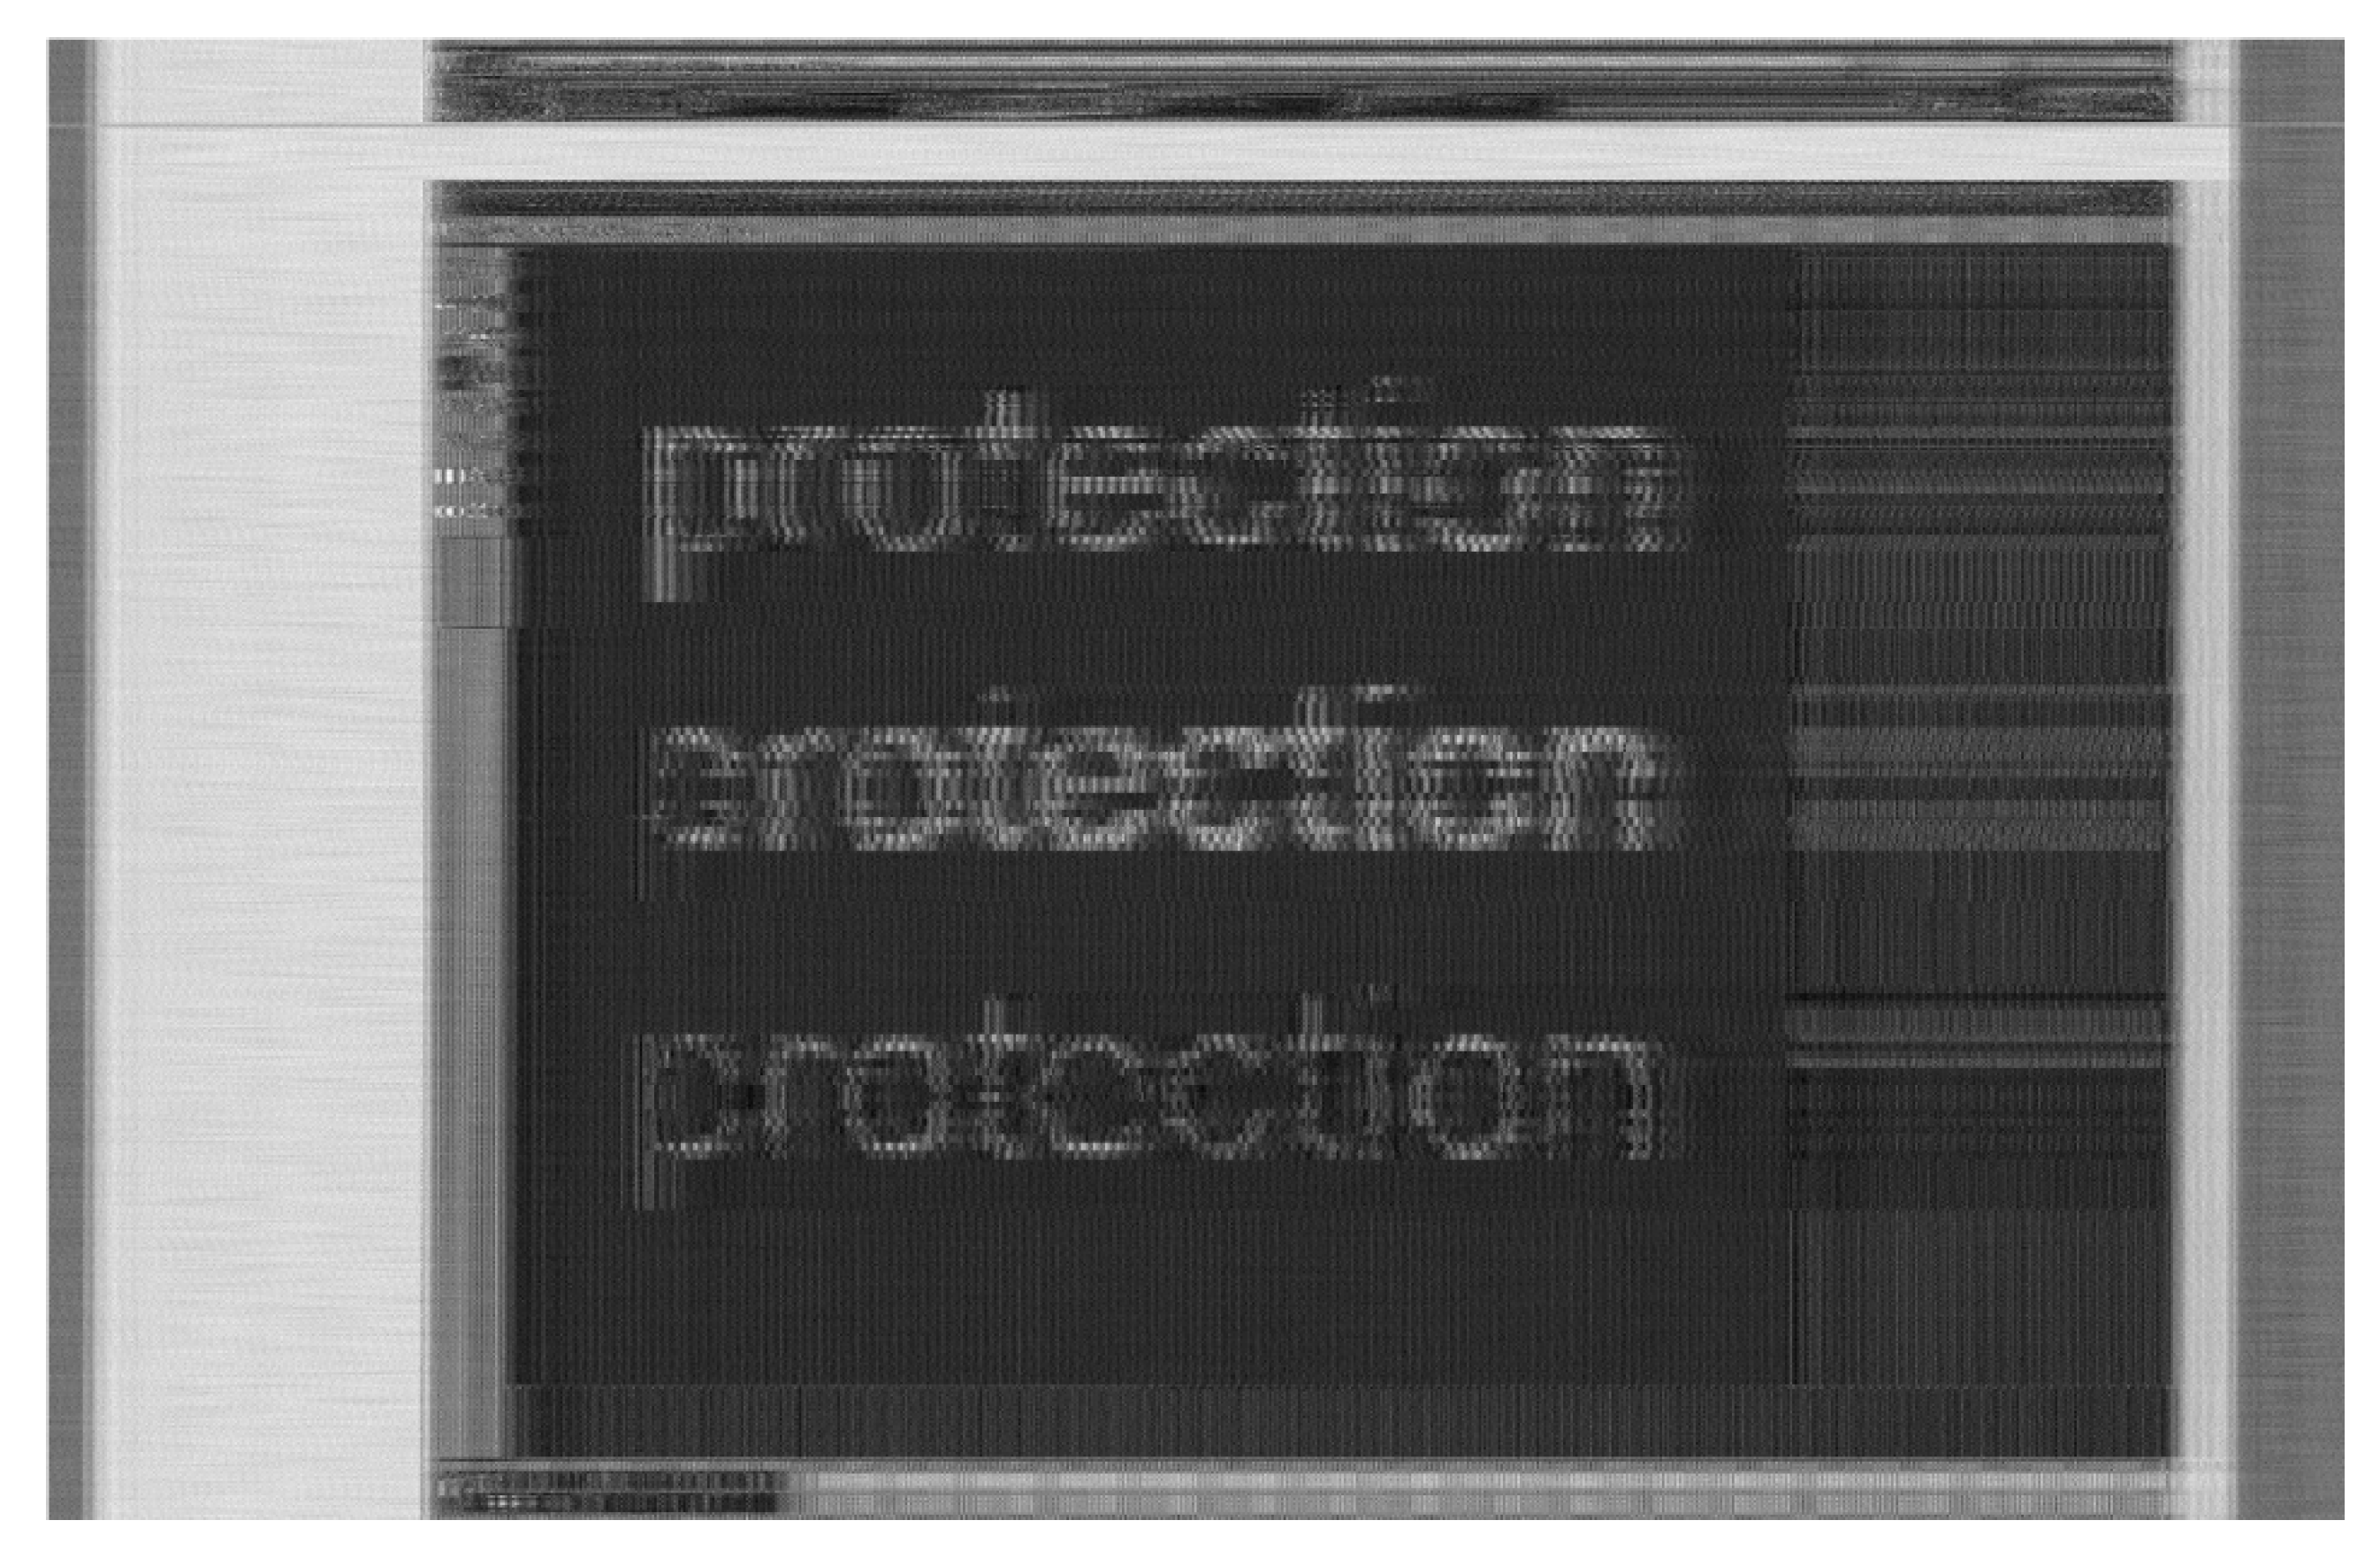
Tests were performed for three letter character display modes in Windows XP OS, using the following options: Standard, ClearType, and without smoothing (Figure 4). Displaying text data in Standard and ClearType modes is the same for Windows 7, 8, and 10 operating systems.
It is worth noting the reason for introducing the font edge smoothing. This procedure is intended to improve the sharpness of characters displayed on a monitor. In addition, its purpose is to save printing materials. Edges in other colors (ClearType mode) are displayed by compromising individual character components (Figure 4a), which in the smoothing mode are printed clearly in black. By contrast, the Standard mode replaces some black pixels (only diagonal lines) with grayscale pixels, which also results in lower printing material consumption.

4. Results

4.1. Results of Theoretical Analysis

The width of the retrieved image is magnified 20 times, which results from writing the pixel amplitude value in ten bits, where each one is doubled. The duplication of each bit results directly from the necessity to approach the real conditions related to the calculation of the derivative according to Equation (4). However, it should be noted that the selection of grayscale color pairs for which the electromagnetic protection can be increased can be distorted by the impact of the abovementioned options for smoothing font edges (for Windows XP OS, 7, 8 and 10). In Windows XP OS, the process of smoothing can be completely disabled, which is presented in Figure 4a.
Because the font edge smoothing option acts the same way for all operating systems, the analyses performed were limited to images with letters generated in Windows XP (Figure 9; ClearType mode, Standard mode, and without any edge smoothing mode).
The correlation analysis was performed for y signals after SCA output, corresponding to grayscale color pairs according to the following equation:
R n = m = 0 M 1 ( y a _ ( m + n ) y - a _ n ) ( y b _ m y - b ) m = 0 M 1 ( y a _ ( m + n ) y - a _ n ) 2 m = 0 M 1 ( y b _ m y - b ) 2
y - b = 1 M m = 0 M 1 y b _ m
y - a _ n = 1 M m = 0 M 1 y a _ ( m + n )
n = 0 , , 2 N 1
where M defines the number of bits corresponding to the multiplicity of a ten-bit word, which determins the length of a standard model yb (the analysis performed assumed a quadrupled ten-bit word, i.e., M = 40); ya is the analyzed model, which shows that at least two color pairs can be shown. Here, color pair 238 (background color) and 8 (font color), as well as 210 and 22, are mutually similar in terms of bit structure, having the highest mutual correlation coefficients. The coefficient value between the string of bits for those color pairs is 1. For comparison purposes, the commonly used color pair (i.e., 255 (background) and 0 (fonts)) features a much lower R correlation coefficient, equating to 0.646 (Figure 10). Despite maximum correlation coefficient values, the behavior of the correlation function shows areas where the function adopts very low values. They occur at color change borders (Figure 10a). This means that in those locations, it is possible to mark the occurrence of graphic items in the recovered image. Most commonly, they include font edges (Figure 12).
Figure 11 presents bit strings, corresponding to individual color values, obtained as a result of TMDS coding.
Calculations according to Equations (4) and (5) were performed for the above-listed background and font color pairs, obtaining specific bit strings. The analysis was performed using the images presented in Figure 4. The images were recovered by using raster scanning method [31] for a pre-set image width (known number of pixels). Their form corresponds to images that can be retrieved under perfect conditions for measurement of compromising emanations at the SCA output.
The lack of font edge smoothing means that only two colors are used in construction of the image. They include the background and font colors. Using the smoothing feature considerably extends the color palette that appears in the image, resulting in variability of the consecutive zeroes and ones at the video card output (at least three consecutive colors). At the same time, the user has no influence on the color selection to be used in the font edge smoothing process. This phenomenon has a direct impact on the level of electromagnetic protection used to cover the processed data (Figure 12).

4.2. Results of Practical Tests

The theoretical analyses performed were verified by conducting adequate practical tests. The tests were performed by using a SyncMaster 931BF monitor and a typical signal cable to transmit DVI video signals. The displayed image parameters are as follows: resolution 1280 × 1024, image refresh rate 60 Hz.
To make the comparison analysis easier, the image used contained three identical words written with Arial fonts for different edge smoothing modes (Figure 13). The background brightness was defined to the value of 238, while the Arial font was preset to 8. This is one of the color pairs featuring a high correlation coefficient. In accordance with a theoretical analysis performed for the same color pair, the desktop fonts should not be retrieved from compromising emanation signals.
The font size used has 22 points at 600% image magnification. The signals for compromising emanations were searched for in the frequency range of 10 MHz to 5 GHz. Frequencies where the emanations were recorded included 245 MHz, 415 MHz, 591 MHz, 642 MHz, 768 MHz, 852 MHz, 1575 MHz, and 1780 MHz, measured in 20 MHz, 50 MHz, and 100 MHz frequency bands. Further analyses were conducted using compromising emanations occurring in 591 MHz and 642 MHz frequencies, and measured in the 100 MHz band. Therefore, attention should be paid to the selection of proper measurement bandwidths. For digital signals, including the one obtained in TMDS coding, the bandwidth should be as wide as possible. However, a certain compromise should be maintained [35].
Therefore, the measurement bandwidth for compromising emanations must be small enough to attenuate strong signals from other undesired sources, but big enough to observe the data transmission rate. Results in the form of retrieved images from recorded compromising emanations are presented in Figure 14.
The process of capturing information from video signals is mainly based on determining the moment of the signal level change, not its value. In the case of the quasi-analogue (VGA) signal, the images most susceptible to electromagnetic eavesdropping are highly contrasting images (text). It is practically impossible to reconstruct the content of a photo or movie. In the case of the DVI interface, changes in the bit structure of a purely digital signal result in the formation of compromising emission signals, which allow the content displayed on the monitor to be determined. Therefore, images another than text data also are sensitive to electromagnetic infiltration processes (Figure 15 and Figure 16).

5. Discussions

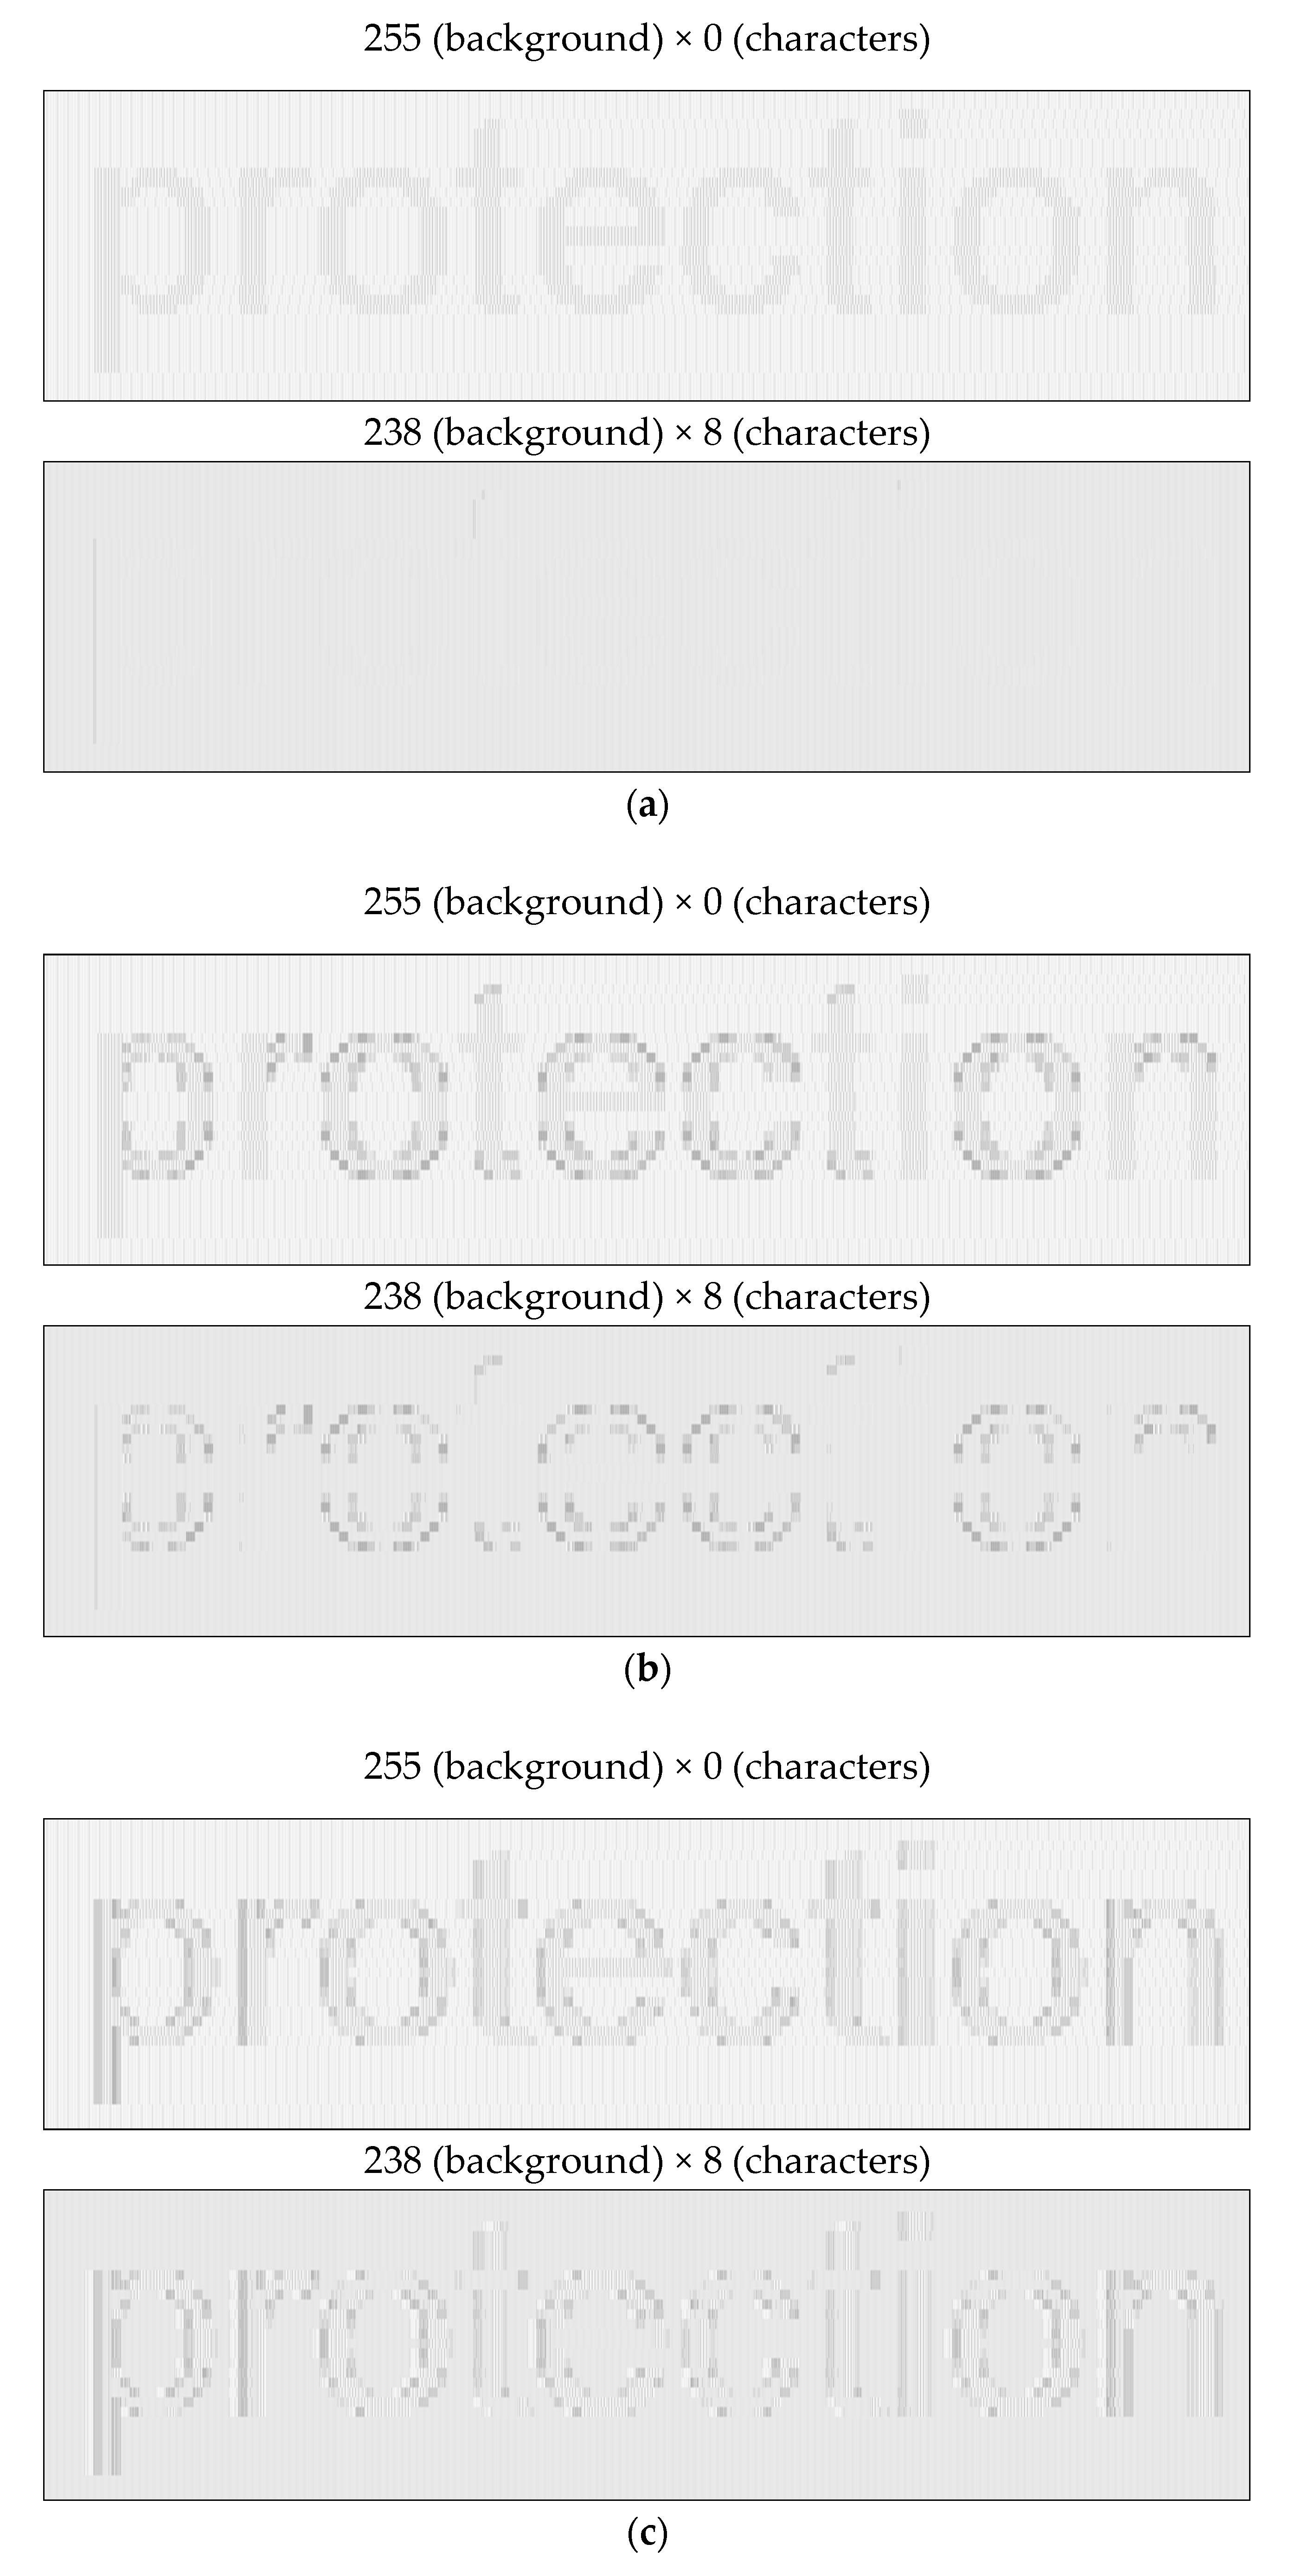
The retrieved images show that theoretical analysis results are only partially confirmed when compared to reality (Figure 14b). The selection of color pairs does not provide an effective protection when using DVI standard against electromagnetic infiltration within the entire frequency range analyzed for the occurrence of electromagnetic emission signals. In addition, the use of font edge smoothing features can effectively reduce the level of electromagnetic protection covering the processed data. It is important that in the most recent and commonly used Windows operating systems (version 7, 8, and 10), the option of smoothing the font edges cannot be entirely disabled. The ClearType option is enabled as standard, which is especially exposed to electromagnetic infiltration, regardless of the color pair used. Initializing the Standard edge smoothing option highlights only the diagonal edges. This is because of the fact that no vertical edges are smoothed (as opposed to the ClearType smoothing option). Then, the colors for a selected pair (e.g., with values of 238 and 8) border directly on each other (as in the cases of fonts without edge smoothing—the first text line), while their bit structure is tightly correlated.
Moreover, as mentioned above, appropriate pairs of background and font colors can support the electromagnetic protection, because of their high correlation coefficient and SCA effect. For many frequencies where compromising emanations occur, some selected pair colors make it impossible to acquire information in a non-invasive way (Figure 14b). The reason for this is the complexity of the radiating system, including the signal cable connecting the CPU with the monitor and the electronic monitoring systems. The impact of the radiating system’s geometrical arrangement on its radiation profile is very complex. Thus, the effectiveness of system radiation for various frequencies is different.
For instance, for color pairs with values of 255 and 0, the correlation value is very low. In this case, the set of frequencies where the compromising emanations occur is numerous. For the frequency 642 MHz, compromising emanations were recorded that allowed retrieval of the image, as shown in Figure 17. However, for the same frequency with the color pair of 238 and 8, the retrieved data are completely invisible (see Figure 14b, the first text line).
For DVI standard, using the TMDS coding algorithm means that the color pairs are no longer available. In the case of analogue VGA standard, this solution reduces the video signal amplitude jump, thus, reducing the effect of energy radiation in the form of electromagnetic waves [2]. However, this refers only to ClearType smoothing (the third image line in Figure 18), as only this option makes it possible to also smooth the vertical edges of fonts.

6. Conclusions

This paper presents the results of security studies and analyses for the DVI digital standard in processing sensitive information. Preliminary theoretical analyses confirmed that the DVI standard as the source of valuable emissions is very sensitive to eavesdropping processes. Images were presented that were reconstructed during computer simulation based on real video signals, which corresponded to images displayed on an eavesdropping screen. In this case, it was shown that the digital DVI standard is not safe from the viewpoint of protection of information must electromagnetic penetration. To increase the security level of this standard, different methods have be used. As an effective method involves using specific color pairs. The font edge smoothing options implemented in Windows operating systems were assessed for their level of effectiveness in the process of electromagnetic infiltration. The security of different standards using video signal coding according to the TMDS algorithm was related to the bit structures for two colors (from a grey scale palette), showing that the background and characters should be very similar. At the same time, the colors corresponding to those color bit structures have to provide sufficient contrast between the background and characters to make them distinguishable on a computer screen.
The conducted analysis of background–font color pairs using the mutual correlation coefficient value identified which color pairs can effectively increase the level of electromagnetic protection. This level of protection is elevated directly by limiting the number of sensitive emission frequencies. The color pairs that can affect the electromagnetic protection include the colors with the following values: 238 and 8, 210 and 22, 216 and 19, 198 and 28, 232 and 44. Further pairs could be listed, appropriate contrast between colors must be considered to make it easier to write the text.
In addition, it has been shown that font edge smoothing solutions used in Windows OS significantly impair the level of resistance to electromagnetic radiation spying. The feature of font smoothing extends the set of colors used to build fonts at the border of the background and the character, softening the transitions between colors.
As the color method is not fully effective, this method only limits the number of frequencies in which sensitive emissions appear. Likewise, the DVI standard also is not completely safe, so alternative methods need to be researched. The authors of this paper propose the use of safe fonts. However, this solution needs to be analyzed together with graphic options for Windows, Linux, or Mac OS.

Author Contributions

Conceptualization, I.K. and A.P.; methodology, A.P.; software, I.K. and A.P; validation, I.K. and A.P.; formal analysis, A.P.; investigation, I.K.; resources, I.K.; writing—original draft preparation, I.K.; writing—review and editing, A.P.; visualization, I.K.; supervision, I.K.

Funding

This research received no external funding.

Conflicts of Interest

The authors declare no conflict of interest.

References

  1. Kuhn, M.G. Compromising Emanations: Eavesdropping Risks of Computer Displays; University of Cambridge: Cambridge, UK, 2003. [Google Scholar]
  2. Kubiak, I. Video signal level (colour intensity) and effectiveness of electromagnetic infiltration. Bull. Pol. Acad. Sci. Tech. Sci. 2016, 64, 207–218. [Google Scholar] [CrossRef] [Green Version]
  3. Choudary, O.; Kuhn, M.G. Template Attacks on Different Devices. In Proceedings of the International Workshop on Constructive Side-Channel Analysis and Secure Design (COSADE 2014), Paris, France, 13–15 April 2014; pp. 179–198. [Google Scholar]
  4. Ulas, C.; Asık, U.; Karadeniz, C. Analysis of Information Leakages on Laser Printers in the Media of Electromagnetic Radiation and Line Conductions. In Proceedings of the International Conference on Information Security and Cryptology (ISCTurkey 2015), Ankara, Turkey, 30–31 October 2015. [Google Scholar]
  5. Shi, Y.; Li, B.; Wang, B.; Qi, Z.; Liu, J. Unsupervised Single-Image Super-Resolution with Multi-Gram Loss. Electronics 2019, 8, 833. [Google Scholar] [CrossRef]
  6. Kubiak, I. Laser printer as a source of sensitive emissions. Turk. J. Electr. Eng. Comput. Sci. 2018, 26, 1354–1366. [Google Scholar]
  7. Tajima, K.; Ishikawa, R.; Mori, T.; Suzuki, Y.; Takaya, K. A study on risk evaluation of countermeasure technique for preventing electromagnetic information leakage from ITE. In Proceedings of the 2017 International Symposium on Electromagnetic Compatibility-EMC EUROPE, Angers, France, 4–7 September 2017. [Google Scholar] [CrossRef]
  8. Litao, W.; Bin, Y. Research on the compromising electromagnetic emanations from digital signals. In Proceedings of the International Conference on Automatic Control and Artificial Intelligence (ACAI 2012), Xiamen, China, 3–5 March 2012; pp. 1761–1764. [Google Scholar]
  9. Kubiak, I. Computer font resistant to electromagnetic infiltration process. Prz. Elektrotechniczn. 2014, 90, 207–215. [Google Scholar]
  10. Toledo, I.; Carbonell, M.; Fornés, A.; Lladós, J. Information extraction from historical handwritten document images with a context-aware neural model. Pattern Recognit. 2019, 86, 27–36. [Google Scholar] [CrossRef]
  11. Nguyen, K.; Fookes, C.; Jillela, R.; Sridharan, S.; Ross, A. Long range iris recognition: A survey. Pattern Recognit. 2017, 72, 123–143. [Google Scholar] [CrossRef]
  12. Kim, J.; Park, N.; Kim, G.; Jin, S. CCTV Video Processing Metadata Security Scheme Using Character Order Preserving-Transformation in the Emerging Multimedia. Electronics 2019, 8, 412. [Google Scholar] [CrossRef]
  13. Kuhn, M.G. Optical Time-Domain Eavesdropping Risks of CRT Displays. In Proceedings of the 2002 IEEE Symposium on Security and Privacy, Berkeley, CA, USA, 12–15 May 2002; pp. 3–18. [Google Scholar]
  14. Li, L.; Wang, Y.; Suen, C.Y.; Tang, Z.; Liu, D. A tree conditional random field model for panel detection in comic images. Pattern Recognit. 2015, 48, 2129–2140. [Google Scholar] [CrossRef]
  15. Loughry, J.; Umphress, D.A. Information Leakage from Optical Emanations. J. ACM Trans. Inf. Syst. Secur. 2002, 5, 262–289. [Google Scholar] [CrossRef]
  16. MCCARTHY, M.J. The Pentagon Worries That Spies Can See Its Computer Screens, Someone Could Watch What’s on Your VDT. Available online: https://cryptome.org/tempest-fret.htm (accessed on 14 August 2019).
  17. Zhang, N.; Lu, Y.; Cui, Q.; Wang, Y. Investigation of Unintentional Video Emanations from a VGA Connector in the Desktop Computers. IEEE Trans. Electromagn. Compat. 2017, 59, 1826–1834. [Google Scholar] [CrossRef]
  18. Ketenci, S.; Kayikçioğlu, T.; Gangal, A. Recognition of sign language numbers via electromyography signals. In Proceedings of the 2015 23nd Signal Processing and Communications Applications Conference (SIU), Malatya, Turkey, 16–19 May 2015; pp. 2593–2596. [Google Scholar]
  19. Bahare, J.; Chalechale, A. Persian Sign Language Recognition Using Radial Distance and Fourier Transform. Int. J. Image Graphics Signal Process. 2014, 1, 40–46. [Google Scholar]
  20. Kubiak, I. TEMPEST font counteracting a non-invasive acquisition of text data. Turk. J. Electr. Eng. Comput. Sci. 2018, 1, 582–592. [Google Scholar] [CrossRef]
  21. Wang, L.; Yu, B. Analysis and Measurement on the Electromagnetic Compromising Emanations of Computer Keyboards. In Proceedings of the 2011 Seventh International Conference on Computational Intelligence and Security, Hainan, China, 3–4 December 2011; pp. 640–643. [Google Scholar]
  22. Sadri, J.; Yeganehzad, M.R.; Saghi, J. A novel comprehensive database for offline Persian handwriting recognition. Pattern Recognit. 2016, 60, 278–393. [Google Scholar] [CrossRef]
  23. Kubiak, I. LED printers and safe fonts as effective protection against the formation of unwanted emission. Turk. J. Electr. Eng. Comput. Sci. 2017, 25, 4268–4279. [Google Scholar] [CrossRef]
  24. Mahshid, Z.; Saeedeh, H.T.; Ayaz, G. Security limits for Electromagnetic Radiation from CRT Display. In Proceedings of the Second International Conference on Computer and Electrical Engineering, Dubai, UAE, 28–30 December 2009; pp. 452–456. [Google Scholar]
  25. Shainir, A.; Rappoport, A. Extraction of Typographic Elements from Outline Representations of Fonts. Comput. Graphics Forum 1996, 15, 259–268. [Google Scholar] [CrossRef]
  26. Shi, J.; Yongacoglu, A.; Sun, D.; Dong, W. Computer LCD recognition based on the compromising emanations in cyclic frequency domain. In Proceedings of the 2016 IEEE International Symposium on Electromagnetic Compatibility (EMC), Ottawa, ON, Canada, 25–29 July 2016; pp. 164–169. [Google Scholar]
  27. Liu, J.; Zhang, J.; Liu, T.; Li, Y. The reconstitution of LCD compromising emanations based on wavelet denoising. In Proceedings of the 12th International Conference on Computer Science and Education (ICCSE 2017), Houston, TX, USA, 22–25 August 2017; pp. 294–297. [Google Scholar]
  28. Ulaş, C.; Aşık, U.; Karadeniz, C. Analysis and reconstruction of laser printer information leakages in the media of electromagnetic radiation, power, and signal lines. Comput. Secur. 2016, 58, 250–267. [Google Scholar] [CrossRef]
  29. Ulas, C.; Sahin, S.; Memisoglu, E.; Aşık, U.; Karadeniz, C.; Kilic, B.; Sarac, U. Automatic Tempest Test and Analysis System Design. Int. J. Cryptogr. Inf. Secur. 2014, 4, 1–12. [Google Scholar] [CrossRef]
  30. Kubiak, I.; Musiał, S. Hardware Raster Generator as a tool that supports electromagnetic infiltration. Telecommun. Rev. Telecommun. News 2011, 11, 1601–1607. [Google Scholar]
  31. Tokarev, A.B.; Pitolin, V.M.; Beletskaya, S.Y.; Bulgakov, A.V. Detection of informative components of compromising electromagnetic emanations of computer hardware. Int. J. Control Theory Appl. 2016, 9, 9–19. [Google Scholar]
  32. Zhang, J.; Li, M.; Tang, Z.; Gong, X.; Wang, W.; Fang, D.; Wang, Z. Defeat Your Enemy Hiding behind Public WiFi: WiGuard Can Protect Your Sensitive Information from CSI-Based Attack. Appl. Sci. 2018, 8, 515. [Google Scholar] [CrossRef]
  33. Hong, Z.; Wael, W. Dual image processing algorithms and parameter optimization. In Proceedings of the 2011 Seventh International Conference on Natural Computation (ICNC 2011), Shanghai, China, 26–28 July 2011; pp. 946–950. [Google Scholar]
  34. Amnesh, G.; Nidhi, C. A Technique for Image Encryption with Combination of Pixel Rearrangement Scheme Based on Sorting Group-Wise of RGB Values and Explosive Inter-Pixel Displacement. Int. J. Image Graphics Signal Process. 2012, 2, 16–22. [Google Scholar] [CrossRef]
  35. Guerrieria, M.; Parlab, G.; Celaurob, C. Digital image analysis technique for measuring railway track defects and ballast gradation. Measurement 2018, 113, 137–147. [Google Scholar] [CrossRef]
Figure 1. An example of a reconstructed image from a source of compromising emanations in VGA analogue standard form (reception frequency f o = 650 MHz , B W = 20 MHz ; sampling frequency f s = 62.5 MS / s ) inversion of the image.
Electronics 08 01063 g001
Figure 2. Filtration forming module.
Electronics 08 01063 g002
Figure 3. Application effect of a low-pass filter on the output of the VGA video standard.
Electronics 08 01063 g003
Figure 4. Application effects of edge smoothing modes of graphic characters in Windows XP OS: (a) without edge smoothing mode (inaccessible for Windows 7 OS), (b) Standard edge smoothing mode, and (c) ClearType edge smoothing mode.
Electronics 08 01063 g004
Figure 5. Examples of bit structures of TMDS signals for pixel amplitude values (a) 251 and (b) 255.
Electronics 08 01063 g005
Figure 6. The original image (a) and the same image reproduced from the TMDS signal (without decoding) appearing on the output of graphics card (b), which is the source of the compromising emanations. The enlarged fragment (c) of the image (b) containing a text.
Electronics 08 01063 g006
Figure 7. Image (a) obtained by using a TMDS signal differentiation operation (Figure 6b) and its enlarged fragment (b).
Electronics 08 01063 g007
Figure 8. An anechoic chamber (a), a DSI-1550-A measurement system (b), and an antenna system (c).
Electronics 08 01063 g008
Figure 9. A selection window for edge smoothing modes.
Electronics 08 01063 g009
Figure 10. The courses of correlation function R (n) for selected color pairs in grayscale: (a) 238 × 8, (b) 255 × 0.
Electronics 08 01063 g010
Figure 11. Sequences of bits for selected colors values after application of TMDS coding: (a) the value 8, (b) the value 238, (c) the value 22, (d) the value 210, (e) the value 0, and (f) the value 255.
Electronics 08 01063 g011
Figure 12. Examples of images obtained based on compromising emanations for different color pairs (background and characters) and for three edge smoothing modes (using Windows XP OS) for theoretical analysis: (a) without an edge smoothing mode, (b) Standard edge smoothing mode, and (c) ClearType edge smoothing mode.
Electronics 08 01063 g012
Figure 13. The displayed image on the test screen.
Electronics 08 01063 g013
Figure 14. Examples of images obtained based on compromising emanations measured in the following frequencies: (a) fo = 591 MHz and (b) fo = 642 MHz (BW = 100 MHz, sampling frequency fs = 250 MHz).
Electronics 08 01063 g014
Figure 15. Example images. (a) The original image of the Warsaw city plan from 1934 (public domain, resolution 1920 × 1080), and (b) a restored image of the Warsaw city plan displayed on a computer monitor (fo = 1155 MHz, BW = 50 MHz, sampling frequency fs = 125 MHz) using DVI standard.
Electronics 08 01063 g015
Figure 16. Example images. (a) A frame from a movie displayed on a computer (Prelinger Archives, resolution 1920 × 1080), and (b) the restored image of the frame displayed on a computer monitor (fo = 1155 MHz, BW = 50 MHz, sampling frequency fs = 125 MHz) using DVI standard.
Electronics 08 01063 g016
Figure 17. An example of an image obtained based on compromising emanations measured in the frequency fo = 642 MHz (BW = 100 MHz, sampling frequency fs = 250 MHz).
Electronics 08 01063 g017
Figure 18. An example of an image obtained based on compromising emanations measured in the frequency fo = 494 MHz (BW = 10 MHz, sampling frequency fs = 1250 MHz) for a source of emission in analogue VGA standard form.
Electronics 08 01063 g018
Table 1. Examples of TMDS (transition minimized differential signaling) coding of pixel amplitude values.
Value l of Pixel AmplitudeBinary Form ql of Value l of Pixel AmplitudeTMDS Coding
First 10-Bit WordSecond 10-Bit Word
00000000001000000001111111111
1501001011000110110001000100111
2511111101100000000111011111100
2551111111100111111111000000000
Table 2. An algorithm of doubled number of bits.
Bit NumberIntegral Part by Dividing n by 2String with a Doubled Number of Each BitDoubled Number of Each Bit
nm = n/2znxm
00z0x0
10z1x0
21z2x1
31z3x1
42z4x2
52z5x2

