Article

An Extended Approach for Validation and Optimization of Position Sensor Signal Processing in Electric Drive Trains

by
Christoph Datlinger
* and
Mario Hirz
Institute of Automotive Engineering, Graz University of Technology, 8010 Graz, Austria
*
Author to whom correspondence should be addressed.
Electronics 2019, 8(1), 77; https://doi.org/10.3390/electronics8010077
Submission received: 24 October 2018 / Revised: 23 December 2018 / Accepted: 24 December 2018 / Published: 10 January 2019
(This article belongs to the Section Systems & Control Engineering)

Abstract

:
Due to the increasing electrification of automotive drive train systems, accurate position and speed sensors play an important role to achieve an optimum drive train performance and driving range. These sensor systems determine the rotor shaft position to deliver exact data for efficient drive train control. The system itself must be reliable, sufficiently accurate and cost efficient at the same time. In this way, the design process of the sensor system is influenced by a trade-off, which influences the system performance in view of different parameters, e.g., resolution and data processing accuracy. The focus of the present work is to introduce a method for benchmarking the performance of not only the rotor shaft position sensor, but the whole electric drive train sensor systems by use of a highly accurate reference system on a specifically developed test bench. To achieve a significant benchmark statement by determination of the rotor position angle error, the independent measuring systems, the automotive drive train system and the reference system are synchronized by the use of a common trigger/clock signal. The mentioned signal defines the time steps of the system under test rotor position angle capturing procedure and those of the reference system simultaneously. This enables a common time-base for two independent working measurement systems. This publication provides information about a concept for enhanced rotor position sensor evaluation that enables the merging of real-time data processing with test bench measurement. This procedure provides an important basis for the selection and optimization of position sensor systems for sophisticated electric powertrains.

1. Introduction

Legislation in the European Union (EU) is aiming for a significant reduction of carbon dioxide (CO2) emissions in the road transport sector. This targets, in particular, passenger cars, since this vehicle type is responsible for approximately 12% of total CO2 emissions in the EU [1].
To achieve the strict targets, original equipment manufacturers (OEMs)—in this case the automotive industry—are pushing the electrification of drive train systems, which results in an increasing share of hybrid and electric vehicles on the market.
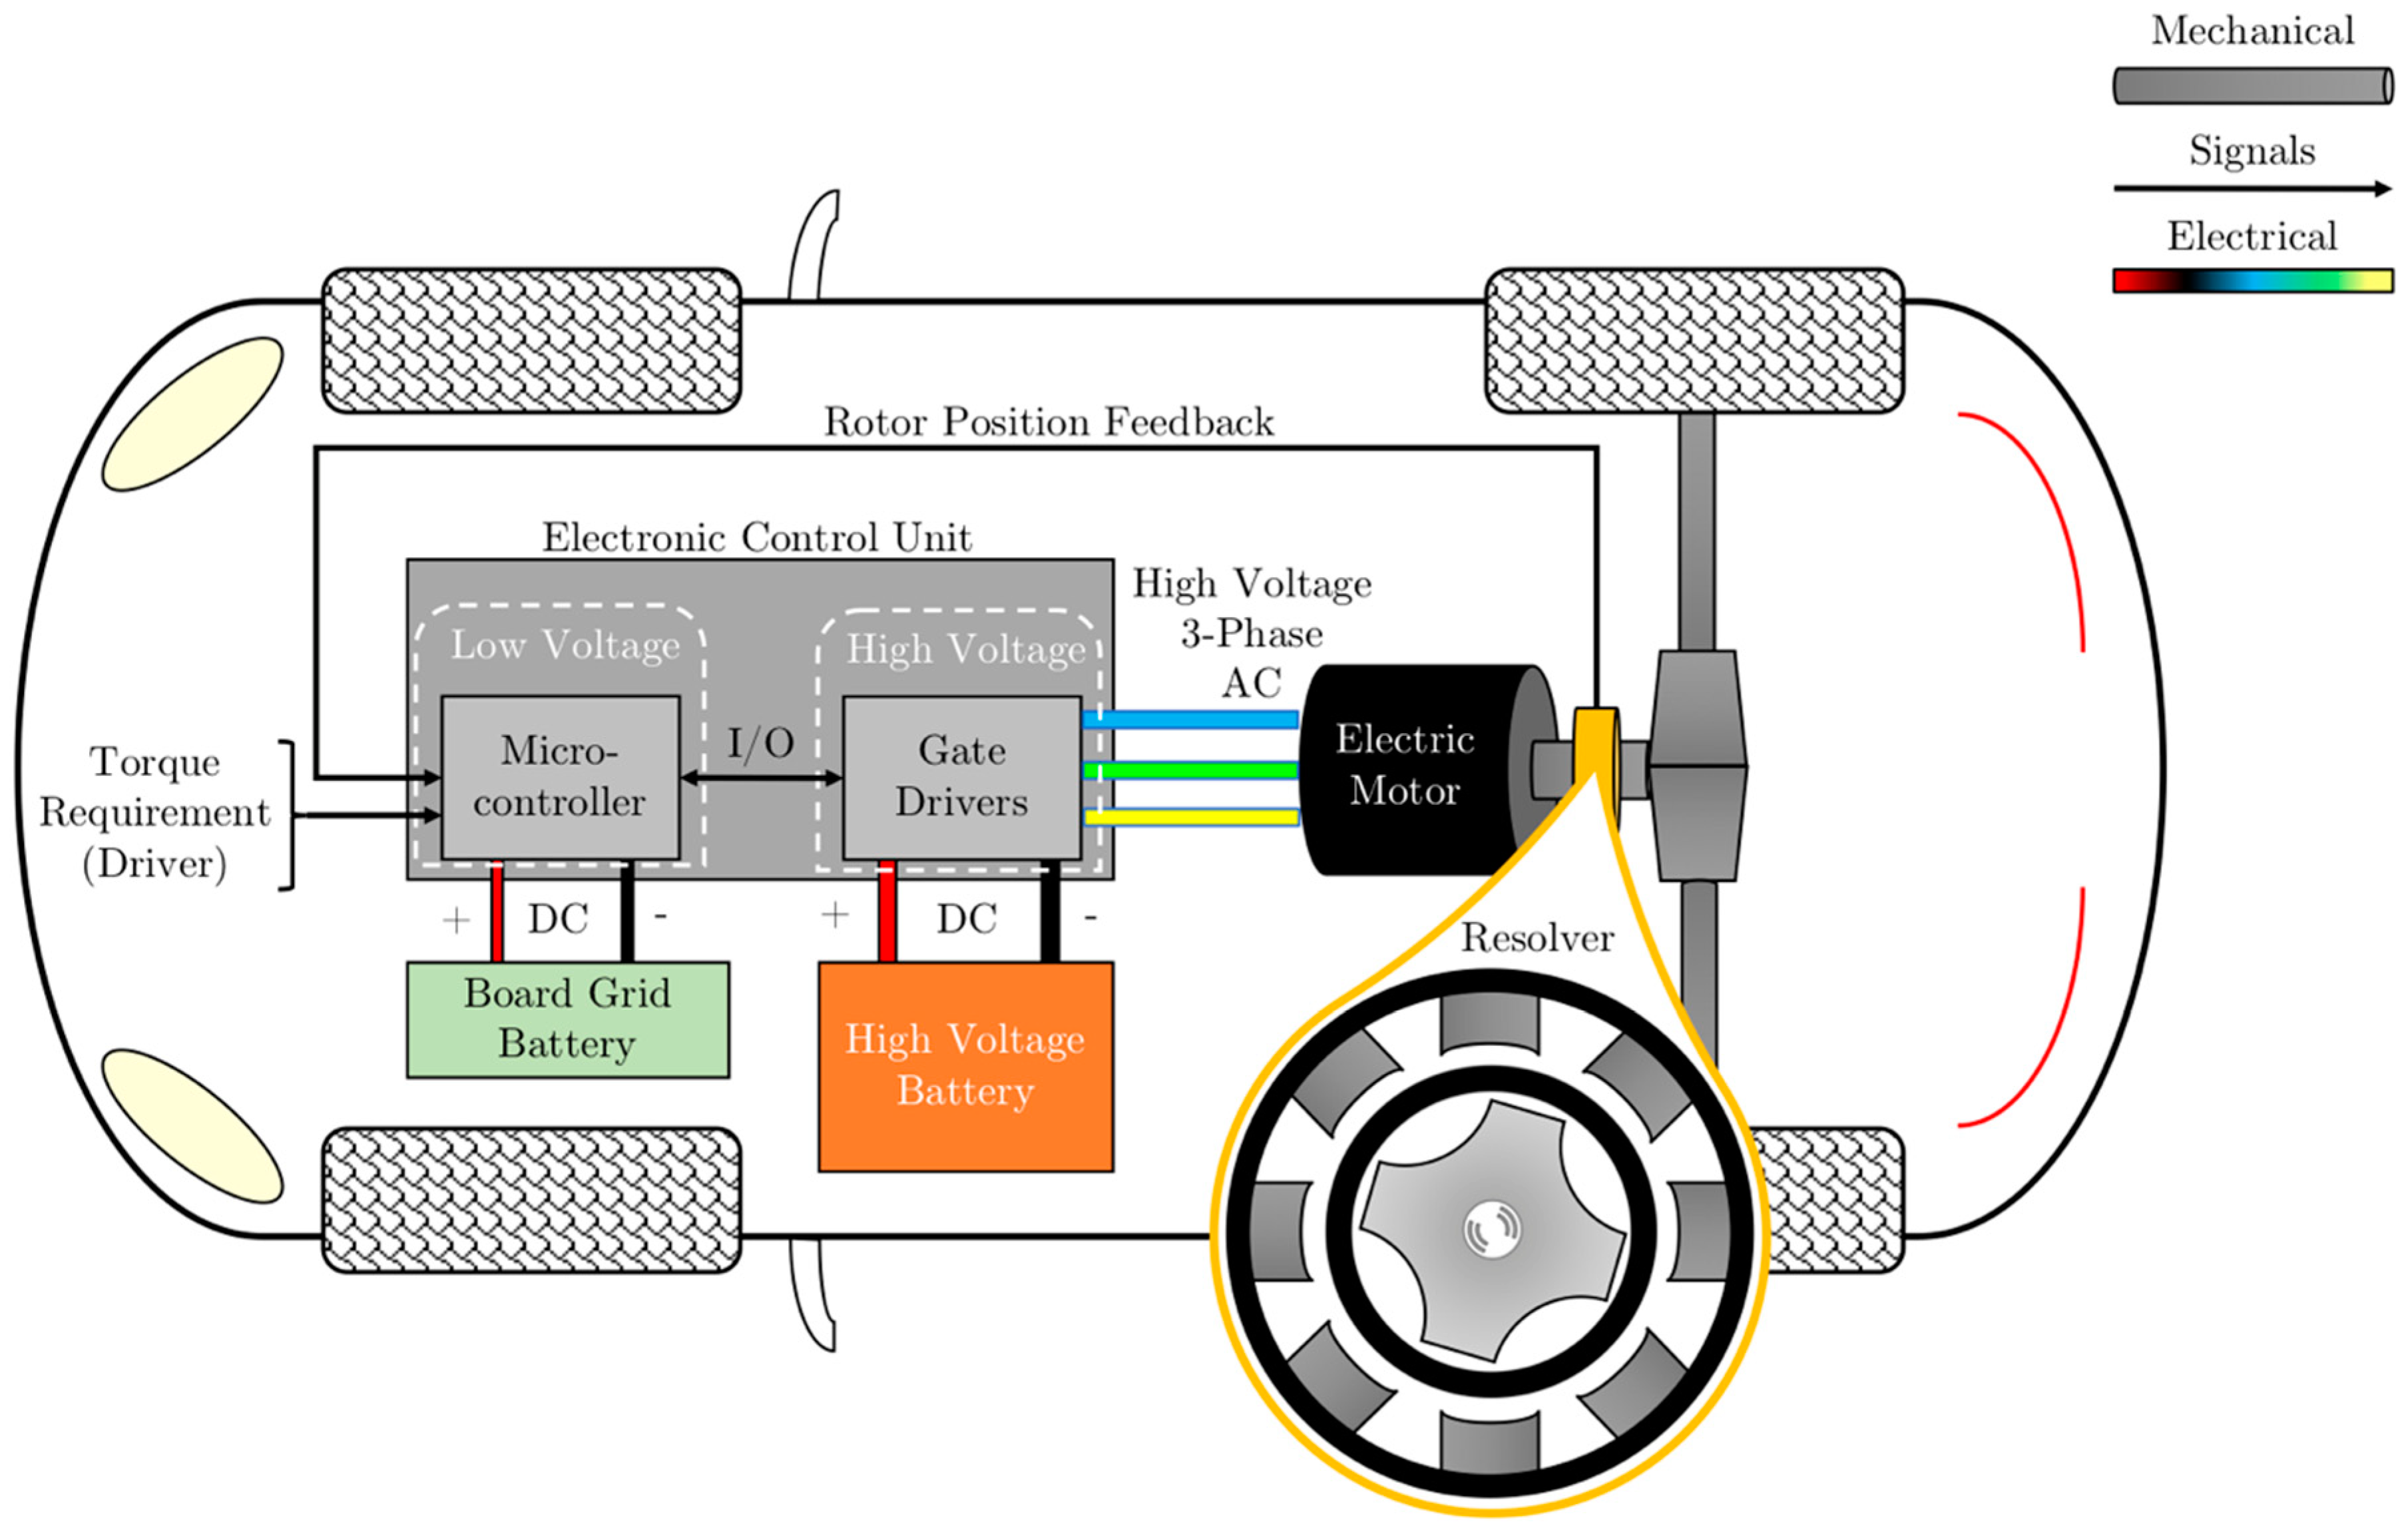
The performance characteristics of electric drive trains play a major role to reach efficiency targets of both technologies, hybrid and electric drives. One important factor influencing performance and efficiency represents the quality of control of the electric traction motor. Besides other parameters, the quality of motor control relies on a precise detection of the current motor shaft position and speed. Therefore, accurate sensors are used, e.g., resolvers, eddy current-based rotor position sensors, or hall sensors. Apart from the sensor type, sensor data processing plays an essential role to provide accurate information in real-time. In this context, the information about rotor position—delivered by the shaft sensor—has to be converted, conditioned (e.g., filtered), processed, and transferred to the motor control algorithm embedded in an electronic control unit (ECU). The motor controller comprises a microcontroller (µC) as an actual control unit and the power electronics (gate drivers) for controlling the electric traction motor [2,3,4,5]. Figure 1 demonstrates a state-of-the-art architecture of an electric drive train and highlights the position sensor, exemplarily represented as a resolver.
The entire sensor system containing an accurate sensor system, as well as a powerful computation unit, must suit the harsh boundary conditions during the operation of a car. Since costs play an important role in automotive applications, the design process of the sensor system includes multi-objective optimization to meet the various requirements in the matters of accuracy, durability and costs.
This paper introduces an experimental-based synchronization concept capable of evaluating and validating rotor position sensor systems for arbitrary electric drive train systems by use of a specific sensor test bench [6,7].
The examined sensor system in the present work consists of a resolver acting as a rotor position sensor and a microcontroller as typically used in automotive applications. For validation, the output data of the tested powertrain sensor system are compared with a high precision reference system included in the mentioned test bench. Because both systems are operating independently, synchronization approaches have to be implemented that are able to combine hardware and software. In more detail, both systems—the reference system and the device under test—deliver information about the angular rotating shaft position on the test bench. Hence both systems work asynchronously, and a synchronization between these two systems has to be achieved. State-of-the-art network synchronization algorithms [8,9,10] are not suitable to meet the requirements, because measurement systems do not rely on network models and communication protocols. Other real-time and offline synchronization methods only rely on clock synchronization of independent working systems, but they do not enable measurand compensation in the same step [11,12,13,14].
Before comparing the resulting measured angles with each other—and so performing further angle error evaluation—it has to be ensured that both angle values are related to the correct timestamp. Apart from this relevant requirement, the correct angle value proceeded within the ECU needs to be determined, since the sampling process is typically asynchronous in relation to the software task timing in the µC. This characteristic is owed by a specific automotive-compatible controller behavior applied for this test setup. Once all compensation steps are done, the performance capability of the examined sensor system is determined as a result of the evaluation process. This enables a novel sensor system characterization by establishment of the angle error and a statistical error analysis based on design of experiments (DoE) [6,7,15] under consideration of signal processing issues such as system latency [2,3]. Based on the high degree of measurement accuracy, the introduced analysis process allows an enhanced optimization of various types of position and speed sensor systems for electric drive trains.

2. Materials and Methods

2.1. Sensor Test Bench

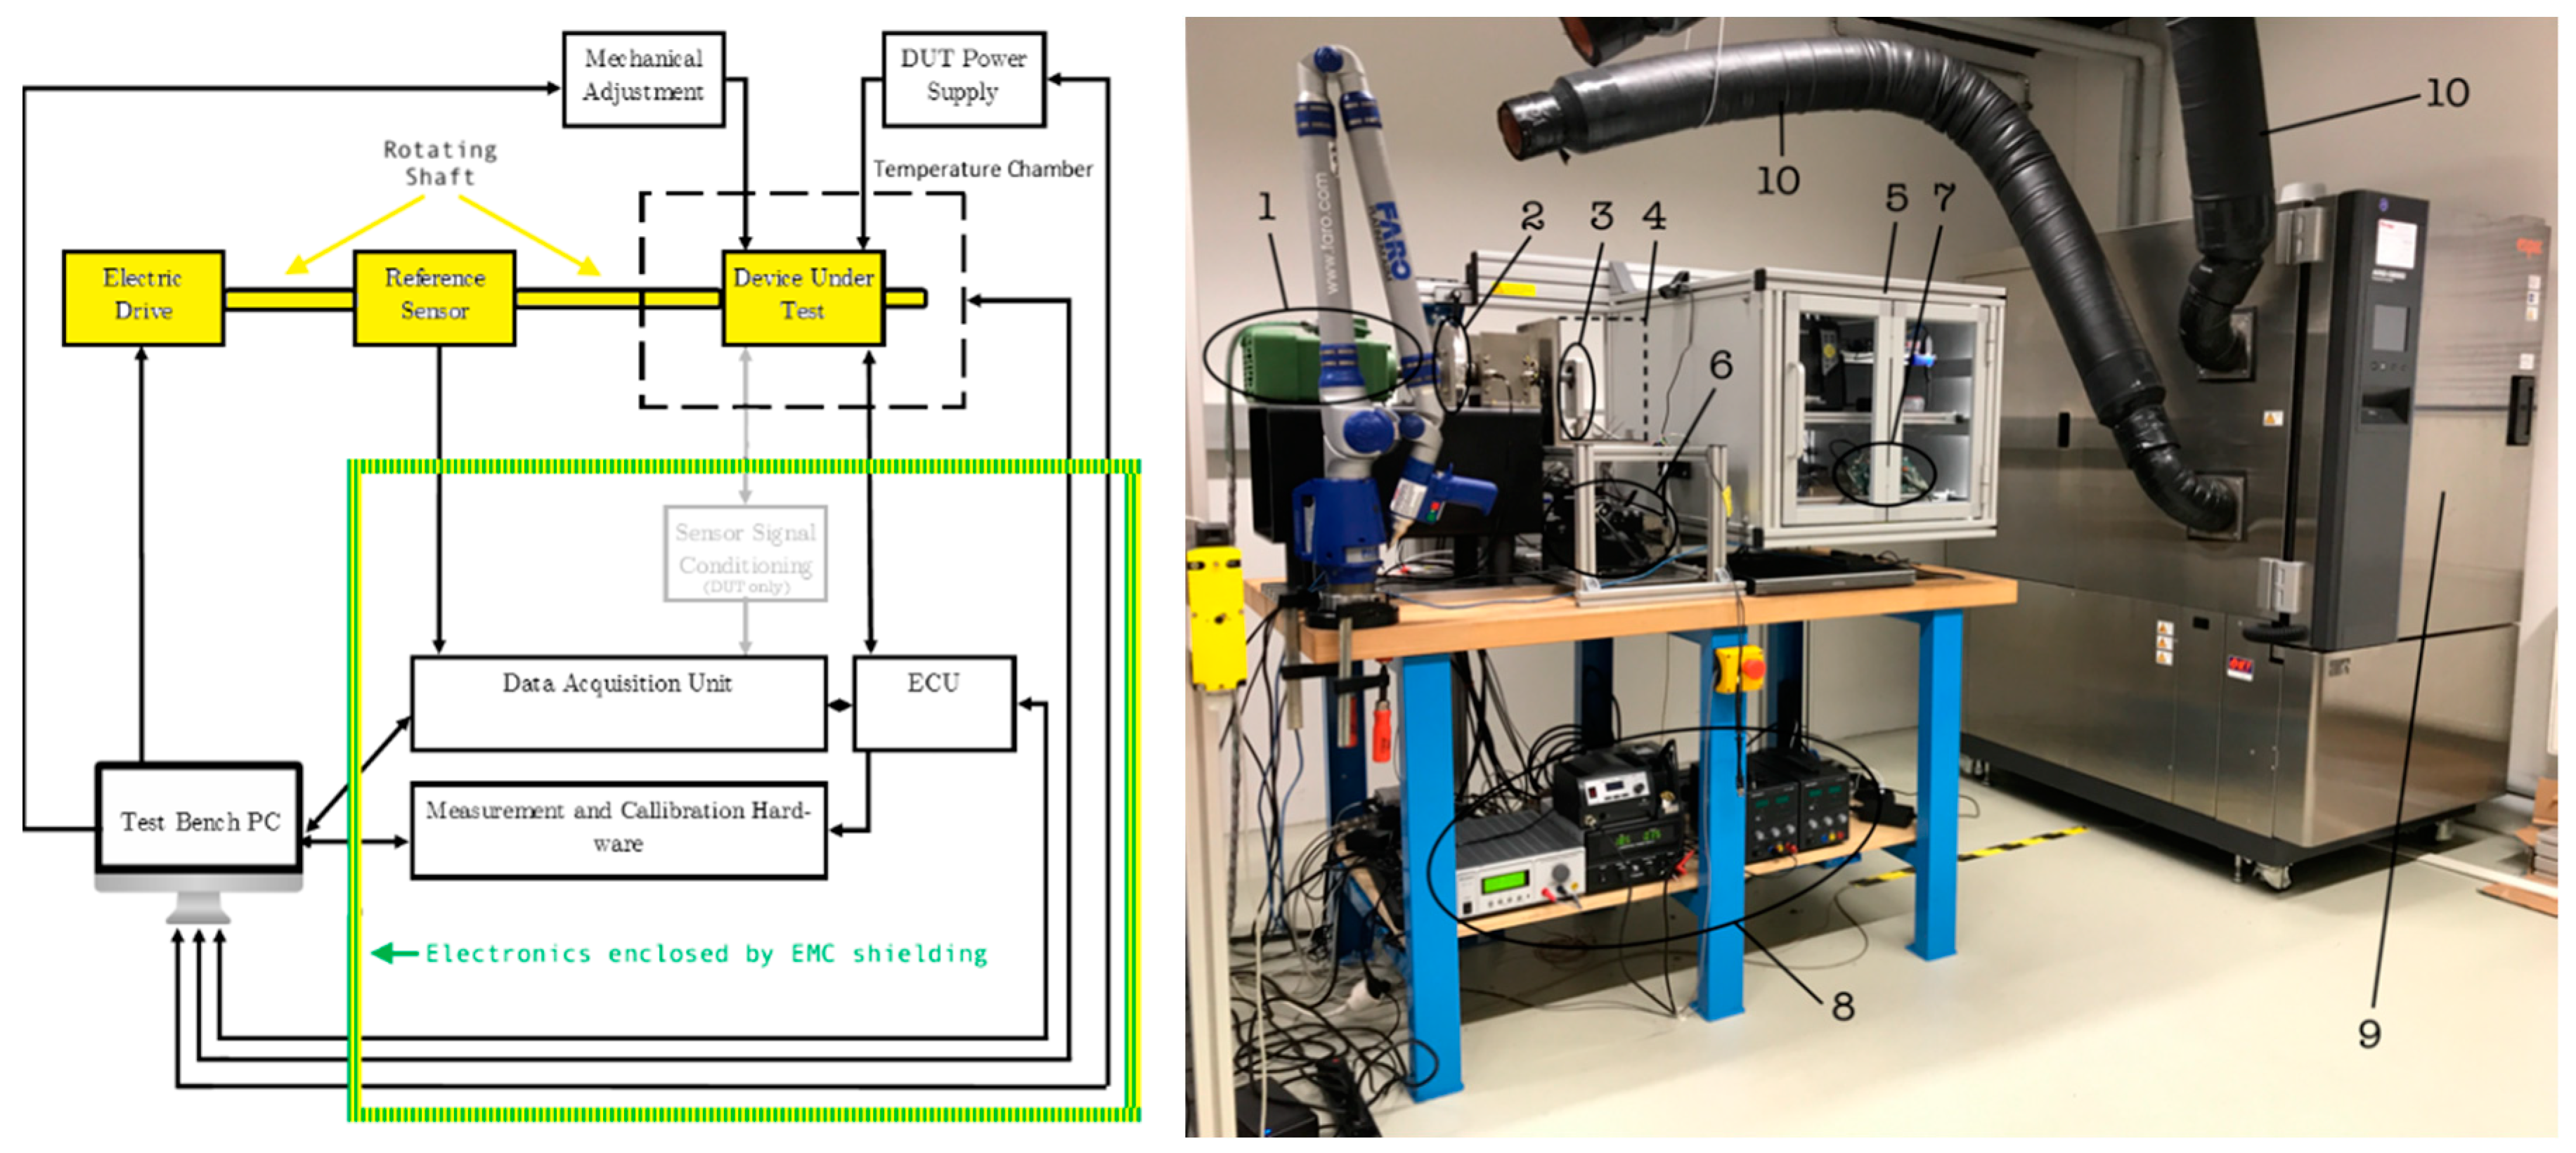
The experimental parts of the research activities have been conducted on a specifically developed test bench for position and speed sensor systems [2,6,7]. The test bench consists of an electric drive (induction motor), providing a maximum speed of 24,000 rpm in both directions with a maximum acceleration of 10,000 rpm/s. This enables realistic test conditions as they occur in different automotive driving profiles. Furthermore, an ambient temperature can be applied to the device under test (DUT) within the range of −40 °C to +160 °C using a temperature chamber surrounding the DUT and a climatic chamber used as a thermal generator. To investigate the effects of mechanical misalignment between the sensor rotor relative to the stator, the DUT can be adjusted in four axes (x, y, z, and tilt-angle) by a multiple set of precise motorized positioning actuators. The influence of supply voltage variations can be tested by a controlled power supply from zero to 40 V. Besides these parameters, a high precision Hall-based reference sensor with an angular resolution of <0.1° at 24,000 rpm is connected with a state-of-the-art 5 mega samples per second (MS/s) Field Programmable Gate Array (FPGA)-based data acquisition unit feeding an rpm-dependent transistor-transistor-logic (TTL) signal. Three signal tracks are available, namely A- and B-tracks for detecting the rotation direction, as well as a Z-track for zero position detection. The counter of the data acquisition unit increments every sensor step and resets the counter when the Z-track rises. Based on the counter information and knowledge of the reference sensor’s maximum increments per revolution (here: 8192 increments), a rotor position angle can be computed online. This process plays an important role; hence it represents the experimental fundament to determine the reference position. Furthermore, the reference sensor is used for control of the electric test bench machine.
Considering a complete vehicle sensor system comprising a position sensor and a microcontroller for signal processing (see Figure 1). The output of the investigated system is read out through a set of FPGAs, polling the desired data (e.g., raw sensor signals, estimated rotor position) without having an influence on the microcontroller’s processing time; therefore, the desired information is only available internally. Of course, the evaluated system has to be synchronized with the reference sensor system to enable a comparison between both systems (see Section 2.4). For an adequate signal accuracy, all electronic components and measurement systems are shielded to prevent electromagnetic compatibility (EMC) influence [2,3,6,15]. Figure 2 shows an overview and the relevant components of the sensor test bench. As shown in Figure 2, a climatic stress chamber is used for temperature conditioning, transferring the climate via thermal tubes into the DUT-temperature chamber. The special designed data acquisition housing comprises the total data acquisition (ECU + reference measurement unit) and is capable of being placed as close as possible to the DUT.

2.2. System under Test

The evaluated drive train sensor system comprises two main parts, namely a rotor position sensor and an ECU (see Figure 1), including the microcontroller only. In this way, the rotation is set by the test bench and not by the gate drivers of the ECU (open-loop architecture). In this work, the investigated rotor position sensor type is a resolver, which will be explained in the following section.

2.2.1. Resolver

Resolver technology is known as a state-of-the-art sensor when it comes to applications that need reliable performance under rough conditions, e.g., high temperature, shocks and vibrations, radiation and contamination. This recommends the resolver as a suitable alternative compared to other sensor types e.g., magnetic or optical systems for shaft angle encoding.
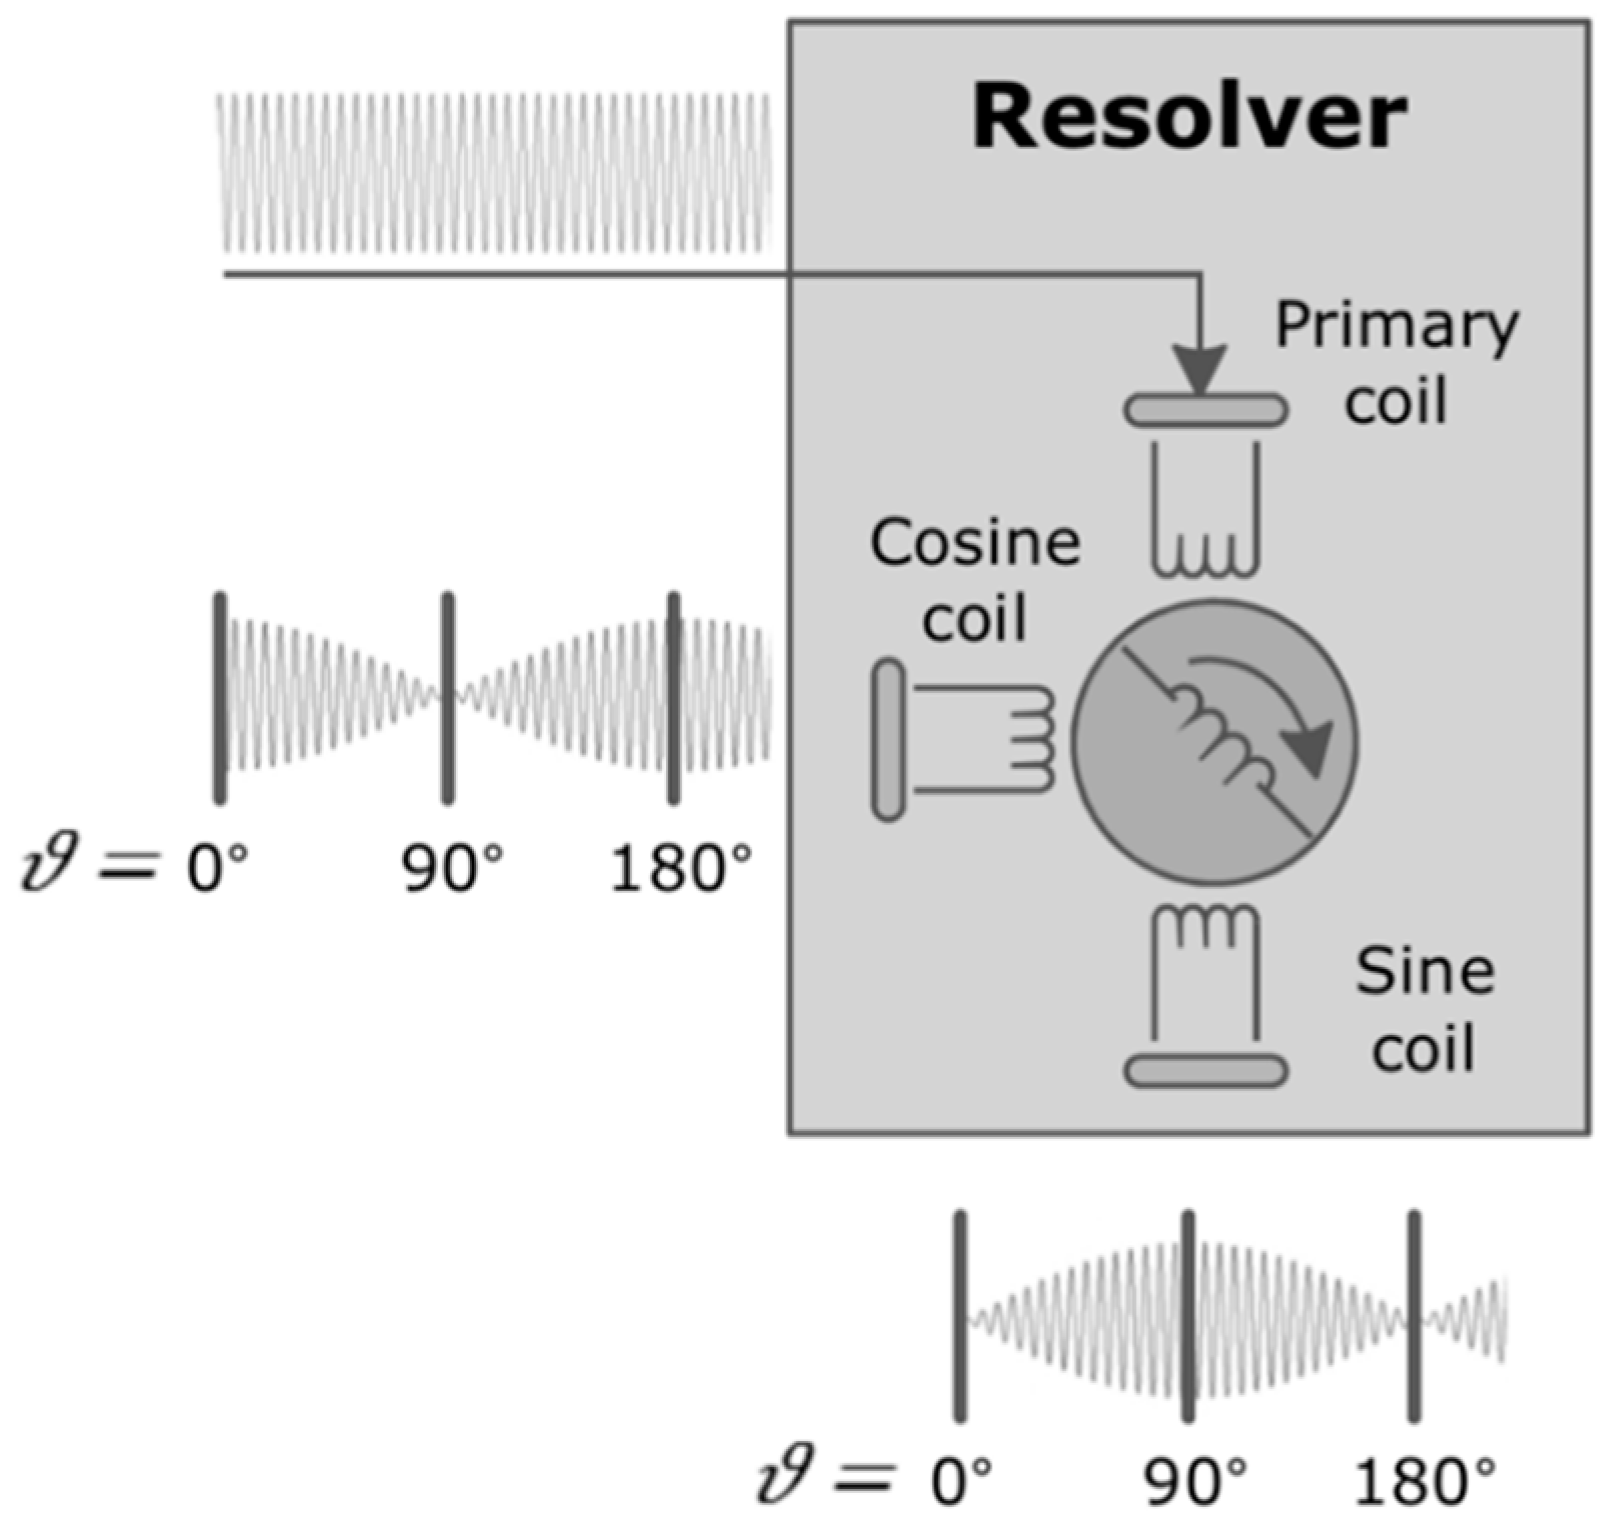
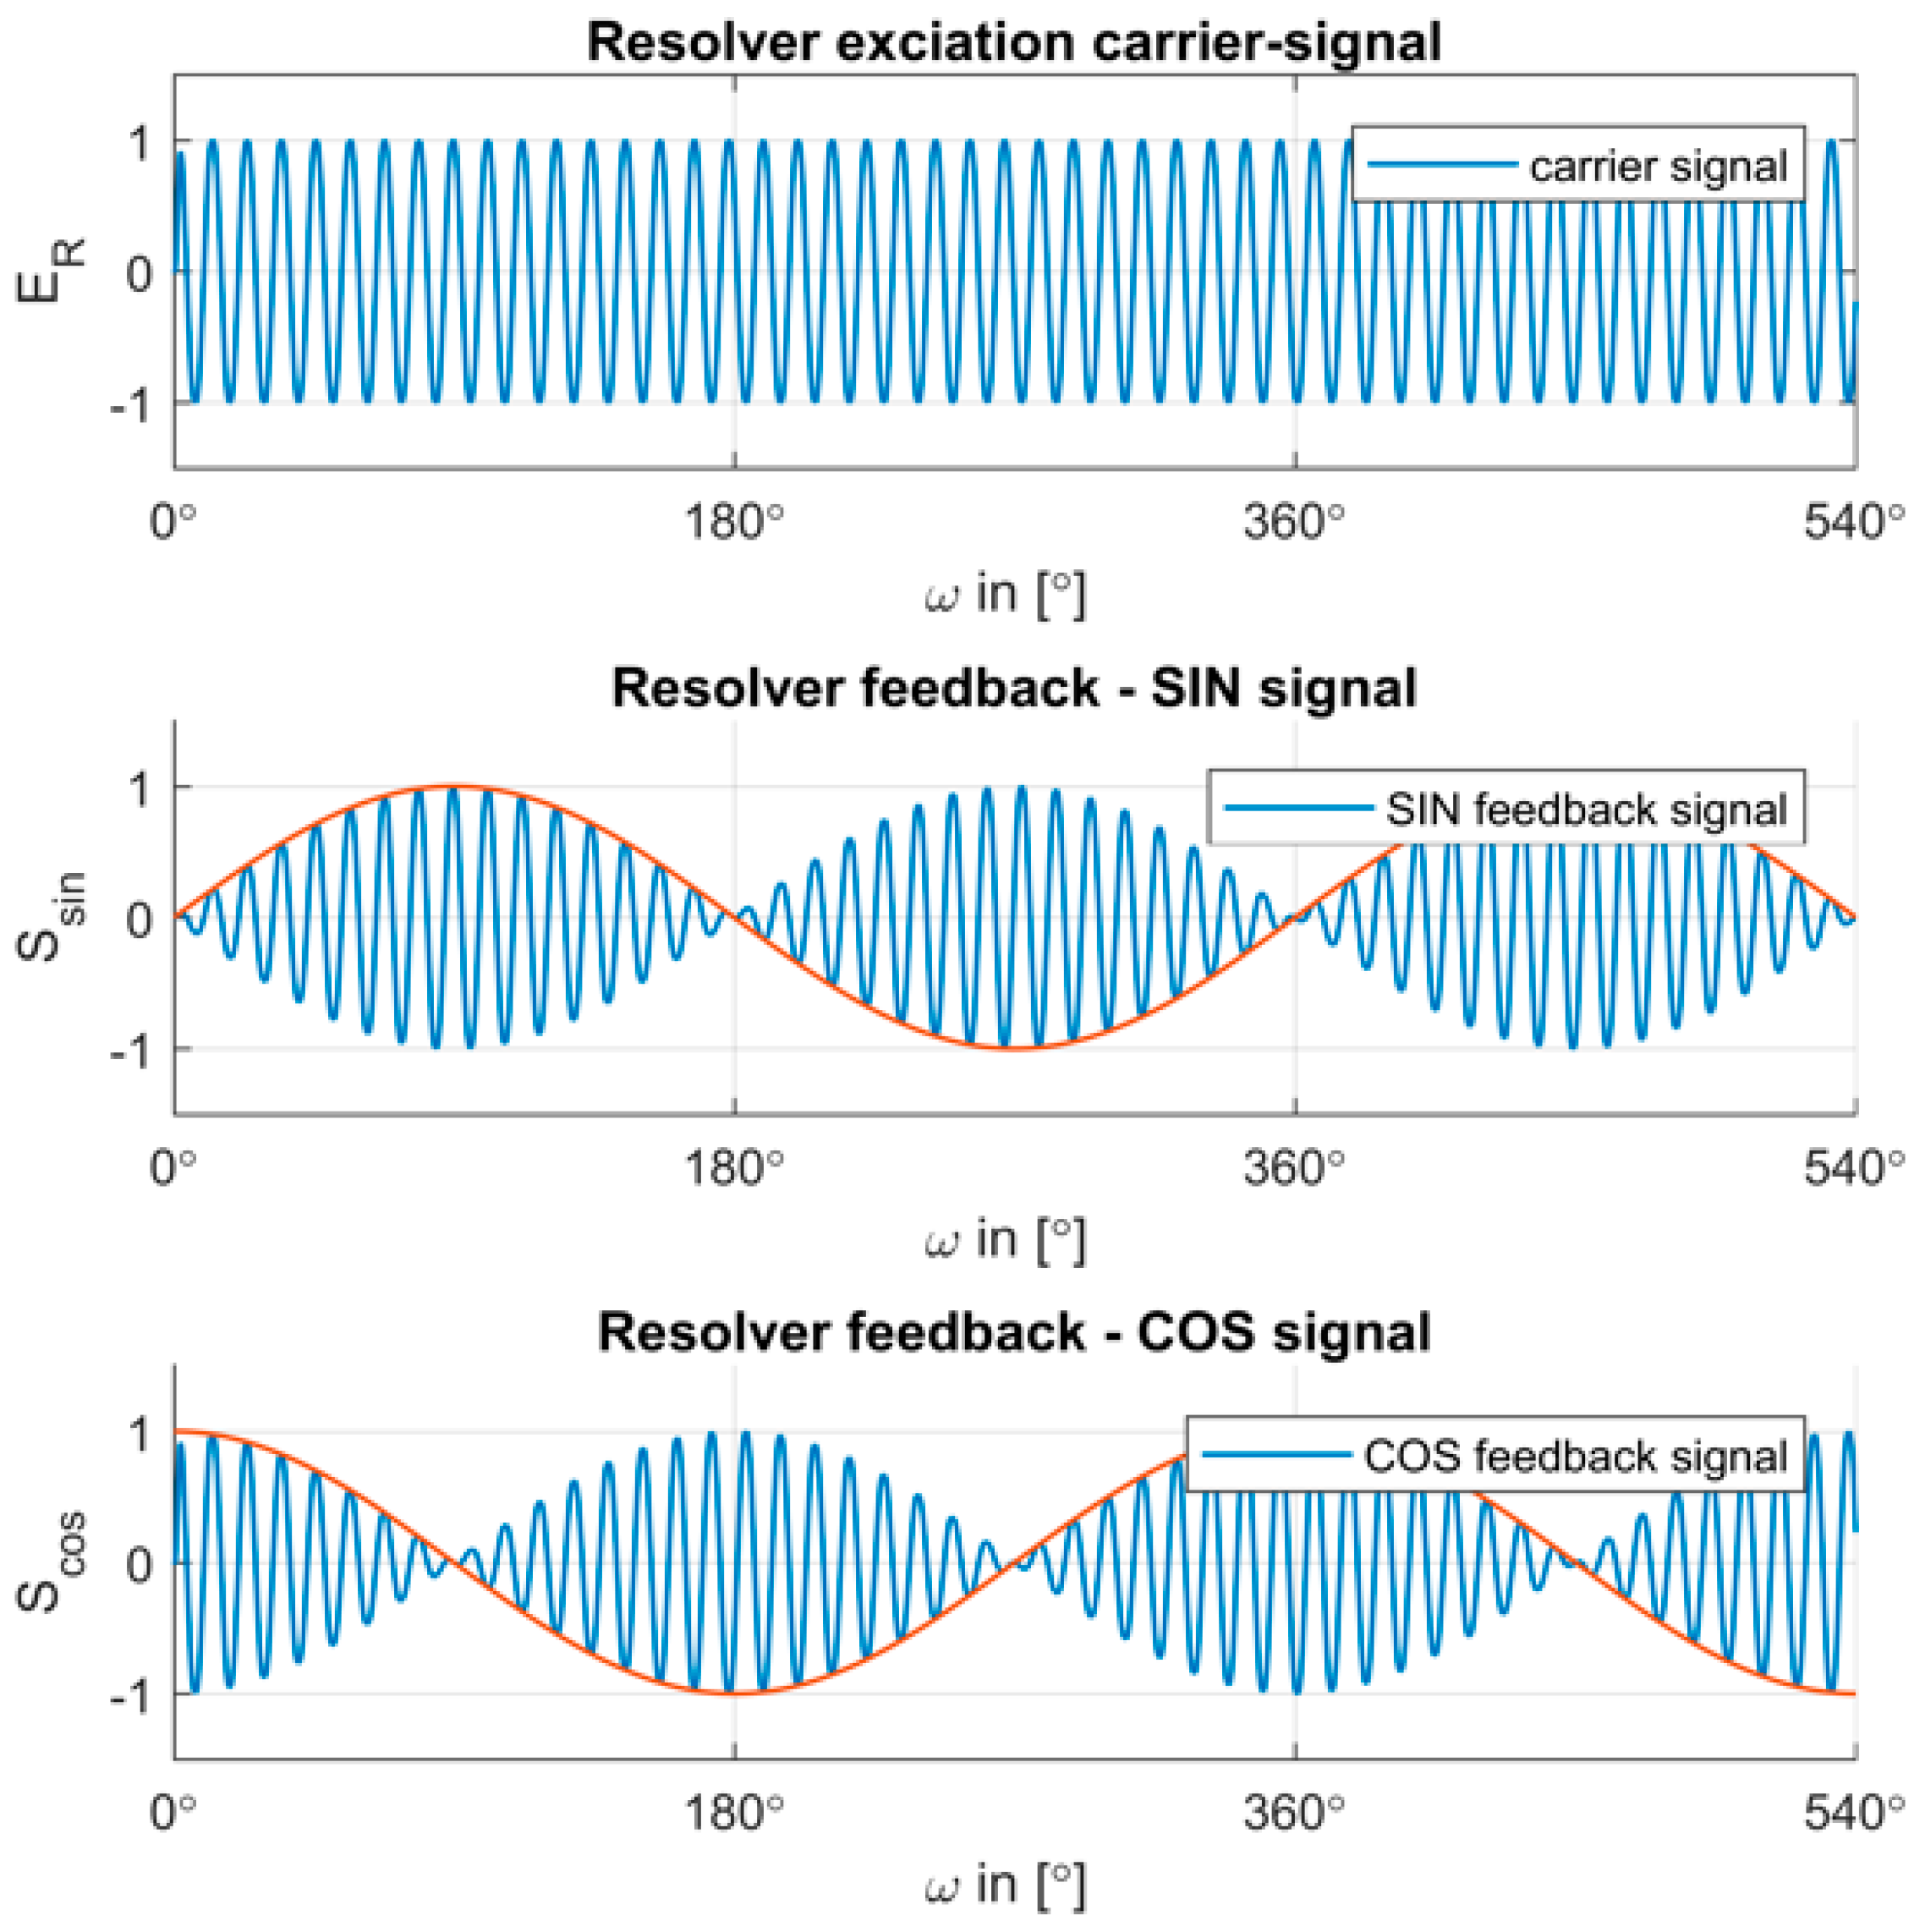
The variable reluctance resolver applied in this work, also called an eddy current resolver, is considered as a rotating electric transformer. It consists of one primary winding and two secondary windings (sine and cosine coil), where the primary winding is acting as the resolver’s rotor and the two secondary windings represent the stator, where they are physically displaced from each other by 90° as shown in Figure 3 [2,3,6,7,15,16,17,18]. The sensor itself is excited by a high frequency sinusoidal signal of usually f = 10 kHz. This signal is also called the carrier signal. While the shaft rotates, the inductive coupling between the windings changes according to the position of the rotary part of the resolver. From this change of the inductive coupling, the shaft position is determined. The resulting signals on the sine and cosine coil are amplitude modulated sinusoidal signals with the same frequency as the carrier signal, shown in Figure 4. With these signals only, it is not possible to establish a correct angular rotor position. To determine the actual rotor position, first a demodulation unit in the microcontroller computes the envelope of the resolver feedback signals by extracting the carrier signal (shown in Figure 4 as the red line) before calculating the resolver angle. The sensor signal acquisition by analog-to-digital conversion, as well as the demodulation process, are stated in more detail in [3].
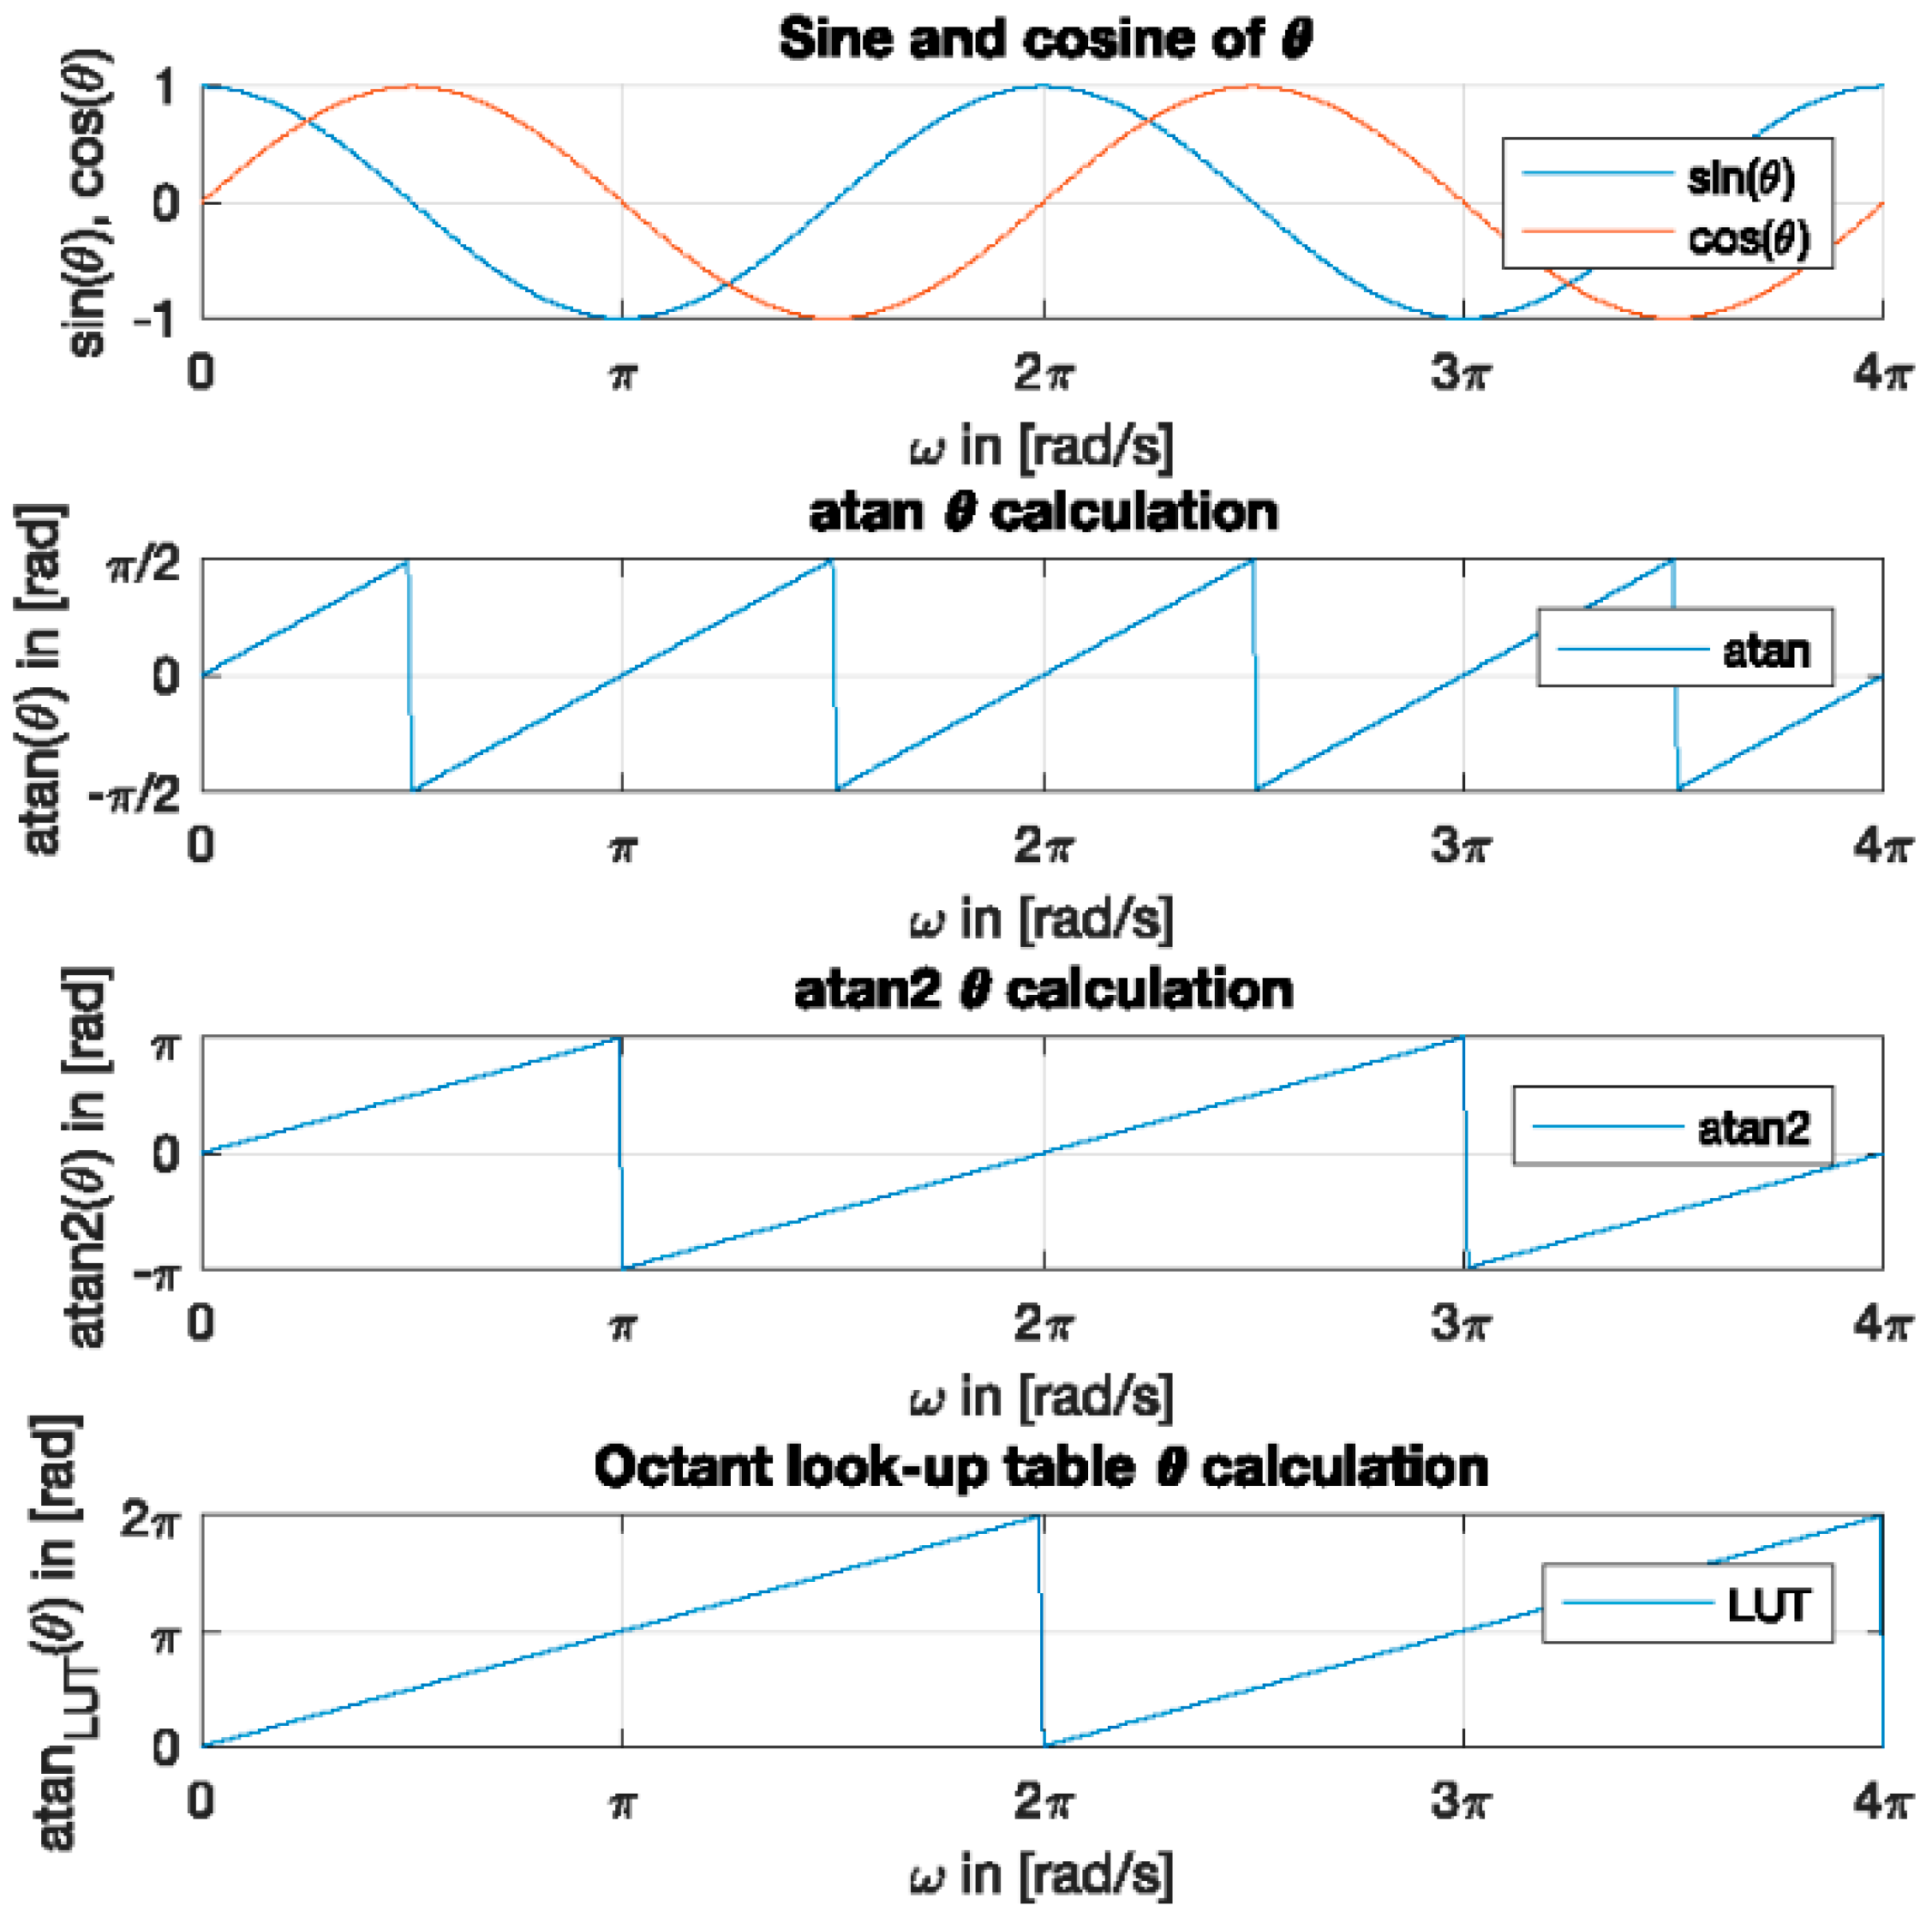
Processing of the sine and cosine signal is performed by use of a mathematical operation of the sine value over the cosine value and then applied to a four-quadrant inverse tangent (ATAN2) function, which also enables a noise reduction process considering the ambient noise that has the same effect on both windings [6]. This mechanism also provides adequate temperature compensation. Thereby the arguments of the Cartesian coordinates (sine and cosine), stated in Equations (1) and (2), are passed through the trigonometric-based ATAN2 function extracting the root of the quadratic arguments (Equation (3)). As a result, the polar angle represents the position of the resolver’s rotor (Figure 5). With an octant look-up table, a position resolution from 0 to 2π (in polar coordinates) can be achieved, which represents the mechanical resolution from 0° to 360° (in Cartesian coordinate system) [2,3].
x = r·cos(phi)
y = r·sin(phi)
r := sqrt(x2 + y2)
An important term characterizing the resolver working principle is the electric zero (EZ), which is defined as the position of the rotor that gives a maximum amplitude for the resolver output cosine windings and at the same time gives a minimum amplitude of the resolver sine output windings (ideal: Vsin = 0 V) under the condition of a rated carrier signal voltage.
Resolvers, as stated before, come in many types. In order to specify the type of the resolver, the design should be addressed that determines the resolver type.
Regarding the design of the resolver windings, the coils are wound over a slotted lamination, which is wound with one of two types of windings: a constant pitch-variable turn or a variable pitch-variable turn pattern. In both types of windings, the windings are distributed in a sinusoidal pattern. This winding type introduces what is called the resolver’s speed. The resolver’s speed encompasses the number of electrical cycle periods that are there as an output in the sine and the cosine windings for each complete mechanical rotation. For the case of single speed, a single electrical period at the output sine and cosine winding is generated for each mechanical revolution. For a multi-speed resolver, more than one electrical period for each mechanical revolution can be obtained [8]. Design criteria of resolver systems involve the speed of the resolver and the effort of control involved, where the multi-speed resolver is normally used when high accuracy is required. If the application deals with a very small change of velocity over time steps, the multi-speed resolver technology might be an ideal choice. For typical automotive electric motor control, the resolver speed is determined based on the number of poles of the motor, as for a 10-pole electric motor, a 5-speed resolver is adequate.
Generally, single-speed resolvers consist of a simple and affordable design and they are used in lots of daily applications of electric machines. They are able to provide an absolute rotor position in the range of 0° to 360° and are used in servo motors, actuators and robotics [18].
Multi-speed resolvers are generally equipped with a certain number of windings to generate several electrical cycles per one mechanical revolution. The benefit of having a higher-speed resolver over the single speed resolver is that the increased number of windings reduces the contribution of possible mechanical error to the overall system error. On the other hand, the complex winding pattern in multi-speed resolvers increases the resolver costs. This is the reason why higher speed resolvers are generally preferred only for applications with high requirements on sensor system performance.
As stated above, a specific processing unit is used to process the sensor signals and thus to determine the rotor position.

2.2.2. Electronic Control Unit

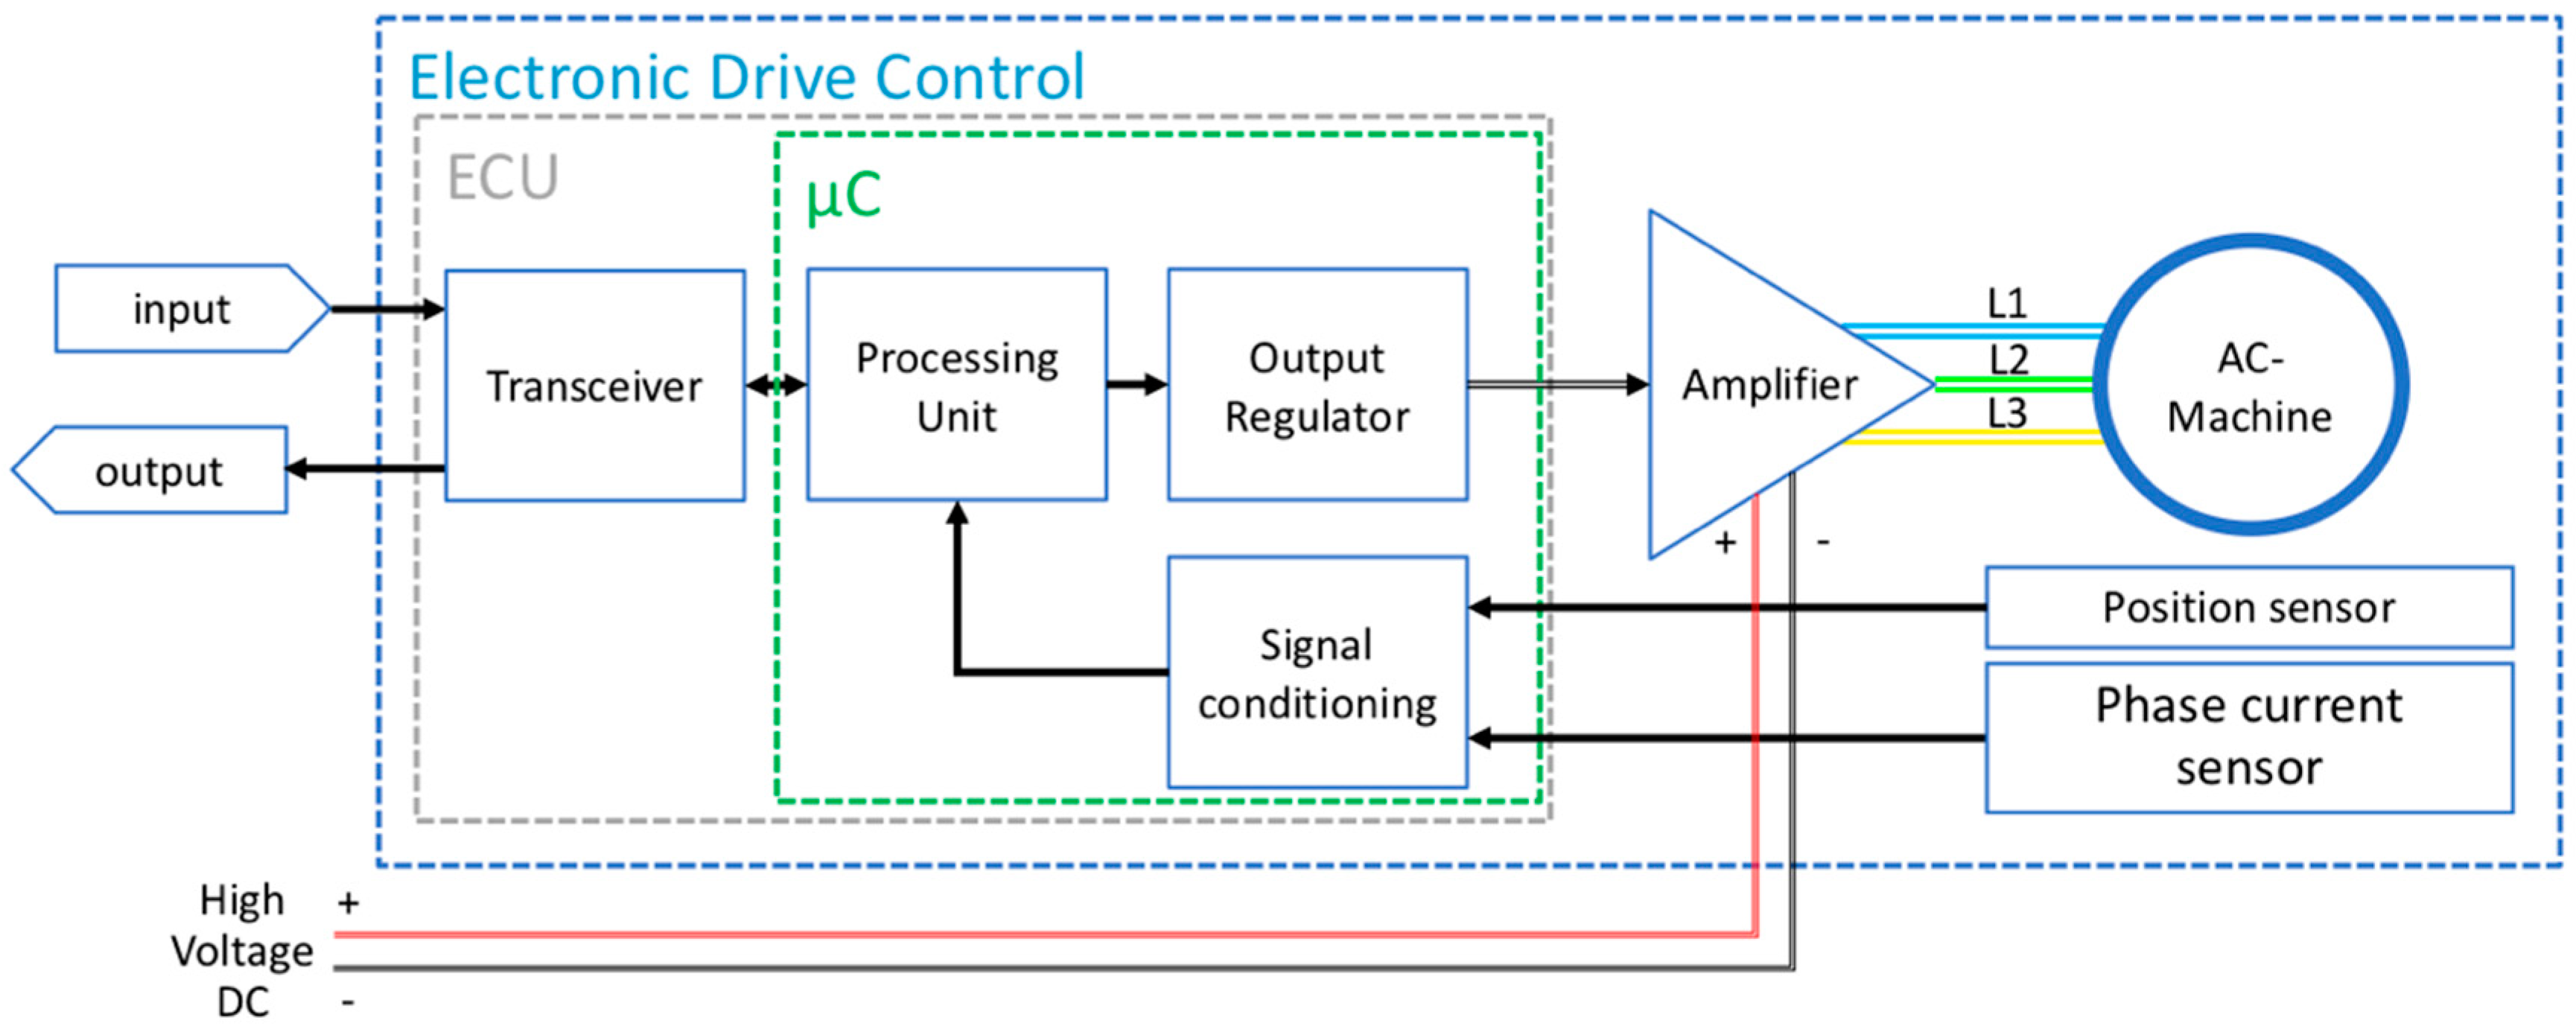
In this section, the functionalities of the ECU used for resolver signal processing are introduced. Figure 6 gives an overview of the electric drive control architecture using an induction motor (AC-machine) as an example. The integrated microcontroller (µC) represents the heart of the ECU that manages different tasks, e.g., interpreting the driver input (torque request), monitoring of relevant parameters (e.g., temperature, phase current, speed and rotor shaft position) and controlling electric parameters to drive the motor. The processing unit contains the motor control algorithm. The output signals, usually low-voltage pulse-width modulation (PWM) electrical signals, are sent through an output regulator to a separate driver stage (amplifier) comprising the gate drivers (e.g., bi-polar transistors), which actually supplies the three phases of the electric machine. The focus of this work in terms of the ECU focusses on the rotor shaft position sensor feedback signal conditioning and processing procedure within the µC. These procedures represent components of the control algorithm as well as the readout sequences of the internal sensor signals for angle error evaluation. Detailed investigations of the resolver-to-digital conversion (R2D, RDC) and conditioning have been carried out in previous research [3].
The specific ECU applied in the present work includes a µC as well as signal conditioning circuits. Because there was no need to operate the electric machine from the ECU for the present investigations, the driver stage of the controller was removed during the measurement series on test bench. Under these laboratory conditions, the electric machine of the test bench provided the desired mechanical rotation of the rotor shaft independently from the investigated sensor system related controller.
The investigated µC represents a standard automotive device supplied by Infineon [20]. The so-called AURIX µC is a powerful 32-bit microcontroller that provides a high level of functional safety features and at the same time high performance capabilities [10]. AURIX stands for AUtomotive Real-time Integrated neXt generation architecture and has a multicore architecture [20] based on up to three independent Central Processing Units (CPUs).
AURIX is available in several configurations where it comes with different memory sizes as well as a different number of cores. For investigating the rotor angle position, only one core is utilized executing the main operating system (OS) and performing the data acquisition. Since state-of-the-art algorithms for R2D are applied, the data conversion between ECU and test bench environment represents the focus of the present work.
One characteristic of the AURIX µC is the asynchronous sampling of the resolver data, which is schematically shown in Figure 7. This has to be considered when it comes to reading out the sensor’s sampled raw values and performing further evaluation, e.g., angle calculation and angle error analysis. The sampling of the resolver feedback signals is done by a delta-sigma-analog-to-digital-converter (∆Σ-ADC) [17] under a constant, invariable frequency (a so-called DSADC Event). In this work, the applied controller has a frequency set to fDSADC Event = 9.765 kHz. This means, every tDSADC Event = 102.4 µs one amplitude value of the resolver feedback signals per channel (two in sum: sine and cosine) is available for the angle calculation algorithm on the ECU. Also, the carrier generator works within the same event due to carrier cancelation reasons. This strategy was investigated in previous work [3]. The second stage in the µC is the so-called App Event. This event has a configurable frequency, which is set to fApp Event = 9 kHz for the present investigations based on the requirements of the actual motor control algorithm. In more detail, this pre-defined frequency is linked with the pulse-width modulation (PWM) base frequency of the gate drivers to control the electric machine. That means the whole software and hardware control is operating at a timestamp of tApp Event = 111 µs. In this way it can be stated that an inconstant task timing difference occurs between sampling and processing of the resolver signals, hence the sampled signals are available at every tDSADC Event = 102.4 µs, while the software only collects and processes the values every tApp Event = 111 µs.
This specific characteristic needs to be considered when further angle evaluation is performed, since the measured resolver signals, containing the information for angle computation, are not synchronous with the software-based angle determination. That means the angular information processed in software and used for the motor control is not the actual angle value. For that reason, an approach had to be developed within this work that enables the computation of the correct angle value at a constant rotational speed. This enables a more accurate angle error evaluation of the whole drive train system. The procedure is introduced in Section 2.4.

2.3. Measurement and Calibration Hardware

To acquire the raw rotor shaft position values (sine and cosine) as well as the estimated rotor position by the ECU for plausibility check, the parameters have to be determined in a way that avoids effects on the µC’s runtime and thus on the measurement process. Therefore, the considered approach is based on a direct polling of the acquired sensor data from the memory of the µC, in more detail the registers, to the test bench measurement equipment. The equipment used in the present work has been delivered by Vector [21]. The measurement chain is set up as a modular platform. The following components were used to realize the introduced method of characterization and benchmark automotive drive train sensor systems on the test bench. Starting with the head unit, the Vector VX1060 Serial Base Module contains a FPGA that allows communication with the desired ECU. The base module itself is connected with the test bench computer by a variable and interchangeable transport layer, named universal measurement and calibration protocol (XCP) over Ethernet (ETH) that enables real-time data transmission. A separate piece of software, CANape [21], manages the measurement procedures and also enables MATLAB™ [22] data export, which is essential for evaluation of the system-under-test. Furthermore, the base module needs to be connected with the ECU itself to poll the data. To enable a flexible measurement on different µCs, an additional FPGA is necessary to convert the µC’s data to a bitstream that is readable for the base module. This essential additional FPGA is represented by a so-called serial POD (Plug-On-Device) that is located between the base module and the specific ECU to be investigated. Using a standardized high-speed serial interface called Debug Access Port (DAP) from joint test action group (JTAG) [23], between the µC and the POD [21,24], the µC’s register can be read. Figure 8 shows a scheme of the entire chain between the VX1060 and the AURIX µC (target ECU). Depending on the ECU that is being investigated, the configuration between the target ECU and the base module changes (see Figure 8: “Components per ECU”). Depending on the sort of measurement, the base module changes (see Figure 8: “Components per measurement site”).
For reading data out of the registers and gathering the sensor information, two parts are essential. Firstly, the operating software on the µC has to provide programmed interrupts that rise every time a new sensor feedback value is read into the registers. Secondly, the base module (FPGA) needs to operate at the same clock frequency as the µC does (here: fApp Event = 9 kHz) to read in the data synchronously. When both systems have the same clock frequency, the base module can “listen” on the registers and wait for a memory interrupt to be raised. In such an event, the actual value is captured and sent (including the original µC timestamp) to the XCP over ETH connection to the PC. This enables a real time data acquisition of the µC’s memory. The separate software CANape is used to perform plots and further operations (e.g., calculations, manipulations) as well as to export the data sets to other file formats for further investigations.
After describing the hardware and software environment applied in this research work, the synchronization methodology of the new approach will be introduced in the following section. This approach enables a comparison of two independent measurement systems, namely the reference data acquisition [25], and the ECU-based measurement system.

2.4. Synchronization Approach

The introduced method enables a comparison of not only the DUT itself with a more accurate reference sensor, but also the consideration of the whole sensor system (ECU+DUT). This task challenges the applied data processing strategy because both systems work independently with a different, fixed sampling rate asynchronously. That is why the more flexible system, here the universal reference acquisition card, needs to be adapted in both ways regarding sampling frequency and capturing the actual sensor position data synchronously. To realize this concept, an electrical synchronization signal that acts as a trigger was introduced.
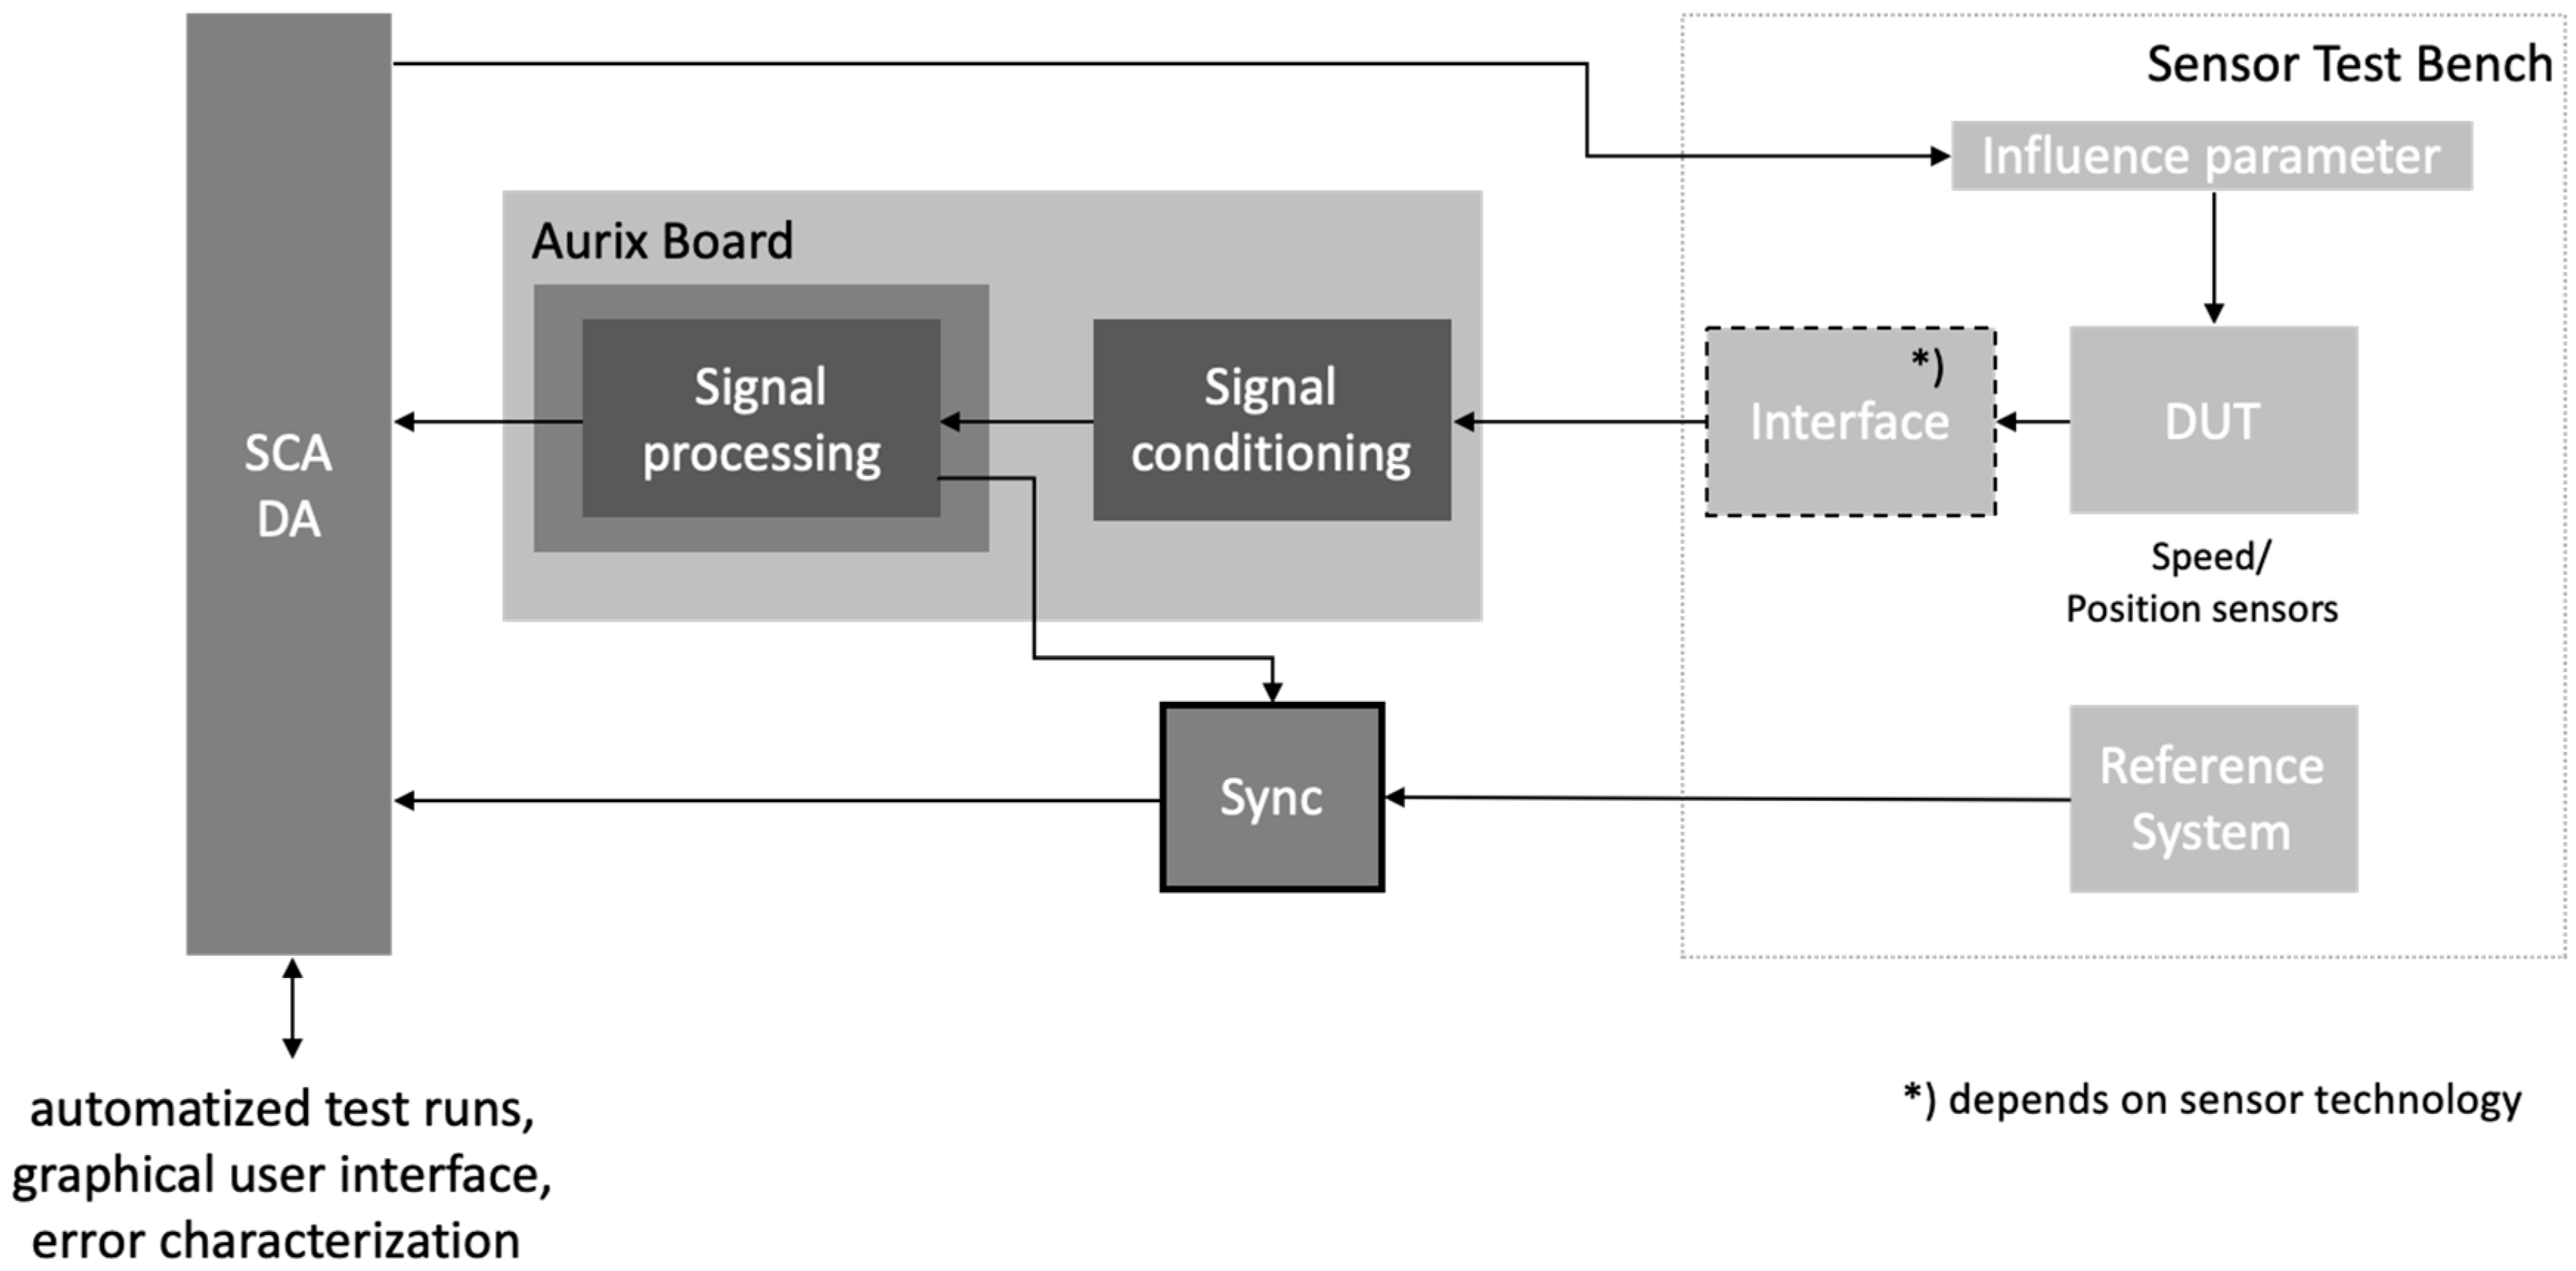
Figure 9 visualizes the synchronization approach at a glance: two sensors, here the resolver as DUT and the reference encoder, are measuring independently the same rotor shaft position on the sensor test bench under certain influence parameter variations. A discussion of the effects of these parameter variations on the investigated sensor systems is not a focus of this work but can be found in [6]. The performed tests are run automatically by a sensor control algorithm (SCA) and are validated and characterized by a data acquisition (DA) unit on the test bench computer. The provided reference position is transferred directly to the DA, while the position of the DUT needs to be passed through a sensor interface to an input of the ECU, here an AURIX [19] µC (AURIX Board). Within the AURIX Board, the signal is conditioned and processed before the angular information is read out. The Sync block in Figure 9 represents the reference configuration as well as the mentioned electrical trigger signal, generated by the ECU, that releases the capturing of the reference position in the reference data acquisition unit.
When measuring the DUT by the ECU (AURIX µC), a software-based configured interrupt is raised every time a new value is captured. In case of the AURIX µC, this procedure has a frequency of f = 9 kHz, which corresponds to a time step of t = 111 µs due to the already explained software task timing issue, introduced in Section 2.2.2. The interrupt inside the µC triggers both the Vector base module for capturing the DUT values and an output stage providing a TTL level. This electrical signal level is triggering the reference acquisition card using a digital input. However, the sampling of the DUT by the ∆Σ-ADC happens at every t = 102.4 µs (f = 9.763 kHz), according to Section 2.2.2 (Figure 7). This means the DUT signals and DUT angle, provided by the software, are not up-to-date. For that reason, the ECU software needs to be adapted by introducing two internal counter variables (“PosTimestampDSADC” and “PosTimestampPWM”). Each of these variables is related to one event, either DSADC Event or App Event and contains the actual counter value in 10-ns ticks. By calculating the difference between those two values, the actual time stamp difference (see Figure 7) can be investigated. Based on this difference, the actual, correct DUT angle can be found under consideration of the current, constant angle velocity, measured by the reference system.
Recapping, with this approach, the sensor system to be investigated (in more detail the µC) triggers the more flexible reference system so that the reference read out is done synchronously to the read out of the DUT angle. This enables a merge of two independent measurement systems providing two angular positions from two sensors at one timestamp t = n.
In addition, both systems must perform the data acquisition at the same time stamp in respect to a defined starting time t = 0 s. Therefore, both measurement system recordings start quasi-simultaneously controlled by each system’s software application program interface (API) within the test bench automatization. For first approximation, the starting time t = 0 s of each system is considered ideal (one starting time for both systems), although time jitter can occur when calling software commands in the test bench automatization.
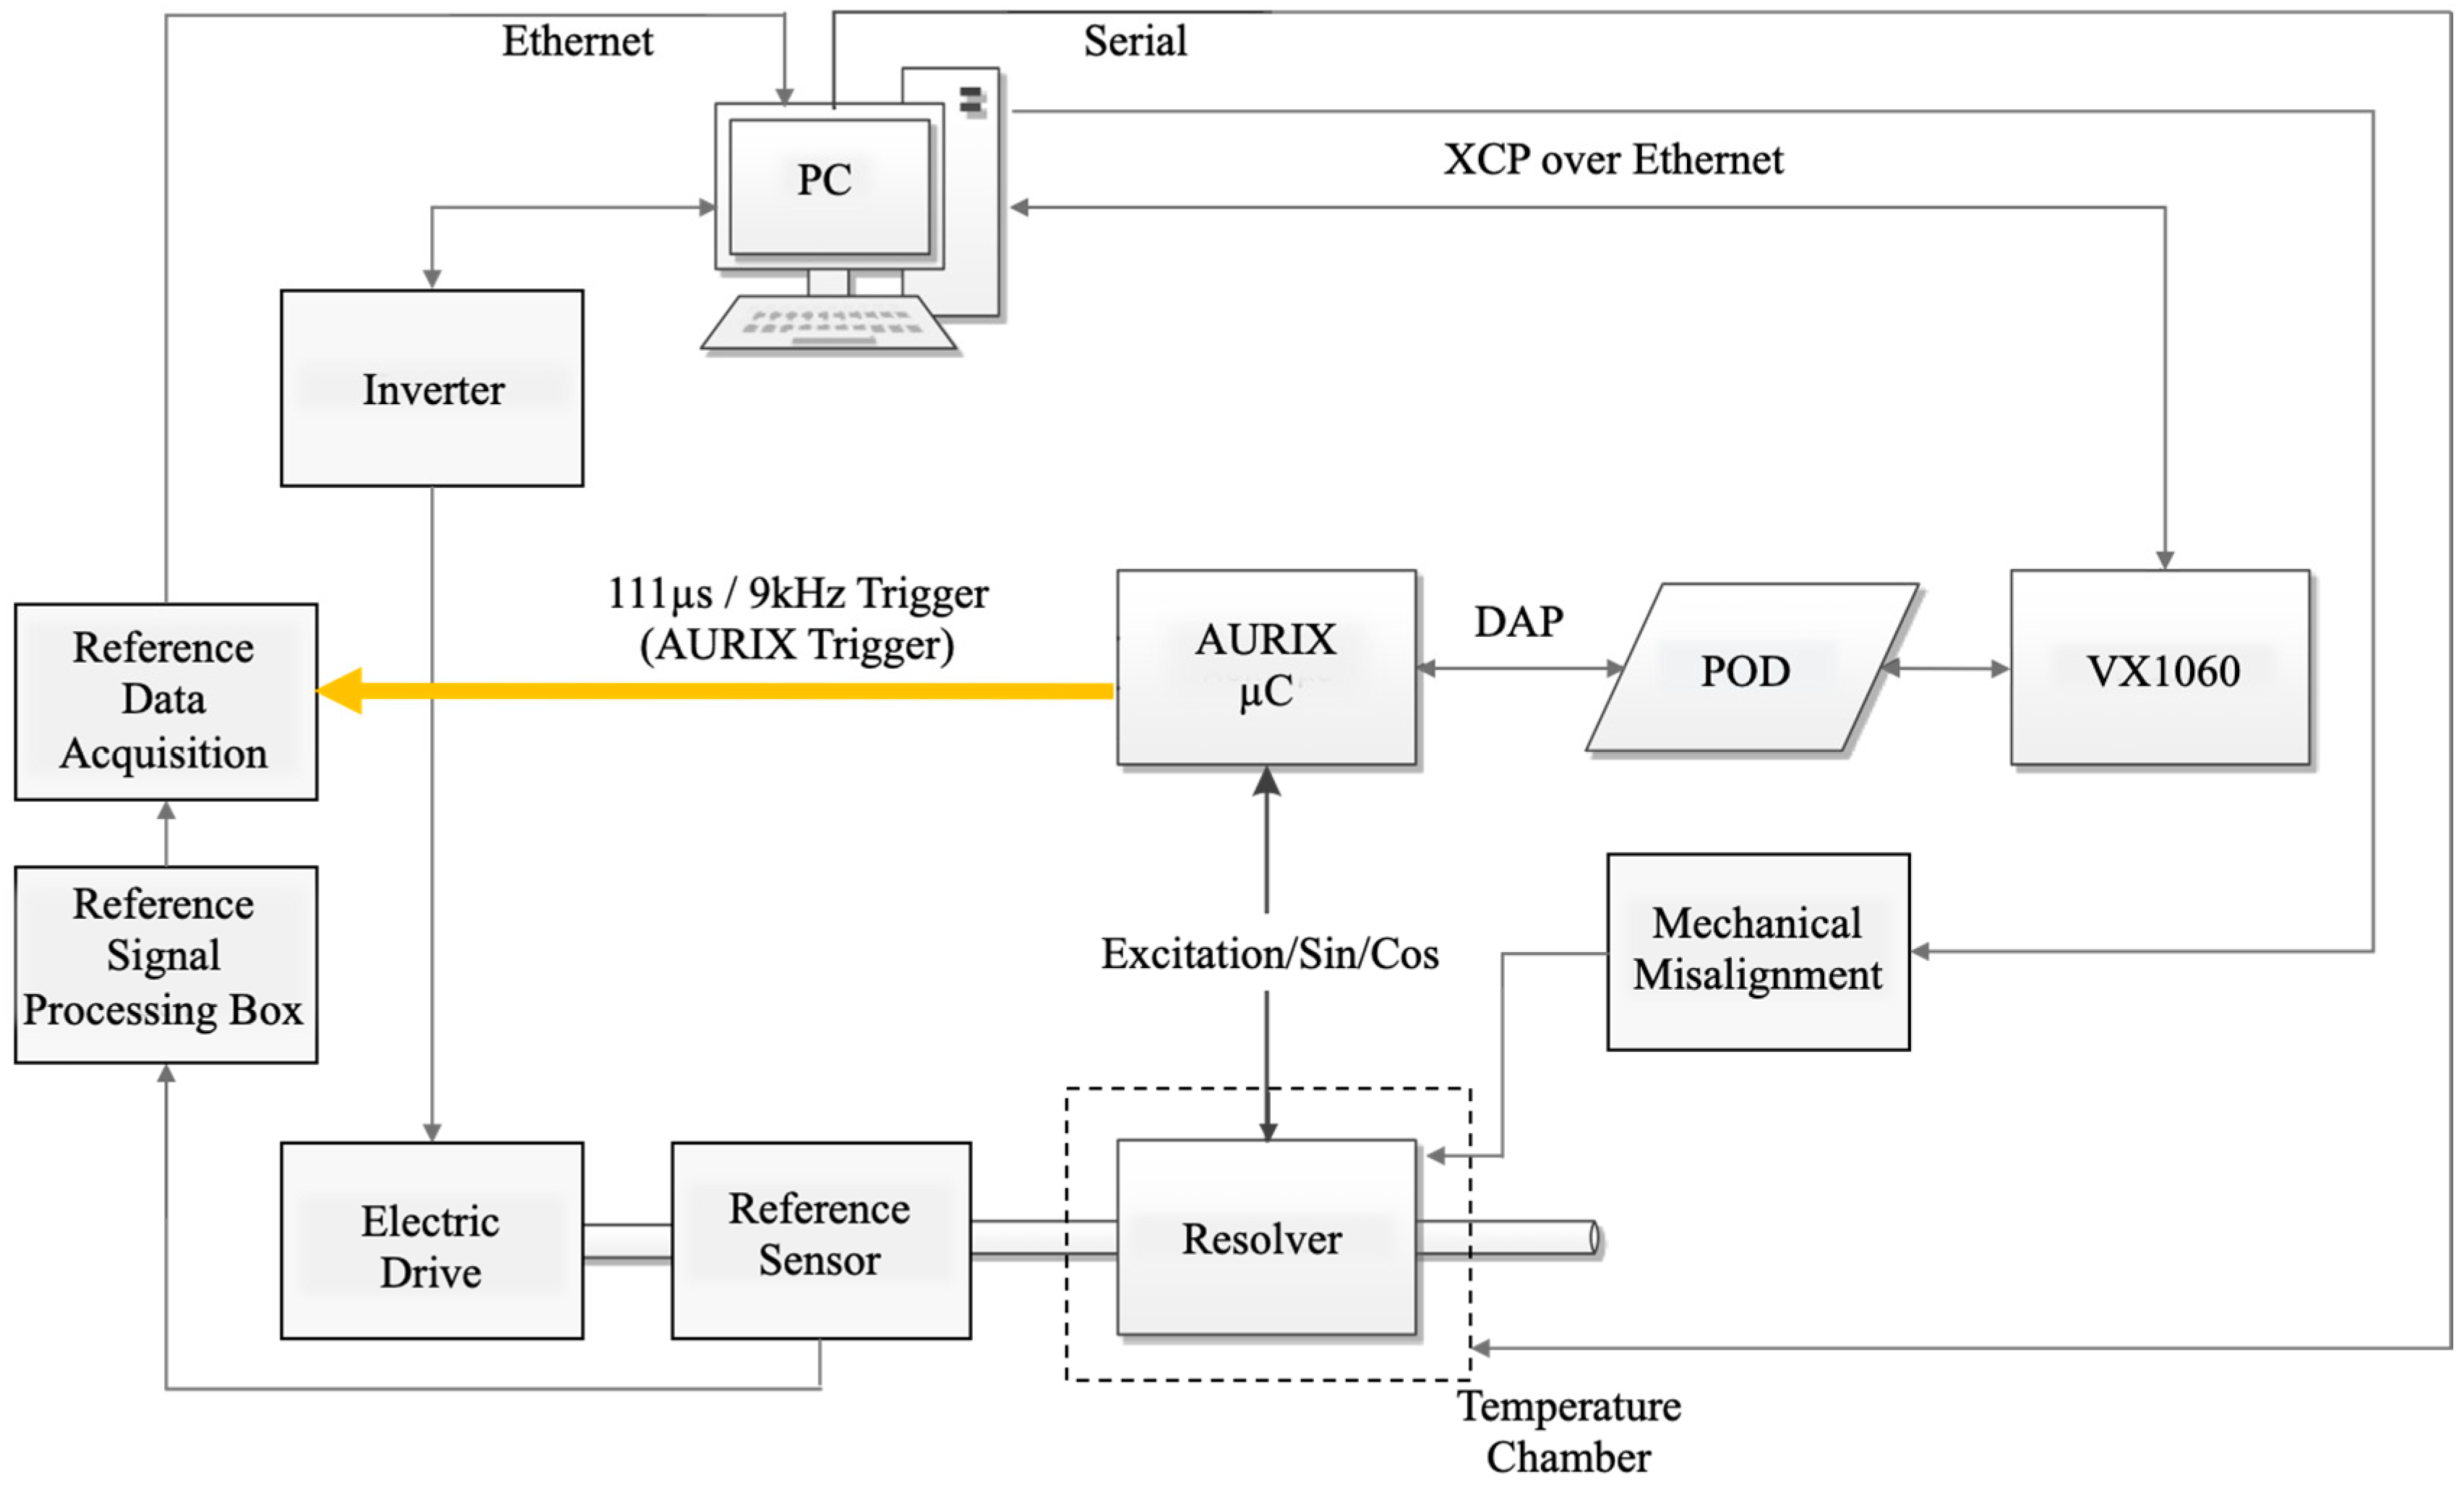
Considering those two essential parts for a proper synchronization, Figure 10 gives an overview of the entire setup as well as the electrical synchronization trigger signal coherent with the sampling of the resolver’s raw sine and cosine signals.
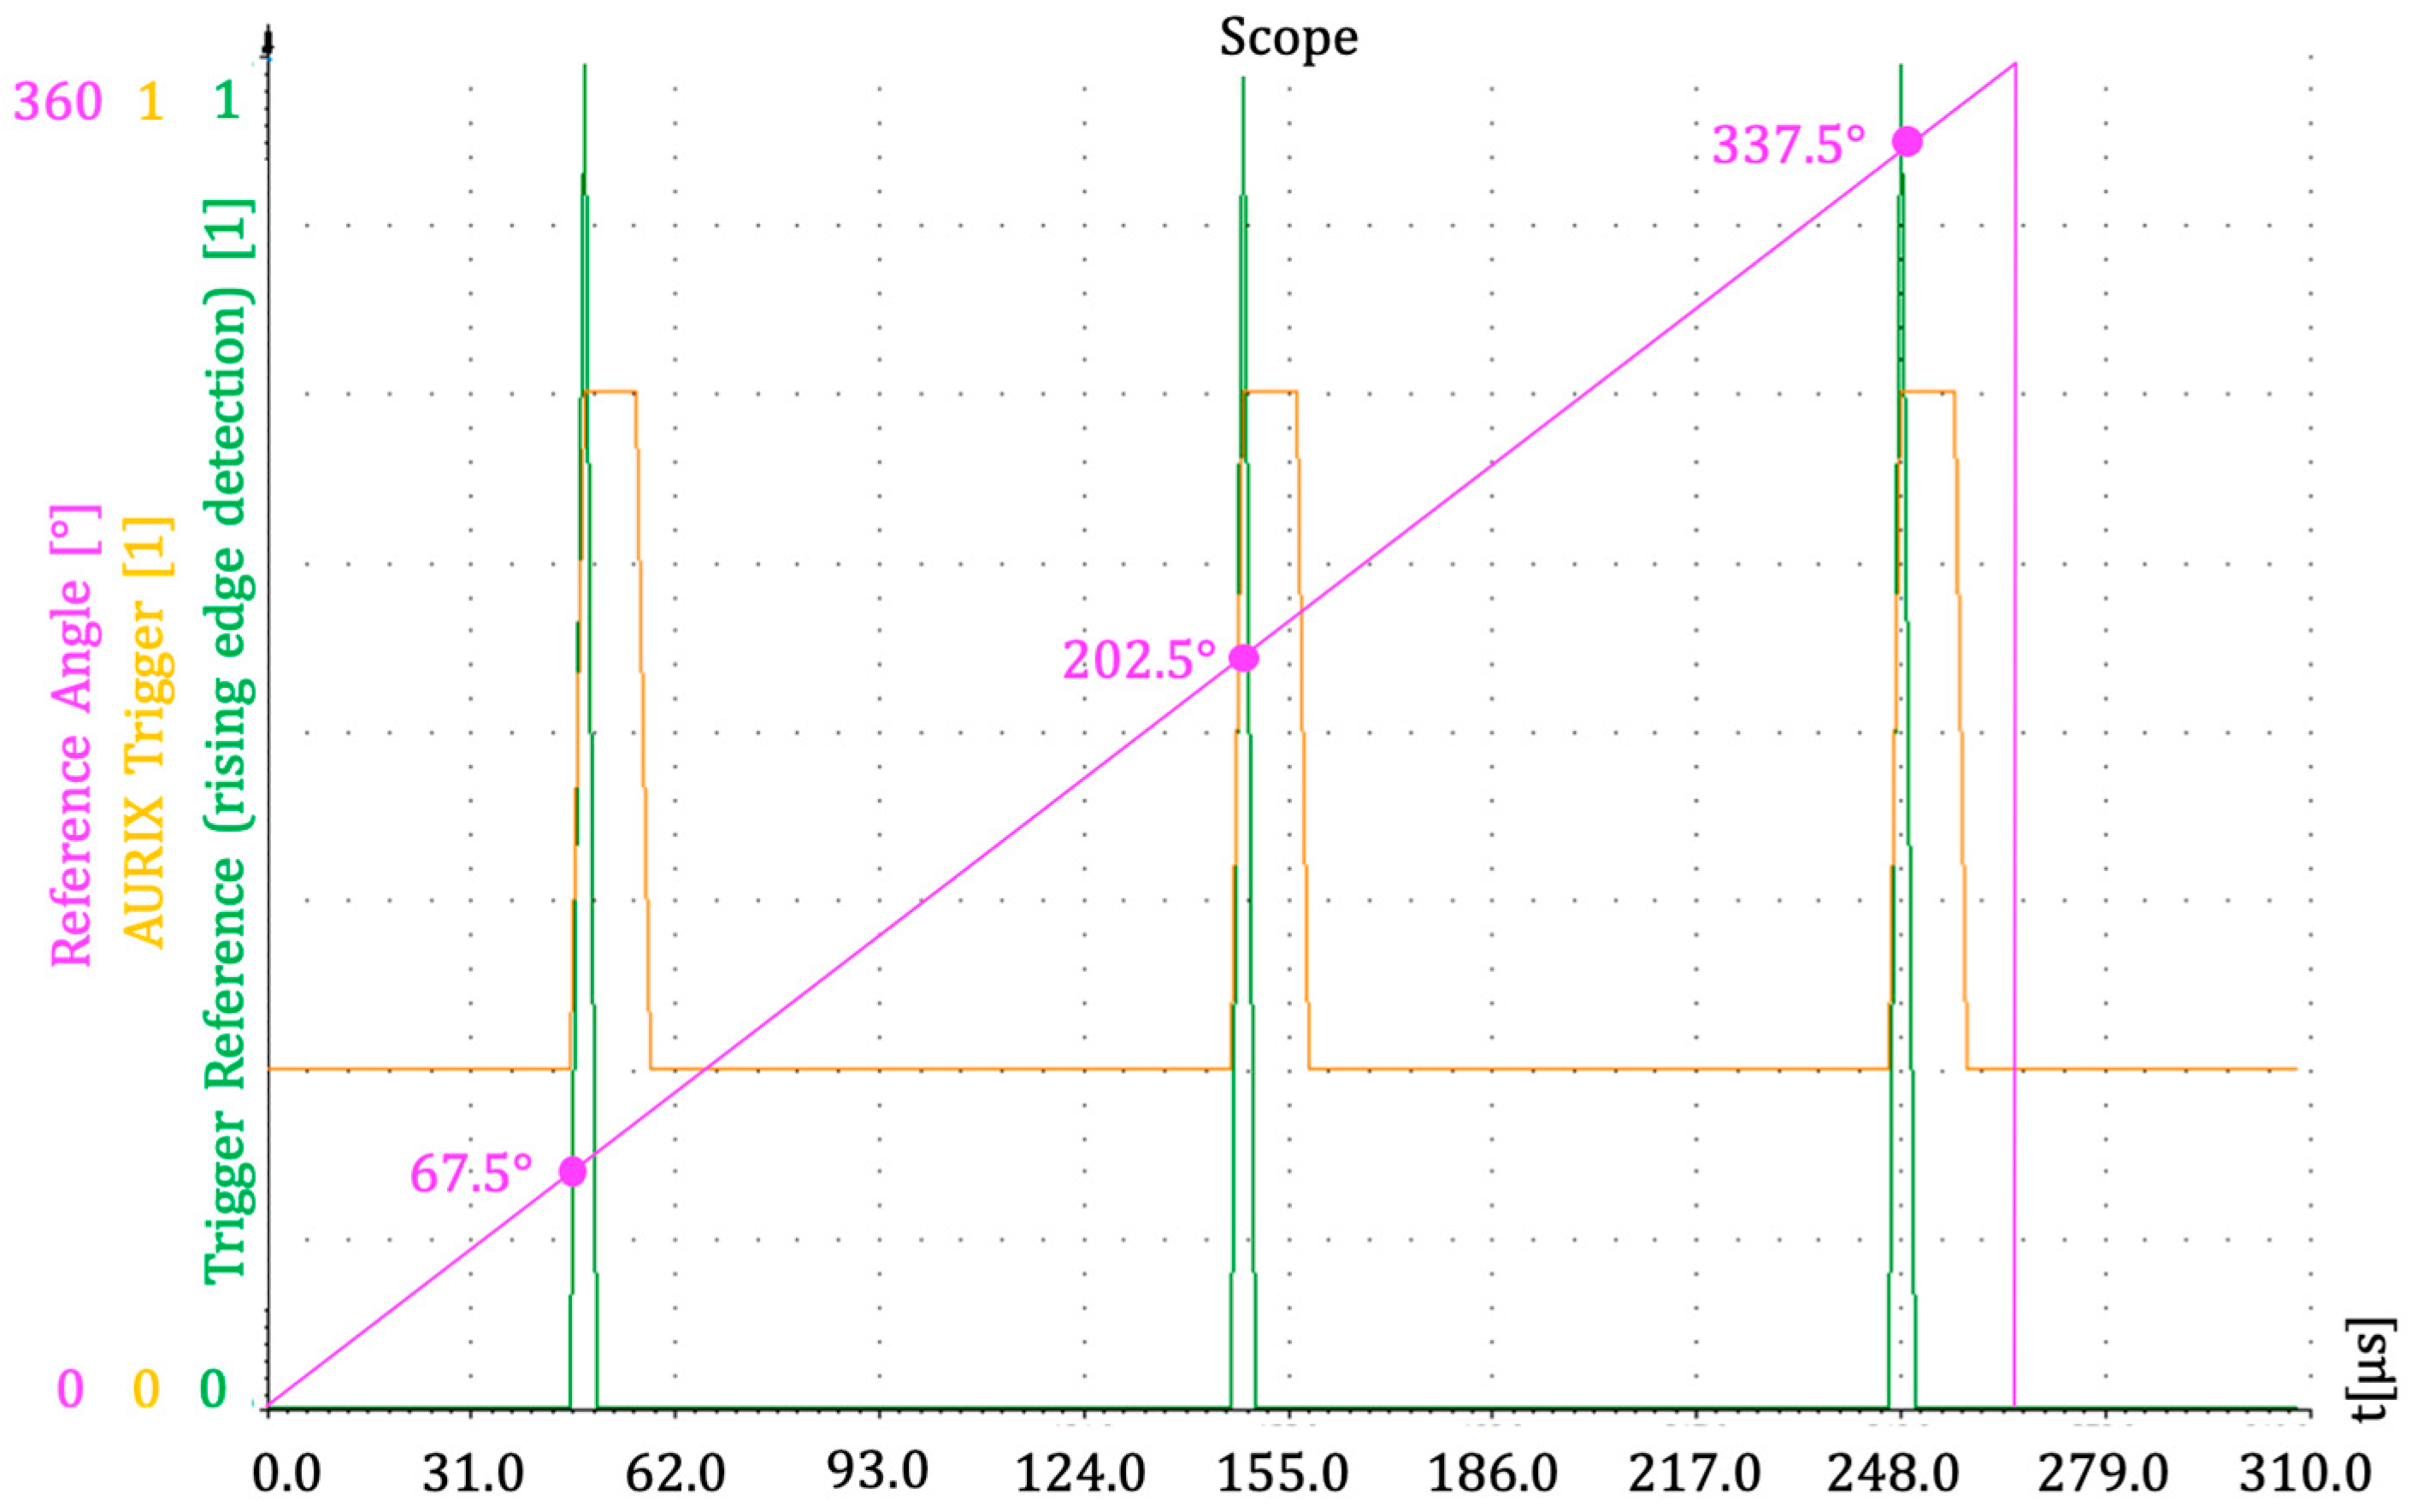
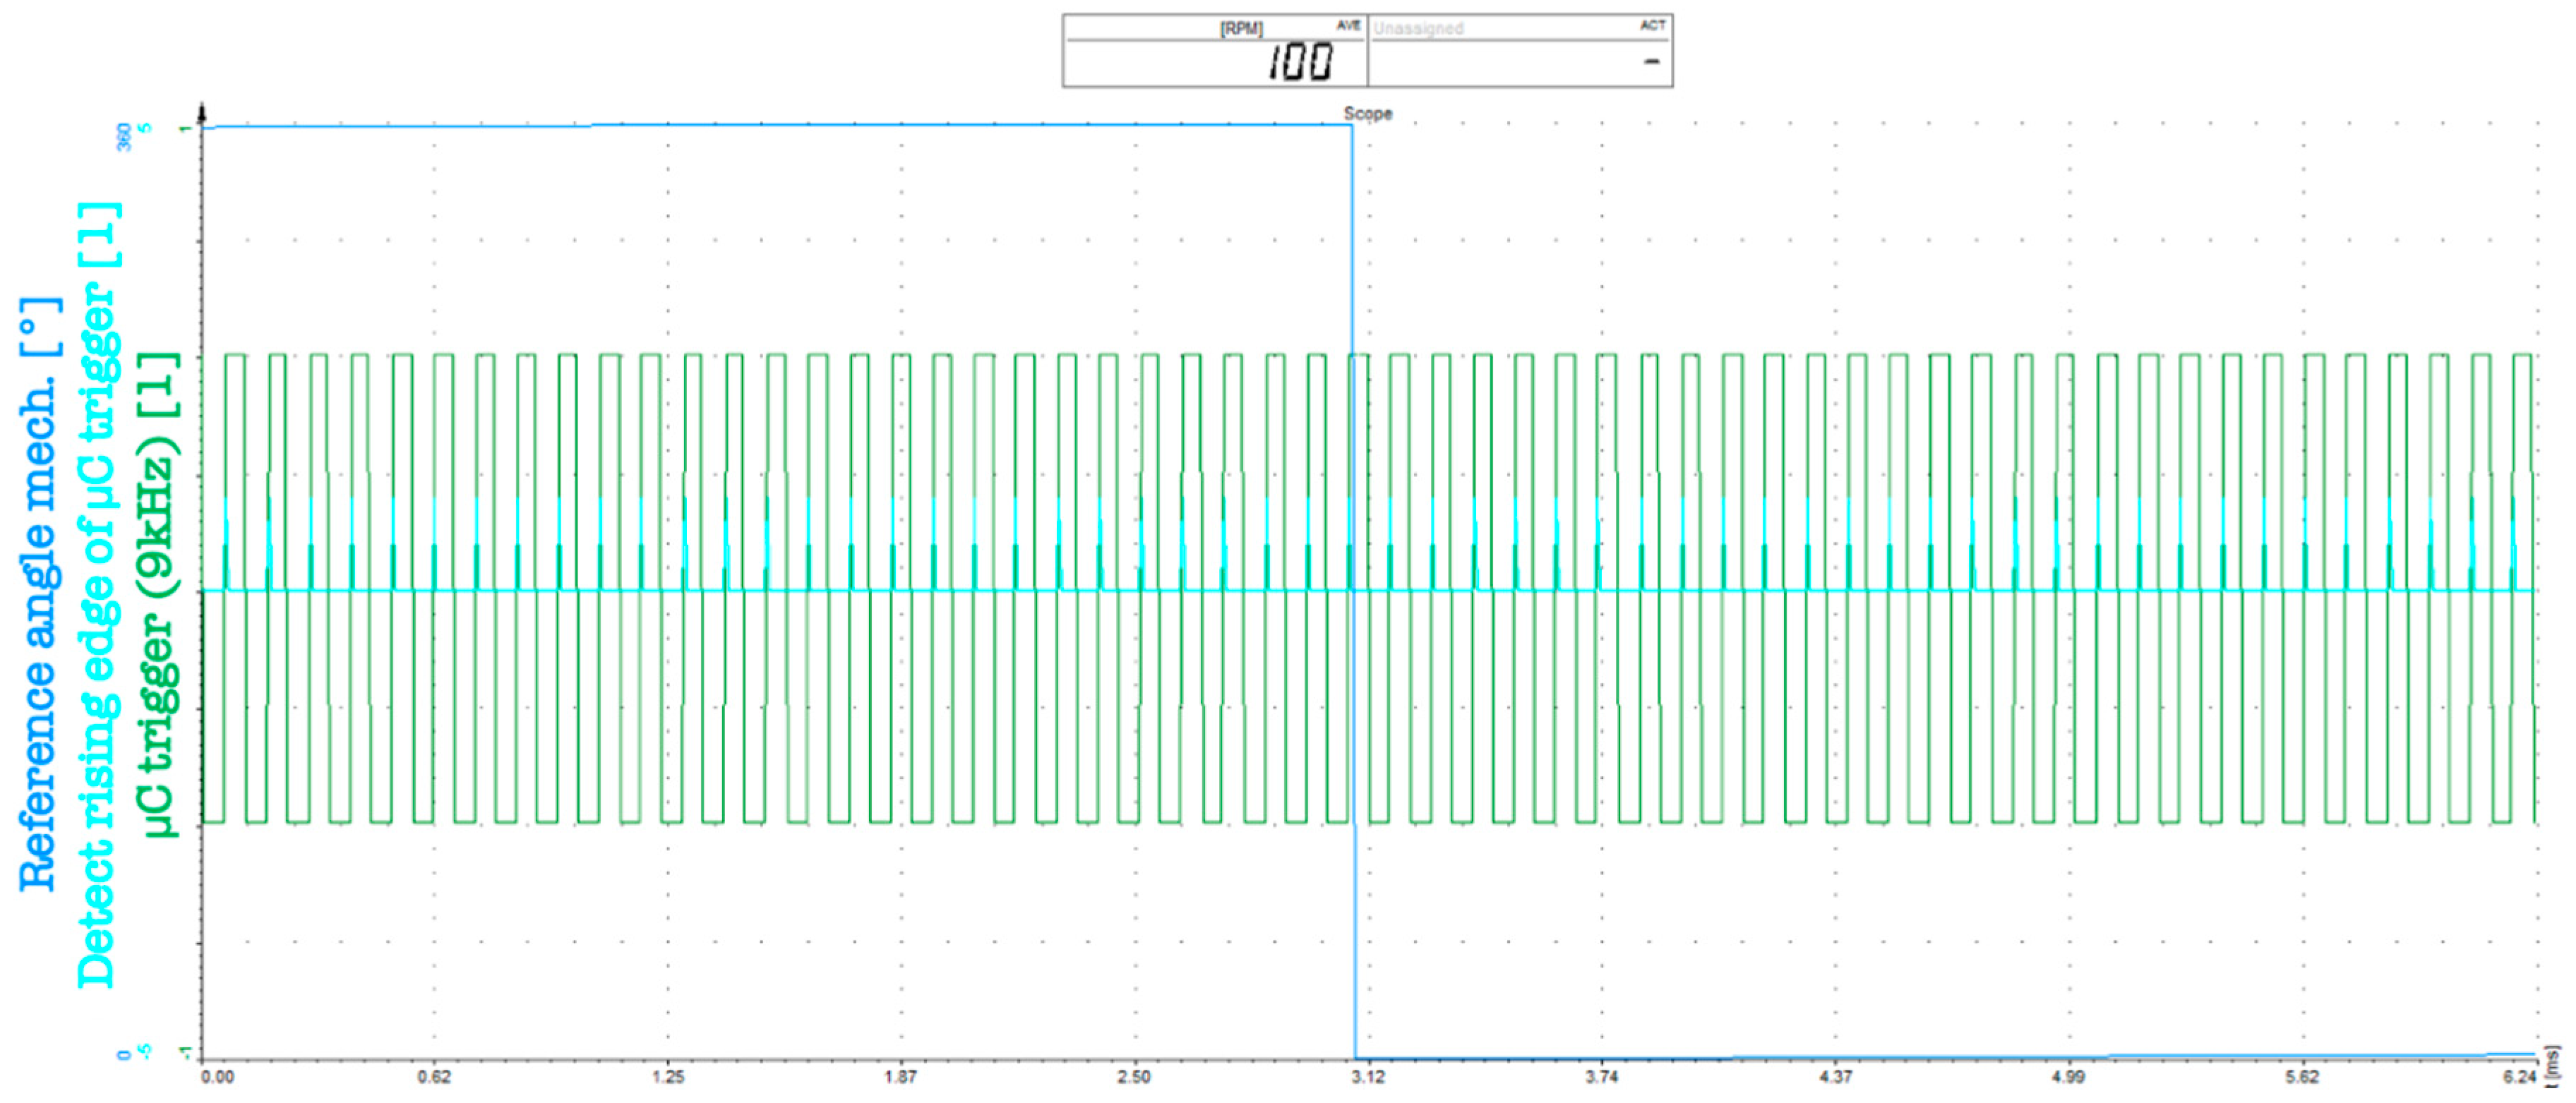
Regarding the reference system’s f = 9 kHz trigger synchronization, Figure 11 demonstrates an exemplary display pattern, determining the synchronous position in the reference data acquisition software environment based on the method explained earlier. Obviously, the reference sensor delivers a higher resolution to enable a sufficient accurate comparison process between the reference sensor and the system-under-test. The reference data acquisition that is activated by the captured µC trigger needs to be configured properly, so that the reference sensor value can be read out when the rising edge of the trigger signal appears (see signal Trigger Reference, Figure 11). This can be done directly in online processing using dedicated software [26] suitable for the reference data acquisition unit. The FPGA of this acquisition card is configured to detect the rising edge of the digital input trigger signal, delivered by the µC and as a result of the actual position capturing of the test bench reference sensor.

2.5. Implementation

2.5.1. Test Setup and Evaluation Process

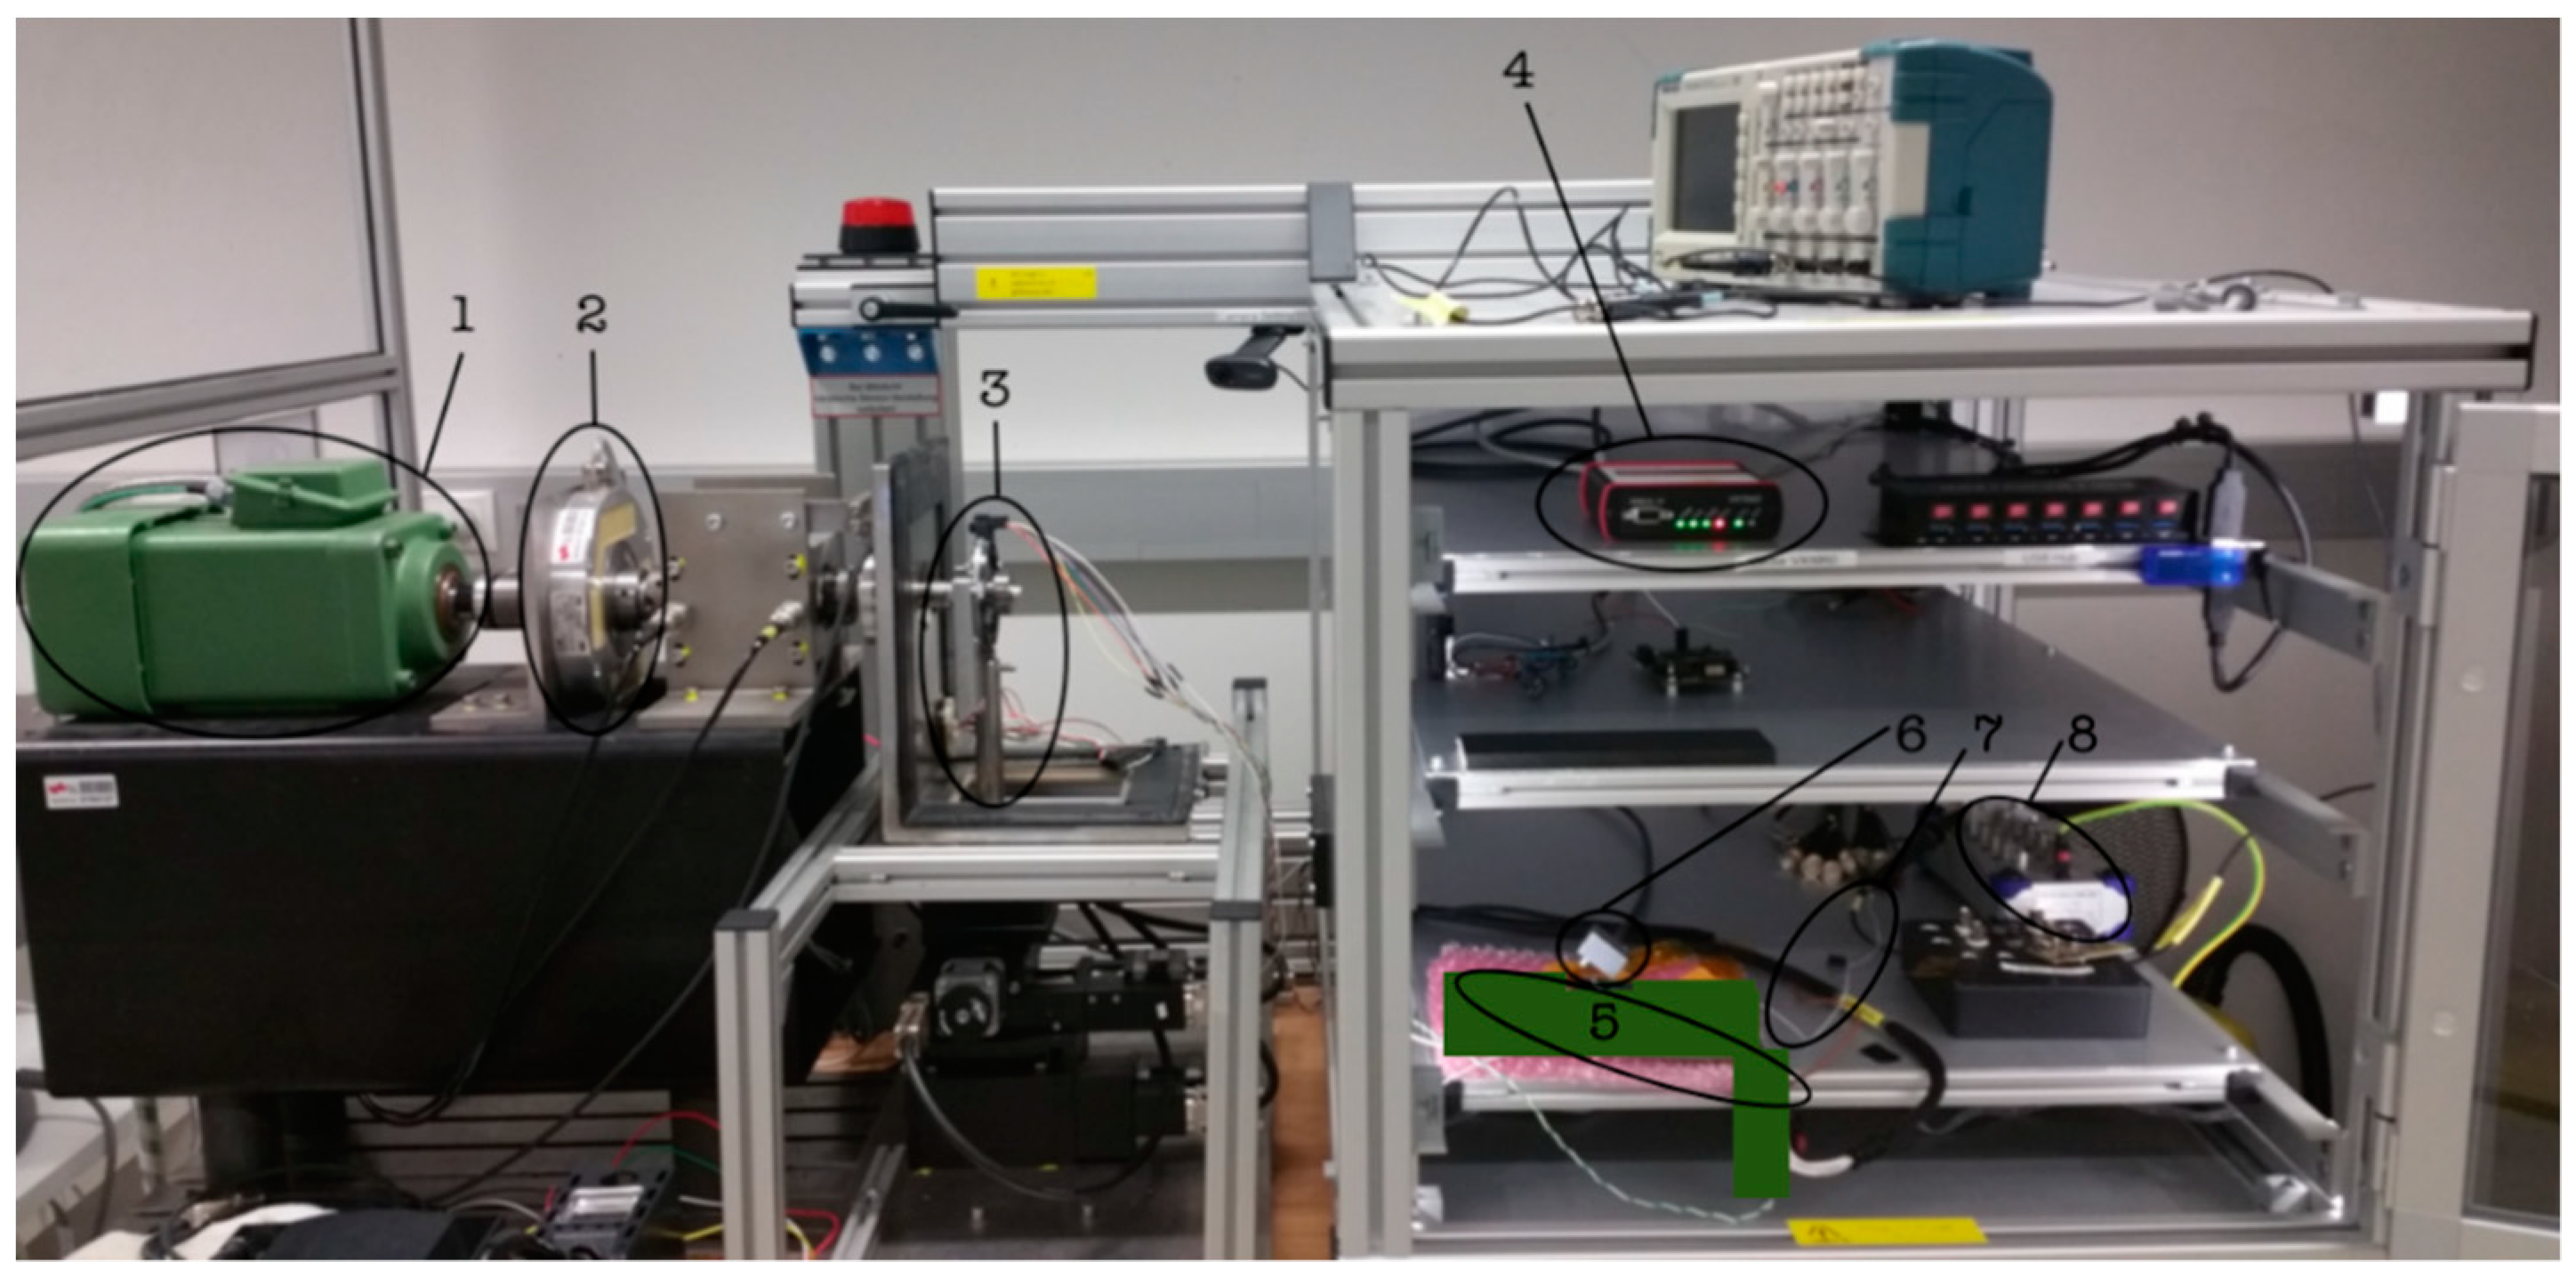
In advance of the angle error determination procedure, the corresponding components of the exemplary sensor system are set up on the test bench and a general signal validation is performed. In this way, an arbitrary 3-pole resolver was mounted on the test bench, connected with a specified vehicle ECU. Figure 12 shows the general test setup with all essential components.
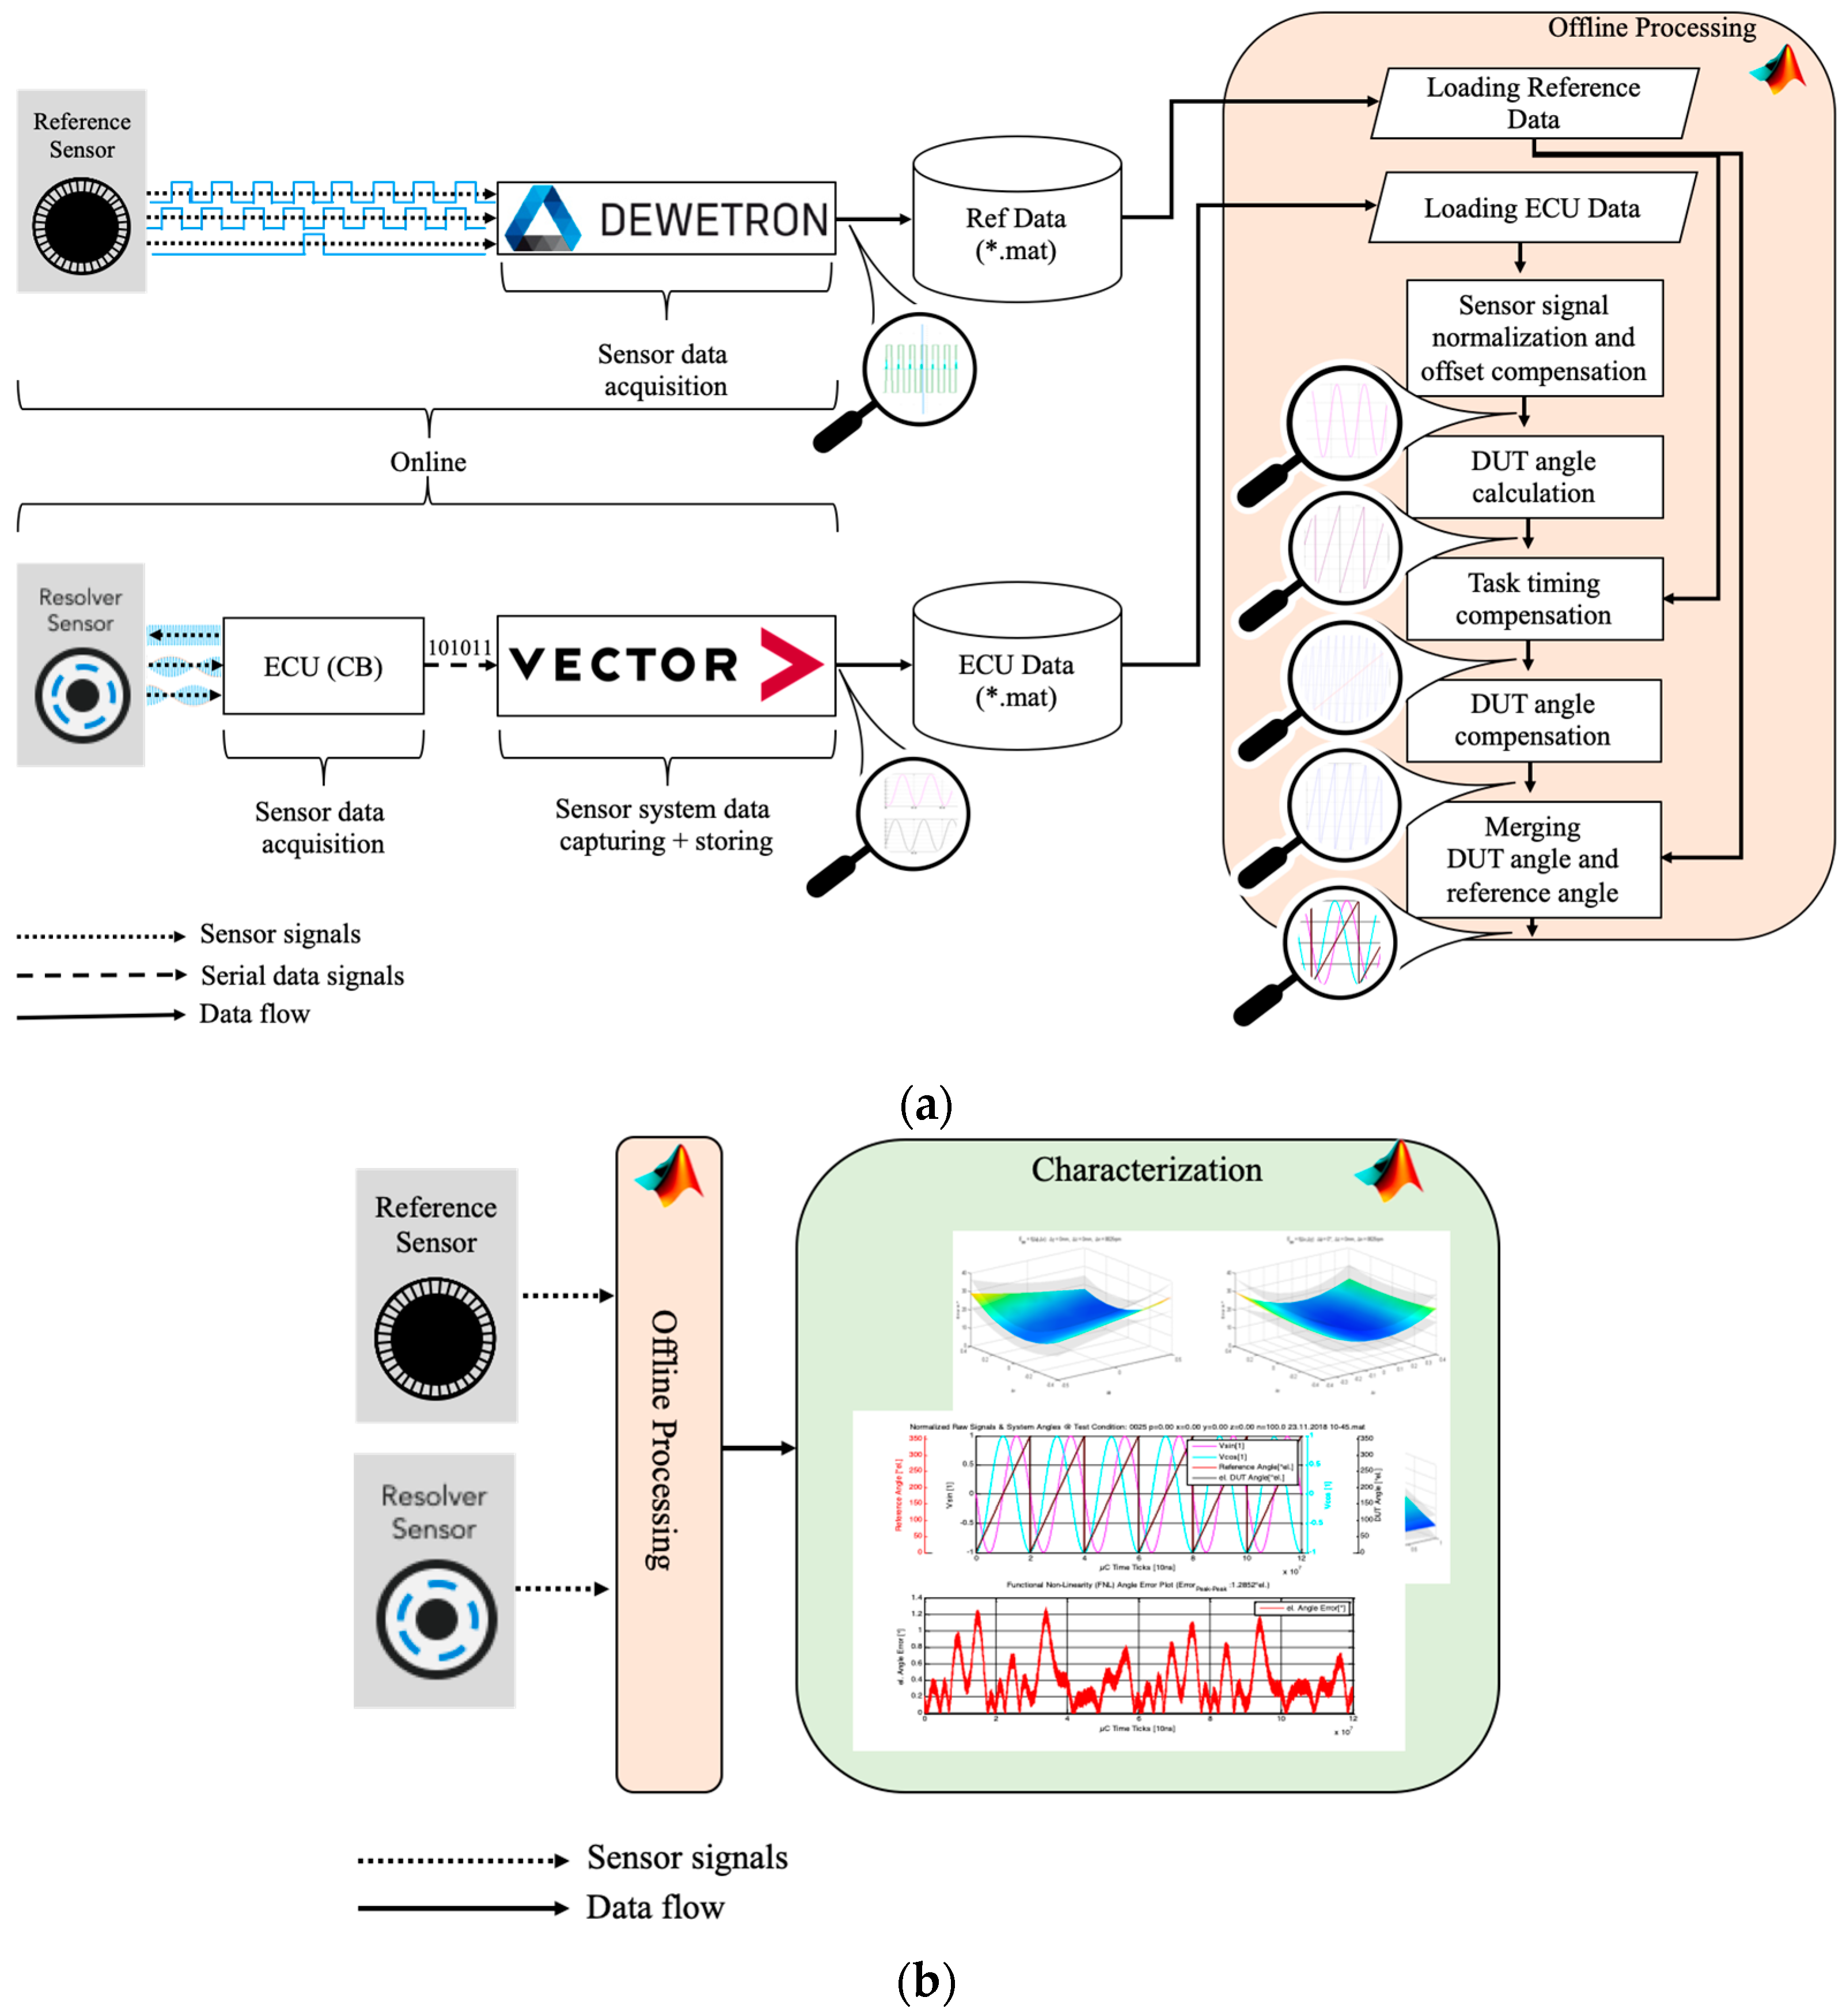
Besides the measurements performed on the test bench, further compensation regarding the synchronization is done in post processing, which is schematically represented in Figure 13. The data of each sensor is captured independently using both introduced measurement systems in respect to the applied synchronization. Both evaluation software platforms provide each sensor data in a MATLAB™ file format for further processing containing a timestamp and the angle, as well as the angle velocity (in case of the reference sensor) plus the raw signals and other measured variables PosTimestampDSADC and PosTimestampPWM (in case of the DUT). The data is read in via an offline MATLAB™ post processing script. As a first step, the DUT raw, demodulated sensor signals are normalized and offset-compensated for further DUT angle determination. The normalized and offset-compensated DUT raw signals are calculated by a habitual ATAN2-function to determine the DUT position converted from radians to degrees in the range of 0° to 360°, enabling a later comparison with the reference angle. Because the raw DUT signals and the DUT angle information are based on the DSADC timestamp, a time correction is necessary to ensure the equal timestamp (App Event, tPWM) of the triggered reference angular position. In this way, this task timing compensation uses the introduced measured time ticks of both DSADC Event and App Event, calculates the timestamp difference and corrects the DUT angular position (DUT angle compensation, Figure 13) under consideration of the current angular velocity, captured by the reference sensor, whether the DSADC Event is before or after the App Event. In a final step of the offline processing, the corrected DUT angle is merged with the scaled reference angle. A scaling is done in case of a multispeed resolver; as stated in Section 2.2.1, the number of electrical revolutions is higher than those of the mechanical revolutions of the reference. For that reason, the reference angle is manipulated by a Euclidean division operation times the number of poles regarding the DUT. The merging process enables further potential characterization, e.g., electrical angle error determination, error tolerance examination, and DoE evaluation.

2.5.2. Task Timing and DUT Angle Compensation

Because the task timing and DUT angle compensation represents the essential part of the synchronization approach introduced in this work, the following section focusses on this processing more than on the other basic methods introduced in Figure 13.
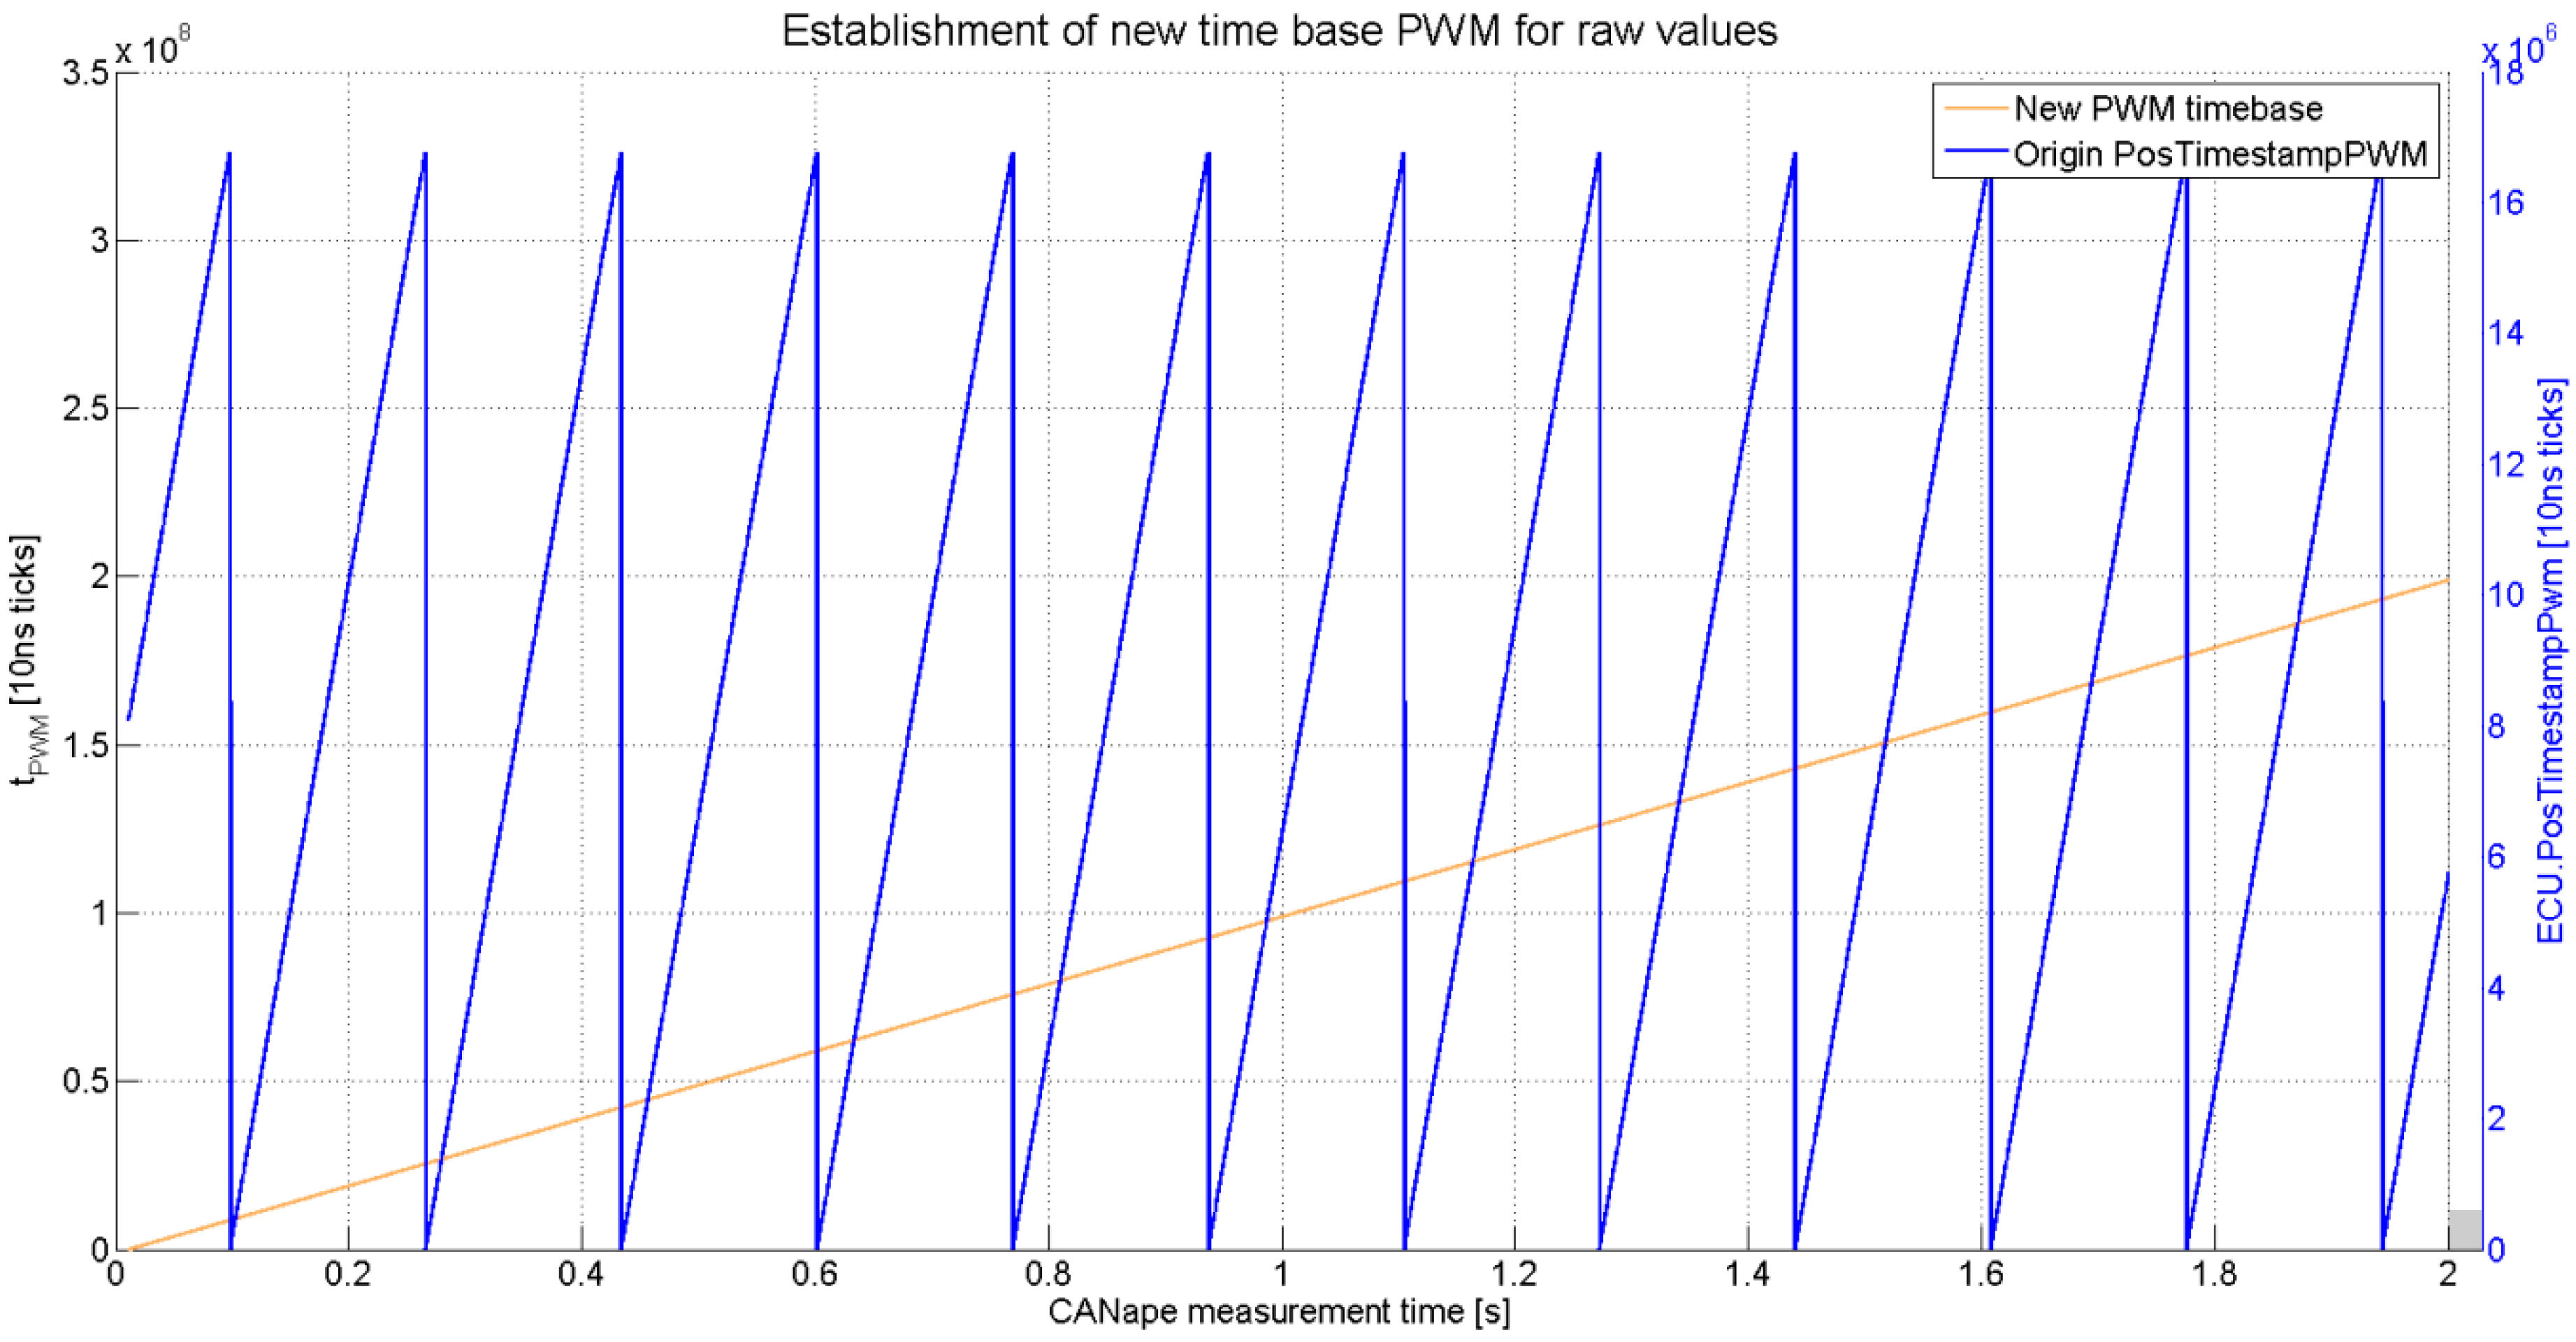
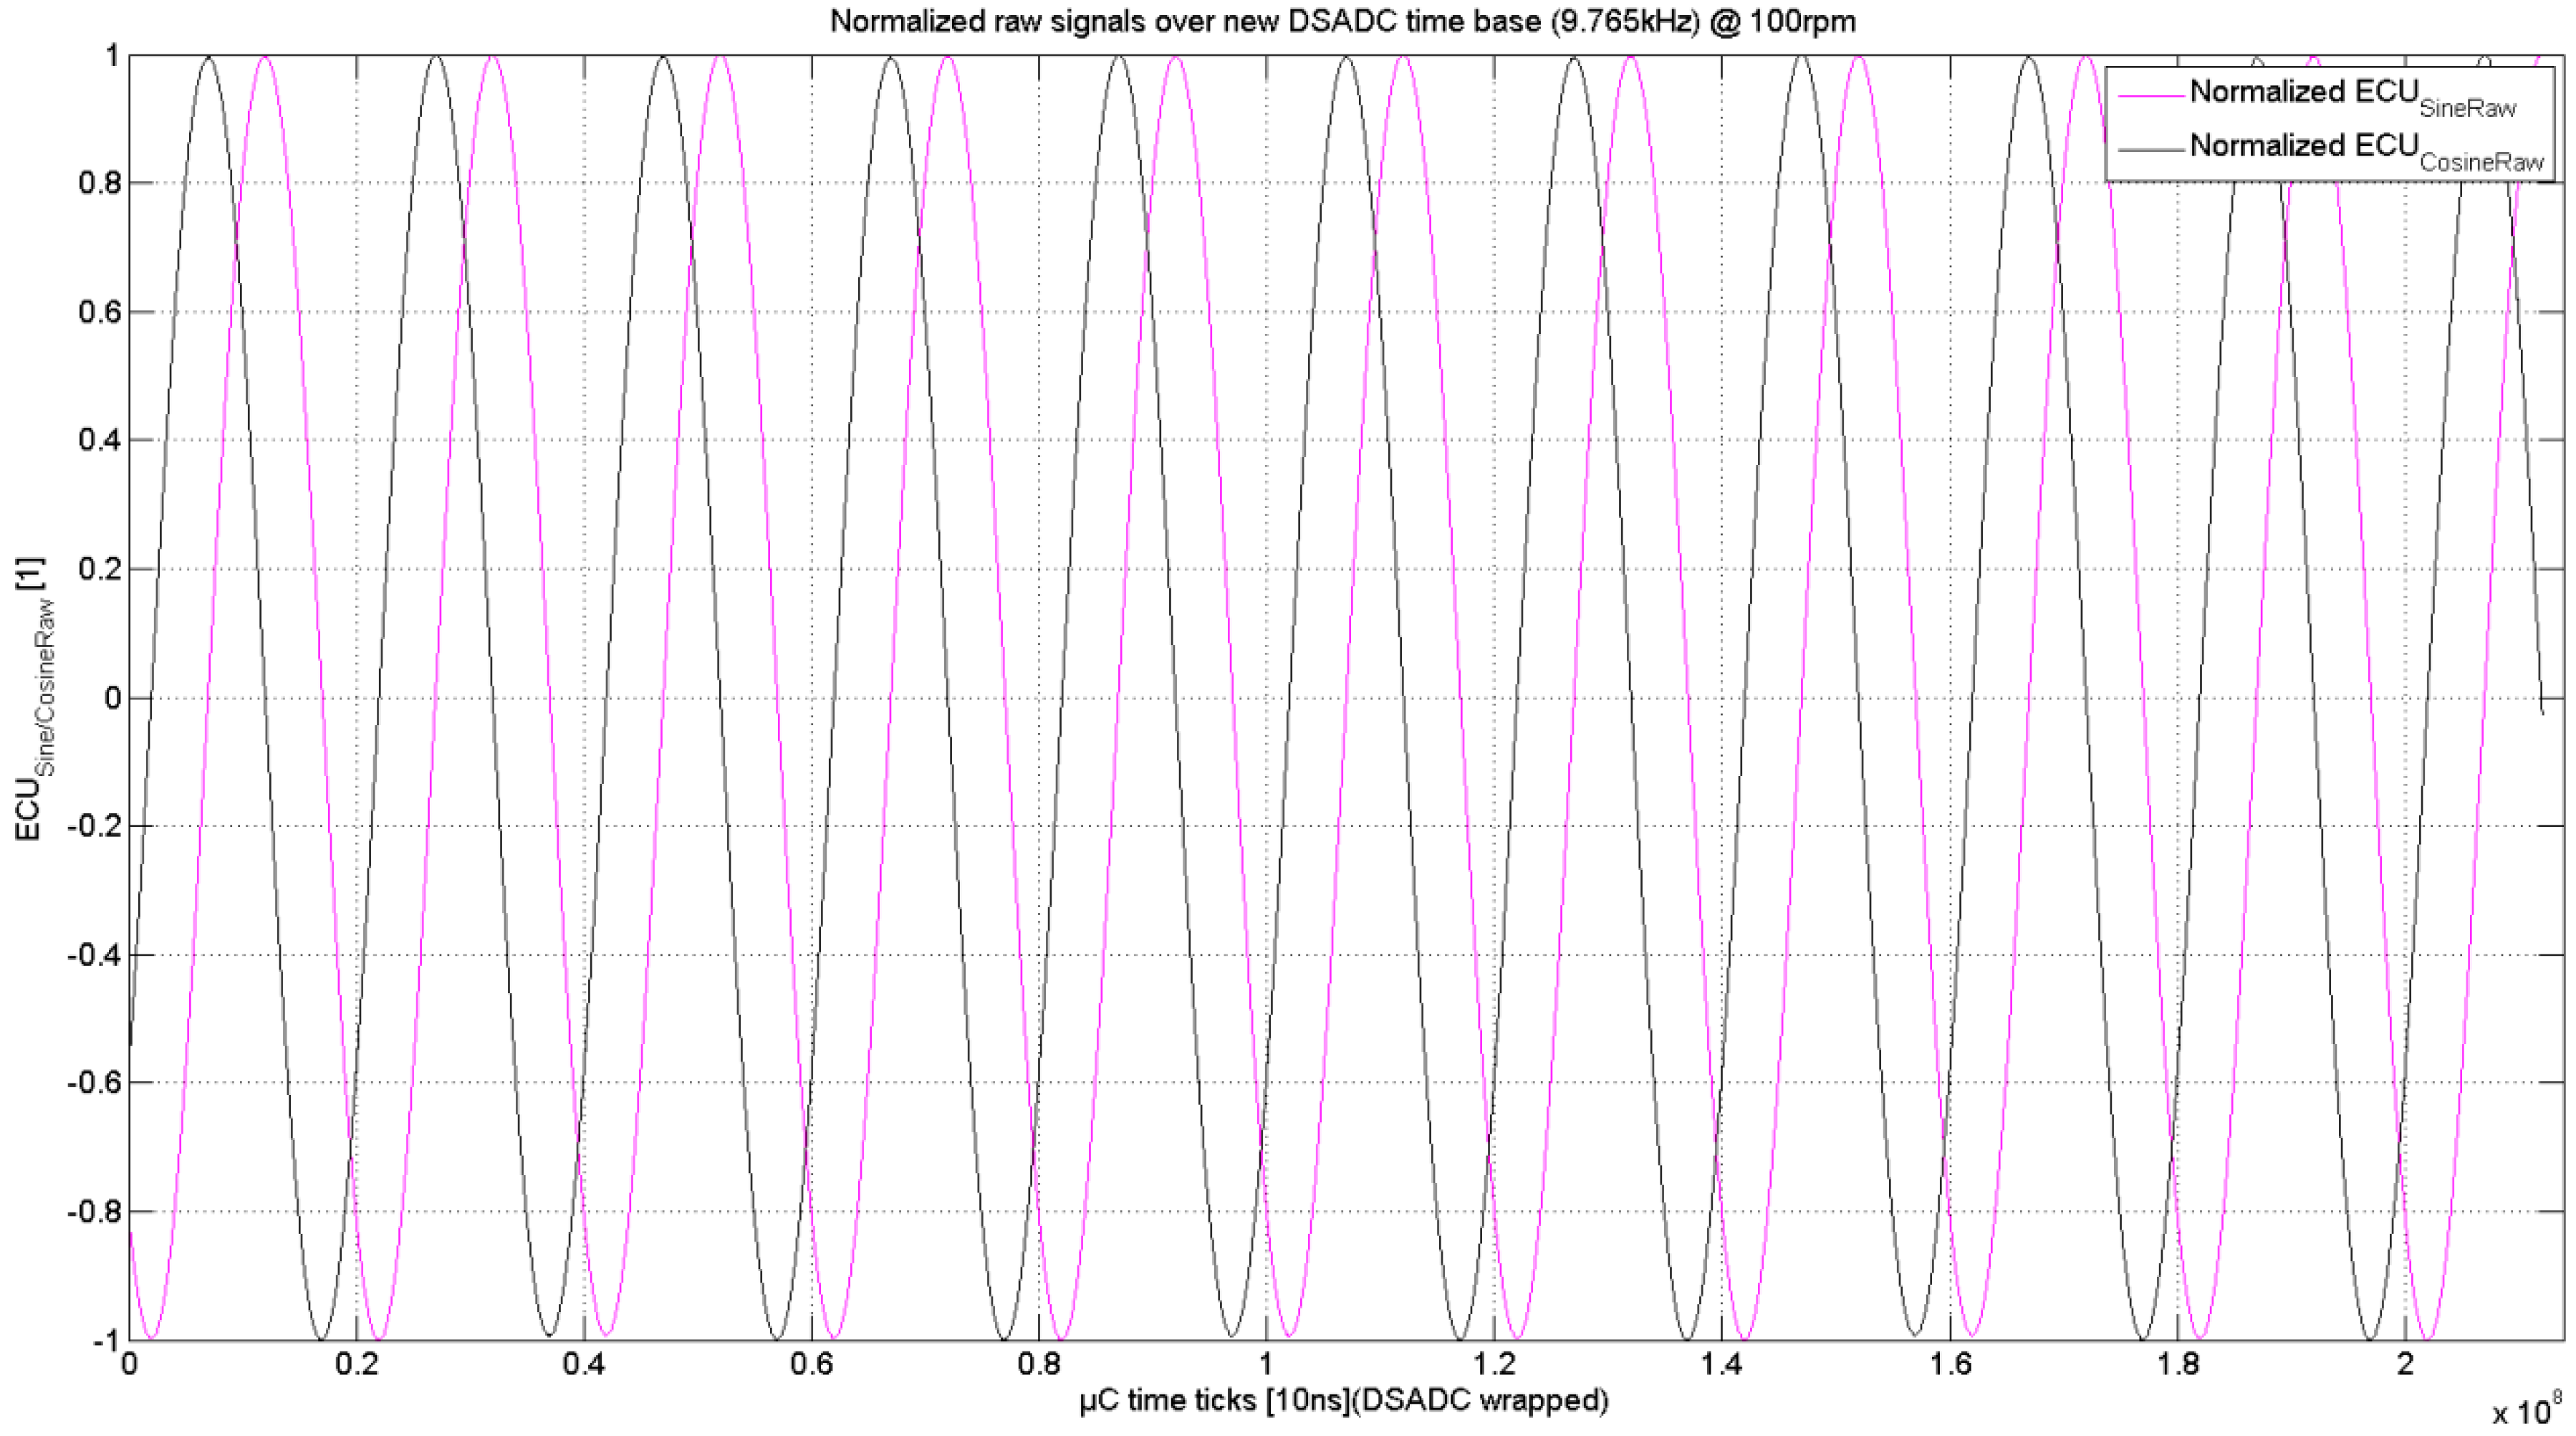
As stated in the previous section, the measured raw resolver feedback signals are captured within the DSADC timestamp tDSADC = 102.4 µs (fDSADC Event = 9.765 kHz). Thereby the ∆Σ-ADC samples the signals and represents the amplitude in a numerical integer value, here within a range of ±8000. After applying the offset compensation to achieve a symmetrical signal around zero and further normalizing the sinusoidal signals, each sampled value is linked to the particular element in the time vector related to the timestamp PosTimestampDSADC, hence it is guaranteed that both vectors, the raw sine and cosine signal vector plus the DSADC timestamp vector, evince the same length. Due to the fact that the counter variables PosTimestampDSADC and PosTimestampPWM are set to zero in the case of a numerical overflow, a continuously increasing time base is not given yet for further evaluation. For that reason, the wrap-around of these two measured variables is removed and set to a defined initial time tDSADC = tPWM = 0 s to compensate the different ramp up times that vary depending on each booting process of the µC. Following Figure 14 demonstrates the original counter variable of the PosTimestampPWM and the new, wrap-around removed, time base for further evaluation.
Now that both ECU task time variables are prepared, the deviation between both counting variables can be determined. It is necessary to detect whether the DSADC task is after or before the PWM task regarding the timing, as stated in Section 2.2.2 (Figure 7). This task timing difference represents the fundament of the subsequently performed angular compensation procedure. Considering the known task timing difference, the angular position at the DSADC timestamp is computed.
φResolver,1 (tDSADC·n) = m°
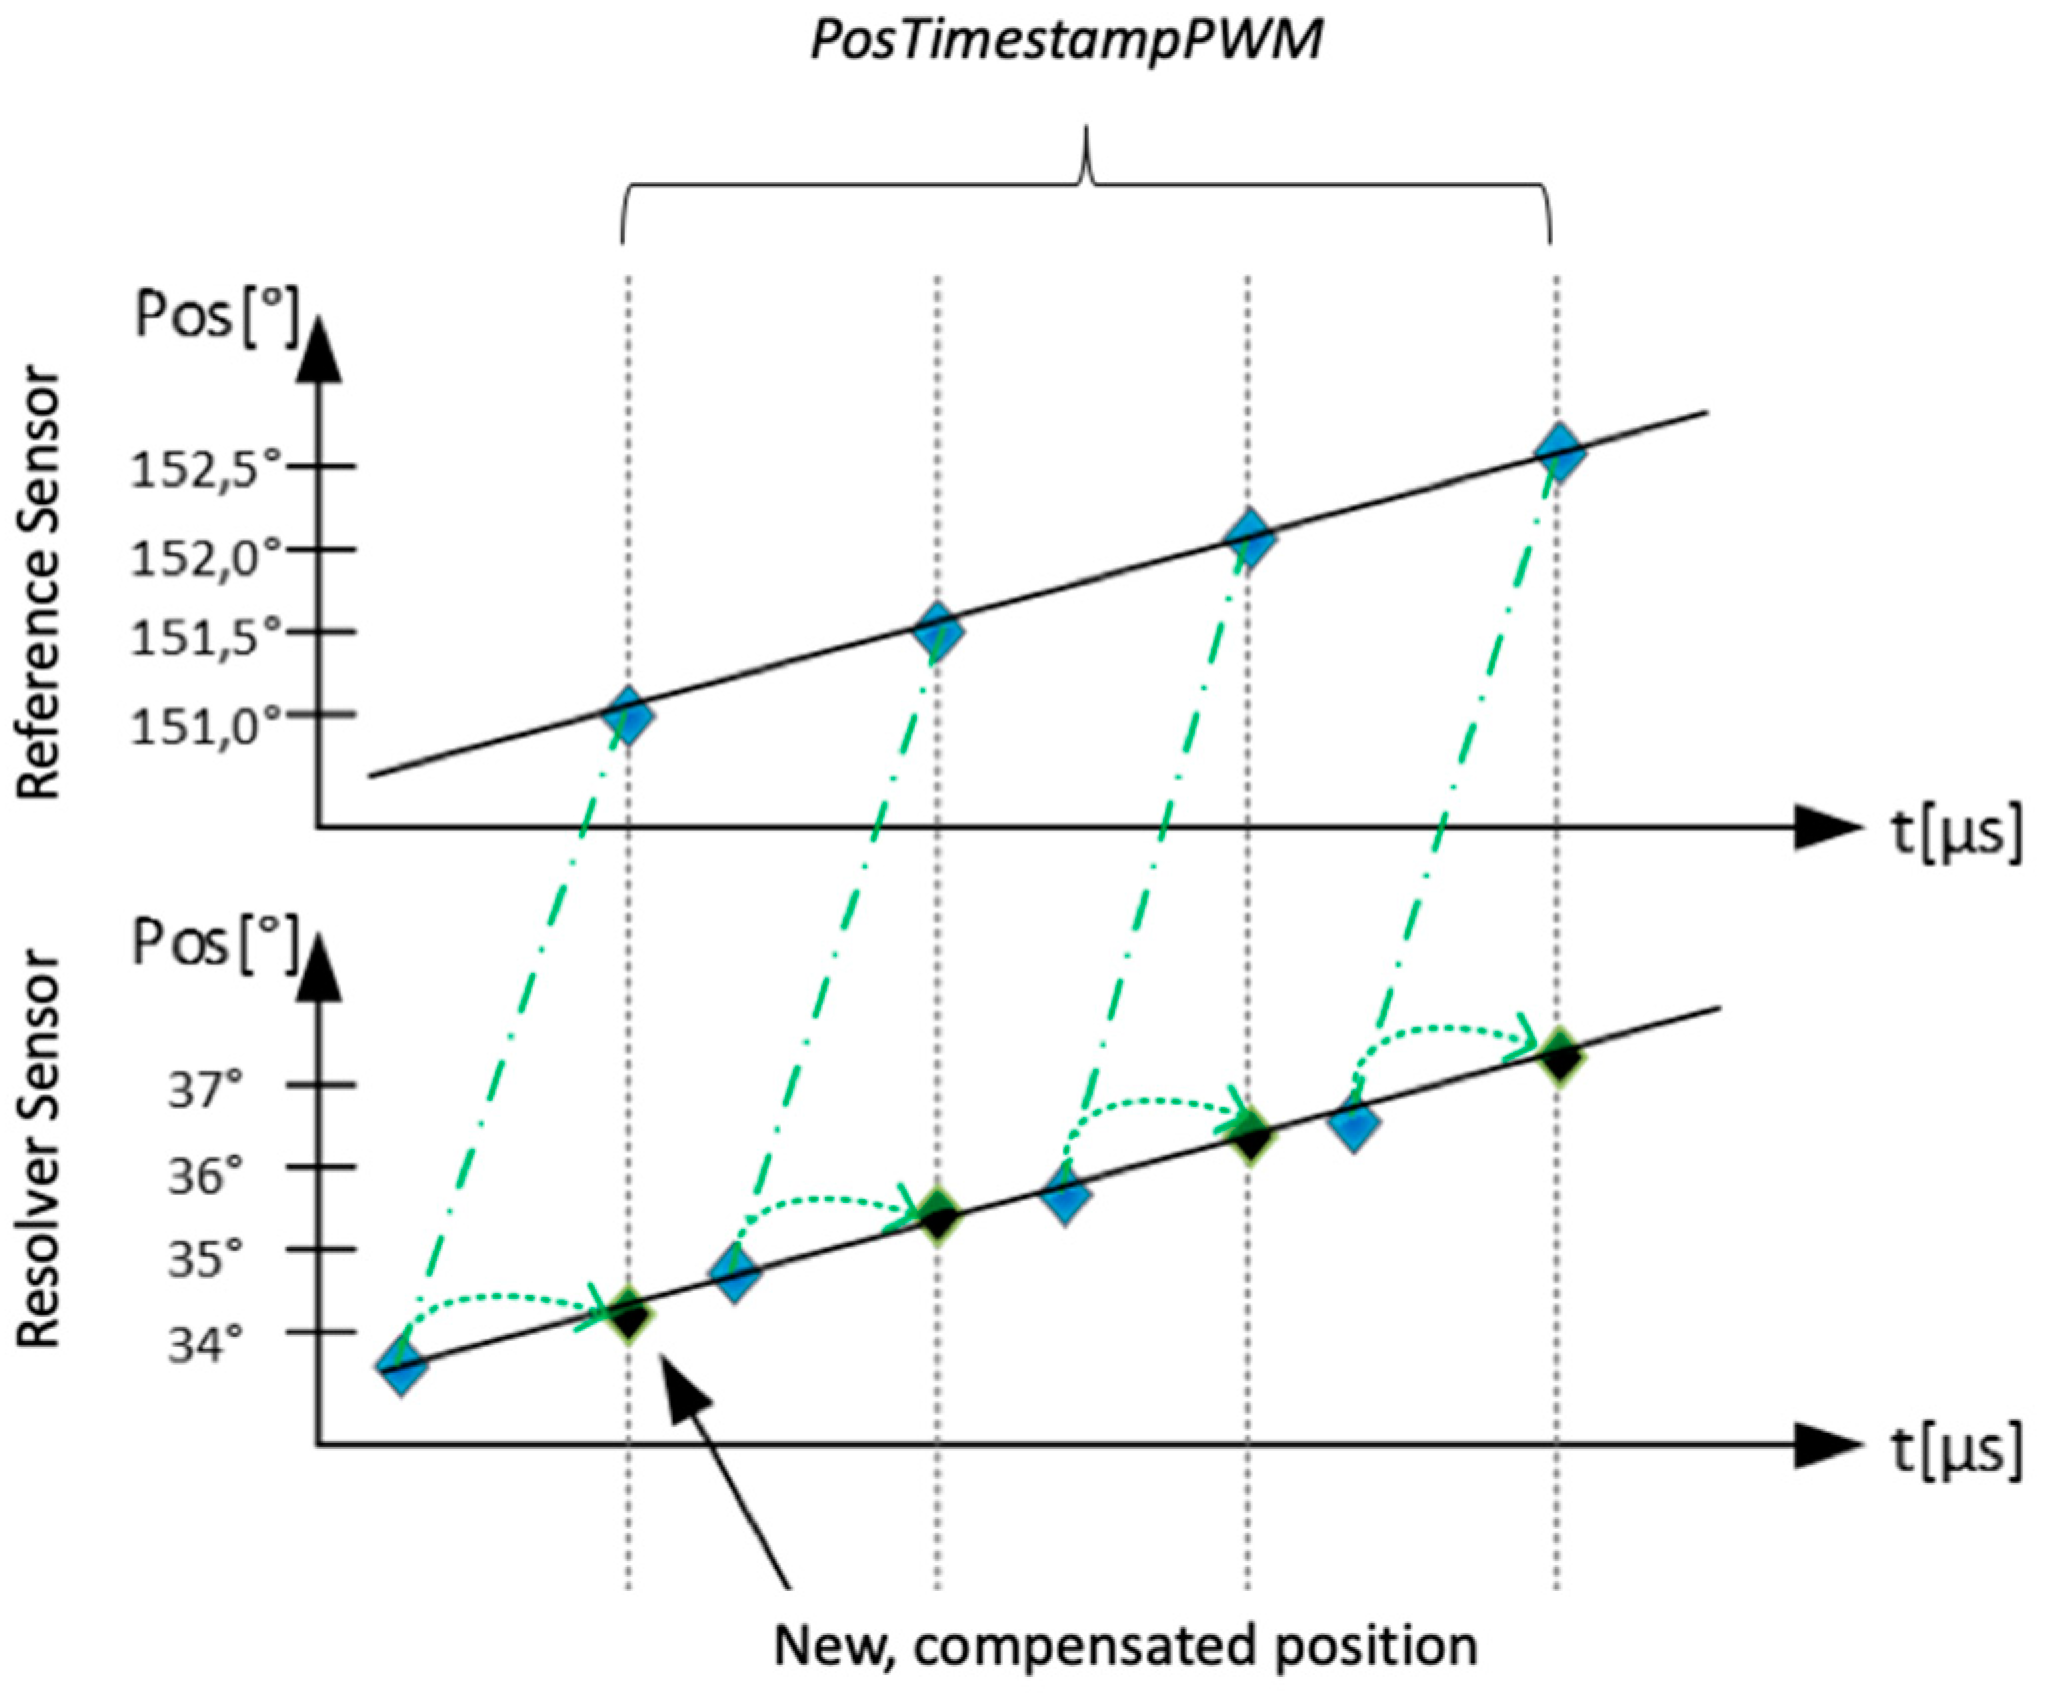
Because the reference is read out based on the PWM timestamp, the measured resolver position φResolver,1 needs to be shifted to the PWM timestamp, where the actual measurement for comparison takes place under consideration of the angular velocity, measured by the reference sensor at the timestamp PWM (see Equation (5)). For demonstration, Figure 15 visualizes the method and the correct DUT angle that can be compared with the reference sensor angular position. The reference position is measured at the PWM timestamp. Because the DUT position is captured by the DSADC timestamp, the position needs to be compensated by adding or removing the corresponding angular offset under consideration of the reference angular velocity ⍵. The new DUT position is then time synchronous with the reference position and contains the true position value at that timestamp.
φResolver,2 (tPWM) = tDSADC ± tdiff = m + ω(tPWM

2.6. Merging of DUT and Reference Angle Plus Angle Error Determination (Characterization)

The DUT raw signals with the new time base are calculated by an ATAN2-function to determine the DUT position. In the case of a multispeed resolver, the number of electrical revolutions is higher than those of the mechanical revolutions of the reference (see Section 2.2.1). For that reason, the reference angle is manipulated by a Euclidean division operation times the number of poles regarding the DUT. After applying the angular compensation as stated in the previous section, both resulting electrical angles need to be synchronized to 0° to compensate the mechanical offset that stems from the mounting procedure at the test bench.
For the functional non-linearity (FNL) analysis, both angles are set to 0° only at the beginning of the investigated interval (e.g., t/Ts periods). The developed algorithm described in Equations (5) and (6) iterates through all measurement points of each angle (reference and DUT), checking where both angle values are equal or similar at the same point. The difference (offset) is subtracted from the leading angle, shown in Equations (8)–(11). The resulting, merged angle signals used for further computation (e.g., in characterization computation, Figure 13) are described in Equations (12) and (13) as a saw-tooth characteristic with the starting value φref and φDUT from Equations (10) and (11).
φref,0 = f((1,n))
φref,1 = f(n) f(n) ≤ f(n − 1)
nMM = {1, …, t/Ts}
φDUT,0 = g((1,n))
φDUT,1 = g(n) g(n) ≤ g(n − 1)
nMM = {1, …, t/Ts}
offset = φref,1φDUT,1 for φref,0 > φDUT,0
offset = φDUT,1φref,1 for φDUT,0 > φref,0
φref = φref,1 − offset
φDUT = φDUT,1 for φref,1 > φDUT,1
ΦDUT = φDUT,1 − offset
Φref = φref,1 for φDUT,1 > φref,1
f(x) = (x + φref) for 0 ≤ x ≤ 2π
g(x) = (x + φDUT) for 0 ≤ x ≤ 2π
For the common error analysis, this compensation is done every period, see nM in Equation (6) and Equation (7) vs. nN in Equation (14) and Equation (15). The compensation is described by the Equations (12)–(19). The main benefit of the applied FNL analysis is that an error drift can be investigated if certain influences provoke a change of the DUT angle.
φref,0 = f((1,n))
φref,1 = f(n) f(n) ≤ f(n − 1)
nN
φDUT,0 = g((1,n))
φDUT,1 = g(n) g(n) ≤ g(n − 1)
nN
offset = φref,1φDUT,1 for φref,0 > φDUT,0
offset = φDUT,1φref,1 for φDUT,0 > φref,0
φref = φref,1 − offset
φDUT = φDUT,1 for φref,1 > φDUT,1
ΦDUT = φDUT,1 − offset
Φref = φref,1 for φDUT,1 > φref,1
f(x) = (x + φref) for 0 ≤ x ≤ 2π
g(x) = (x + φDUT) for 0 ≤ x ≤ 2π
The results are then plotted (see Section 3) to support graphical analysis and investigations (e.g., DUT angle error tolerances). Furthermore, the plotted results are converted into a Microsoft PowerPoint [27] file format automatically via a specific application program interface (API) to enable effective and automated figure results for further investigations and analysis. Besides the figures, all relevant results, e.g., electrical peak–peak error (°), electrical min. and max. error (°) in respect of the specific test condition, are entered automatically in a Microsoft Excel [28] sheet contributing to an intuitive overview of the system-under-test performance. These additional features enable an extended sensor-oriented characterization in addition to the sensor model-based characterization introduced in [5]. Besides an evaluation and modelling of rotor position sensor characteristics [5], the extended evaluation approach enables FNL angle error analysis, as well as standard error analysis over a desired number of electrical periods. This enables a more detailed statement of the actual measured rotor position error under certain mechanical and/or temperature and/or speed conditions.
3. Results

For demonstration purposes, the introduced methods of both synchronizing the measurement hardware and processing the resulting measurement angles are exemplary applied on a dedicated automotive ECU and an arbitrary eddy current resolver (see Section 2.2.1), gauged on the stated test bench using the equipment represented in Section 2.5.1.
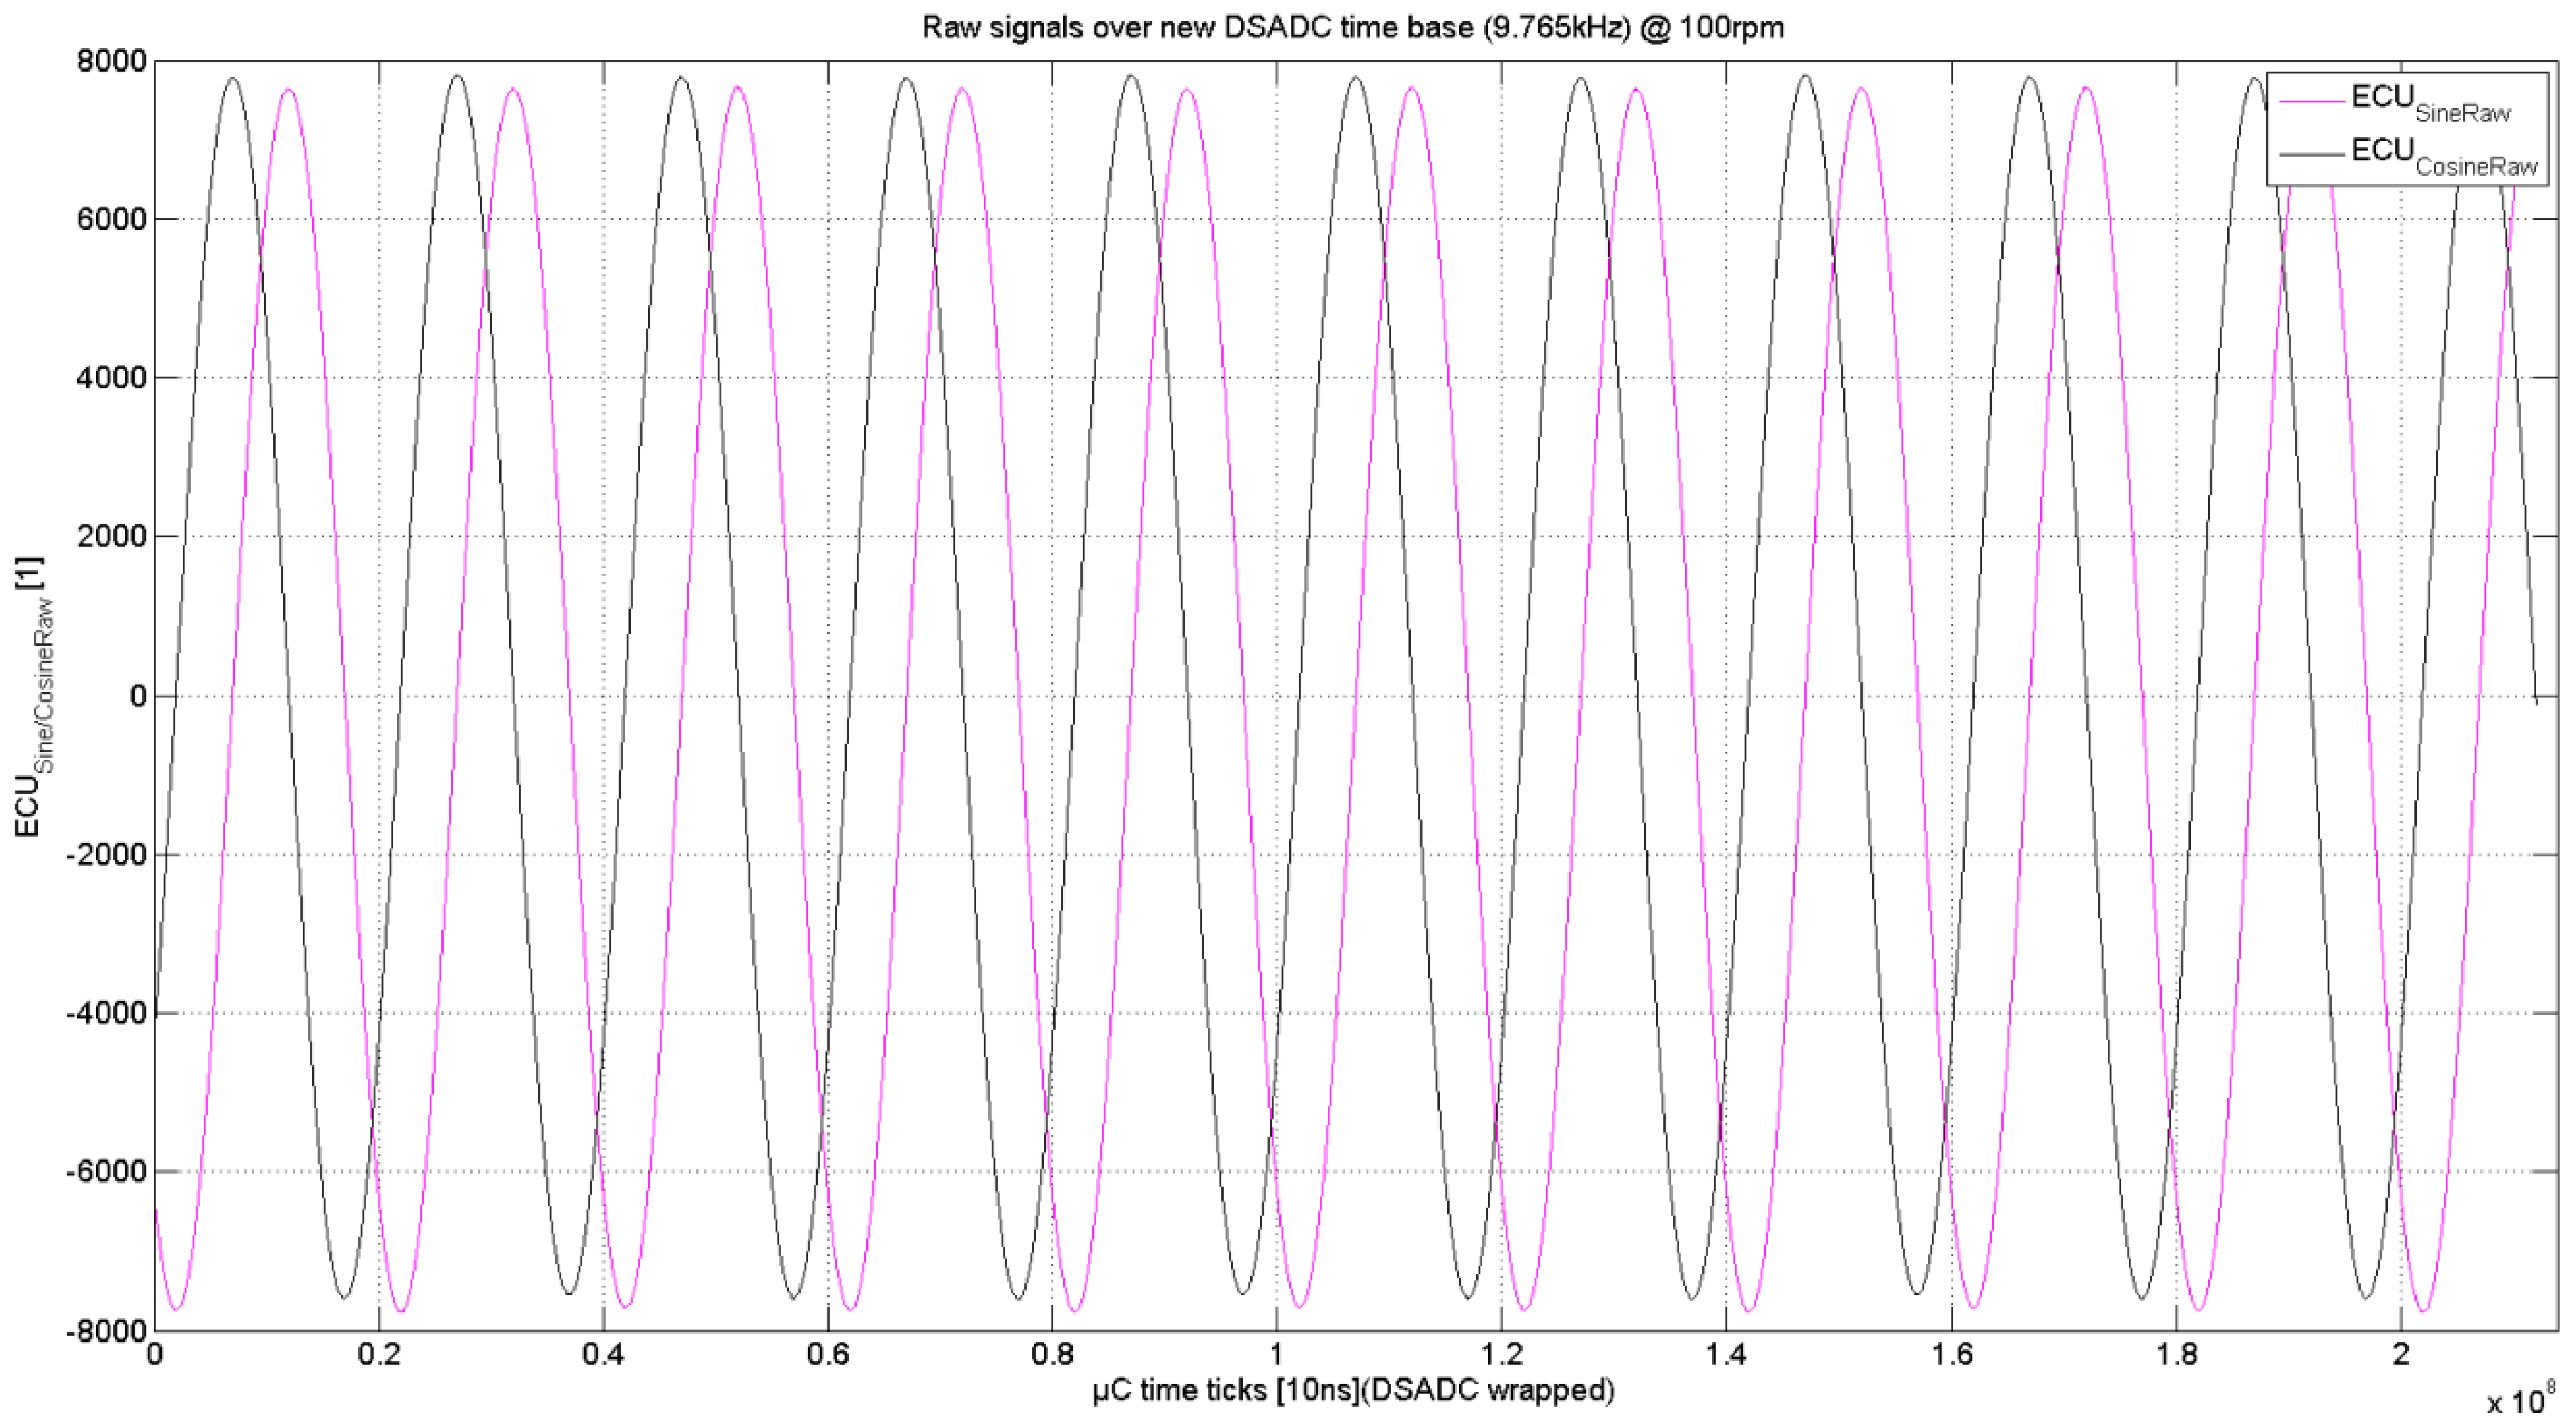
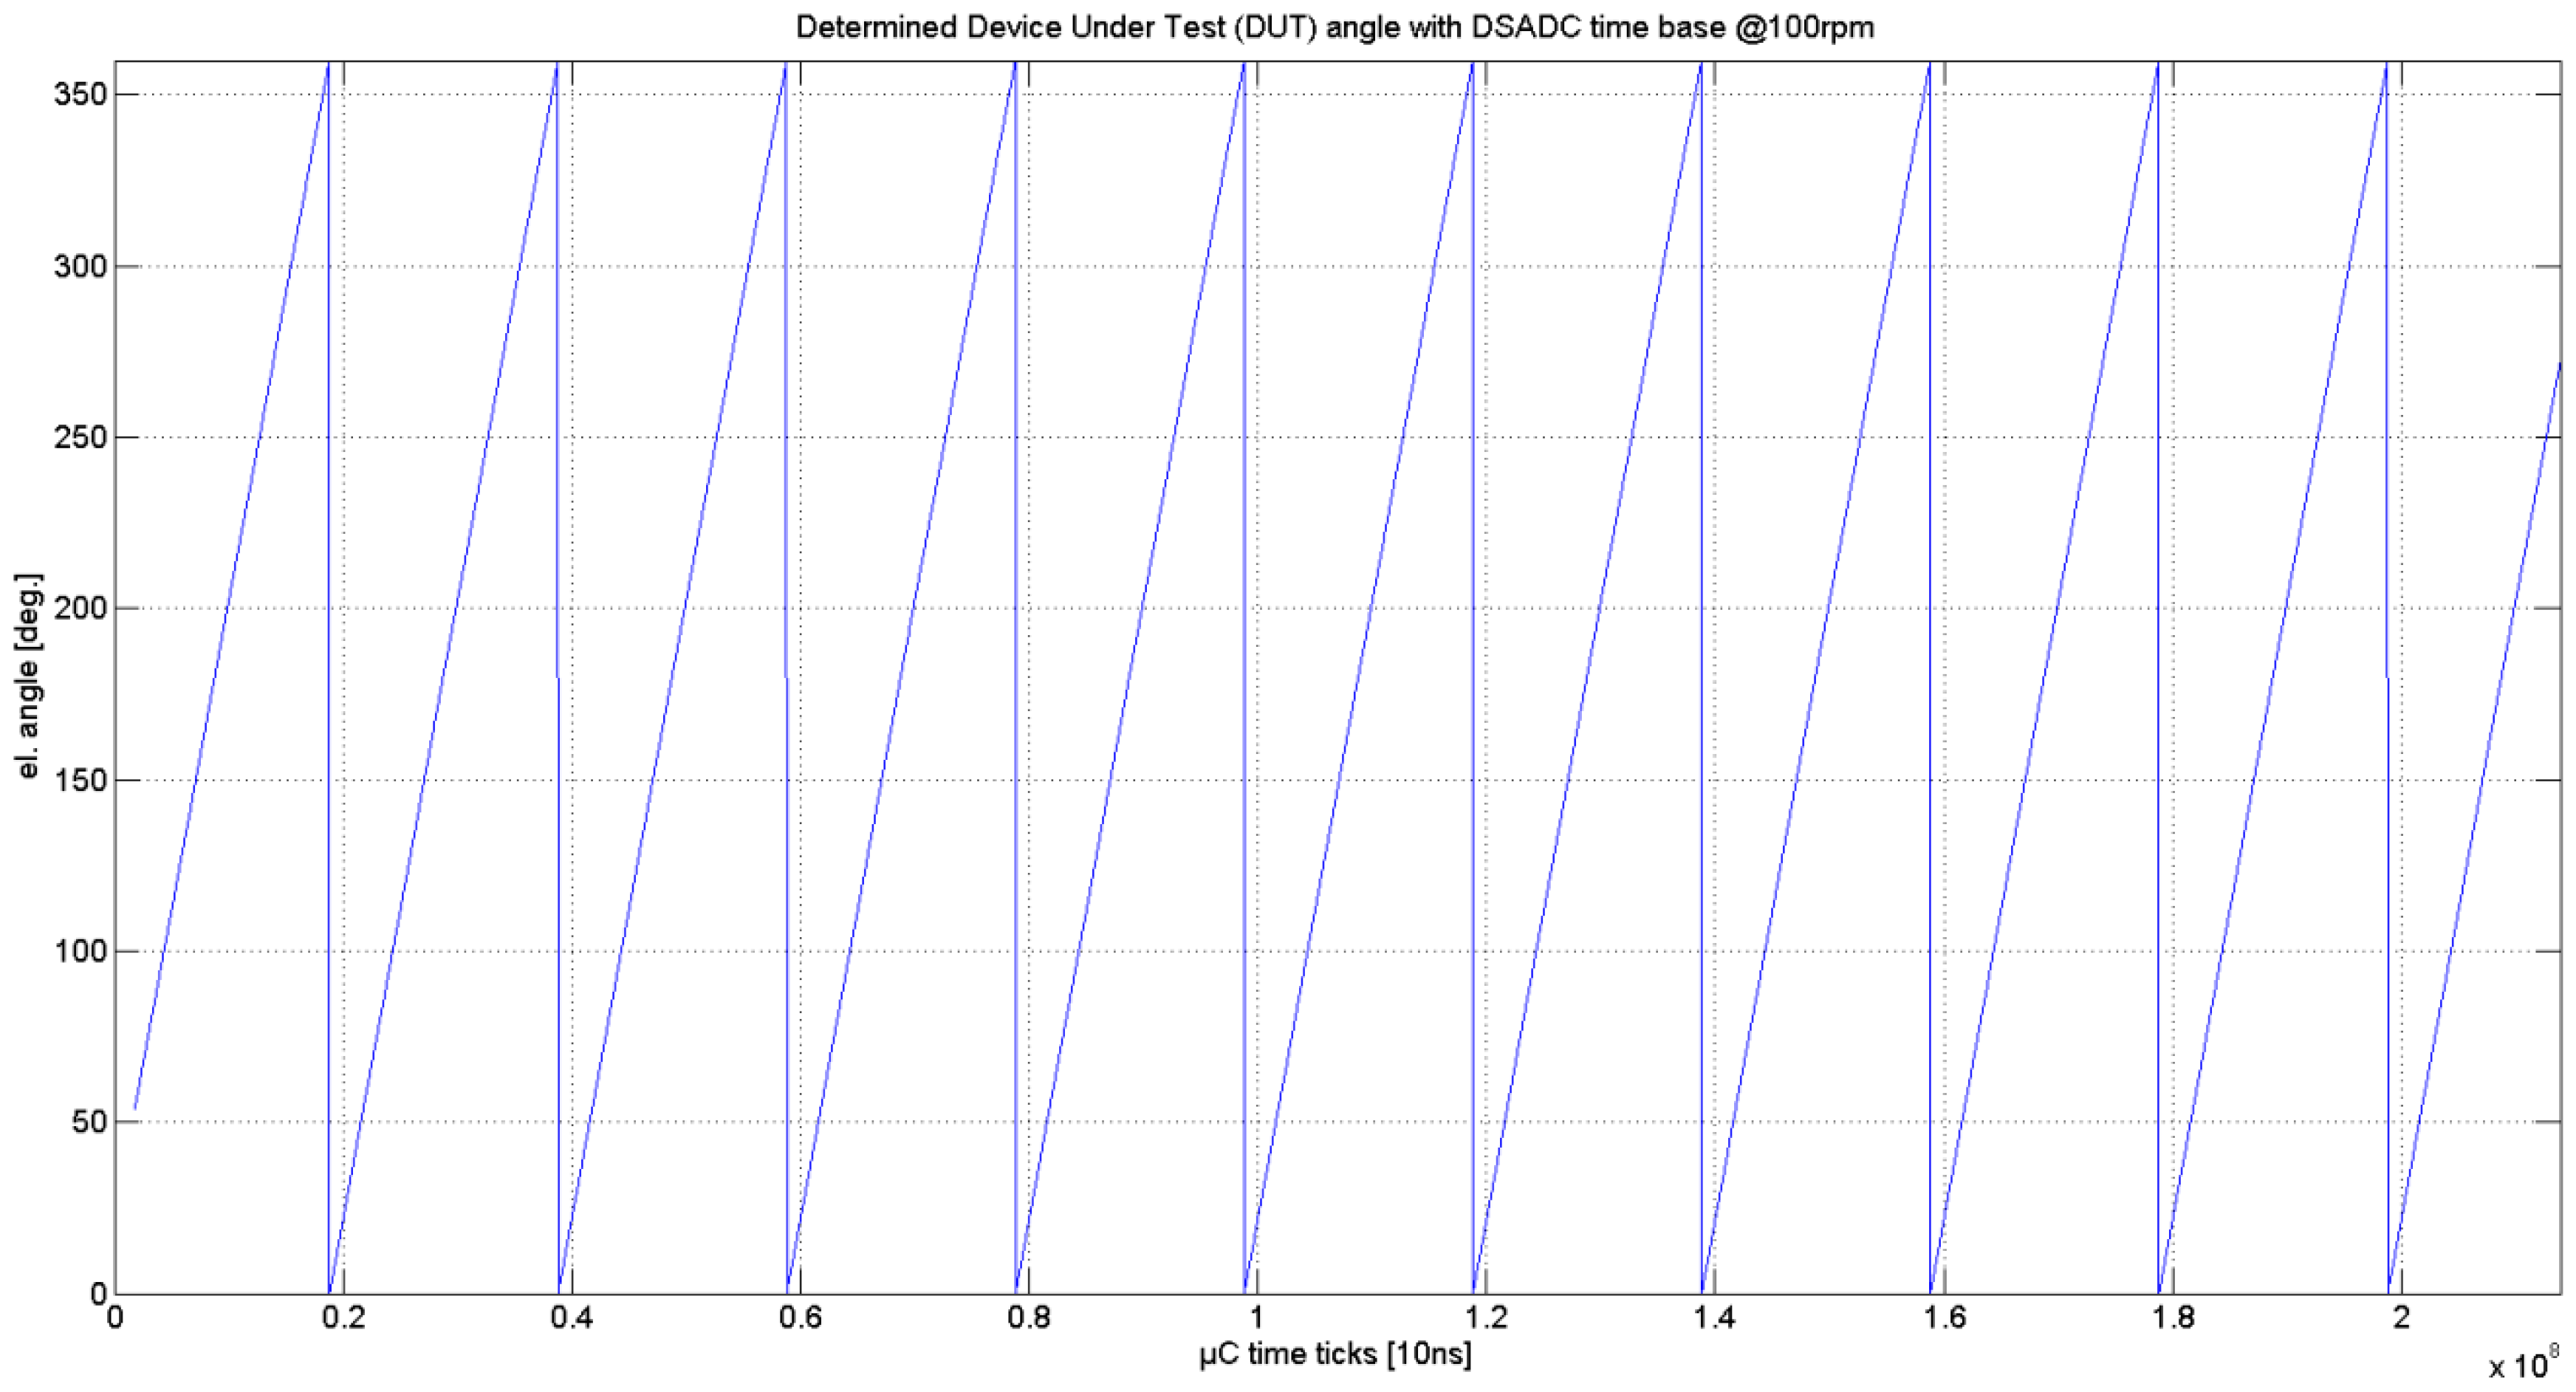
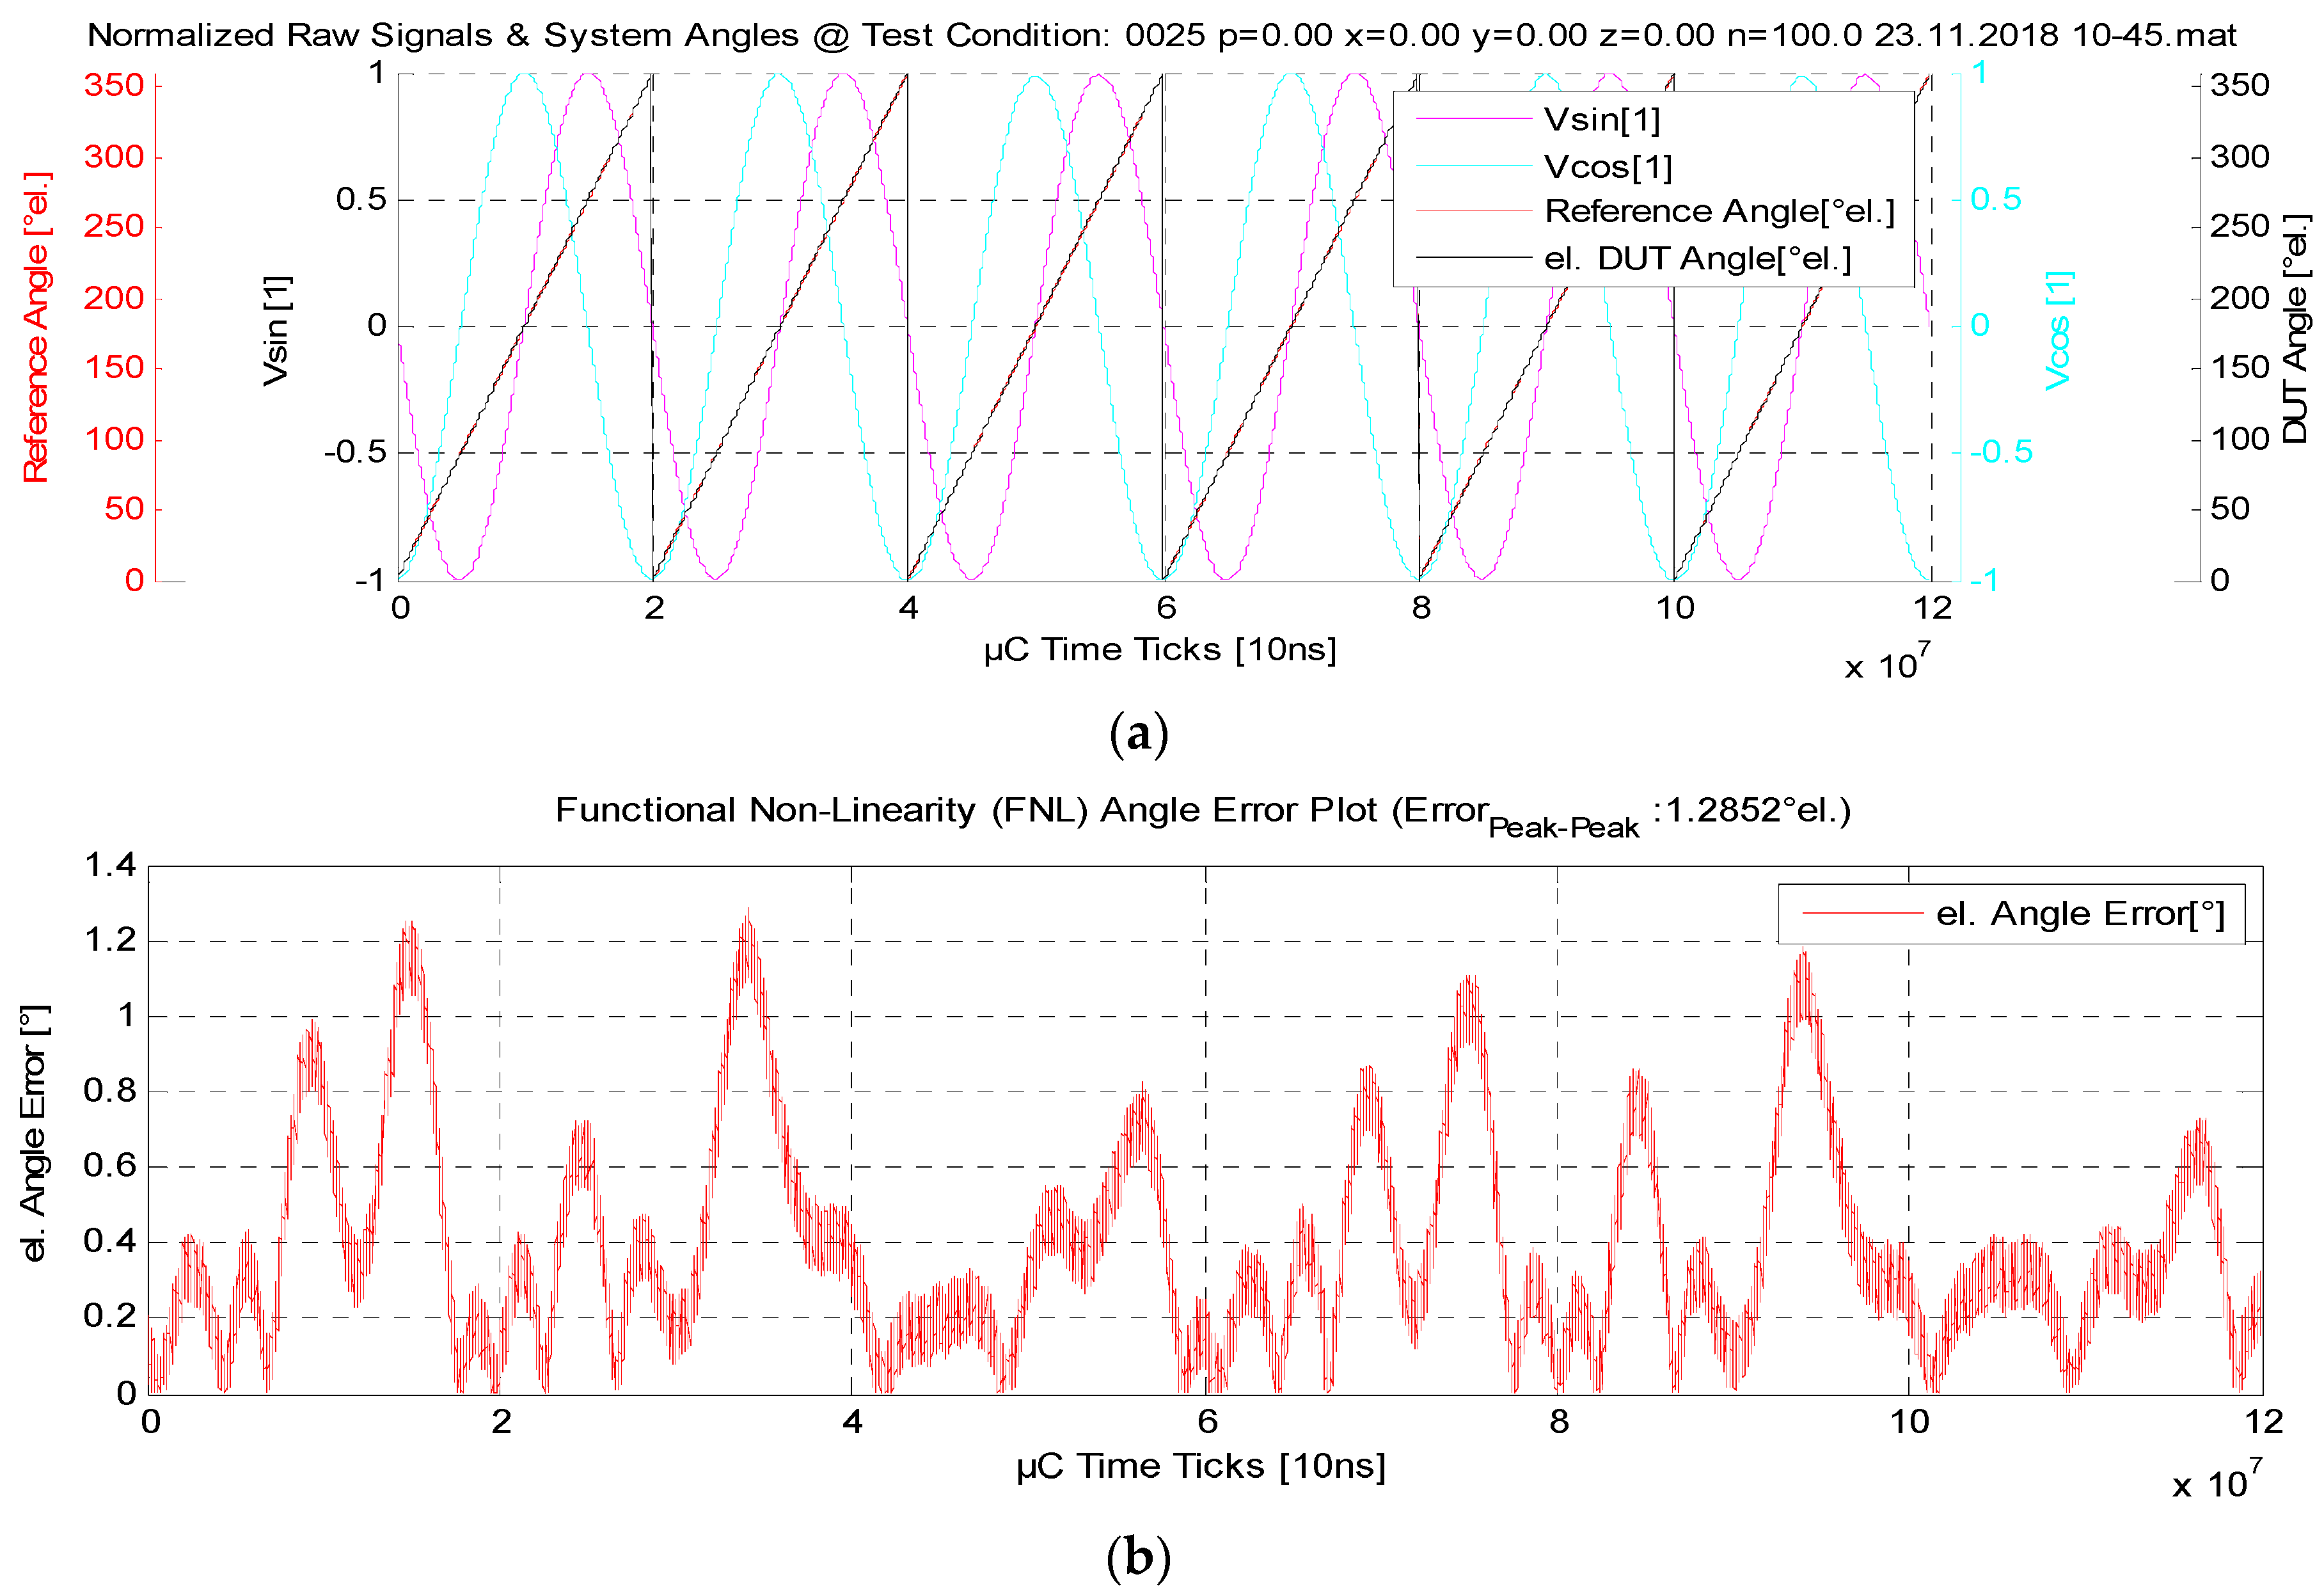
In the first test case, a constant speed of n = 100 rpm is applied under nominally operation conditions (Δx = Δy = Δz = 0 mm; Δϕ = 0°; T = 23 °C). This scenario demonstrates the capability of capturing sensor data (Figure 16 and Figure 17) in general. In addition, the offline processing results are exemplarily presented and discussed, namely, the sensor signal normalization and offset compensation (Figure 18), the DUT angular position (Figure 19) under consideration of task timing compensation merged with the reference angular position (Figure 20).
Besides the angle error analysis in a certain test condition shown in Figure 20, a simple table is automatically generated in the offline characterization method (Table 1), providing the number of test condition, electrical angle error (peak–peak) as well as maximum and minimum electrical error in degrees to support determination and discussion of angle error limits and tolerances.
Regarding the Institute of Automotive Engineering, where the introduced approach has been developed, a particular design of experiments (DoE) based sensor evaluation method is established [15], of which integration will be shown below.
The second test case makes use of another experimental approach, which has been introduced in detail in a previous publication: DoE characterization [15]. Therefore, a reduced three-level design, namely a Central Composite Inscribed (CCI) design, is applied. The aim is to reduce the number of experiment runs to a minimum, compared to a full factorial design [15,29,30]. An important benefit of the DoE approach is that a physical modelling of the investigated process, which can be challenging and time intense, is unnecessary. In this way it is possible to compare different sensor principle error characteristics with a low number of measurements and variations of additional effects. Therefore, the DoE approach presents itself as a preferred choice for sensor evaluation because it is possible to find a describing mathematical sensor error model that is independent from the physical principles and effects [15].
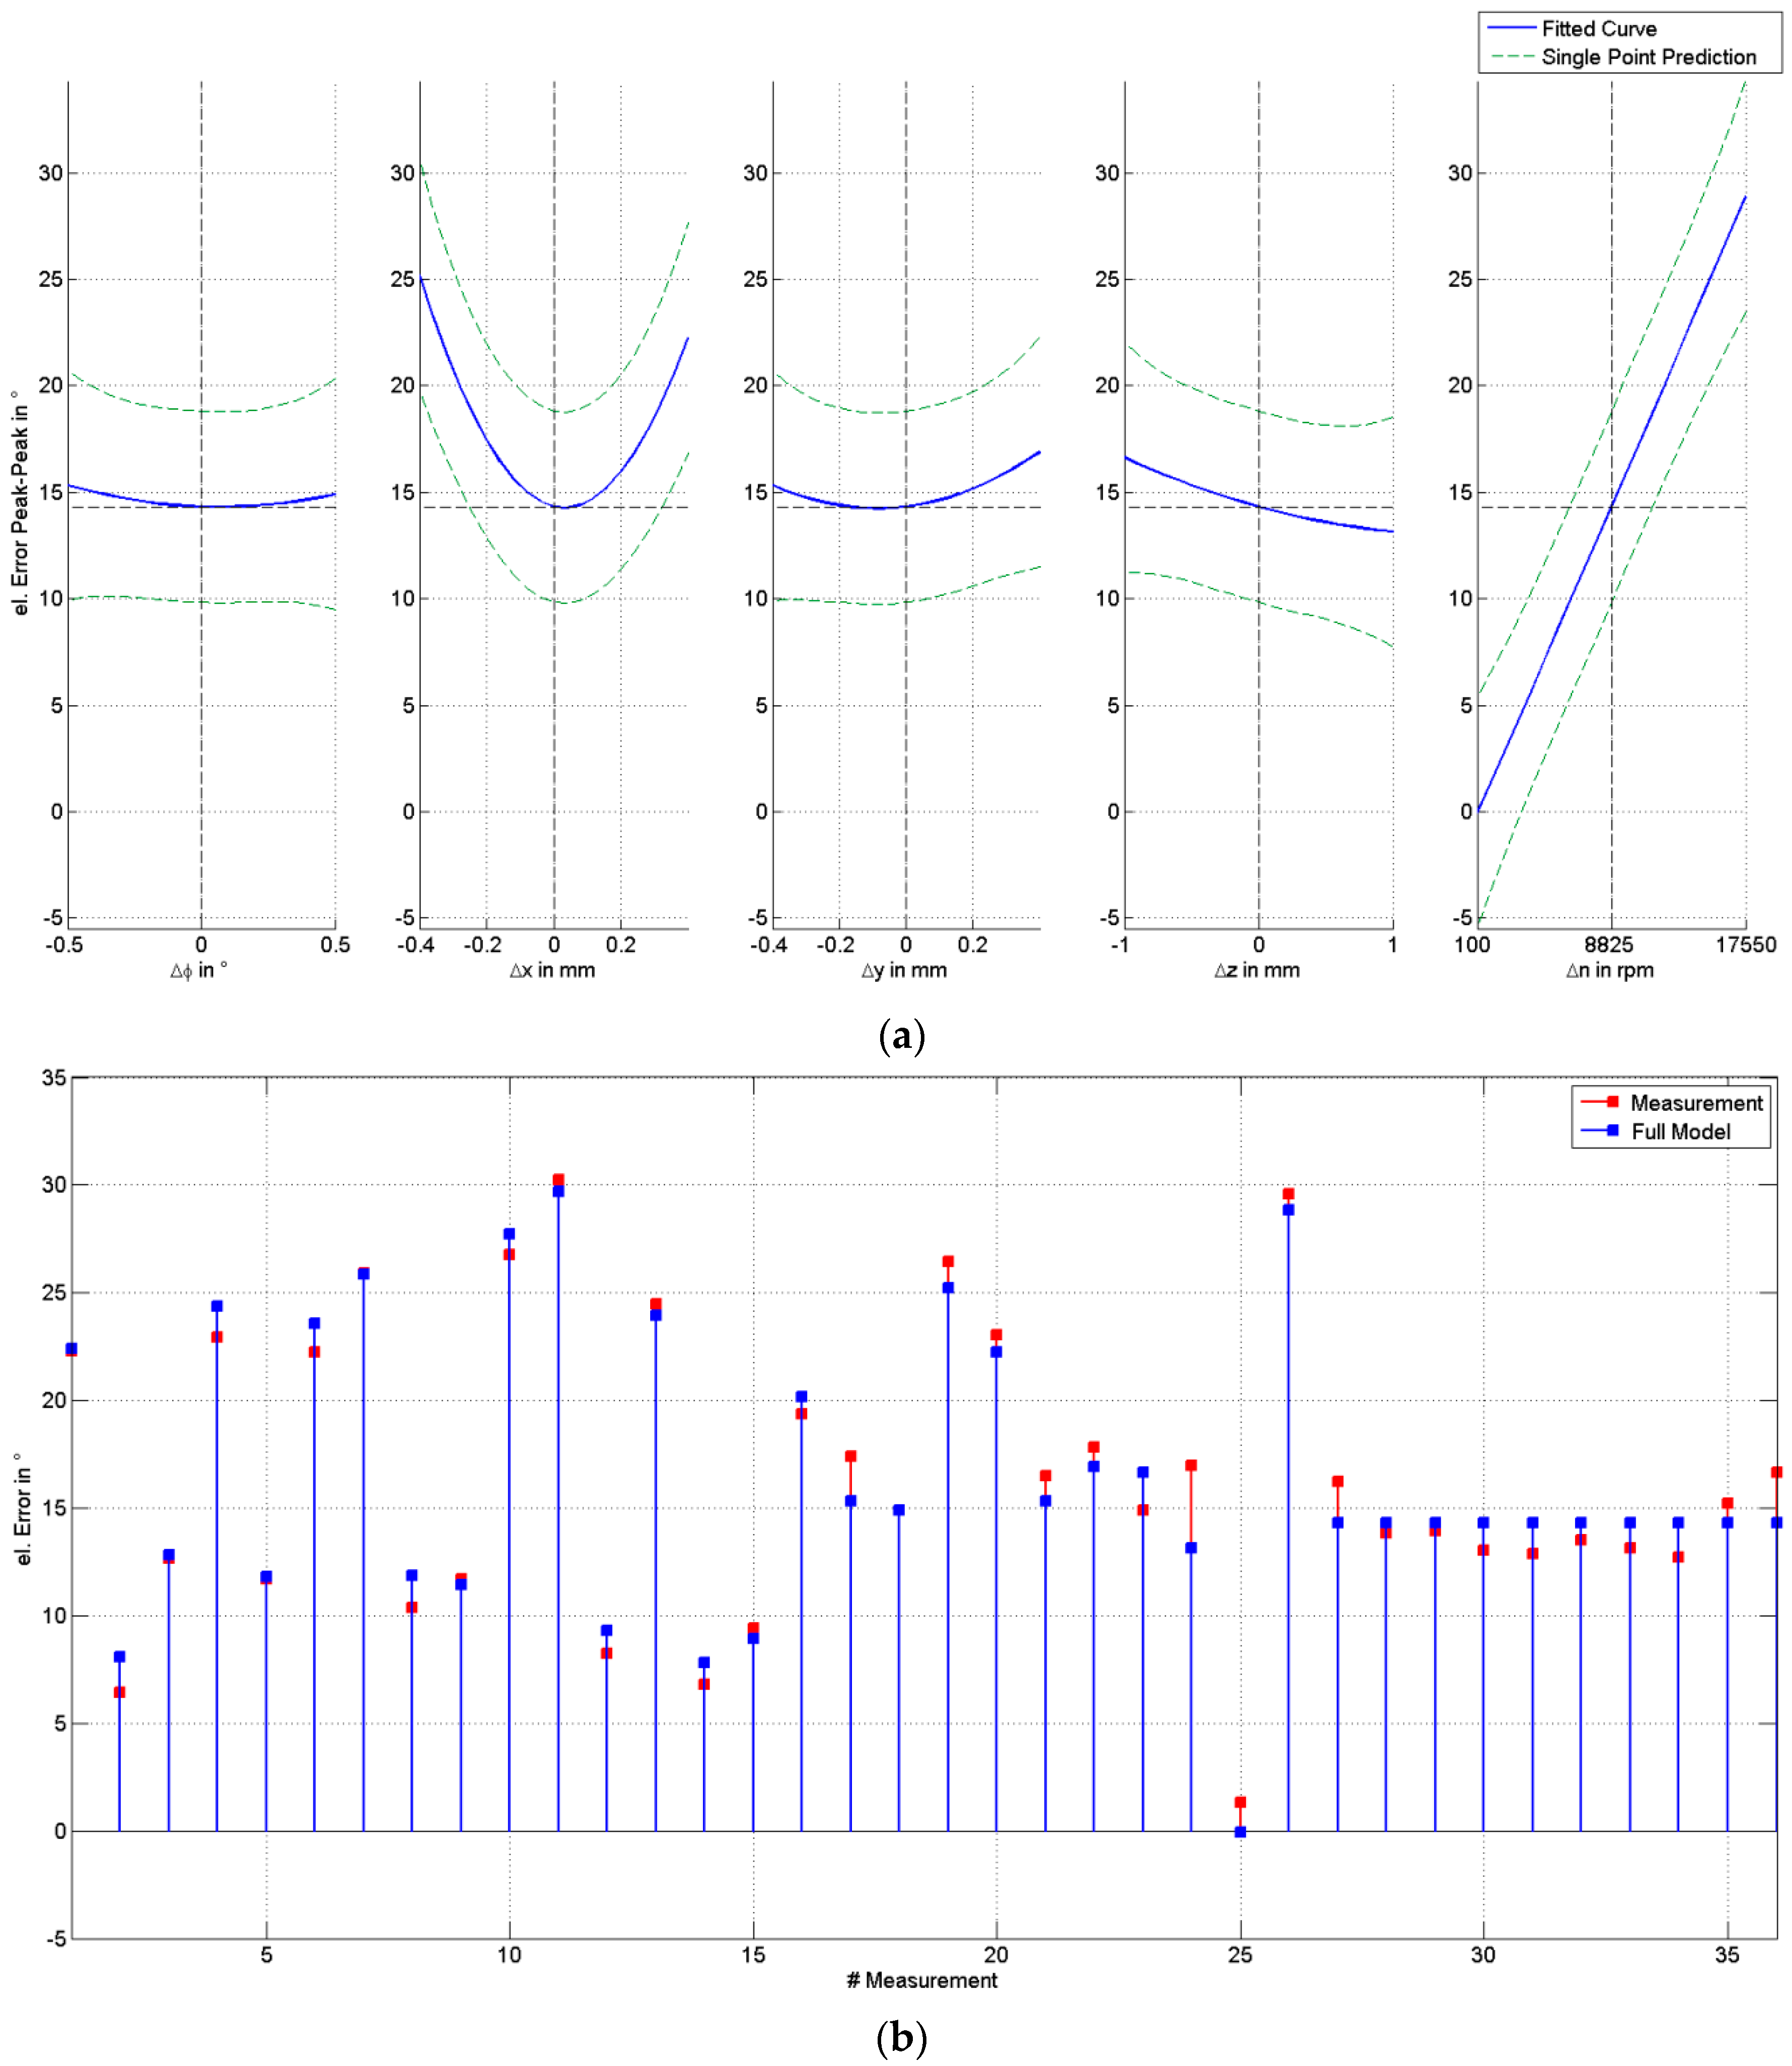
The following parameters are variated for an exemplary DoE analysis, Figure 21:
-
ϕ (tilt, position angle): −0.5° to 0.5°
-
x-axis: −0.4 mm to 0.4 mm
-
y-axis: −0.4 mm to 0.4 mm
-
z-axis: −1 mm to 1 mm
-
n (revolution): 100 rpm to 17,550 rpm

4. Discussion and Conclusions

The presented research introduces a novel evaluation approach for position sensor systems that is able to extend state-of-the-art sensor modeling and evaluation [6,7,15]. The developed synchronization method enables a comparison and benchmark of arbitrary resolver-based automotive position sensor systems with a high precision reference system on a specifically developed test bench.
As a basis of the introduced approach, both measurement systems capture the sensor value (reference sensor and DUT) independently. A hardware synchronization concept is realized using an electrical trigger signal that stems from the ECU and triggers the reference sensor at the exact same time the software capturing of the DUT is performed within the ECU. For defining an explicit start time of the data acquisition process, both the reference system and the DUT recording system are started and stopped by the test bench automatization software. Due to the fact that the ECU provides two different time bases (one for capturing the resolver and another for acquiring, and respectively processing, the measured data in software), the provided resolver angle needs to be offset compensated to the real angular position at the time base of the PWM Event, where the software-based triggered reference angular position is also captured. This is done by preparing the raw resolver feedback signals regarding normalization and symmetric adjustment, determine the DUT angle, and bringing it to the PWM timestamp with the new angular position at each desired timestamp under consideration of the angular velocity captured by the more precise reference system.
With this sophisticated hardware synchronization approach, the complexity of determination of two sensor values at one time and, as a result, the comparison of those two values with each other, can be solved in a reliable and accurate way.
Even if the measurement hardware is synchronized, it has to be taken in account that a drift may occur over a longer period of recording time. This variable angle offset between the reference and DUT angle could possibly stem from slight clock deviations of each clock generator, e.g., because both quartz crystals do not oscillate with an identical frequency. The current approach compensates for this type of deviation by synchronizing both measured angle values combined with data acquisition of over a limited time range. For a certain range of samples, and thus periods, the deviation can be reduced to zero as demonstrated in Figure 20, upper plot.
One future compensation approach to reduce this deviation over the whole measurement range/time could be synchronizing both the ECU’s µC and the reference acquisition FPGA with a common clock (e.g., µC general clock). When both systems are operating at the same quartz clock frequency, this effect can be reduced chiefly.
An implemented automated MATLAB™ script-based evaluation procedure allows the determination of the sample’s raw signals, position, reference position and subtraction (electrical angle error) in a very flexible and intuitive way. Moreover, the synchronization scripts provide full compatibility with the DoE analysis, introduced in [15]. In this way, the presented approach is able to enhance the existing model-based DoE analysis procedures for position sensor evaluation [5]. The scripts are programmed generically to enable a wide range of sensors to be investigated. The results can additionally be exported in Microsoft PowerPoint [27] and Excel [28] formats automatically to support efficient benchmarks by different expert and non-expert audiences.
In this way, the introduced advanced evaluation methods are able to support decision makers for selection and optimization of position and speed sensor technologies for electric automotive drive train systems.

Author Contributions

Conceptualization, C.D. and M.H.; Methodology, C.D.; Software, C.D.; Validation, C.D.; Formal Analysis, C.D.; Investigation, C.D.; Resources, C.D. and M.H.; Data Curation, C.D.; Writing-Original Draft Preparation, C.D.; Writing-Review & Editing, M.H.; Visualization, C.D.; Supervision, M.H.; Project Administration, M.H.

Funding

This research received no external funding.

Conflicts of Interest

The authors declare no conflict of interest.

References

  1. European Commission: Road transport: Reducing CO2 emissions from vehicles. Available online: https://ec.europa.eu/clima/policies/transport/vehicles/cars_en (accessed on 5 September 2018).
  2. Datlinger, C.; Hirz, M. Evaluation of signal processing effects on rotor position sensor systems for electric traction systems. In Proceedings of the 15th European Automotive Congress, Madrid, Spain, 3–7 October 2017. EAEC2017_A10. [Google Scholar]
  3. Datlinger, C.; Hirz, M. Investigations of rotor shaft position sensor signal processing in electric drive train systems. In Proceedings of the IEEE Transportation Electrification Conference and Expo, Asia-Pacific (ITEC Asia-Pacific), Bangkok, Thailand, 6–9 June 2018. [Google Scholar] [CrossRef]
  4. Jinglai, W.; Jiejunyi, L.; Jiageng, R.; Nong, Z.; Walker, P.D. Efficiency comparison of electric vehicles powertrains with dual motor and single motor input. Mech. Mach. Theory 2018, 128, 569–585. [Google Scholar] [CrossRef]
  5. Pan, Z.; Yong, C.; Muyi, L.; Bin, M. Optimum Matching of Electric Vehicle Powertrain. Energy Proc. 2016, 88, 894–900. [Google Scholar] [Green Version]
  6. Gaechter, J.; Fabian, J.; Hirz, M.; Schmidhofer, A.; Lanzenberger, H. Evaluation of Angular Sensor Systems for Rotor Position Sensing of Automotive Electric Drives. In Proceedings of the 19th International Forum on Advanced Microsystems for Automotive Applications, Berlin, Germany, 7–8 July 2015. [Google Scholar]
  7. Hirz, M.; Gaechter, J. Evaluation and Modelling of Rotor Position Sensor Characteristics for Electric Traction Motors. SAE Tech. Paper 2016, 1, 1065. [Google Scholar] [CrossRef]
  8. Lenzen, C.; Sommer, P.; Wattenhofer, R. Optimal clock synchronization in networks. In Proceedings of the 7th ACM Conference on Embedded Networked Sensor Systems, SenSys’03, Berkeley, CA, USA, 4–6 November 2009; pp. 225–238. [Google Scholar] [CrossRef]
  9. Ganeriwal, S.; Kumar, R.; Srivastava, M.B. Timing-sync protocol for sensor networks. In Proceedings of the First International Conference on Embedded Networked Sensor Systems, SenSys’03, Los Angeles, CA, USA, 5–7 November 2003; pp. 138–149. [Google Scholar]
  10. Wei, N.; Guo, Q.; Li, C.; Liu, R.; Kong, L. An Event -Triggered Time Synchronization Scheme for Sensor Networks. In Proceedings of the 2008 11th IEEE International Conference on Computational Science and Engineering—Workshops, San Paulo, Brazil, 16–18 July 2008; pp. 3–7. [Google Scholar] [CrossRef]
  11. Kopetz, H.; Ochsenreiter, W. Clock Synchronization in Distributed Real-time System. IEEE Trans. Comput. 1987, C-36, 933–940. [Google Scholar] [CrossRef]
  12. Hasan, K.F.; Wang, C.; Feng, Y.; Tian, Y. Time synchronization in vehicular ad-hoc networks: A survey on theory and practice. Veh. Commun. 2018, 14, 39–51. [Google Scholar] [CrossRef]
  13. Fan, R.; Lynch, N. Gradient clock synchronization. In Proceedings of the 23rd Annual ACM Symposium on Principles of Distributed Computing, St. John’s, NL, Canada, 25–28 July 2004; pp. 320–327. [Google Scholar]
  14. Maes, K.; Reynders, E.; Rezayat, A.; De Roeck, G.; Lombaert, G. Offline synchronization of data acquisition systems using system identification. J. Sound Vibrat. 2016, 381, 264–272. [Google Scholar] [CrossRef] [Green Version]
  15. Gaechter, J. Evaluation of Rotor Position Sensor Characteristics and Impact on Control Quality of Permanent Magnet Synchronous Machines. Ph.D. Thesis, Graz University of Technology, Graz, Austria, 2017. [Google Scholar]
  16. Mitsumi, M. Basic Mechanism of Resolver. Available online: http://www.nmbitalia.it/rotation-angle-sensor-resolver-for-evhev-drive-motor/ (accessed on 10 September 2018).
  17. Resolver to Digital Conversion Using the DSADC, AP32270, Application Note V1.0; Infineon Technologies AG: Neubiberg, Germany, 2015.
  18. Dynapar Knowledge Center—Resolvers. Available online: https://www.dynapar.com/technology/encoder_basics/resolvers/ (accessed on 2 October 2018).
  19. Infineon Technologies AG. Available online: https://www.infineon.com (accessed on 12 July 2018).
  20. TriCore AURIX TC27x Microcontrollers from Infineon. Available online: https://www.pls-mc.com/tricore-aurix-tc21x-tc22x-tc23x-tc26x-tc27x-tc29x-microcontrollers-from-infineon/architecture-a-719.html (accessed on 13 July 2018).
  21. Vector. Available online: https://www.vector.com/int/en/ (accessed on 18 October 2018).
  22. The MathWorks, Inc. Available online: https://www.mathworks.com/ (accessed on 18 October 2018).
  23. JTAG Technologies. Available online: https://www.jtag.com/en (accessed on 13 July 2018).
  24. VX1000 System Components, vector.com/VX1000. Available online: https://vector.com/portal/medien/ecu_calibration/VX1000/VX1000_System_Components_Poster.pdf (accessed on 13 July 2018).
  25. Dewetron Ltd. Available online: https://www.dewetron.com (accessed on 18 October 2018).
  26. Dewesoft, d.o.o. Available online: https://dewesoft.com (accessed on 18 October 2018).
  27. Microsoft PowerPoint. Available online: https://products.office.com/en-us/powerpoint (accessed on 23 October 2018).
  28. Microsoft Excel. Available online: https://products.office.com/en-us/excel (accessed on 23 October 2018).
  29. Myers, R.H.; Montgomery, D.C.; Anderson-Cook, C.M. Response Surface Methodology: Process and Product Optimization Using Designed Experiments; Wiley Series in Probability and Statistics; Wiley: Hoboken, NJ, USA, 2009; ISBN 9780470174463. [Google Scholar]
  30. Siebertz, K.; van Bebber, D.; Hochkirchen, T. Statistische Versuchsplanung—Design of Experiments (DoE); Springer: Berlin/Heidelberg, Germany, 2010; ISBN 9780470174463. [Google Scholar]
Figure 1. State-of-the-art electric drive train system containing four main components: the powertrain battery (high voltage), an electronic control unit, the three-phase electric motor and the rotor position sensor (e.g., resolver) [2,3,4,5,6,7].
Electronics 08 00077 g001
Figure 2. (left): sensor test bench system overview; (right): sensor test bench and relevant components: 1: electric drive; 2: reference sensor; 3: device under test (DUT, resolver); 4: specific temperature chamber (removed for demonstration-see dashed box); 5: data acquisition housing (incl. electromagnetic compatibility (EMC) shielding); 6: motorized positioning actuators; 7: electronic control unit (ECU); 8: controlled and fixed power supply; 9: climatic chamber (temperature conditioning); 10: thermal tubes (for thermal transfer).
Electronics 08 00077 g002
Figure 3. Working principle of a resolver with coil arrangement and amplitude modulated feedback signals [19].
Electronics 08 00077 g003
Figure 4. Resolver signals (carrier and feedback signals), as well as the desired envelope feedback signals [2,19].
Electronics 08 00077 g004
Figure 5. Position determination based on the demodulated, envelope resolver feedback signals.
Electronics 08 00077 g005
Figure 6. Detailed electric drive control architecture for closed loop control.
Electronics 08 00077 g006
Figure 7. Resolver-to-digital converter (RDC) in the used AURIX TriCore µC consisting of the two main timing events (DSADC Event and App Event). Carrier generator providing a pulse-width modulation (PWM) signal containing the excitation signal information, excitation unit (here an operational amplifier), resolver and delta-sigma-analog-to-digital-converter (DSADC) are operating at fDSADC Event = 9.765 kHz, while the software for angle calculation is operating at fApp Event = 9 kHz. The timing behavior of both events and a possible time overtake by the DSADC Event can be seen in the right diagram, where tsn represents the time stamp difference between each related event.
Electronics 08 00077 g007
Figure 8. Simplified connection and data flow overview of the ECU measurement tool chain [24]. The information of the measured values is read out from the target ECU (AURIX µC) and sent via a specific adapter that is suitable for the µC to a serial POD. The POD itself is connected by a serial cable with the base module. Using a dedicated software tool (CANape), the information measured by the ECU can be captured and processed for further investigations.
Electronics 08 00077 g008
Figure 9. Scheme of synchronizing the system-under-test and the reference system in the presented approach.
Electronics 08 00077 g009
Figure 10. Detailed overview of the test setup including the electrical synchronization trigger.
Electronics 08 00077 g010
Figure 11. Exemplary measurement scenario of the reference sensor at a certain, constant angular velocity showing the µC trigger signal (AURIX Trigger) in orange color, the internal detected rising edge of the trigger signal in green color and the reference angle including the theoretical possible triggered reference position readout in magenta.
Electronics 08 00077 g011
Figure 12. Test setup on the test bench using the electric drive (1), the reference sensor (2) and the DUT (3). The data acquisition is done by the ECU (5) where the POD (6) is polling the measured data. For evaluation of the synchronization approach, the mentioned trigger signal (7) is connected with the reference break-out box (8).
Electronics 08 00077 g012
Figure 13. Overview of the measurement process. (a) Readout of the sensor data including sensor data acquisition, capturing and storing (online). The figure also illustrates the information flow and the developed offline sensor data post processing algorithm. (b) Further potential offline characterization after the offline processing algorithm.
Electronics 08 00077 g013
Figure 14. Exemplary original counter variable PosTimestampPWM (blue) and wrap-around removed time base for further evaluation over the whole measurement recording time (New PWM timebase). It can be seen that the variable PosTimestampPWM has a certain starting time due to the booting of the µC and the wrap-around, caused by the overflow of the counting process. The variable PosTimestampDSADC evince the same behavior.
Electronics 08 00077 g014
Figure 15. Angular correction method of the resolver angle under consideration of lagging DSADC timestamp. Shown here are both sensor angular outputs over time (top: reference sensor, bottom: resolver) and the compensated DUT angle.
Electronics 08 00077 g015
Figure 16. Scope image of the triggered reference sensor acquisition at a constant speed of n = 100 rpm, capturing the mechanical reference angular position (blue), the µC trigger with a frequency of fµC Trigger = 9 kHz (green) and the rising edge of the trigger signal (cyan), detected by the reference acquisition FPGA.
Electronics 08 00077 g016
Figure 17. Raw resolver signals, sampled by the DSADC of the ECU. The upper plot (magenta curve) shows the channel 1 of the DSADC: the raw, demodulated sine signal with a sampling frequency of fs = 9.765 kHz. The lower plot (black curve) shows the result of the channel 2 of the DSADC: the raw, demodulated cosine signal with the same sampling frequency fs = 9.765 kHz. It has to be stated that the time base for both signals is the continuous DSADC time base with the removed wrap-around (see example Figure 14) in the µC basic unit time ticks (10 ns).
Electronics 08 00077 g017
Figure 18. Resulting resolver sensor signal normalization and offset compensation from the offline post processing. The upper plot (magenta curve) shows the normalized and symmetrical sine feedback signal, while the lower plot (black curve) shows the normalized and symmetrical cosine resolver feedback signal on the introduced continuous DSADC time base in µC time ticks (10 ns).
Electronics 08 00077 g018
Figure 19. Determined DUT resolver angle based on the normalized, symmetric sine and cosine signals (Figure 18) represented in the µC time base (10 ns).
Electronics 08 00077 g019
Figure 20. Resulting panels. (a) Merged result of the offline post processing method containing the electrical reference angle (red curve), electrical DUT resolver angle (black curve) as well as normalized and symmetrical sine (magenta) and cosine (cyan) DUT resolver feedback signals. Last two signals enable a sensor signal quality analysis. (b) Potential characterization output providing FNL angle error analysis as a subtraction of reference and DUT angle.
Electronics 08 00077 g020
Figure 21. Result of the DoE sensor characterization based on the post processing signals (triggered reference angle and determined and compensated DUT resolver angle): (a) diagram representing the electrical angle error (peak–peak) in degrees over the five parameter variations Δx, Δy, Δz, Δϕ and Δn; (b) comparison of measurement and full quadratic model at the design points of the exemplary Central Composite Inscribed (CCI) design.
Electronics 08 00077 g021
Table 1. Exemplary table of the automatically calculated evaluation parameters, supporting angle error tolerances evaluation.
Number of MeasurementAngle Error Peak-Peak (el.) [°]Angle Error Max. (el.) [°]Angle Error Min. (el.) [°]
2023.042923.14260.0997
2116.489716.50480.0151
2217.811217.89630.0851
2314.873014.88230.0092
2416.980617.00820.0276
251.28521.28530.0001
2629.600629.81620.2157
2716.238416.28610.0477
2813.849613.93620.0866
2913.950214.13160.1814
3013.053213.07750.0243
3112.872813.48810.6153
3213.503013.69150.1885
3313.134113.19920.0651
3412.729412.74180.0124
3515.207515.29470.0872
3616.631417.63221.0008