Article

Comparing Accuracy of Three Methods Based on the GIS Environment for Determining Winching Areas

1
Department of Agriculture and Forest Sciences (DAFNE), Tuscia University, 05010 Viterbo, Italy
2
Department of Forest Utilisation, Faculty of Forestry, Poznań University of Life Sciences, 60-625 Poznań, Poland
3
Wood Science and Application Department, Wood Technology Institute, 60-654 Poznań, Poland
4
Umbria Region, Service: Forests, Mountain, Natural Systems; Section: Forest Conservation and Rural Infrastructures, 06121 Perugia, Italy
*
Author to whom correspondence should be addressed.
Electronics 2019, 8(1), 53; https://doi.org/10.3390/electronics8010053
Submission received: 21 November 2018 / Revised: 15 December 2018 / Accepted: 26 December 2018 / Published: 2 January 2019
(This article belongs to the Section Microwave and Wireless Communications)

Abstract

:
In forestry interventions such as thinning or selection cutting, appropriate road and skid trail networks are essential for efficient forest operations, but also for limiting damage to the residual stand and soil. Recently, multiple studies have shown the advantage of precision forestry and the use of a geographic information system (GIS) in forest road network planning, replacing time-consuming manual measurements and skid trail design directly in the forest. The objective of this research was to test the accuracy of three GIS-based methods, the correct distance method (CDM), real distance buffer method 12 (RDBM12) and real distance buffer method 10 (RDBM10), in estimating the area accessible for winching along skid trails. The study was carried out in two mountain areas, Fibbino and San Martino al Cimino (Italy). All the methods for determining the winching area were based on GIS and digital terrain model (DTM) maps. Additionally, control distances were measured manually in both areas and the results were compared with the distances measured using the GIS methods. The initial results showed that all the methods were useful for determining the winching area in mountain conditions. However, in conclusion, the CDM and RDBM10 methods were more accurate and can be recommended for further use and development.

1. Introduction

One of the prerequisites of sustainable forest management (SFM) is to minimise the negative impact of harvesting on the environment without limiting work productivity [1,2,3]. A well-designed network of forest roads can contribute to this, especially when precision forestry is applied [4,5,6,7,8,9,10]. Multifunctional forestry is strictly related to a forest road network guaranteeing access to silvicultural and operational activities, as well as to other social functions, including tourist activities [3,6,11,12,13,14,15]. From an economic point of view, the efficiency of forest operations depends on appropriate road density and distribution [16,17]. Moreover, a well-designed and properly established forest road network guarantees a low impact on the environment when extracting or transporting timber [2,18,19,20,21,22].
In forestry interventions such as thinning or selection cutting, an appropriate road network is important in order to limit damage to the residual stand, to restrict the area of disturbed soil and to optimize productivity [2,17,20,23]. In other kinds of interventions, such as coppicing or clear cutting, a limited road network does not guarantee a low impact on the environment after harvesting [24].
The planning of low impact skidding operations can be done by selecting suitable equipment, as well as choosing an appropriate harvest time and location [22]. In particular, it is important to ensure cost-effective utilisation but with respect to environmental issues, for example, by limiting the frequency of forest penetration by machines and constructing new branches of strip roads only when it is really necessary [6]. In recent years, multiple studies have shown the advantage of precision forestry and the use of a geographic information system (GIS) in forest road network analysis and planning. Enache et al. [13] developed a GIS method for evaluating different forest road options before implementing the design in the forest. The method allowed the assessment of forest infrastructure scenarios based on multicriteria analyses (i.e., forest management, costs, environmental and hydrogeological protection, social interests such as tourism, and wildfire extinction) bearing in mind stakeholders’ interests, as well as economic, ecological and social aspects.
Enache et al. [4] used GIS in a private forest in Romania to calculate the mean extraction distance and its correction factor, taking slope into consideration. This study showed the efficiency of different GIS methods in determining the mean extraction distance for more efficient forest harvesting.
Laschi et al. [6] proposed a classification into accessible, barely accessible and inaccessible areas of a forest estate in Northern Italy. This classification was based upon the concept of “access time”, that is, the time required for a forest worker to make a round trip on foot from the nearest road to a given point in the forest.
Gumus et al. [5] developed a GIS model to design a new skid trail pattern in order to improve farm tractors skidding in a Turkish forest estate. The authors made a comparison between the existing skid trail pattern and a simulated network of skid trails. The latter showed a 16.84% increase in the efficiency of time consumption and a reduction in road density from 281 m/ha to 187 m/ha. Caliskan and Karahalil [25] used GIS to classify Anbardag forest in Turkey analysing different extraction systems (i.e., cable crane, forest tractor, agricultural tractor, and sledge yarder), taking into consideration slope and distance from the road network. This work made it possible to obtain a classification of forest areas in order to plan more efficient forest operations, which would not be possible without the application of GIS. Picchio et al. [26] developed a GIS model to classify two forest estates in Central Italy into areas which were accessible or inaccessible for extraction by tractor with a winch and/or lightweight cable yarder. Based on this classification, a proposal for improving the forest road network was made using GIS. A good correlation was obtained between the model validation and the actual accessibility in the forest areas.
In the above-mentioned work, the study area included entire forest estates, usually hundreds or thousands of hectares. The innovative aspect of the study proposed in this paper is that it is the first attempt to use precision forestry in a more accurate analysis and planning of a forest road network on a relatively small area (ca. 20–60 ha).
The objectives of this study were to: (1) apply GIS-based methods to determine accessible areas for winching in mountain conditions, and (2) discover the accuracy of GIS-based methods. Initially, two existing methods were tested to determine the accessible area for skidding, as well as their accuracy: the correct distance method (CDM) and real distance buffer method 12 (RDBM12). Eventually, a third method, the real distance buffer method 10 (RDBM10), was developed based on RDBM12 and this was also used in the study.
The evaluation of the above-mentioned methods to qualify the extraction area involved four stages. The first one was testing the possibility of using a modern mini portable GPS (Global Positioning System)—an electronic device for the collection of reference points to mark forest roads on a map. The second step consisted of importing data within an open-source GIS to implement digital models: a digital elevation model (DEM) and digital terrain model (DTM). The third one was applying three different methods (CDM, RDBM12 and RDBM10) and marking the areas accessible for winching. The last step consisted of manual data collection in the forests (the measurement of distances) in order to check the accuracy of the above-mentioned methods.

2. Materials and Methods

2.1. Study Areas

2.1.1. Fibbino

The study area is located in Piegaro district in the Province of Perugia, within a State property managed by the Regional Forest Agency (AFoR). The total area of the study area is 20.02 ha, 12 ha characterised by the presence of a Pinus nigra Arn. high stand and 8 ha of high stands of Quercus pubescens Willd., Quercus cerris L. and Fraxinus ornus L. descending from old coppice conversion (Figure 1). This classification was taken from the Forest Management Plan of the property.
The prevalent elevation is 425 m a.s.l. with a maximum elevation of 505 m a.s.l. and a minimum of 385 m a.s.l., with the prevalent exposition towards the South/South-East. Slope degree is between 26% (II Class) and 70% (IV Class) (Figure 1).

2.1.2. San Martino al Cimino

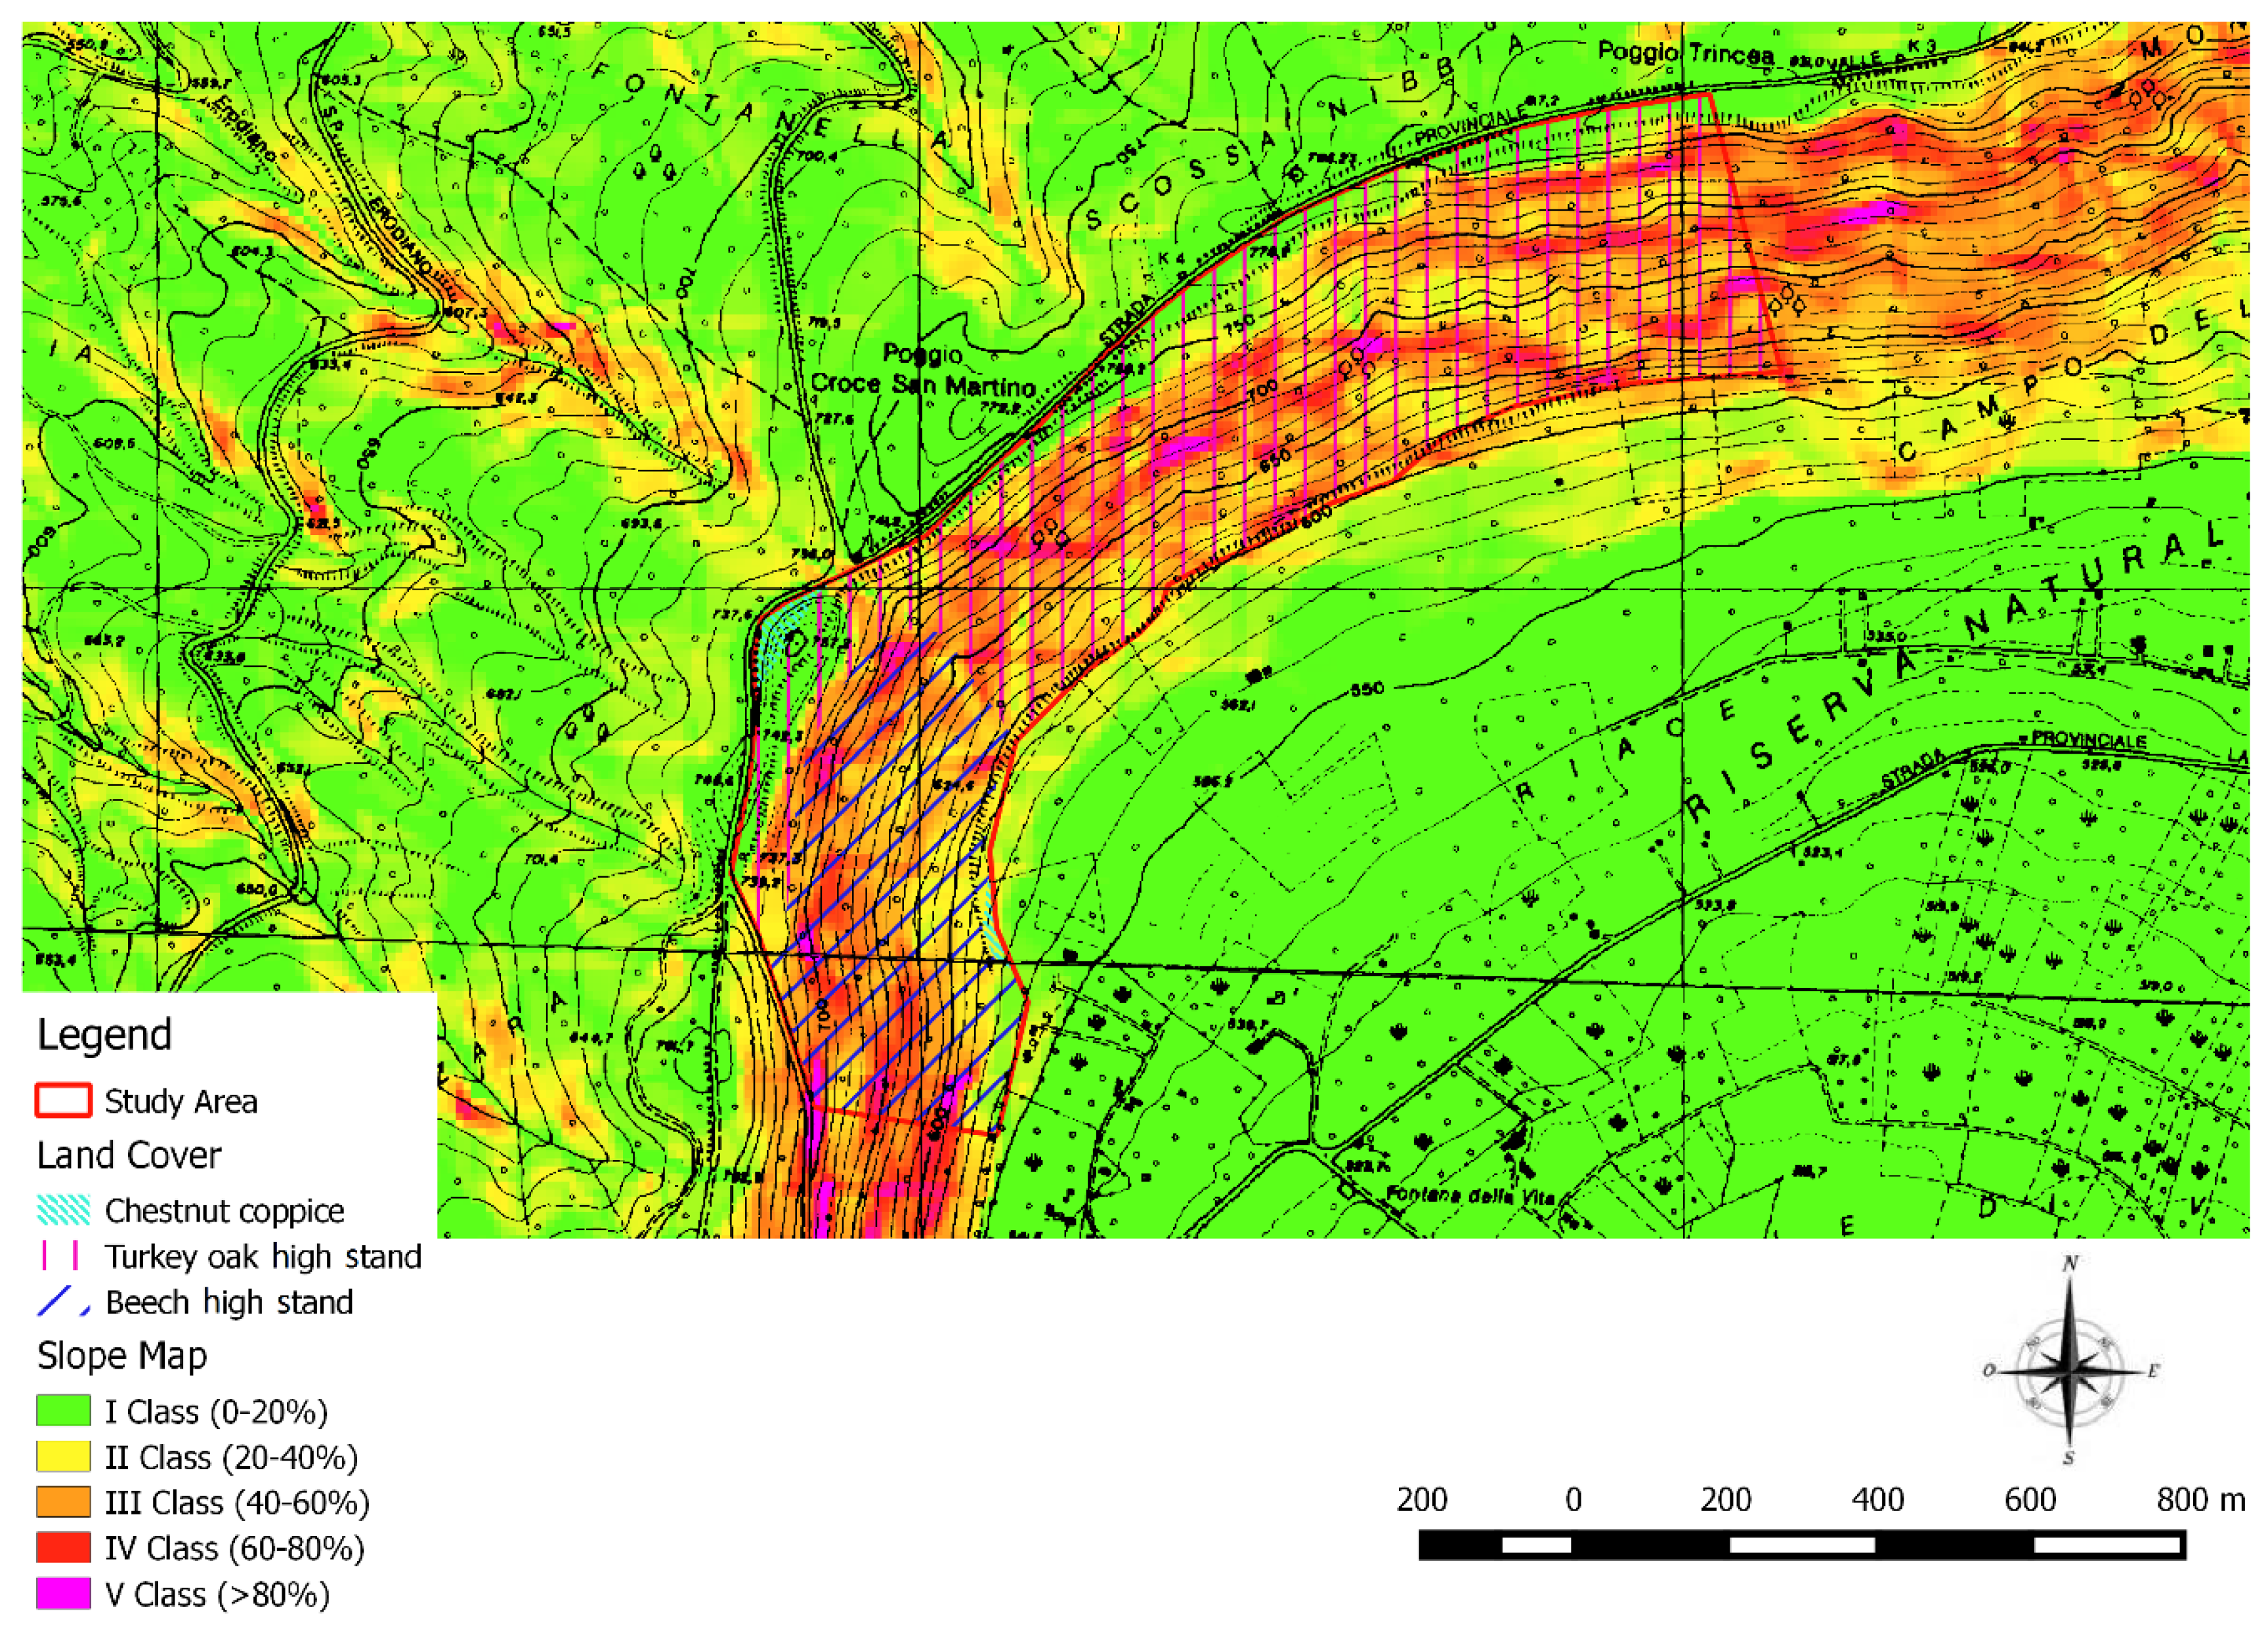
The second study area is located in Viterbo District in the Province of Viterbo, within a State property managed by the local district. The total study area is 61.60 ha. According to the property’s Forest Management Plan 44.32 ha is covered by Quercus cerris L. high stand, 16.35 ha by a high stand of Fagus sylvatica. L and a little portion, approximately 0.9 ha, by chestnut (Castanea sativa Mill.) coppices (Figure 2).
The prevalent elevation is 700 m a.s.l. and varies from 580 m to 783 m a.s.l., mainly exposed towards the South and South-East. The mean slope degree is 52% (III Class) with a maximum of 120% (V Class) (Figure 2).

2.2. Preliminary Field Reliefs

All the forest roads present in both study areas were detected using a GNSS system while on an all-terrain vehicle. A Trimble Juno Sb handheld data collector was used, measuring 12.9 cm × 7.4 cm × 3.0 cm, weighing 0.23 kg with the battery, and allowing for GPS measurements on an L1 frequency. The Trimble Juno Sb was powered by the Windows Mobile 6.1 operating system and a 533 MHz Samsung S3C3443 processor. According to the manufacturer’s information, a real-time accuracy of 2 to 5 m was possible thanks to the integrated SBAS receiver. Subsequent postprocessing of the data using Trimble Delta Phase technology made it possible to reach 1–3 m positional accuracy [27]. However, for the aims of this study, postprocessing the data was not necessary, therefore the field data showed a positional accuracy of 2–5 m. After data collection, all the roads were classified according to Italian standards [6] for the forest roads (Table 1).
Data characterising the relief were collected and recorded by the GIS software—the open-source software Quantum GIS 2.18 “Las Palmas” [28] allowing the creation of the lines and the shapefile of the forest floor. All the GIS elaborations were geo-referenced in WGS84-UTM33T. In the shapefile attribute tables, both the classification and length of each road were reported.

2.3. GIS Implementation

Initially, two basic GIS methods, the correct distance method (CDM) and real distance buffer method (RDBM) were implemented in order to define areas as “accessible” and “inaccessible” in relation to the existing forest road network. This classification was applied in respect to the Tree-Length-System (TLS) and skidding with a farm tractor altered to suit forest conditions and equipped with a forest winch. The pre-defined extraction distance was 80 m uphill and 40 m downhill. In both methods, the extraction distance was the orographical distance, i.e., the real distance measured along the slope. In both methods, implementation started from a 10-m pixel DTM [29,30]. The first method CDM was developed by Pentek et al. [31] and further evolved by Enache et al. [4]. The second method RDBM was developed by Picchio et al. [26].

2.3.1. Correct Distance Method (CDM)

CDM requires the forest road network file in raster format and uses the QGIS tool “r.grow.distance” to create a raster layer in which the distance from the forest roads is reported, the so-called “distance map”. This raster map is corrected according to slope and then reclassified in order to identify accessible areas for winching.

2.3.2. Real Distance Buffer Method (RDBM)

In contrast, RDBM starts from a vector file of the forest road network and makes use of the QGIS tool “r.cost” to create the “distance map”. This map, which is in raster format as in CDM, is corrected according to the slope and finally reclassified to identify accessible areas for winching.
Eventually RDBM was used as two separate ones: (1) RDBM12, with a d0 of 12.07 m, and (2) RDBM10, with a d0 of 10 m, corresponding to the side of the pixel. RDBM12 was the original method [26] and RDBM10 was an implementation developed in the present work after a comparison and validation of the two initial methods: CDM and RDBM12.

2.4. Field Relief for Method Evaluation and Statistical Analysis

In order to check the accuracy of the final three methods, 40 control points were identified in Fibbino and 58 on San Martino al Cimino. The real shortest distance from the road to each point was measured using the Trimble Juno Sb GPS and measuring tape. Furthermore, the distances obtained were evaluated on Statistica. 7.0 spreadsheets. In addition, scatterplot analysis, t-test and one-way ANOVA were used to find out if there were statistically significant differences between the set of distances obtained with the two GIS methods and in manual measurements. For these comparisons, factorial ANOVA was used in order to analyse the percentage error in relation to the field relief.

3. Results

3.1. Accessible Areas

3.1.1. Fibbino

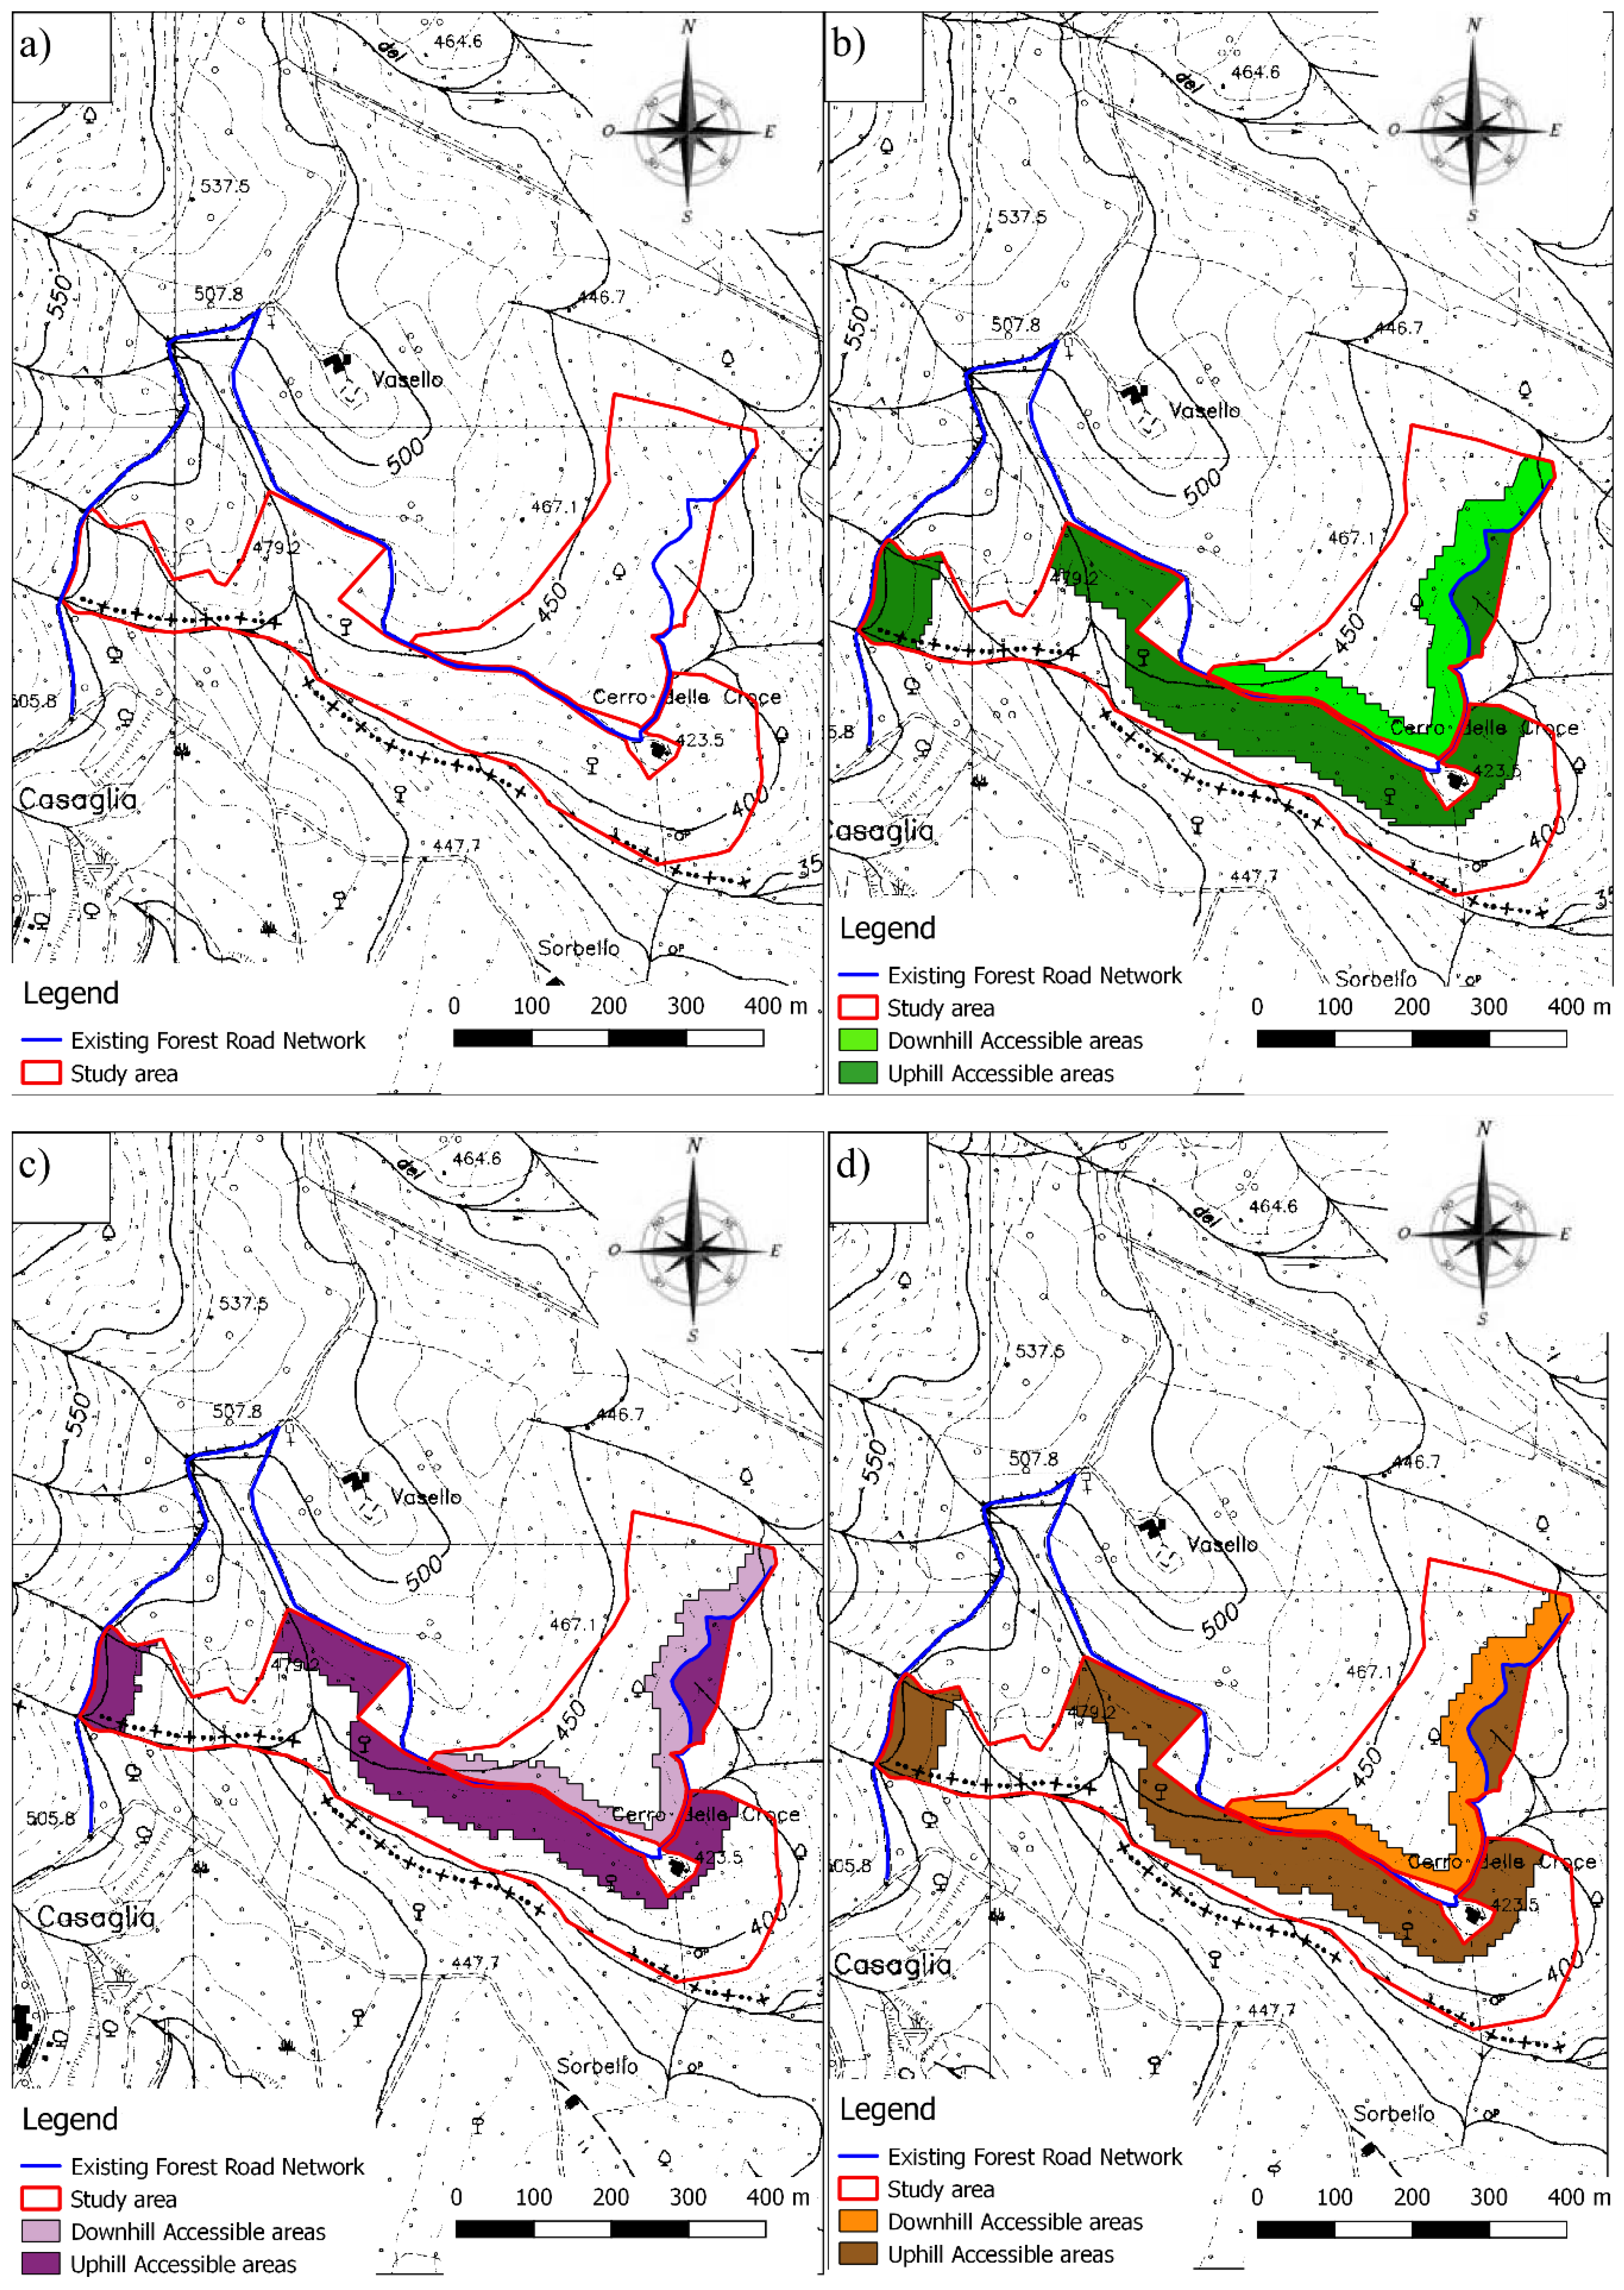
In Fibbino, the road density (Figure 3a) amounted to 102 m ha−1. In particular, 2048 m of the forest roads were present and all of these roads were classified as secondary roads for trucks (Table 2).
According to CDM, the accessible areas for winching totalled 9.9 ha, corresponding to 49% of the total surface of intervention (Table 3 and Figure 3b). In particular, 7.06 ha of the area could be used for uphill winching, with 2.84 ha for downhill winching. RDBM12 estimated 7.69 ha of accessible areas, 5.47 and 2.22 ha for uphill and downhill extraction, respectively (Figure 3c). RDBM10 showed that 9.13 ha were accessible, 46% of the total surface (Figure 3d). About 73% of the area qualified for uphill winching (6.66 ha) and 27% (2.47 ha) for downhill.

3.1.2. San Martino al Cimino

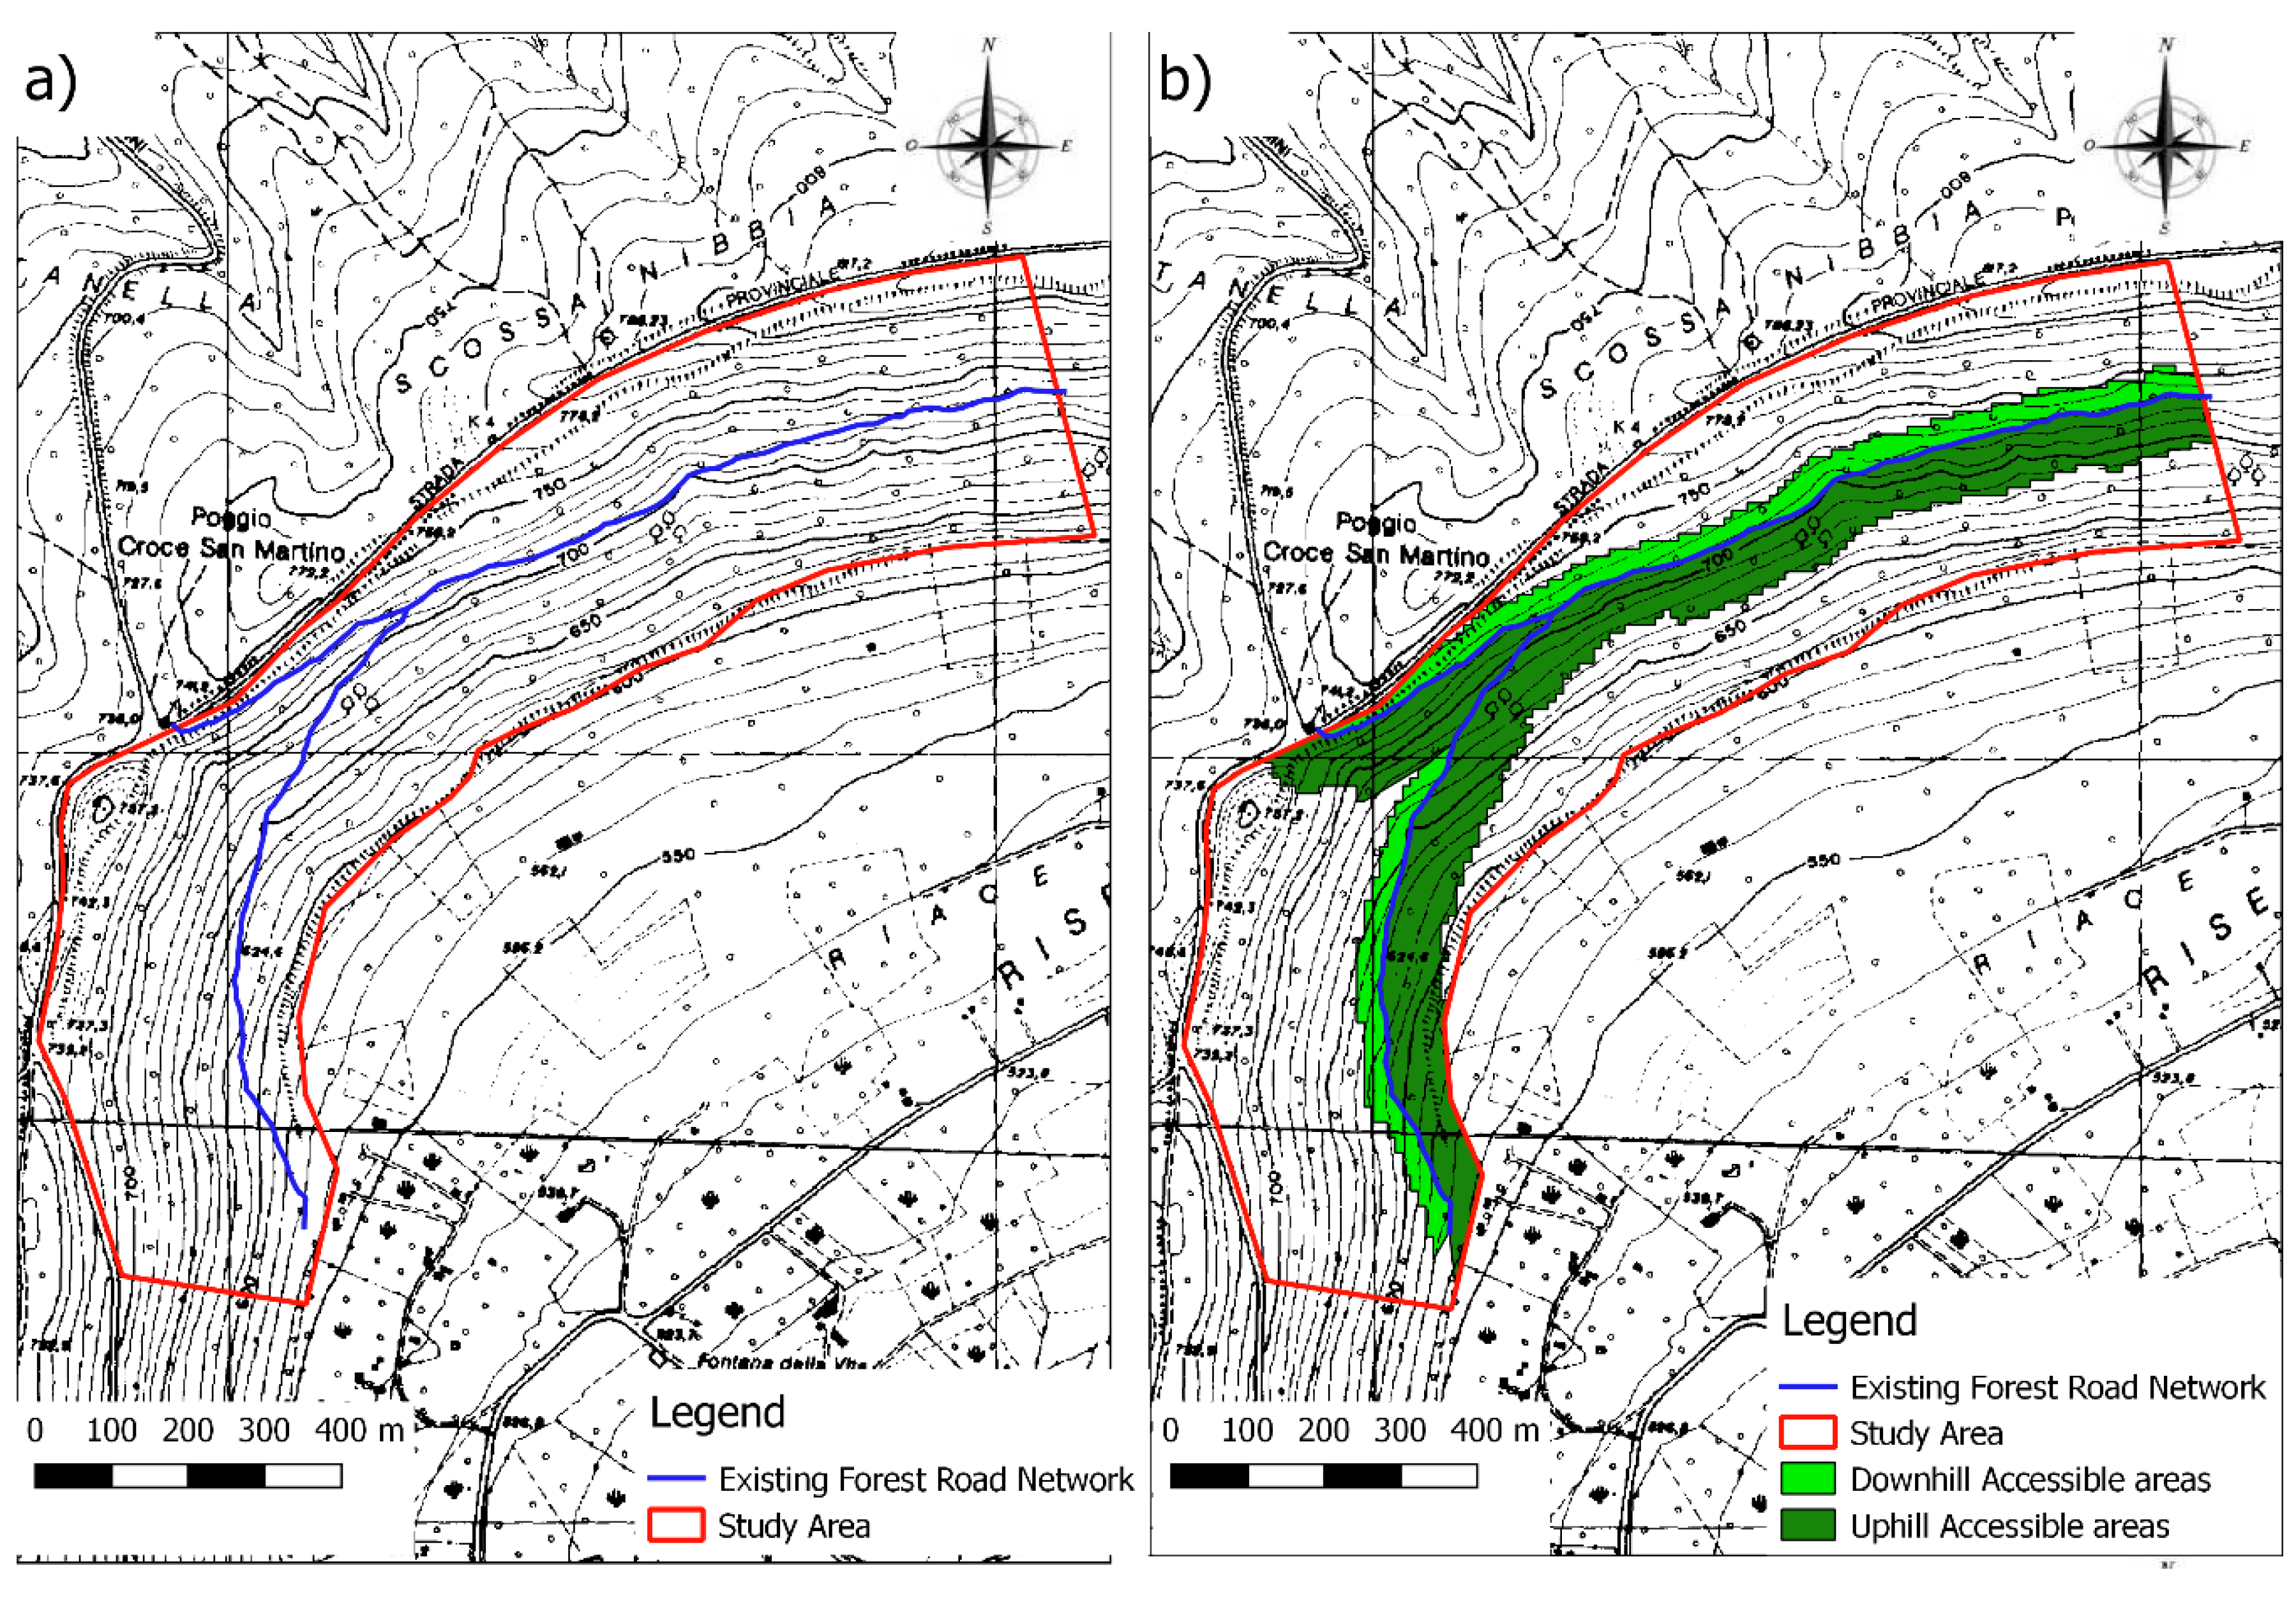
Road density in San Martino al Cimino amounted to 54 m ha−1 and all the roads were classified as skid trails (Table 2 and Figure 4a). In total, 3300 m of forest roads were present with an average width of 3.5 m and average slope of 12% (Table 2).
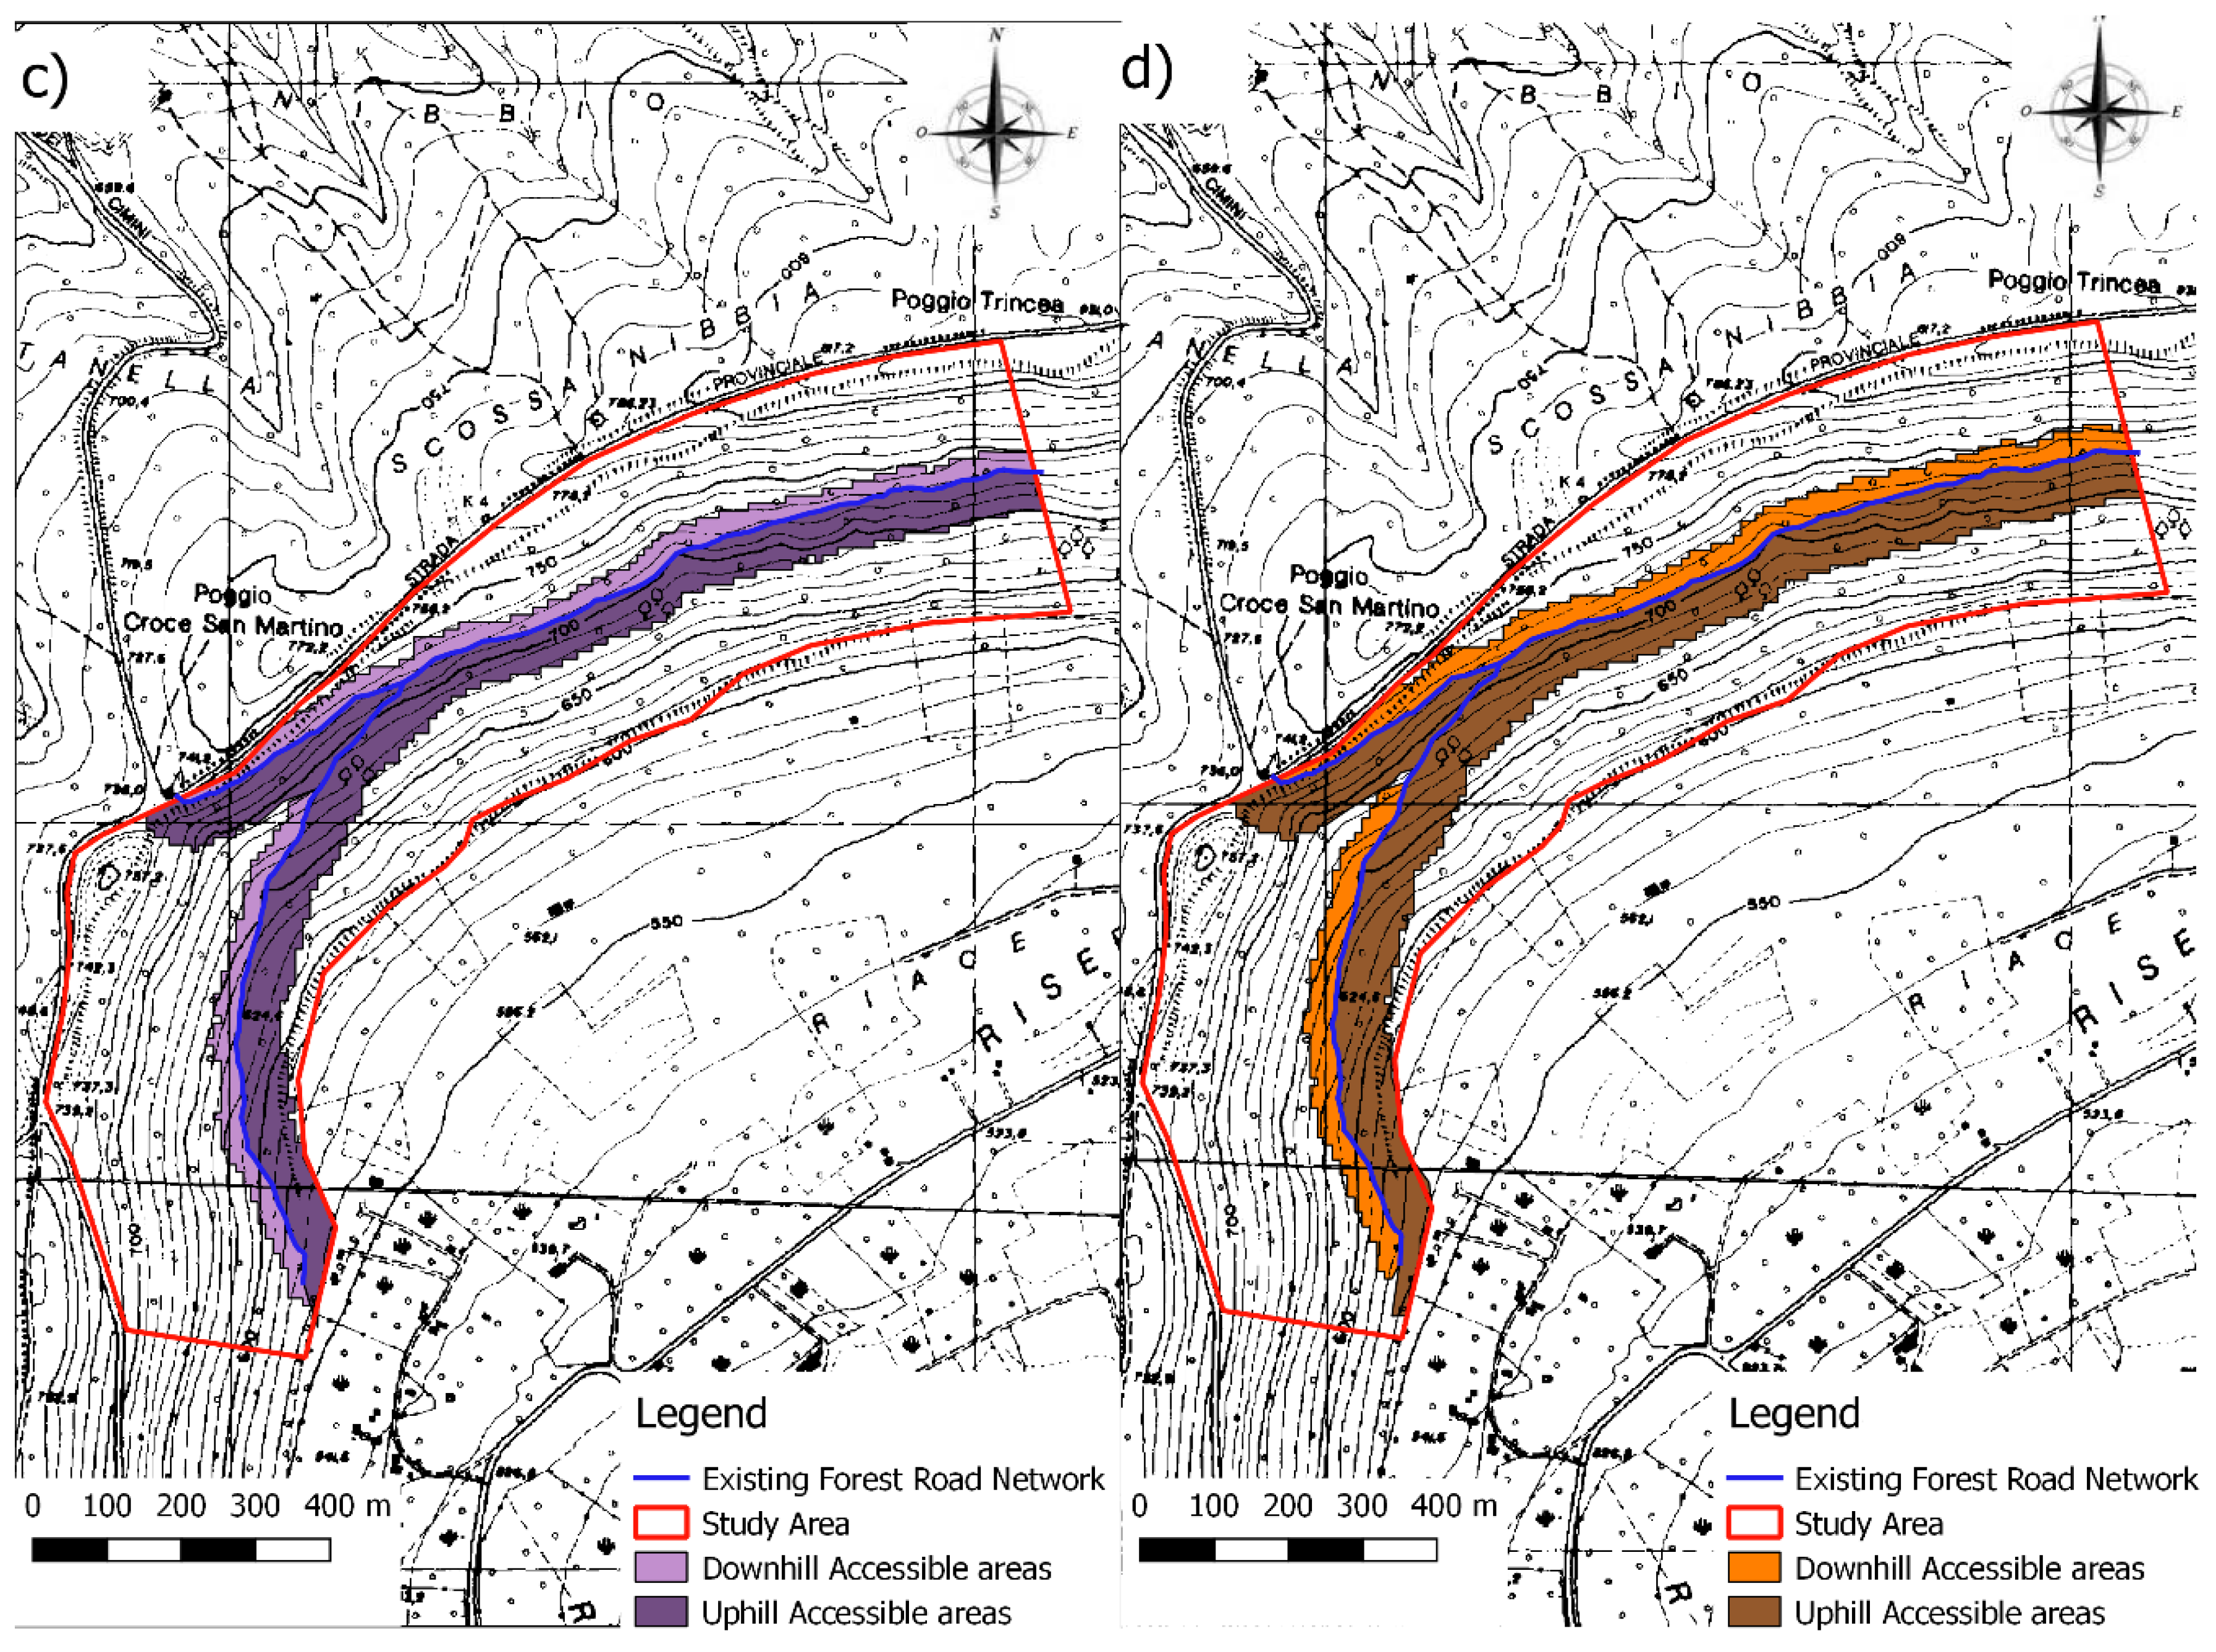
According to CDM, 21.32 ha were accessible for winching, 35% of the total surface (Table 3 and Figure 4b). In particular, 15.15 and 6.17 ha were accessible for uphill and downhill winching, respectively. RDBM12 and RDBM10 estimated that 17.64 and 20.22 ha were accessible, respectively (Table 3 and Figure 4c,d).

3.2. Field Test

3.2.1. Fibbino

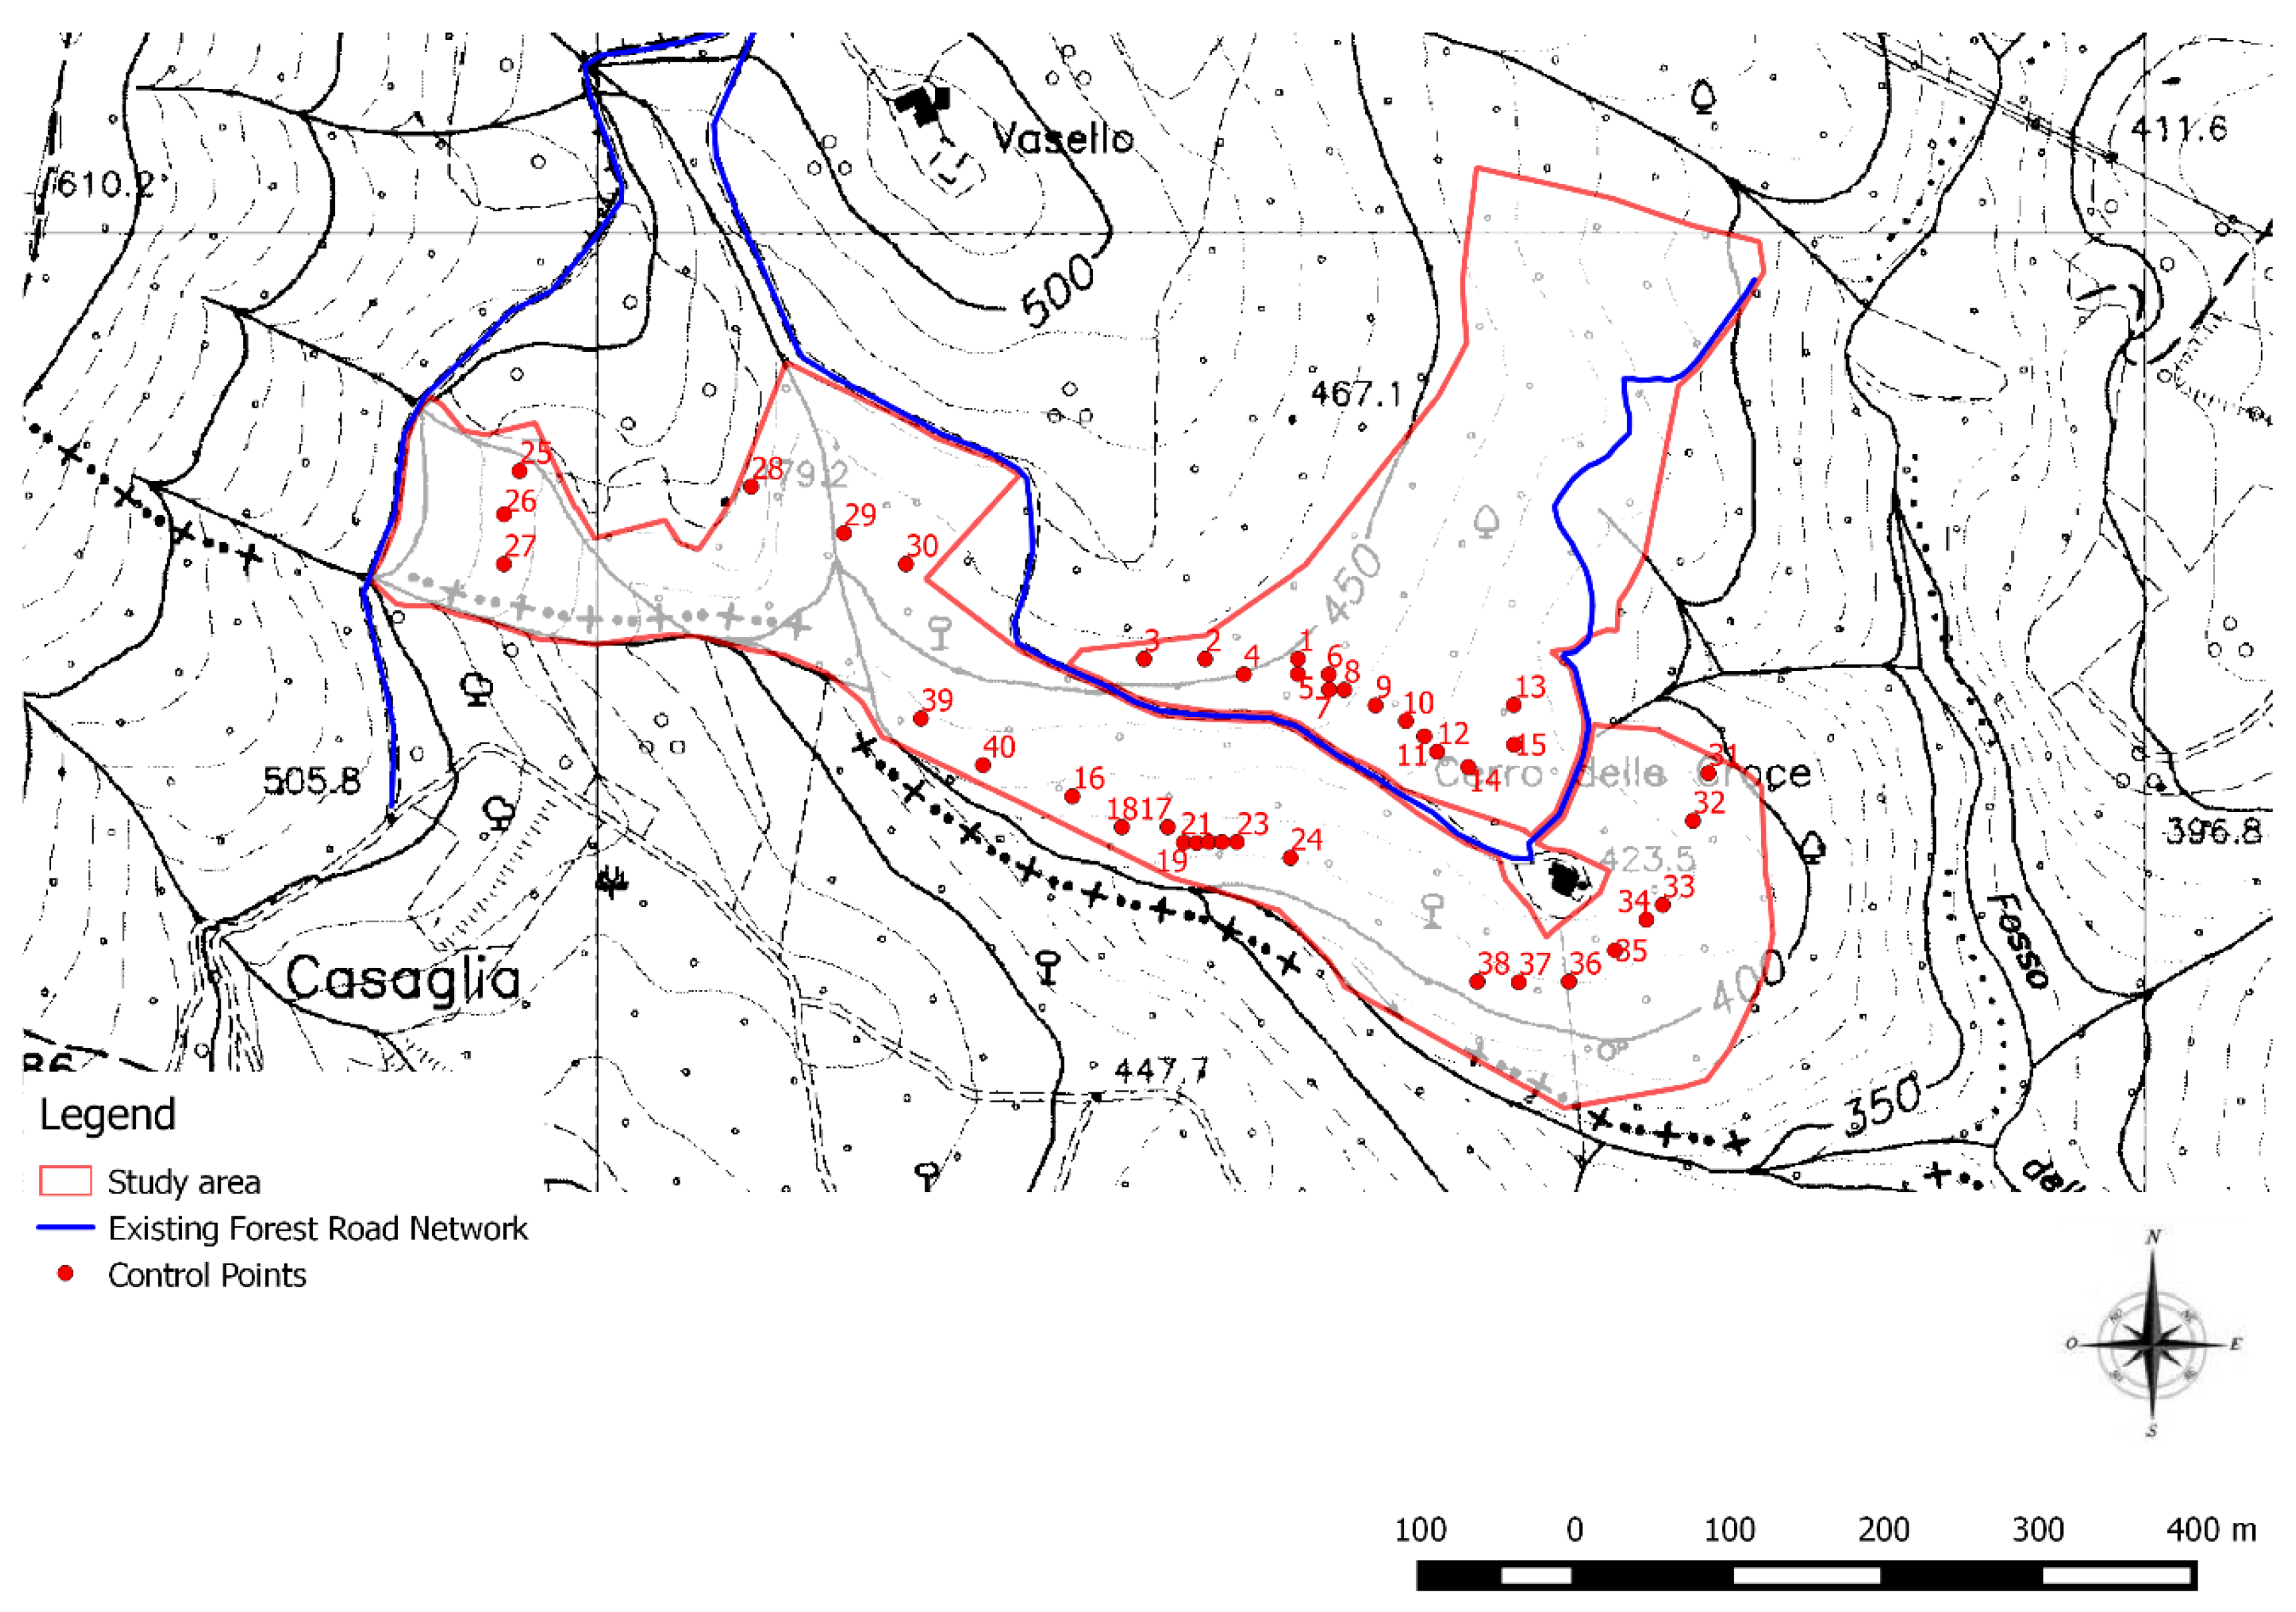
For the field tests in Fibbino, 40 control points were selected (Figure 5). Between each point and skid trail, the shortest distance was measured using tape and the results were juxtaposed with the distances measured using the CDM and both RDBM methods (Table 4).
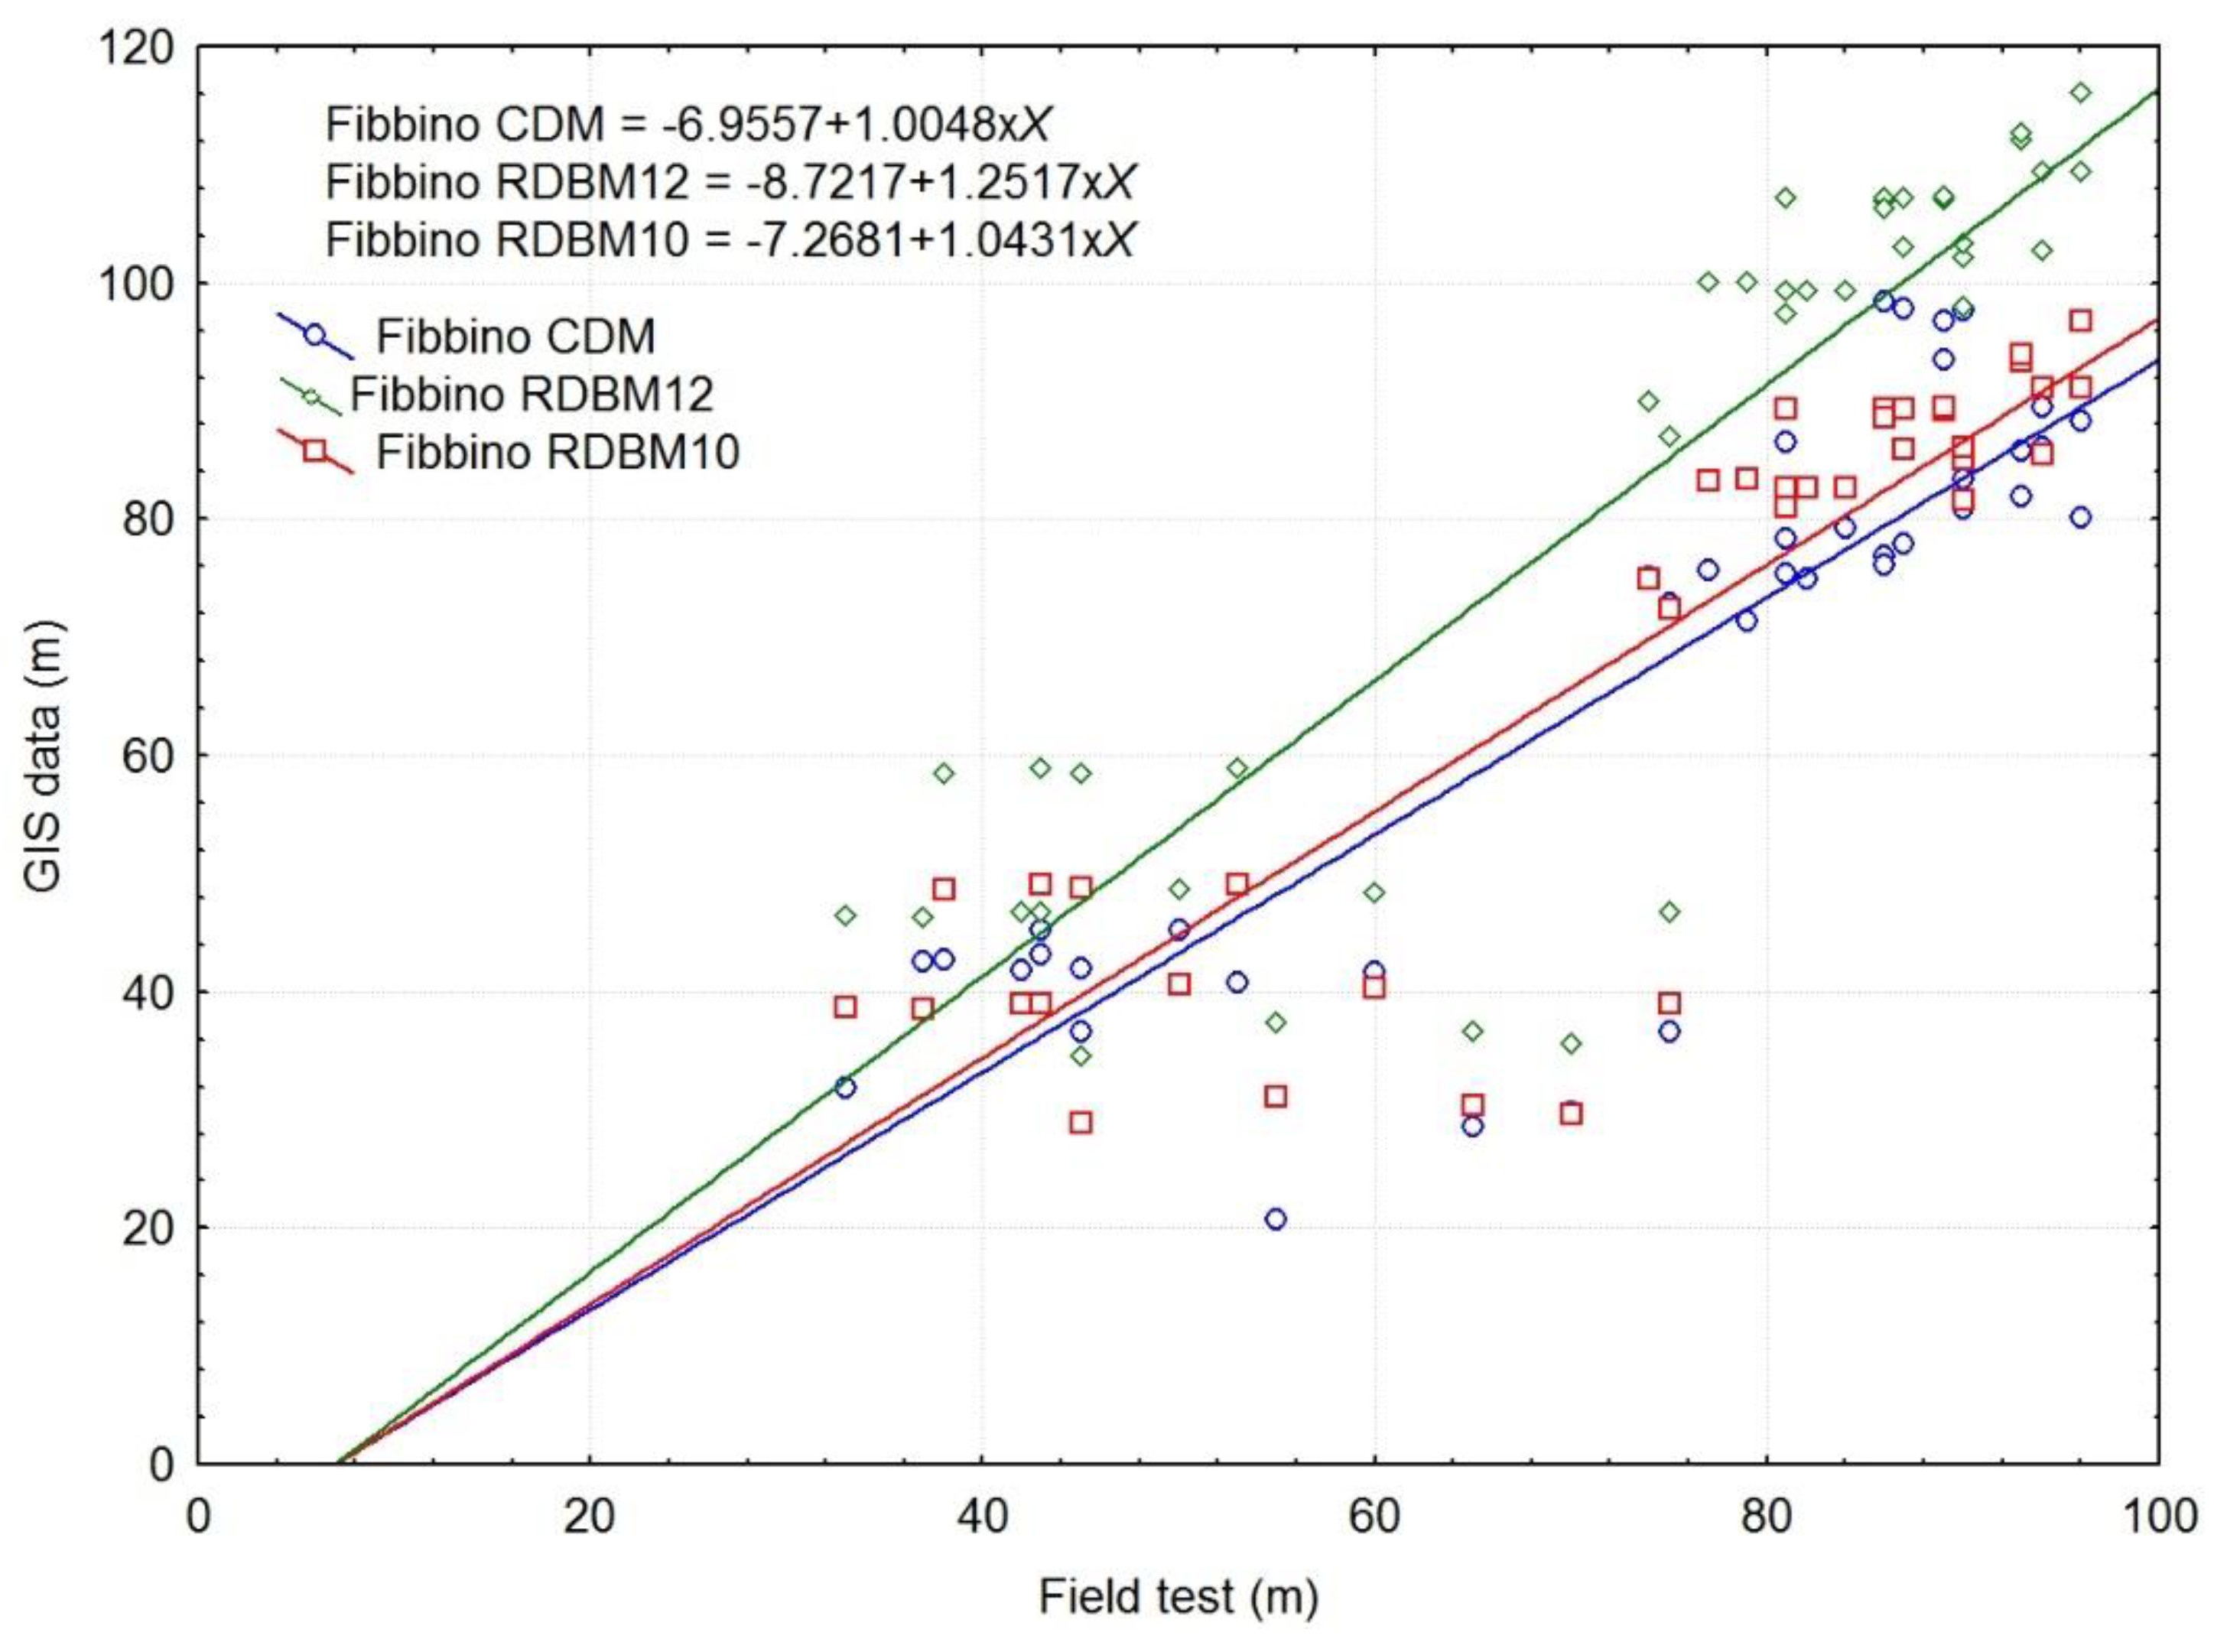
The scatterplot analysis (Figure 6) showed high values of R for the three GIS methods and the equations showed a similar constant error for the three methods (ranging from 6.9 to 8.7) and a different level of variable errors. In particular, for the two GIS methods, CDM and RDBM10, the variable error was close to 1.0 (almost negligible), while it was somewhat greater for the RDBM12 (ca. 1.3).
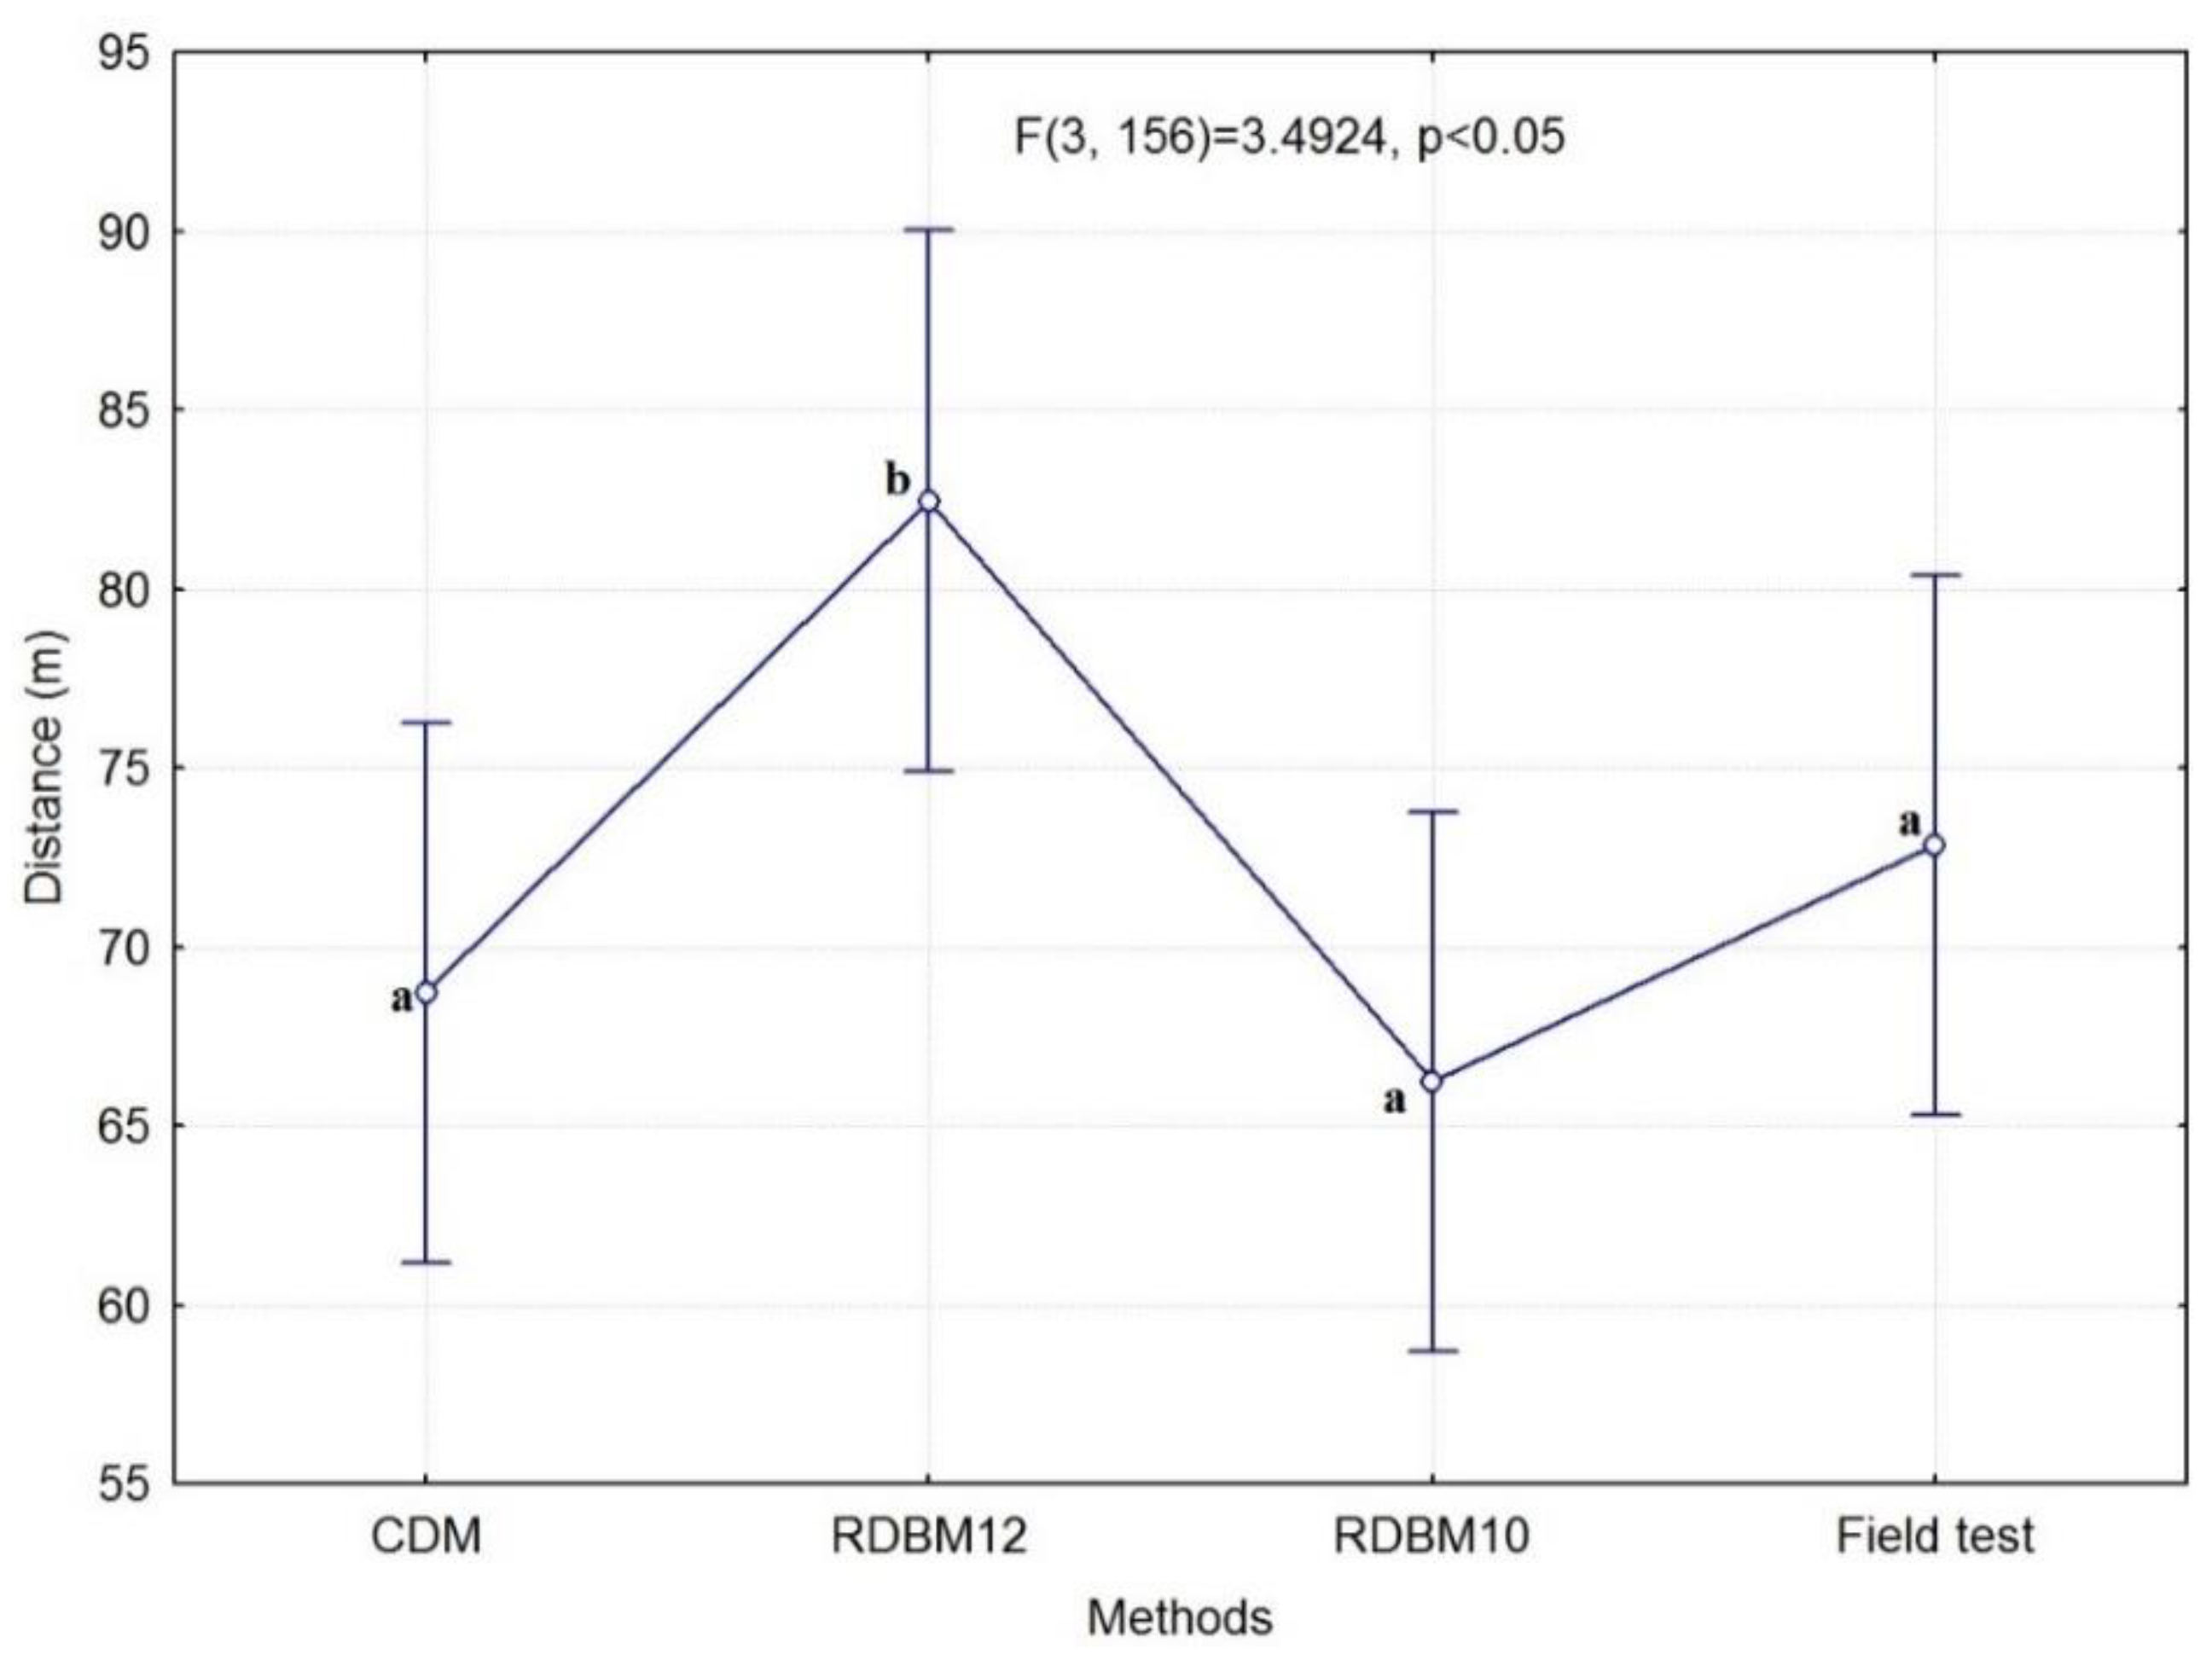
From the statistical analysis, there were no significant differences between RBDM10, CDM and the field test measurements (Figure 7). RBDM10 gave the closest distance values to those obtained in the field (Figure 7). Only RDBM12 was different (statistically significant and with an overestimation of the distance value) from CDM, RDBM10 and the field test (Figure 7).

3.2.2. San Martino al Cimino

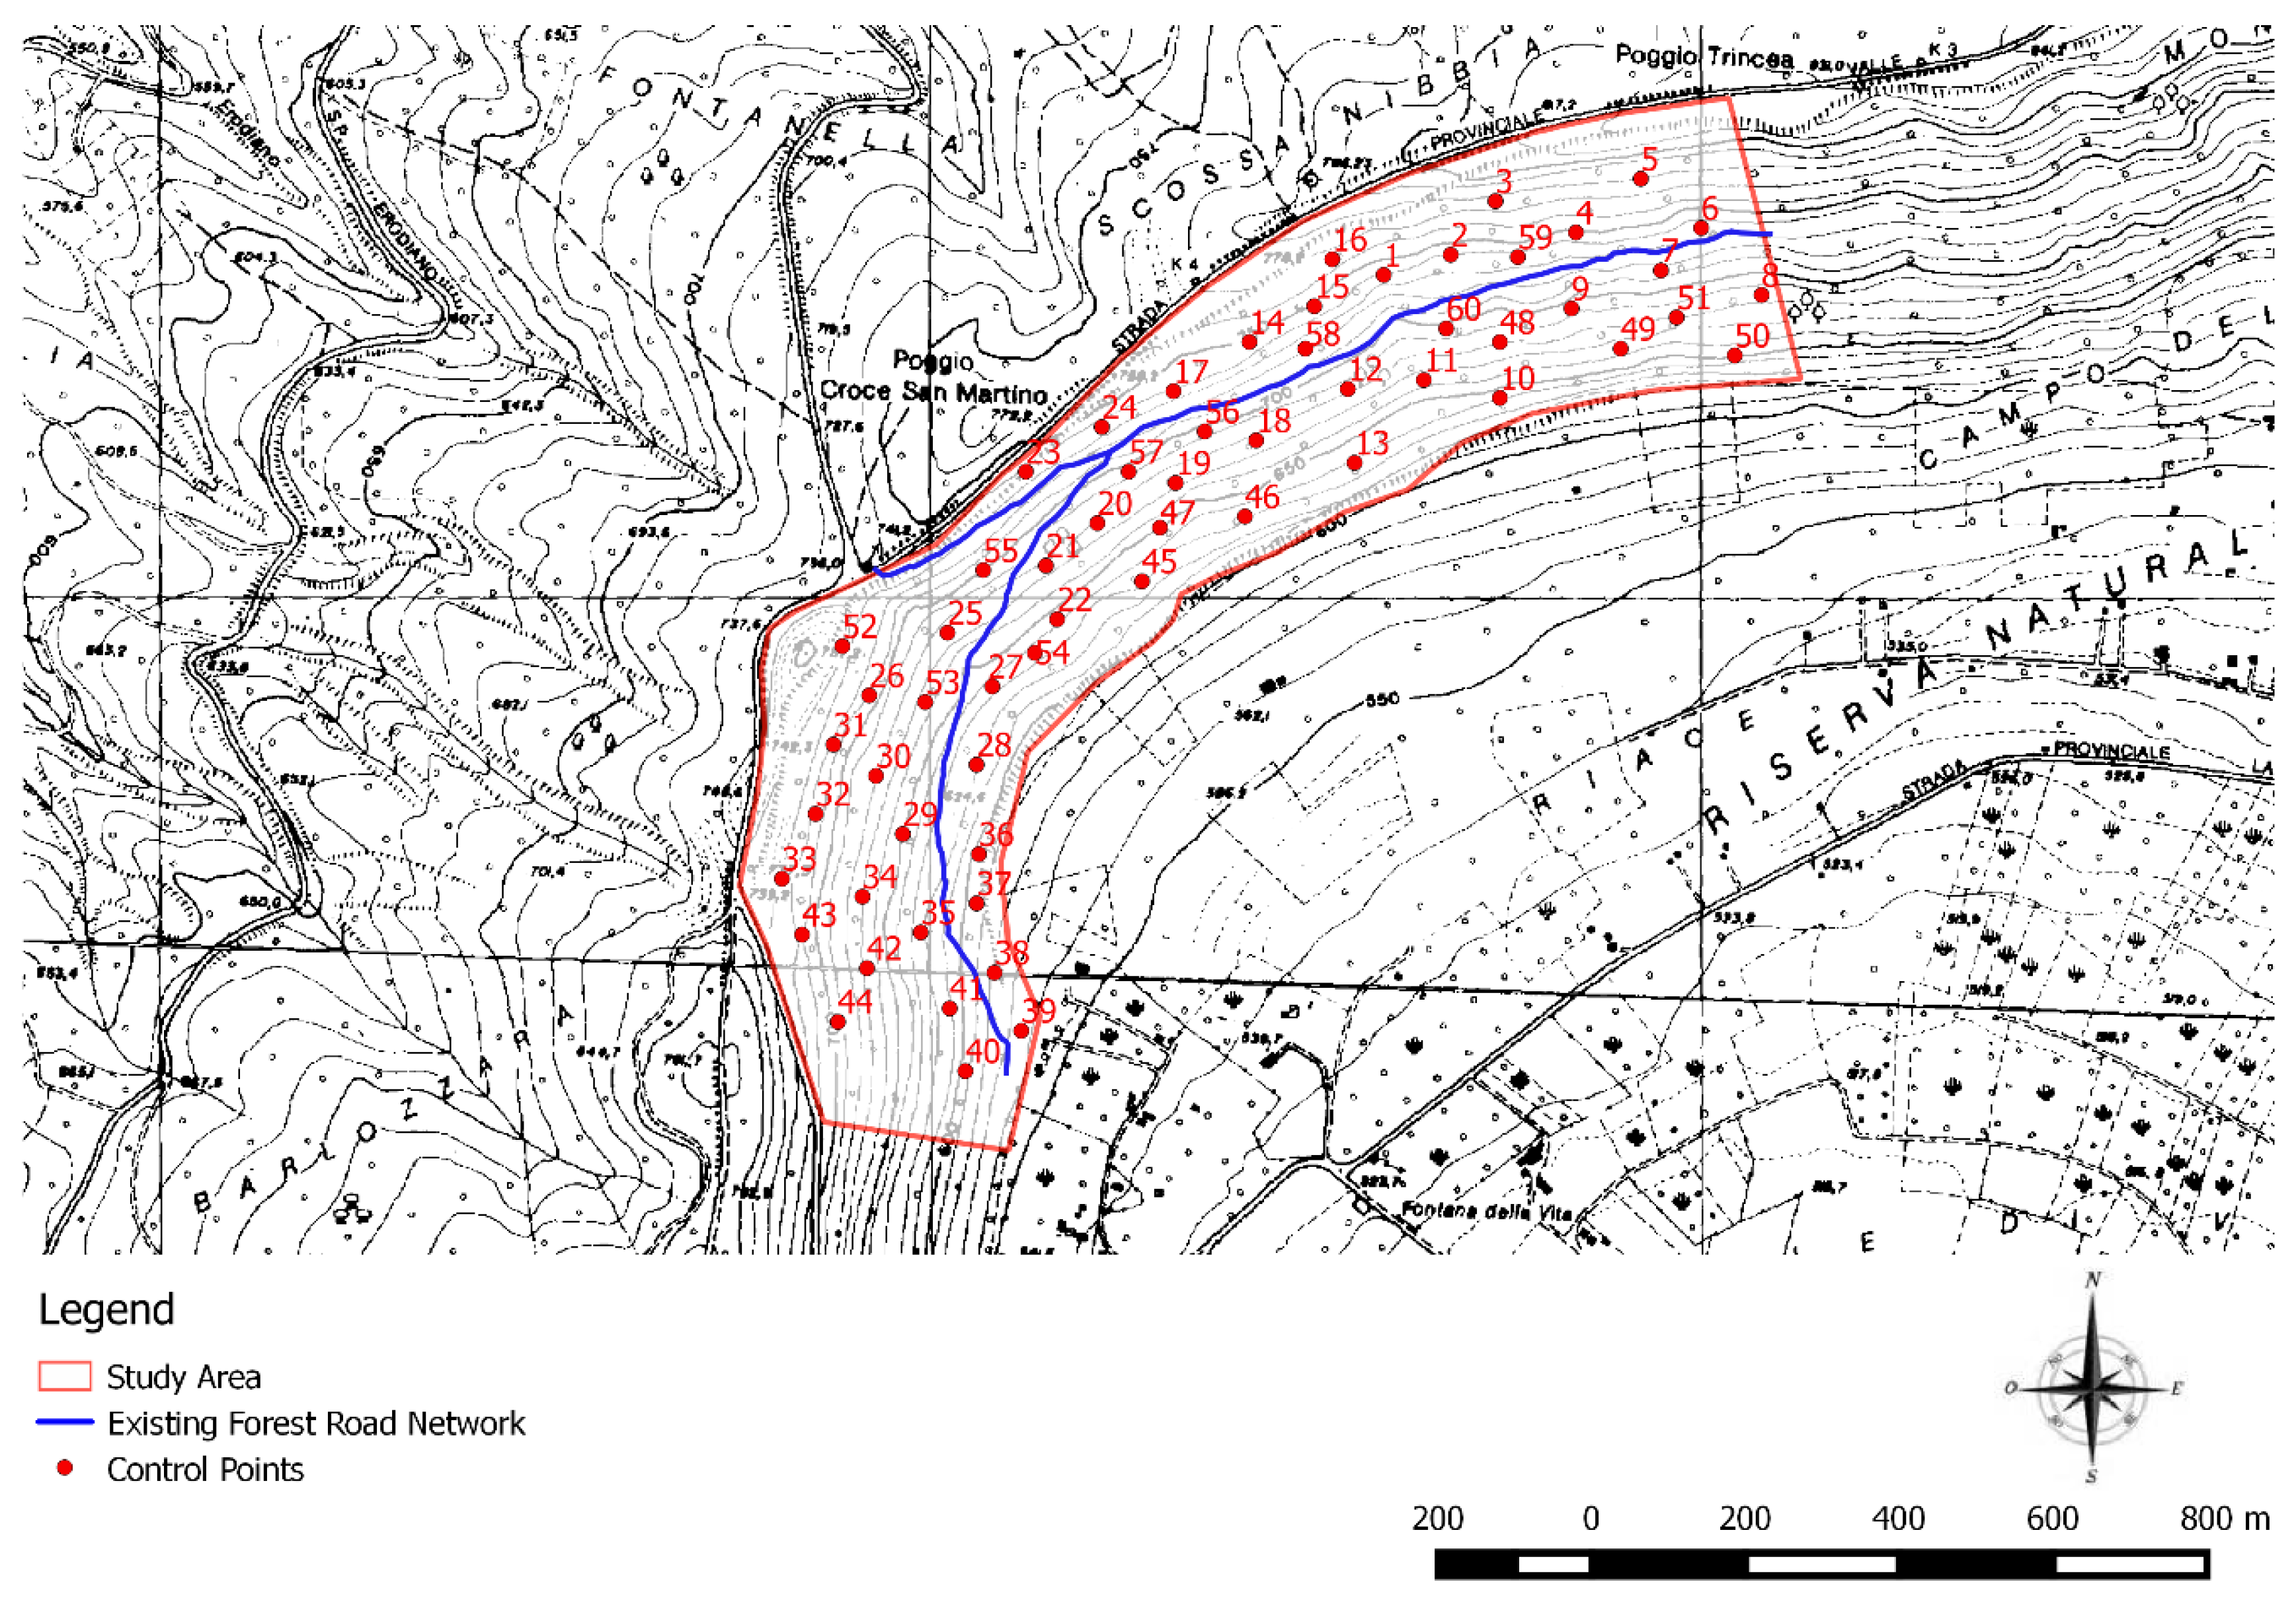
The field test in San Martino al Cimino was carried out on 58 control points (Figure 8). The shortest distances between each point and the skid trail were measured and the results were compared with those distances obtained using the GIS methods (Table 4).
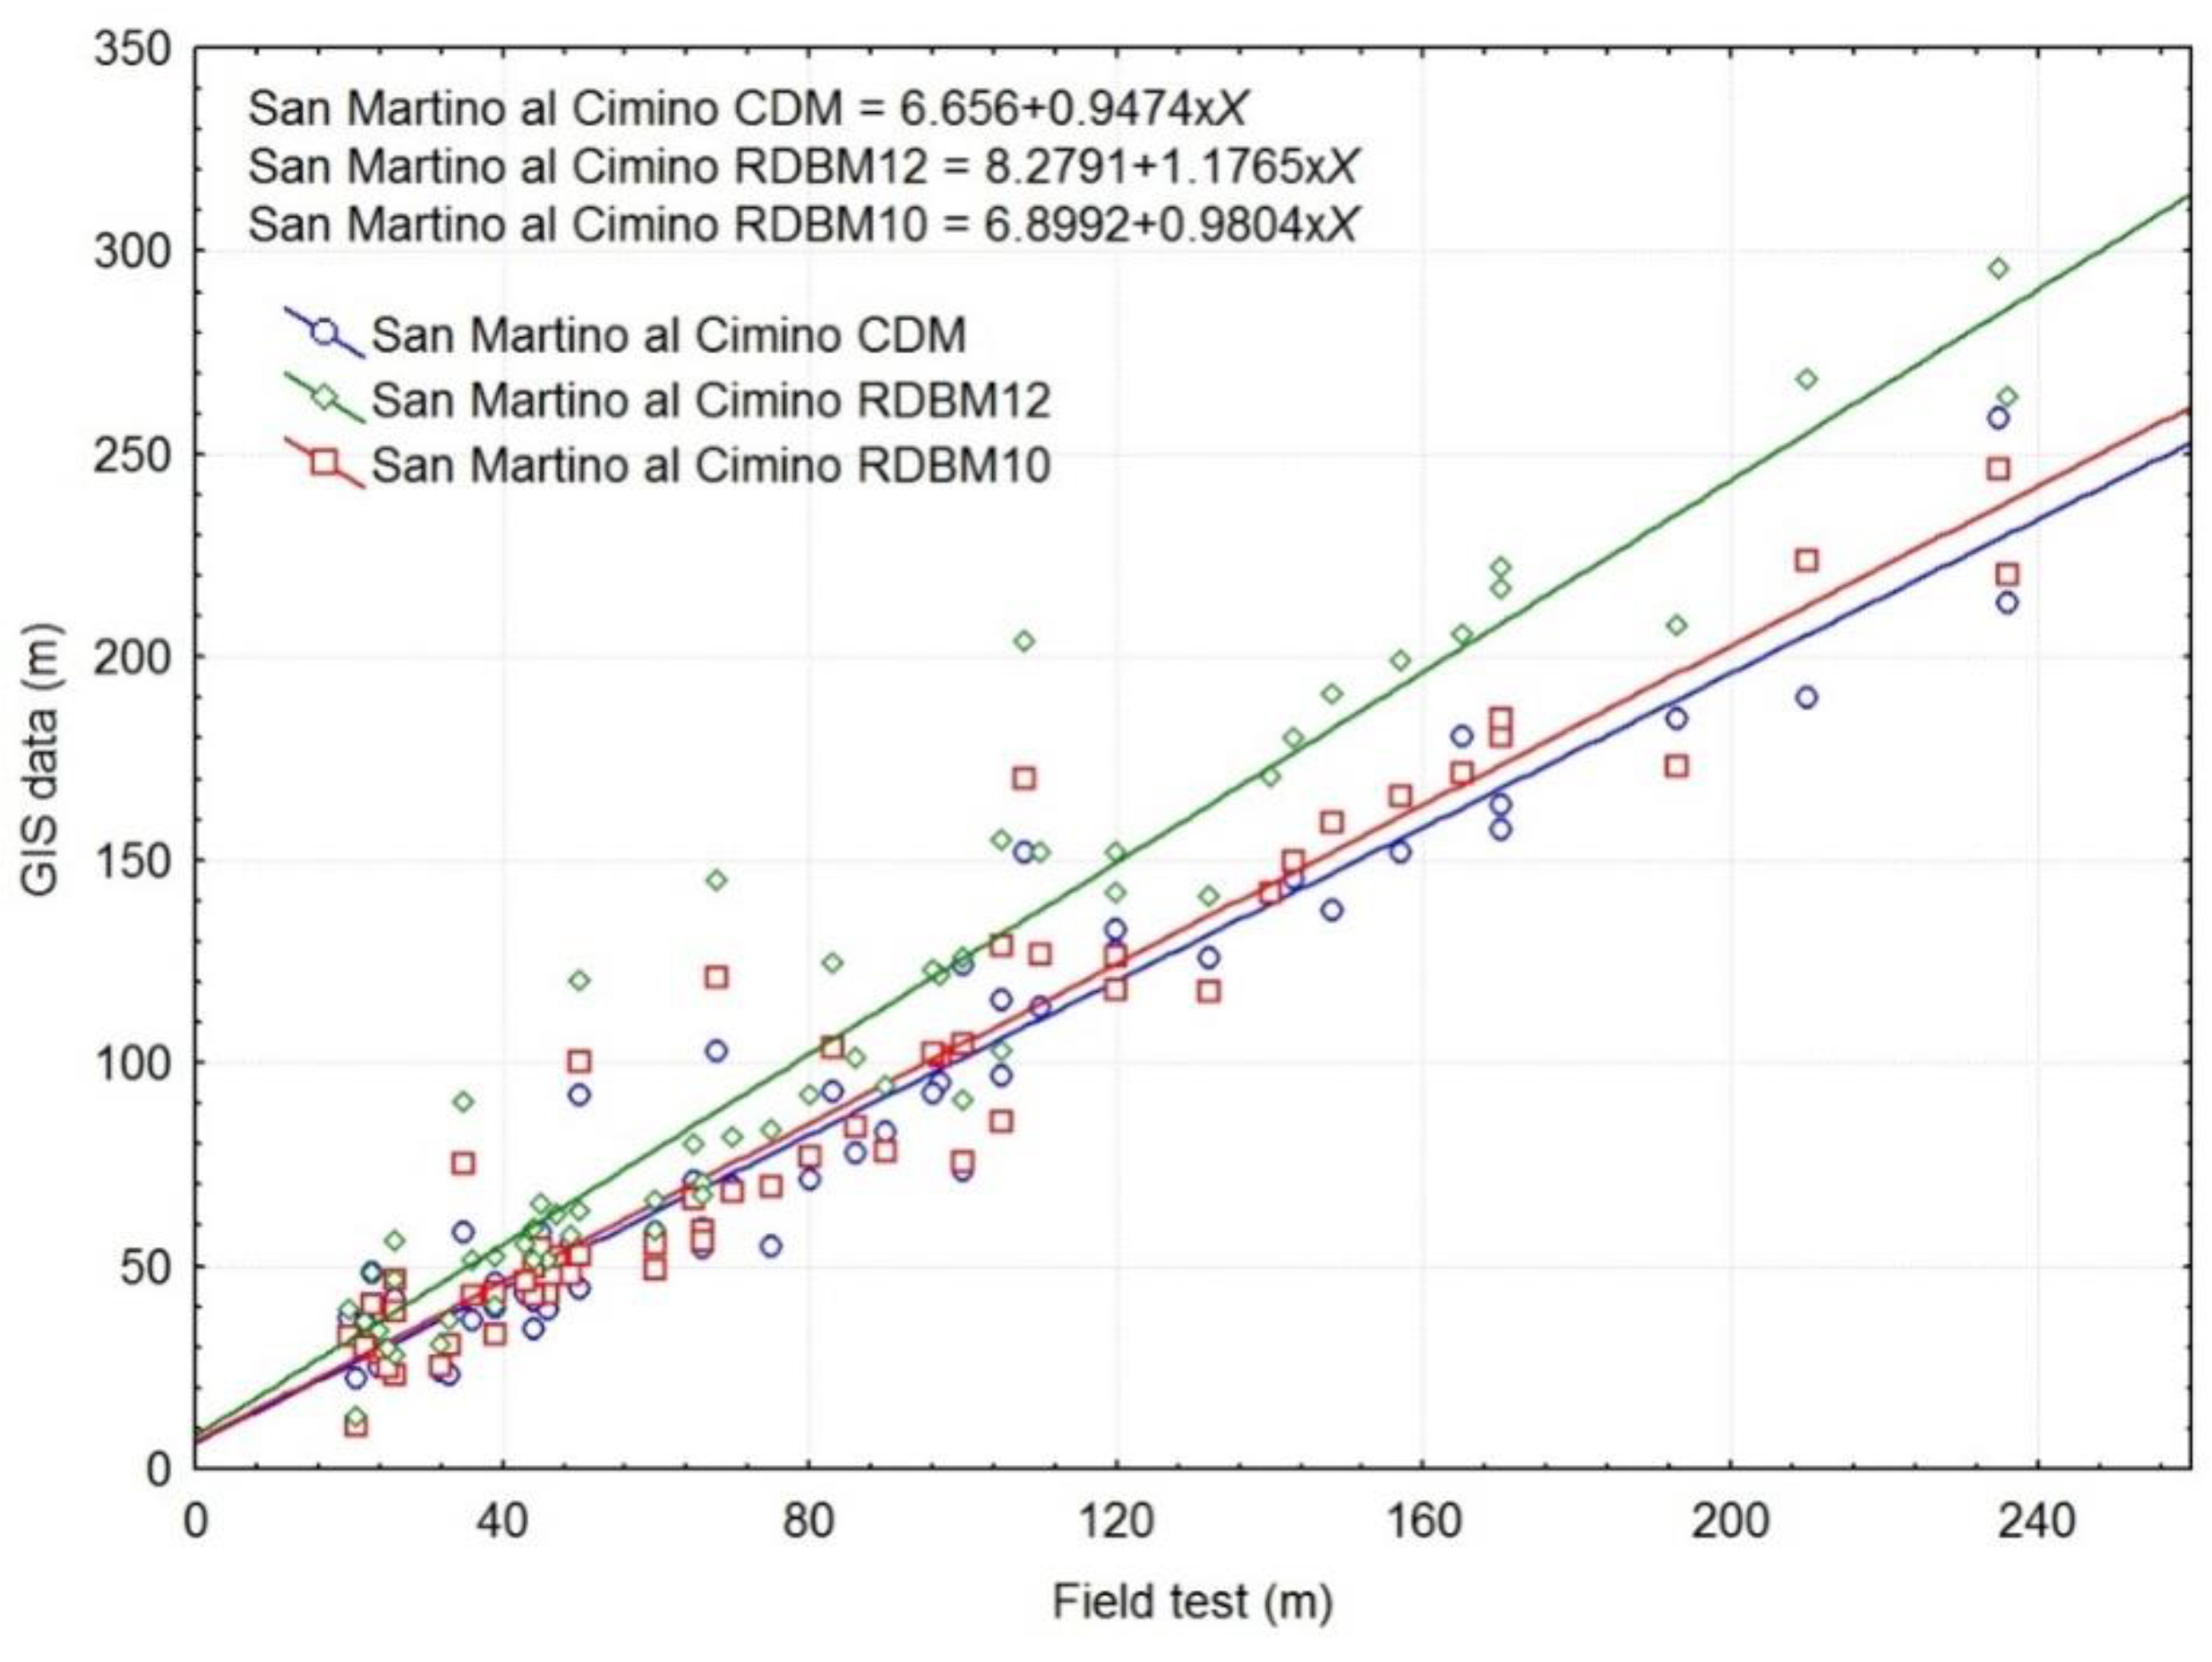
The scatterplot analysis (Figure 9) showed high values of R for the three GIS methods as well as equations showing a similar constant error for the three methods (ranging from 6.6 to 8.2), and a different level of variable errors. In particular, for RDBM10, the variable error was close to 1.0 (almost negligible), while it was slightly bigger for the CDM method (ca. 0.9) and the biggest for the RDBM12 method (ca. 1.2).
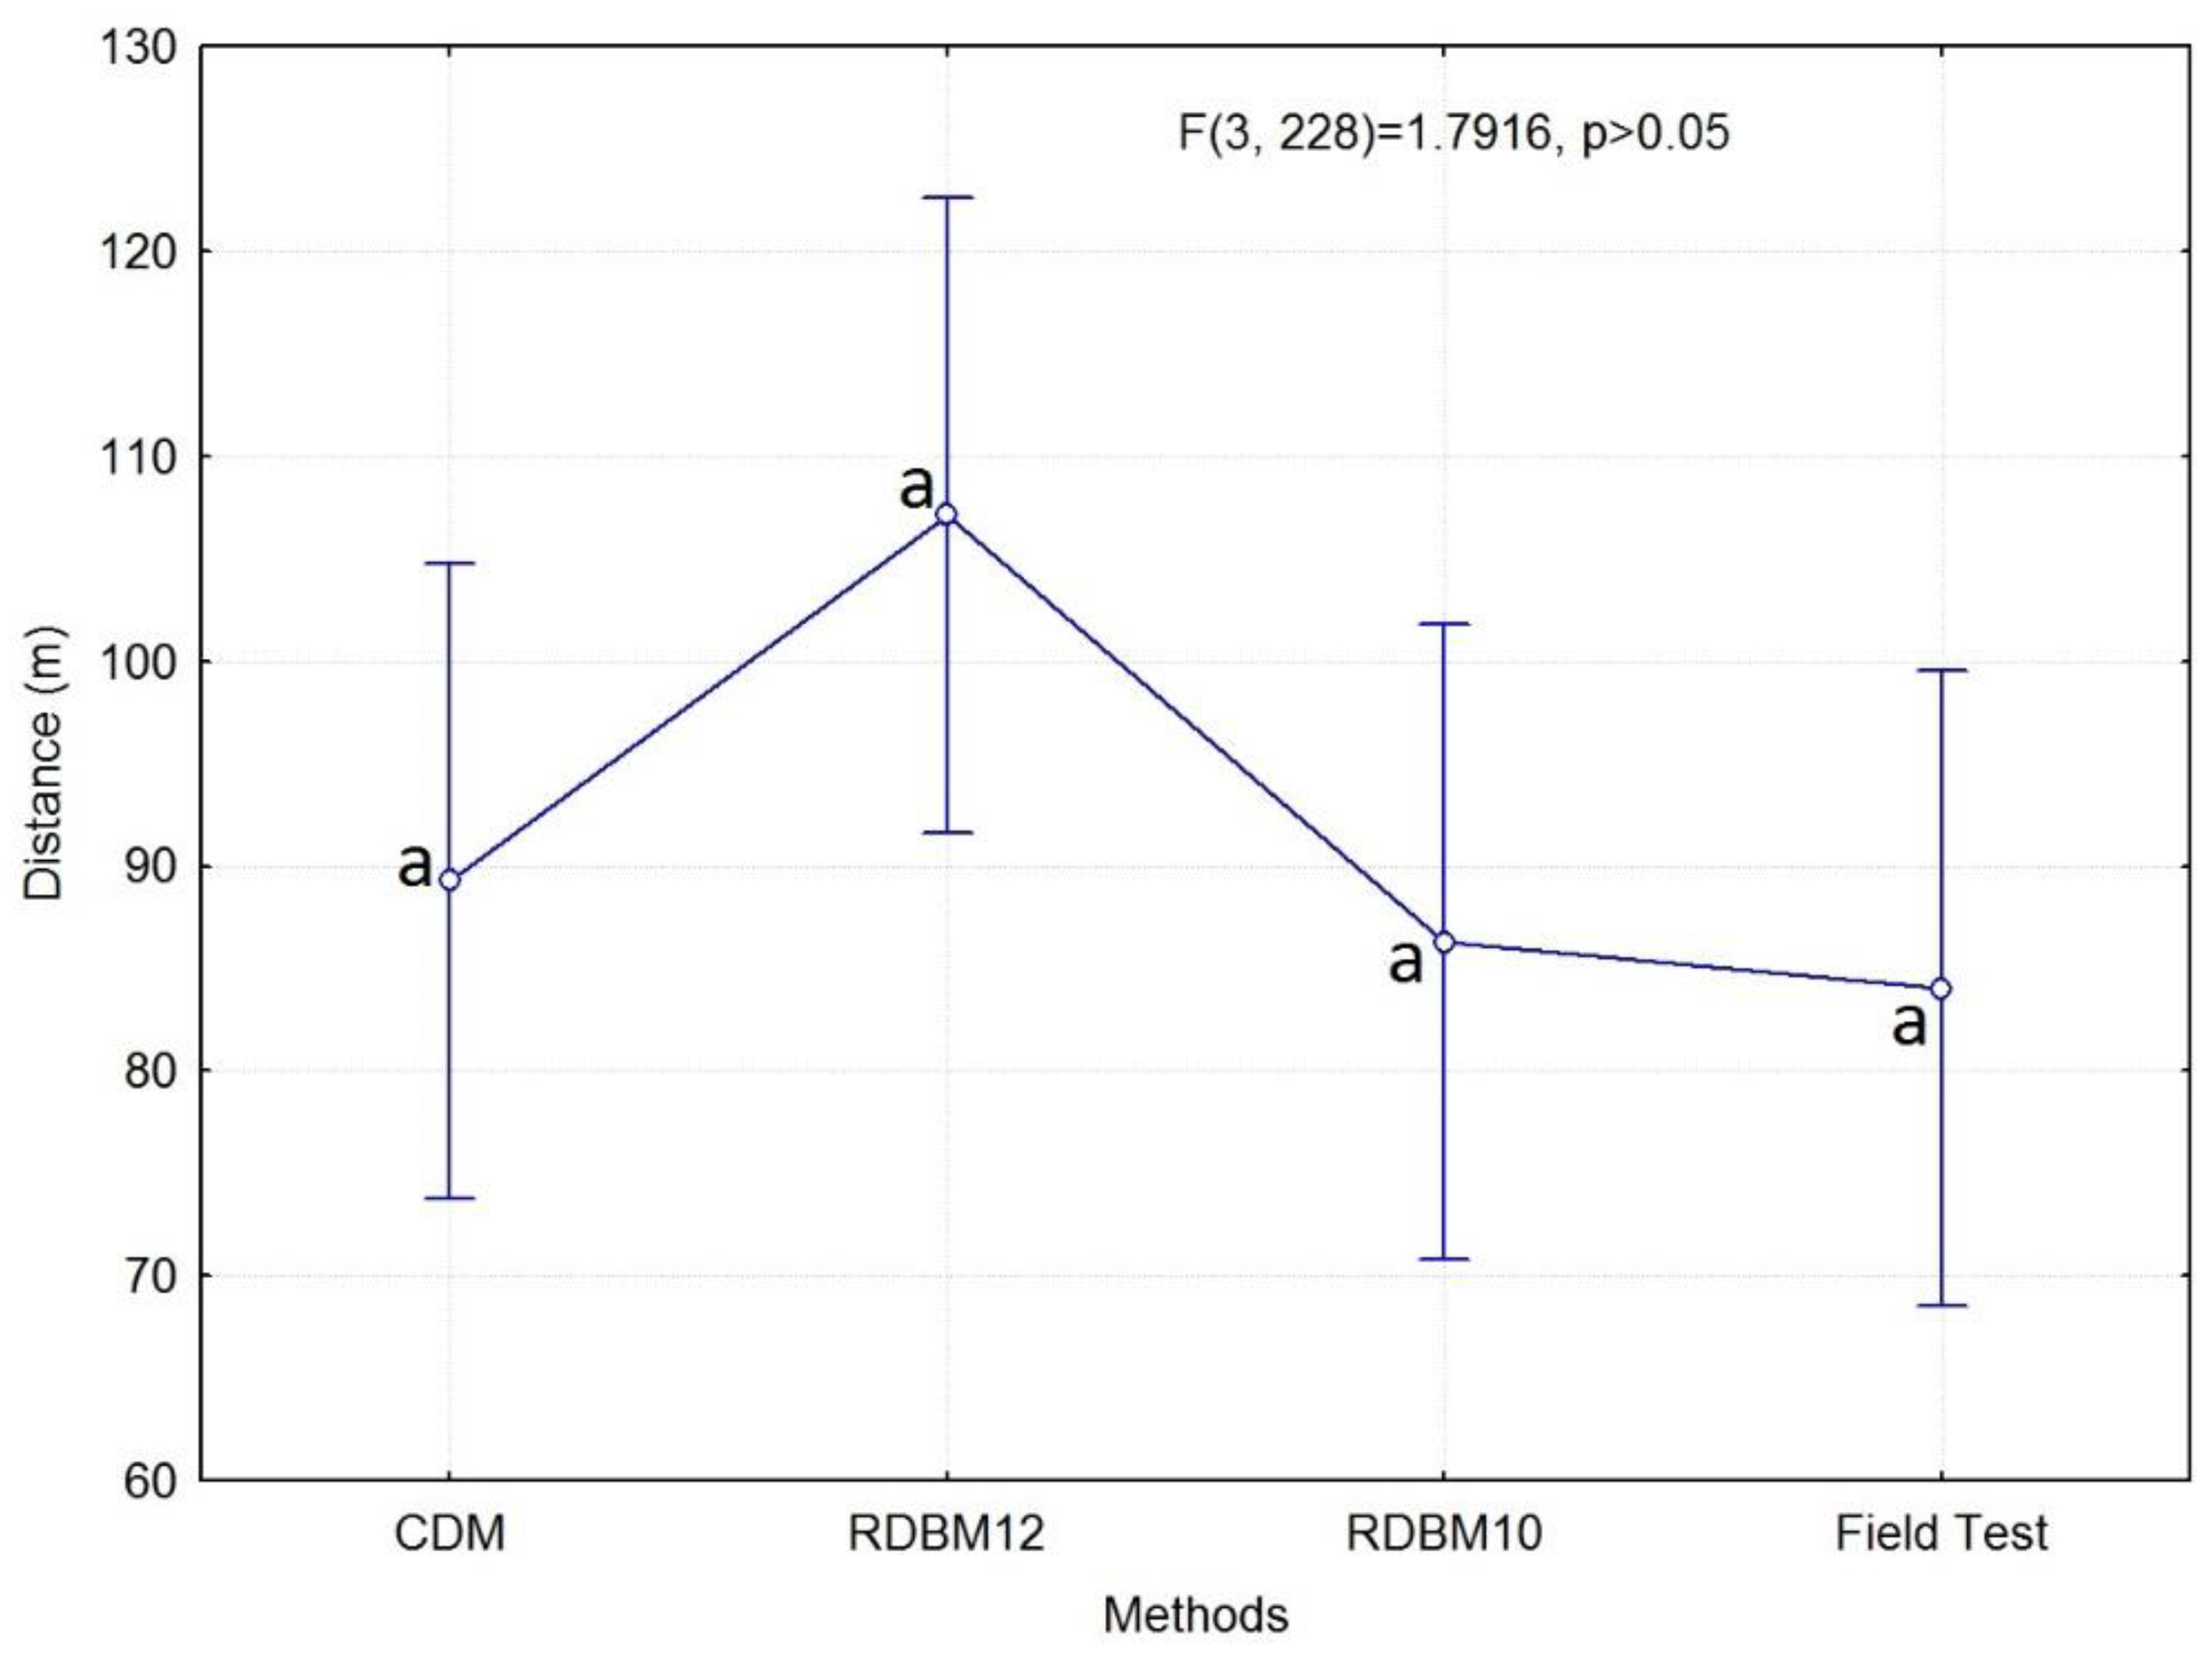
Statistical analysis found no significant differences between the three GIS methods and the field test measurements (Figure 10). However, RBDM10 gave the closest distance values to those obtained in the field (Figure 10), while the RDBM12 method had the biggest error.

3.2.3. Comparison of Tested Methods

In the presented research, all the GIS methods were useful in determining skidding area, particularly for winching in mountain conditions. GIS methods save time and make the job of estimating the accessibility area for different extraction methods easier in comparison with conducting field measurements.
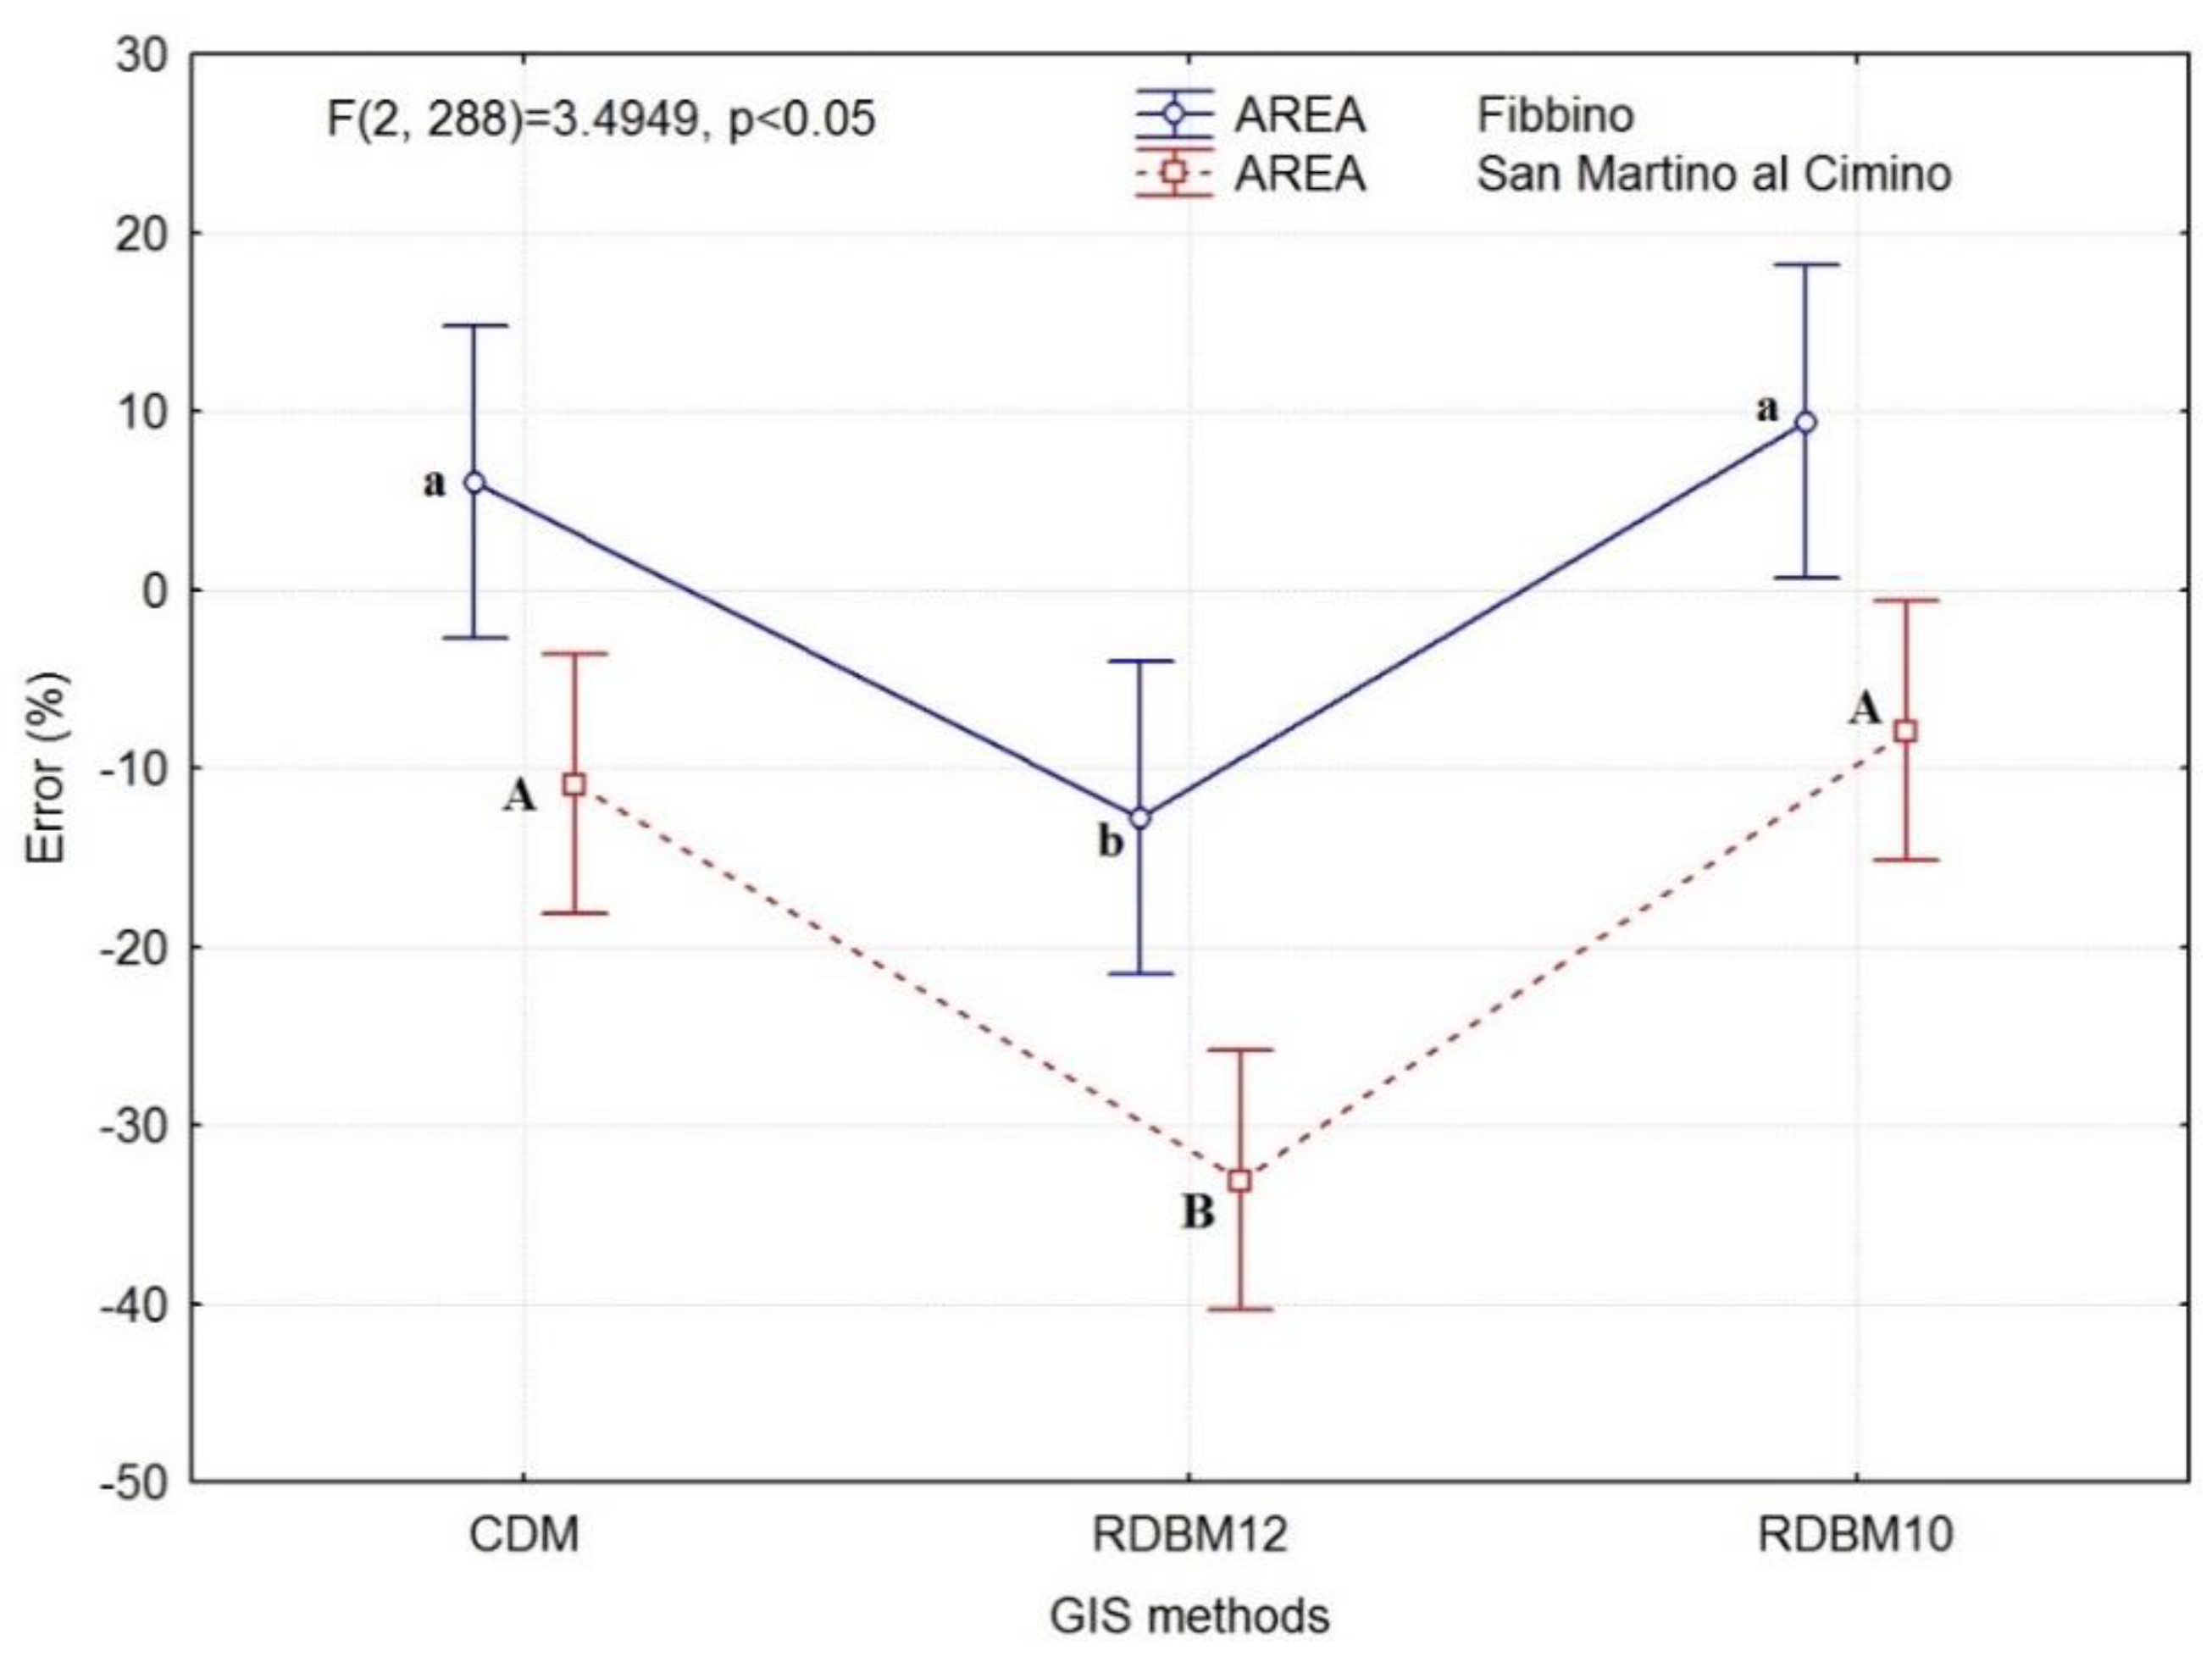
The analysis showed that, for the two areas, the errors had the same trend. A further comparison of the GIS methods (Figure 11) showed that statistical difference was present only between the GIS method, RDBM12, compared to the other two. In particular, RDBM12 showed the highest error, ranging from −13% to −33%, an overestimation of the distances calculated by the specific GIS method. The RDBM10 method was particularly accurate in the Fibbino area, where an error of only 6% was obtained (an underestimation of the distances), while the CDM was particularly accurate in the San Martino al Cimino area, where an error of only −8% was obtained (an overestimation of the distances). Statistically, the two GIS methods, RDBM10 and CDM, showed errors for the Fibbino area grouped as an average error of 7.7%, showing an underestimation of the distances calculated by the specific GIS methods. The same GIS methods for the San Martino al Cimino area showed errors grouped as an average error of −9.4%, showing an overestimation of the distances calculated.

4. Discussion

As also developed and found in other papers [32,33], using GIS for planning forest utilisation is less time-consuming and much cheaper in comparison with field measurements and working with a topographic map. They are particularly useful when it is necessary to decide which extraction method can be applied in mountain areas, especially when different extraction methods can be used. i.e., skidding or cable yarding.
In mountainous conditions, accessibility for machines is very often limited, and a suitable analysis with the developed applications, as in the presented research, could help in determining which extraction method to use on what area. The proposed methods (CDM or RDBM10) may also be useful in planning additional skid trails and establishing a larger area of accessibility [26], in limiting damage to the remaining stand [34,35,36,37] and reducing impact on forest soil [38].
Further tests focusing on the accuracy of both methods revealed that RDBM10 was particularly useful and most accurate in the Fibbino area. In general, all the methods were less accurate in San Martino al Cimino. This might have been due to the fact that the San Martino area had larger slope differences: the prevalent degree was 52% and maximum 120%, in comparison with Fibbino where the prevalent was 26% and the maximum 70%.
The impact of the slope degree on the accuracy of the measurements should be taken into consideration in further studies. This difference in the accuracy of the methods between the two areas may not only be due to different ground slope values, but also to the size of the total surface studied (20 ha in Fibbino— and 62 ha in San Martino al Cimino) (Table 3).
In the Fibbino study area, all the methods showed good results in relation to the field control and no statistically significant differences were observed only between the CDM and RDBM10 methods. The methods RDBM10 and CDM were slightly more accurate than RDBM12. In the San Martino al Cimino study area, there were no statistically significant differences between all the methods and the field test (control). However, CDM and RDBM10 gave better results than RDBM12. Eventually RDBM12 was used as a base for the RDBM10 method, which was in the end more accurate.
One important aspect that should be underlined is that all methods start from a DTM. Nowadays in Italy there is only 10-m resolution DTM that covers all the national territory. In order to implement either CDM or RDBM, LIDAR (Light Detection and Ranging o Laser Imaging Detection and Ranging) data could be applied to develop higher resolution DTM. Another important suggestion that could improve all the methods would be automation of the GIS implementation process, which is currently time-consuming and needs the assistance of a forest technician.
The GIS models applied in this study could be implemented in forest machines equipped with a computer, GNSS antenna and automatic pilot [39], leading to further improvement in forest harvesting operations in terms of economic (higher work productivity and less manpower), environmental (forest machines travel only along precise trails without redundant penetration in the forest) and social (greater work safety for forest workers) aspects [40,41,42]. Furthermore, as highlighted in another study [38], many demonstrated applications of remotely sensed data in forest operation planning are still rather experimental. The development of the methods presented in this paper can be considered as applied research based on the experimental stage.

5. Conclusions

The study confirmed that the GIS-based methods, CDM and RDBM10, were useful for determining accessible areas for winching in mountain conditions. They showed a good level of accuracy with interesting perspectives for implementation. During the evaluation, validation and implementation of these methods, it was possible to test the usefulness of mini, portable, electronic GPS devices for the collection of reference points to mark forest roads on a map. Additionally, both methods enabled the efficient management of the digital data within open source GIS to implement digital models. It was also possible to evaluate the accuracy of marking accessible areas for winching in a GIS database and with digital models.

Author Contributions

Conceptualisation, R.P. and P.S.M.; methods, R.P. and F.L.; software, F.L. and M.C.; validation, R.V., Z.K. and M.B.; formal analysis, R.P., F.L. and M.C.; investigation, R.P.; data curation, F.L., R.V. and M.C.; writing—original draft preparation, R.P. and F.L.; writing—review and editing, P.S.M., R.V., Z.K. and M.B.; supervision, R.P.; project administration, R.P.

Funding

This research received no external funding.

Acknowledgments

The authors gratefully acknowledge MIUR (Italian Ministry for education, University and Research) for support (Law 232/2016, Italian University Departments of Excellence).

Conflicts of Interest

The authors declare no conflicts of interest.

References

  1. Cambi, M.; Certini, G.; Fabiano, F.; Foderi, C.; Laschi, A.; Picchio, R. Impact of wheeled and tracked tractors on soil physical properties in a mixed conifer stand. IForest 2016, 9, 89–94. [Google Scholar] [CrossRef] [Green Version]
  2. Picchio, R.; Magagnotti, N.; Sirna, A.; Spinelli, R. Improved winching technique to reduce logging damage. Ecol. Eng. 2012, 47, 83–86. [Google Scholar] [CrossRef]
  3. Picchio, R.; Spina, R.; Calienno, L.; Venanzi, R.; Lo Monaco, A. Forest operations for implementing silvicultural treatments for multiple purposes. Ital. J. Agron. 2016, 11, 156–161. [Google Scholar]
  4. Enache, A.; Pentek, T.; Ciobanu, V.D.; Stampfer, K. GIS based methods for computing the mean extraction distance and its correction factors in Romanian mountain forests. Šumar. List 2015, 1–2, 35–46. [Google Scholar]
  5. Gumus, S.; Turk, Y. A New Skid Trail Pattern Design for Farm Tractors Using Linear Programing and Geographical Information Systems. Forests 2016, 7, 306. [Google Scholar] [CrossRef]
  6. Laschi, A.; Neri, F.; Brachetti Montorselli, N.; Marchi, E. A Methodological Approach Exploiting Modern Techniques for Forest Road Network Planning. Croat. J. For. Eng. 2016, 37, 319–331. [Google Scholar]
  7. Tucek, J.; Pacola, E. Algorithms for skidding distance modelling on a raster digital terrain model. J. For. Eng. 1999, 10, 67–79. [Google Scholar]
  8. Parsakhoo, A.; Mostafa, M. Road network analysis for timber transportation from a harvesting site to mills (Case study: Gorgan county–Iran). J. For. Sci. 2015, 61, 520–525. [Google Scholar] [CrossRef]
  9. Vopenka, P.; Kašpar, J.; Marušák, R. GIS tool for optimization of forest harvest-scheduling. Comput. Electr. Agric. 2015, 113, 254–259. [Google Scholar] [CrossRef]
  10. Segura, M.; Ray, D.; Maroto, C. Decision support systems for forest management: A comparative analysis and assessment. Comput. Electr. Agric. 2014, 101, 55–67. [Google Scholar] [CrossRef] [Green Version]
  11. Akay, A.E.; Sessions, J. Roading and transport operations. In Encyclopedia of Forest Sciences; Burley, J., Evans, J., Youngquist, J., Eds.; Elsevier Academic Press: Amsterdam, The Netherlands, 2004; pp. 259–269. [Google Scholar]
  12. Corona, P.; Ascoli, D.; Barbati, A.; Bovio, G.; Colangelo, G.; Elia, M.; Garfì, V.; Iovino, F.; Lafortezza, R.; Leone, V.; et al. Integrated forest management to prevent wildfires under Mediterranean environments. Ann. Silvic. Res. 2015, 39, 1–22. [Google Scholar]
  13. Enache, A.; Ciobanu, V.D.; Kühmaier, M.; Stampfer, K. An Integrative Decision Support Tool for Assessing Forest Road Options in a Mountainous Region in Romania. Croat. J. For. Eng. 2013, 34, 43–60. [Google Scholar]
  14. Grigolato, S.; Pellegrini, M.; Cavalli, R. Temporal analysis of the traffic loads on forest road networks. IForest 2013, 6, 255–261. [Google Scholar] [CrossRef] [Green Version]
  15. Hayati, E.; Majnounian, B.; Abdi, E. Qualitative evaluation and optimization of forest road network to minimize total costs and environmental impacts. IForest 2012, 5, 121–125. [Google Scholar] [CrossRef] [Green Version]
  16. Ezzati, S.; Najafi, A. Compilation of GIS and environmental techniques in primary forest road locating [In Farsi]. In Proceedings of the GIS Conference, Tehran, Iran, 6–7 January 2009; p. 10. [Google Scholar]
  17. Mederski, P.S.; Venanzi, R.; Bembenek, M.; Karaszewski, Z.; Rosińska, M.; Pilarek, Z.; Luchenti, I.; Surus, M. Designing Thinning Operations in 2nd Age Class Pine Stands—Economic and Environmental Implications. Forests 2018, 9, 335. [Google Scholar] [CrossRef]
  18. Magagnotti, N.; Spinelli, R.; Güldner, O.; Erler, J. Site impact after motor-manual and mechanised thinning in Mediterranean pine plantations. Biosyst. Eng. 2012, 113, 140–147. [Google Scholar] [CrossRef]
  19. Mederski, P.S. A comparison of harvesting productivity and costs in thinning operations with and without midfield. For. Ecol. Manag. 2006, 224, 286–296. [Google Scholar] [CrossRef]
  20. Picchio, R.; Neri, F.; Maesano, M.; Savelli, S.; Sirna, A.; Blasi, S.; Baldini, S.; Marchi, E. Growth Effects of Thinning Damage in a Corsican Pine (Pinus Laricio Poiret) Stand in Central Italy. For. Ecol. Manag. 2011, 262, 237–243. [Google Scholar] [CrossRef]
  21. Marchi, E.; Picchio, R.; Spinelli, R.; Verani, S.; Venanzi, R.; Certini, G. Environmental impact assessment of different logging methods in pine forests thinning. Ecol. Eng. 2014, 70, 429–436. [Google Scholar] [CrossRef]
  22. Gumus, S.; Hatay, T.Y. A cost effectiveness approach for configuration of feasible skyline yarder for specific forest regions. Fresenius Environ. Bull. 2017, 26, 4656–4662. [Google Scholar]
  23. Maesano, M.; Picchio, R.; Lo Monaco, A.; Neri, F.; Lasserre, B.; Marchetti, M. Productivity and energy consumption in logging operation in a Cameroonian tropical forest. Ecol. Eng. 2013, 57, 149–153. [Google Scholar] [CrossRef]
  24. Venanzi, R.; Picchio, R.; Piovesan, G. Silvicultural and logging impact on soil characteristics in Chestnut (Castanea sativa Mill.) Mediterranean coppice. Ecol. Eng. 2016, 92, 82–89. [Google Scholar] [CrossRef]
  25. Caliskan, E.; Karahalil, U. Evaluation of forest road network and determining timber extraction system using GIS: A case study in Anbardag planning unit. Šumar. List 2017, 3–4, 163–171. [Google Scholar]
  26. Picchio, R.; Pignatti, G.; Marchi, E.; Latterini, F.; Benanchi, M.; Foderi, C.; Venanzi, R.; Verani, S. The Application of Two Approaches Using GIS Technology Implementation in Forest Road Network Planning in an Italian Mountain Setting. Forests 2018, 9, 277. [Google Scholar] [CrossRef]
  27. Trimble. Juno Sb Handheld. Available online: https://www.trimble.com/mappinggis/junos.aspx (accessed on 30 September 2018).
  28. QGIS Development Team. QGIS Geographic Information System. Open Source Geospatial Foundation Project. 2017. Available online: http://www.qgis.org/ (accessed on 30 September 2018).
  29. Tarquini, S.; Isola, I.; Favalli, M.; Mazzarini, F.; Bisson, M.; Pareschi, M.T.; Boschi, E. TINITALY/01: A new Triangular Irregular Network of Italy. Ann. Geophys. 2007, 50, 407–425. [Google Scholar]
  30. Tarquini, S.; Vinci, S.; Favalli, M.; Doumaz, F.; Fornaciai, A.; Nannipieri, L. Release of a 10-m resolution DEM for the Italian territory: Comparison with global-coverage DEMs and anaglyph mode exploration via the web. Comput. Geosci. 2012, 38, 168–170. [Google Scholar] [CrossRef]
  31. Pentek, T.; Picman, D.; Potocnik, I.; Dvorscak, P.; Nevecerel, H. Analysis of an existing forest road network. Croat. J. For. Eng. 2005, 26, 39–50. [Google Scholar]
  32. Bembenek, M.; Giefing, D.F.; Karaszewski, Z.; Mederski, P.S.; Szczepańska-Álvarez, A. Tree damage in lowland spruce stands caused by early thinnings. Sylwan 2013, 157, 747–753. [Google Scholar]
  33. Fardusi, M.J.; Chianucci, F.; Barbati, A. Concept to practices of geospatial information tools to assist forest management & planning under precision forestry framework: A review. Ann. Silvic. Res. 2017, 41, 3–14. [Google Scholar]
  34. Scholz, J.; De Meyer, A.; Marques, A.S.; Pinho, T.M.; Boaventura-Cunha, J.; Van Orshoven, J.; Rosset, C.; Künzi, J.; Kaarle, J.; Nummila, K. Digital Technologies for Forest Supply Chain Optimization: Existing Solutions and Future Trends. J. Environ. Manag. 2018, 62, 1108–1133. [Google Scholar] [CrossRef]
  35. Bembenek, M.; Giefing, D.F.; Karaszewski, Z.; Mederski, P.S.; Szczepańska-Álvarez, A. Tree damage in lowland spruce stands because of late thinning. Sylwan 2013, 157, 892–898. [Google Scholar]
  36. Bakinowska, E.; Mederski, P.S.; Szczepańska-Alvarez, A.; Karaszewski, Z.; Bembenek, M. The parallel application of two probability models. logit and probit for the accurate analysis of spruce timber damage due to thinning operations. Drewno 2016, 59, 49–59. [Google Scholar] [CrossRef]
  37. Picchio, R.; Tavankar, F.; Bonyad, A.; Mederski, P.S.; Venanzi, R.; Nikooy, M. Detailed analysis of residual stand damage due to winching on steep terrains. Small-Scale For. 2018, in press. [Google Scholar]
  38. Talbot, B.; Pierzchała, M.; Astrup, R. Applications of remote and proximal sensing for improved precision in forest operations. Croat. J. For. Eng. 2017, 38, 327–336. [Google Scholar]
  39. Carballido, J.; Perez-Ruiz, M.; Emmi, L.; Aguera, J. Comparison of positional accuracy between rtk and rtx gnss based on the autonomous agricultural vehicles under field conditions. Appl. Eng. Agric. 2014, 30, 361–366. [Google Scholar]
  40. Macrì, G.; Zimbalatti, G.; Proto, A.R. Measuring the mobility parameters of tree-length forwarding systems using GPS technology in the Southern Italy forestry. Agronomy 2016, 14, 836–845. [Google Scholar]
  41. Marchi, E.; Chung, W.; Visser, R.; Abbas, D.; Nordfjell, T.; Mederski, P.S.; McEwan, A.; Brink, M.; Laschi, A. Sustainable Forest Operations (SFO): A new paradigm in a changing world and climate. Sci. Total Environ. 2018, 634, 1385–1397. [Google Scholar] [CrossRef]
  42. Picchio, R.; Sirna, A.; Sperandio, G.; Spina, R.; Verani, S. Mechanized harvesting of eucalypt coppice for biomass production using high mechanization level. Croat. J. For. Eng. 2012, 33, 15–24. [Google Scholar]
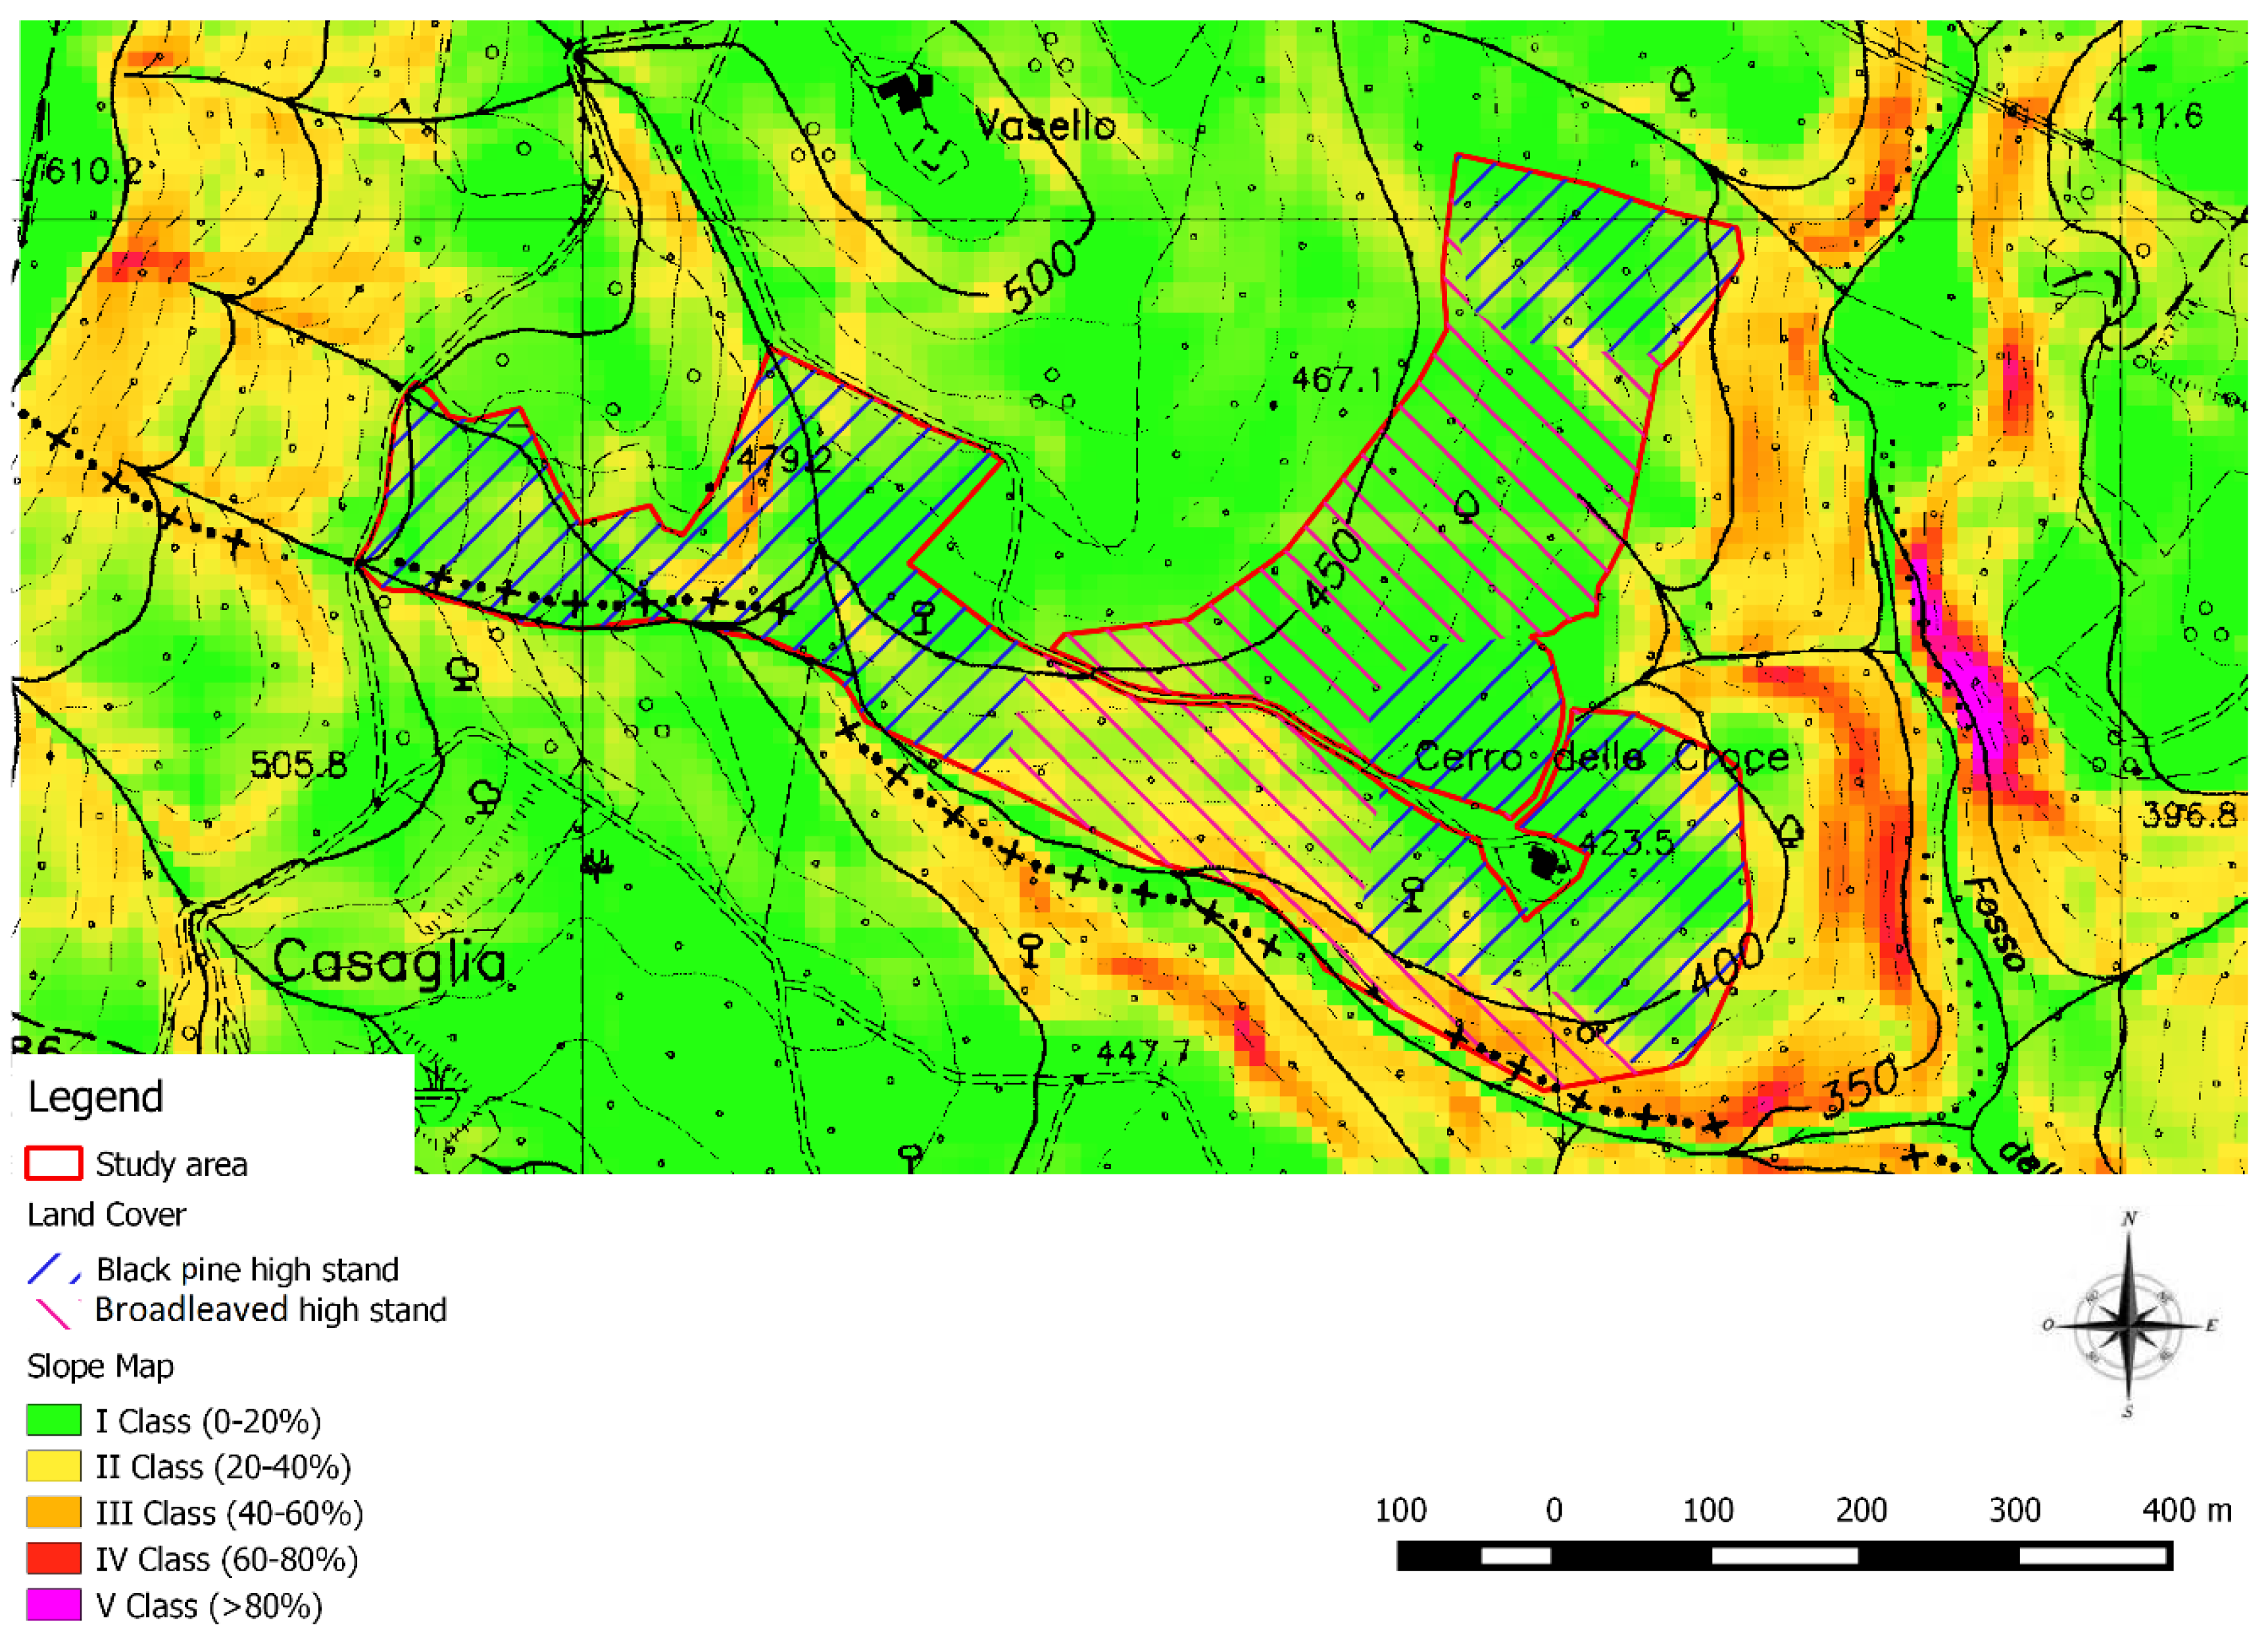
Figure 1. Land cover and slope map of Fibbino study area. CRS: WGS84-UTM33T. EPSG 32633.
Electronics 08 00053 g001
Figure 2. Land cover and slope map of San Martino al Cimino study area. CRS: WGS84-UTM33T. EPSG 32633.
Electronics 08 00053 g002
Figure 3. (a) Road network in Fibbino forests. (b) Fibbino: areas accessible for winching marked using correct distance method (CDM); uphill winching distance = 80 m, downhill winching distance = 40 m. (c) Fibbino: areas accessible for winching marked using real distance buffer method 12 (RDBM12); uphill winching distance = 80 m, downhill winching distance = 40 m. (d) Fibbino: areas accessible for winching marked using real distance buffer method 10 (RDBM10); uphill winching distance = 80 m, downhill winching distance = 40 m. CRS: WGS84-UTM33T. EPSG 32633.
Electronics 08 00053 g003
Figure 4. (a) Road network in San Martino al Cimino forests. (b) San Martino al Cimino: areas accessible for winching marked using CDM; uphill winching distance = 80 m, downhill winching distance = 40 m. (c) San Martino al Cimino: areas accessible for winching marked using RDBM12; uphill winching distance = 80 m, downhill winching distance = 40 m. (d) San Martino al Cimino: areas accessible for winching marked using RDBM10; uphill winching distance = 80 m, downhill winching distance = 40 m. CRS: WGS84-UTM33T. EPSG 32633.
Electronics 08 00053 g004aElectronics 08 00053 g004b
Figure 5. Positions of selected control points in Fibbino study area. CRS: WGS84-UTM33T. EPSG 32633.
Electronics 08 00053 g005
Figure 6. Scatterplot of distances measured in Fibbino study area: field test vs. CDM: R2 = 0.7193, R = 0.8481, p < 0.001; field test vs. RDBM12: R2 = 0.7583, R = 0.8708, p ≤ 0.001; field test vs. RDBM10: R2 = 0.7583, R = 0.8708, p < 0.001.
Electronics 08 00053 g006
Figure 7. Differences in distance measurements: results of one-way ANOVA and Tukey test for Fibbino study area. In diagram, points represent average values, bar represents standard deviation and the same letters stand for statistically homogenous groups.
Electronics 08 00053 g007
Figure 8. Positions of selected control points in San Martino al Cimino study area.
Electronics 08 00053 g008
Figure 9. Scatterplot of distances measured in San Martino al Cimino study area: field test vs. CDM: R2 = 0.9337, R = 0.9603, p < 0.001; field test vs. RDBM12: R2 = 0.9189, R = 0.9586, p < 0.001; field test vs. RDBM10: R2 = 0.9189, R = 0.9586, p < 0.001.
Electronics 08 00053 g009
Figure 10. Differences in distance measurements: results of one-way ANOVA for San Martino al Cimino study area. In diagram, points represent average values while bar represents standard deviation.
Electronics 08 00053 g010
Figure 11. Factorial ANOVA results, differences in error values and Tukey test. In diagram, points represent error average values, bar represents standard deviation and the same letters stand for statistically homogenous groups.
Electronics 08 00053 g011
Table 1. Road classifications with main features in areas studied, according to Italian standards [6].
Type of RoadWidth [m]Slope [%]Maximum Curvature Radius in Hairpin Turns [m]
MinimumPrevalentOptimumAverageMaximum for Short StretchesMaximum Reverse Slope *
Main3.55÷63÷810141010
Secondary3.04÷53÷81218127
Skid trail2.53÷43÷81425145
* Reverse slope—distance that machine (forwarder, truck, tractor and trailer, etc.) has to cover when driving loaded to the landing site.
Table 2. Characteristics of forest road network in selected areas of Fibbino and San Martino al Cimino.
AreaRoad TypeLength [m]Average Width [m]Average Slope [%]Maximum Slope [%]Maximum Reverse Slope [%]Minimum Curvature Radius in Hairpin Turns [m]
FibbinoSecondary road for trucks20484.491496.5
San Martino al CiminoSkid trails33003.51218105.4
Table 3. Accessible areas for winching in Fibbino and San Martino al Cimino determined by CDM and RDBM methods.
AreaMethodExisting Road Network Length [m]Intervention Area [ha]Density of Existing Forest Roads [m ha¹]Total Accessible Areas [ha]Percent of Accessible Areas [%]Accessible Areas for Uphill Extraction [ha]Accessible Areas for Downhill Extraction [ha]
FibbinoCDM204820.021029.90497.062.84
RDBM12204820.021027.69385.472.22
RDBM10204820.021029.13466.662.47
San Martino al CiminoCDM330061.605421.323515.156.17
RDBM12330061.605417.642912.165.48
RDBM10330061.605420.223314.206.02
Table 4. Descriptive statistics of shortest distances between each point and skid trail measured using geographic information system (GIS) methods and tape: 40 and 58 control points in Fibbino and San Martino al Cimino, respectively.
Descriptive StatisticsFibbinoSan Martino al Cimino
CDM [m]RDBM12 [m]RDBM10 [m]Field Test [m]CDM [m]RDBM12 [m]RDBM10 [m]Field Test [m]
Mean66826973861078984
Minimum2135293323131120
Maximum981169796259296246236
SD2429242055695856
Number4040404058585858