Article

Perturbed Point-to-Point Reaching Tasks in a 3D Environment Using a Portable Haptic Device

1
Department of Mechanical and Aerospace Engineering (DIMA), “Sapienza” University of Rome, 00185 Roma, Italy
2
Consiglio Nazionale delle Ricerche (CNR), Institute of Neuroscience, 43125 Parma, Italy
3
Seidenberg School of CSIS, Pace University, New York, NY 10038, USA
4
Department of Economics, Engineering, Society and Business Organization (DEIM), University of Tuscia, 01100 Viterbo, Italy
*
Author to whom correspondence should be addressed.
Electronics 2019, 8(1), 32; https://doi.org/10.3390/electronics8010032
Submission received: 16 October 2018 / Revised: 9 December 2018 / Accepted: 23 December 2018 / Published: 1 January 2019
(This article belongs to the Section Computer Science & Engineering)

Abstract

:
In this paper, we propose a new protocol, integrating Virtual Reality with the Novint Falcon, to evaluate motion performance during perturbed 3D reaching tasks. The protocol consists of six 3D point-to-point reaching tasks, performed using Falcon with six opposing force fields. Twenty subjects were enrolled in the study. During each task, subjects reached 80 targets and the protocol was repeated over three different days. The trajectories of the end-effector were recorded to calculate: duration of movement, length ratio, lateral deviation, aiming angle, speed metric, and normalized jerk. The coefficient of variation was calculated to study the intra-subject variability and the intra-class correlation coefficient to assess the reliability of the indices. Two-way repeated measurement ANOVA tests were performed for all indices in order to ascertain the effects of force and direction on the trajectories. Duration of movement, length ratio and speed metric have proven to be the most repeatable and reliable indices. Considering the force fields, subjects were able to optimize the trajectory in terms of duration and accuracy but not in terms of smoothness. Considering the directions, the best motor performance occurred when the trajectories were performed in the upper quadrant compared to those performed in the lower quadrant.

1. Introduction

The process of motor rehabilitation is a form of motor learning, which refers to a relatively permanent change in motor behavior evoked by practice or experience [1]. Motor learning is mediated by neuroplasticity, which is the ability of the Central Nervous System (CNS) to reorganize itself and change in response to new experiences [2]. Individuals engage in motor rehabilitation training to relearn motor skills that were lost as a result of injury.
During the 1990s, Robot-Mediated Therapy (RMT) emerged as an effective tool to restore the motor function of the upper limbs after brain injuries [3]. RMT allows the subjects to perform more intensive and repetitive exercises compared to traditional motor exercises performed under therapist supervision, thereby opening up the possibility of a more complete and controlled rehabilitation program [4].
Over the last decade, Virtual Reality (VR) technology has increasingly played an important role in the field of neuro-rehabilitation [2,5,6]. This technology allows patients to interact with and navigate through 3D virtual environments, where several targeted motor tasks can be proposed as viable games. VR-based rehabilitation exercises can be easily tailored to the patient’s needs and the software used to develop VR scenarios, whereby the sensors are embedded into integrated devices. These devices usually allow to record patient kinematics, thereby providing data for an objective evaluation of performance [7]. The primary advantages of using VR-based rehabilitation are increased motor task repetition, feedback about the patient’s motor or cognitive performance and improved motivation [8]. The use of VR-based rehabilitation, facilitated by haptic devices, enhances the level of user interactivity within a virtual environment and ultimately improves the patient’s task performance during motor rehabilitation [9]. It has already been proved that haptic devices are fundamental for rehabilitative motor tasks, since they allow improvements to the manipulation capabilities of the user in a VR environment, as a result of additional information about the physical characteristics of virtual objects [10,11].
Focusing on the rehabilitation of the upper limbs, several robotic devices have been developed that are capable of providing haptic feedback to the patient. The MIT Manus was the first robot designed for this purpose, and was proposed by Hogan et al. [12] in 1992. This device, which was developed for rehabilitation of the shoulder and the elbow, allowed movement of the end-effector in a horizontal plane. The commercial version of the MIT Manus, which is the most widely used robot in upper limb rehabilitation, was originally conceived for post-stroke adult patients [13], and recently, its use was extended to a pediatric population with cerebral palsy [14]. Other important examples of upper limb robotic devices, currently used in clinics, include: Mirror Image Motion Enabler (MIME) [15], GENTLE/S [16] and REO-GO [17]. Lum et al. [15] compared a therapy program based on point-to-point reaching tasks using the MIME, with an equally intensive program of conventional therapy techniques performed with a group of stroke patients. They determined that Robot-assisted treatment benefits exceeded those expected from the traditional therapy. Amirabdollahian et al. [16] proposed different scenarios of reaching tasks, using the GENTLE/S neuro-rehabilitation system, and they found that the proposed therapies improved movement over a period of nine sessions compared to the baseline. Bovolenta et al. [17] trained 14 patients, with chronic post-stroke hemiparesis, using the REO-GO system, which resulted in significant improvements in completing the treatment and resulted in positive patient feedback.
All of the cited haptic devices were mainly used to recover and analyze reaching tasks, since these actions are essential in performing daily living activities [18]. Moreover, one of the main barriers to arm motor recovery, following a neurological impairment, is the use of maladaptive movement strategies observed during reaching tasks [19].
The robotic devices used in RMT are characterized by high costs, are difficult to move and can only be used in a clinical setting. Therefore, the use of cheaper, more portable mechatronic devices, originally developed as game controllers, have become more pervasive over the last few years because they can be used by patients at home, which means that they may be suitable for tele-rehabilitation [20]. These devices could simulate the kinesthetic sense of the user and generate forces through the end-effector [4]. Some examples of haptic devices currently available are: Omni Phantom [21], Haption Virtuose 3D [22], FD Delta [23], and Novint Falcon [24]. While comparing different devices, the Novint Falcon emerged as the most suitable for rehabilitation purposes because it can generate more force feedback than the other devices [4]. Moreover, user-friendly control interfaces enable use of the Falcon with different applications [25].
Several studies have investigated the use of this device in neuro-rehabilitation treatments. Palsbo et al. [26] used the Falcon to train fine movements in a group of healthy developing children and noted significant improvements in handwriting performance. Chortis et al. [25] evaluated the effects of repetitive arm movements performed with the Falcon, and commercial games included with the device, with a group that was comprised of eight post-stroke subjects. Results indicated that the subjects were able to correctly perform the rehabilitation tasks. However, the authors only evaluated the efficacy of the virtual exercises with clinical indices and from a motivational point of view, without considering kinematic indices related to the movements performed. The latter could have permitted a greater understanding about whether patients improve their motor performance and exactly when this improvement is realized during robotic therapies. Cappa et al. [4] used the Falcon to study how a group of healthy subjects responded to different force feedback in a specific virtual environment. The authors demonstrated how force feedback was able to adjust the smoothness, the accuracy, and the duration of the subjects’ movements.
VR-based rehabilitation protocols are normally executed using expensive robotic devices [27], with well documented positive effects on patient motor recovery [28]. No studies, to the best of authors’ knowledge, have proposed a haptic, VR-based, rehabilitation protocol with the use of a 3D portable haptic device that can be used for tele-rehabilitation. In fact, 3D reaching is one of the fundamental tasks to evaluate neurorehabilitation motor performance [29] and provides a superior method to assess the functional recovery of an impaired arm, while the rehabilitative protocol should consist of several tasks with increasing levels of difficulty [30].
Consequently, this study proposes a novel VR scenario, utilizing the Novint Falcon, to assess motor performance; it has been validated and tested on healthy subjects. More specifically, the protocol consisted of 3D reaching tasks performed in eight directions and perturbed by force fields of increasing magnitude. The subject’s motor performance was assessed using the most widely used kinematic indices for evaluating the motor performance of a healthy and clinical population [31,32,33]. These indices are typically used with high-cost devices that facilitate reaching tasks. Moreover, the repeatability and reliability of the proposed novel VR based rehabilitation protocol were evaluated involving twenty subjects and repeating the protocol in three different days. Finally, this study could provide reference values of the kinematic indices used to assess motor performance in 3D reaching tasks.

2. Materials and Methods

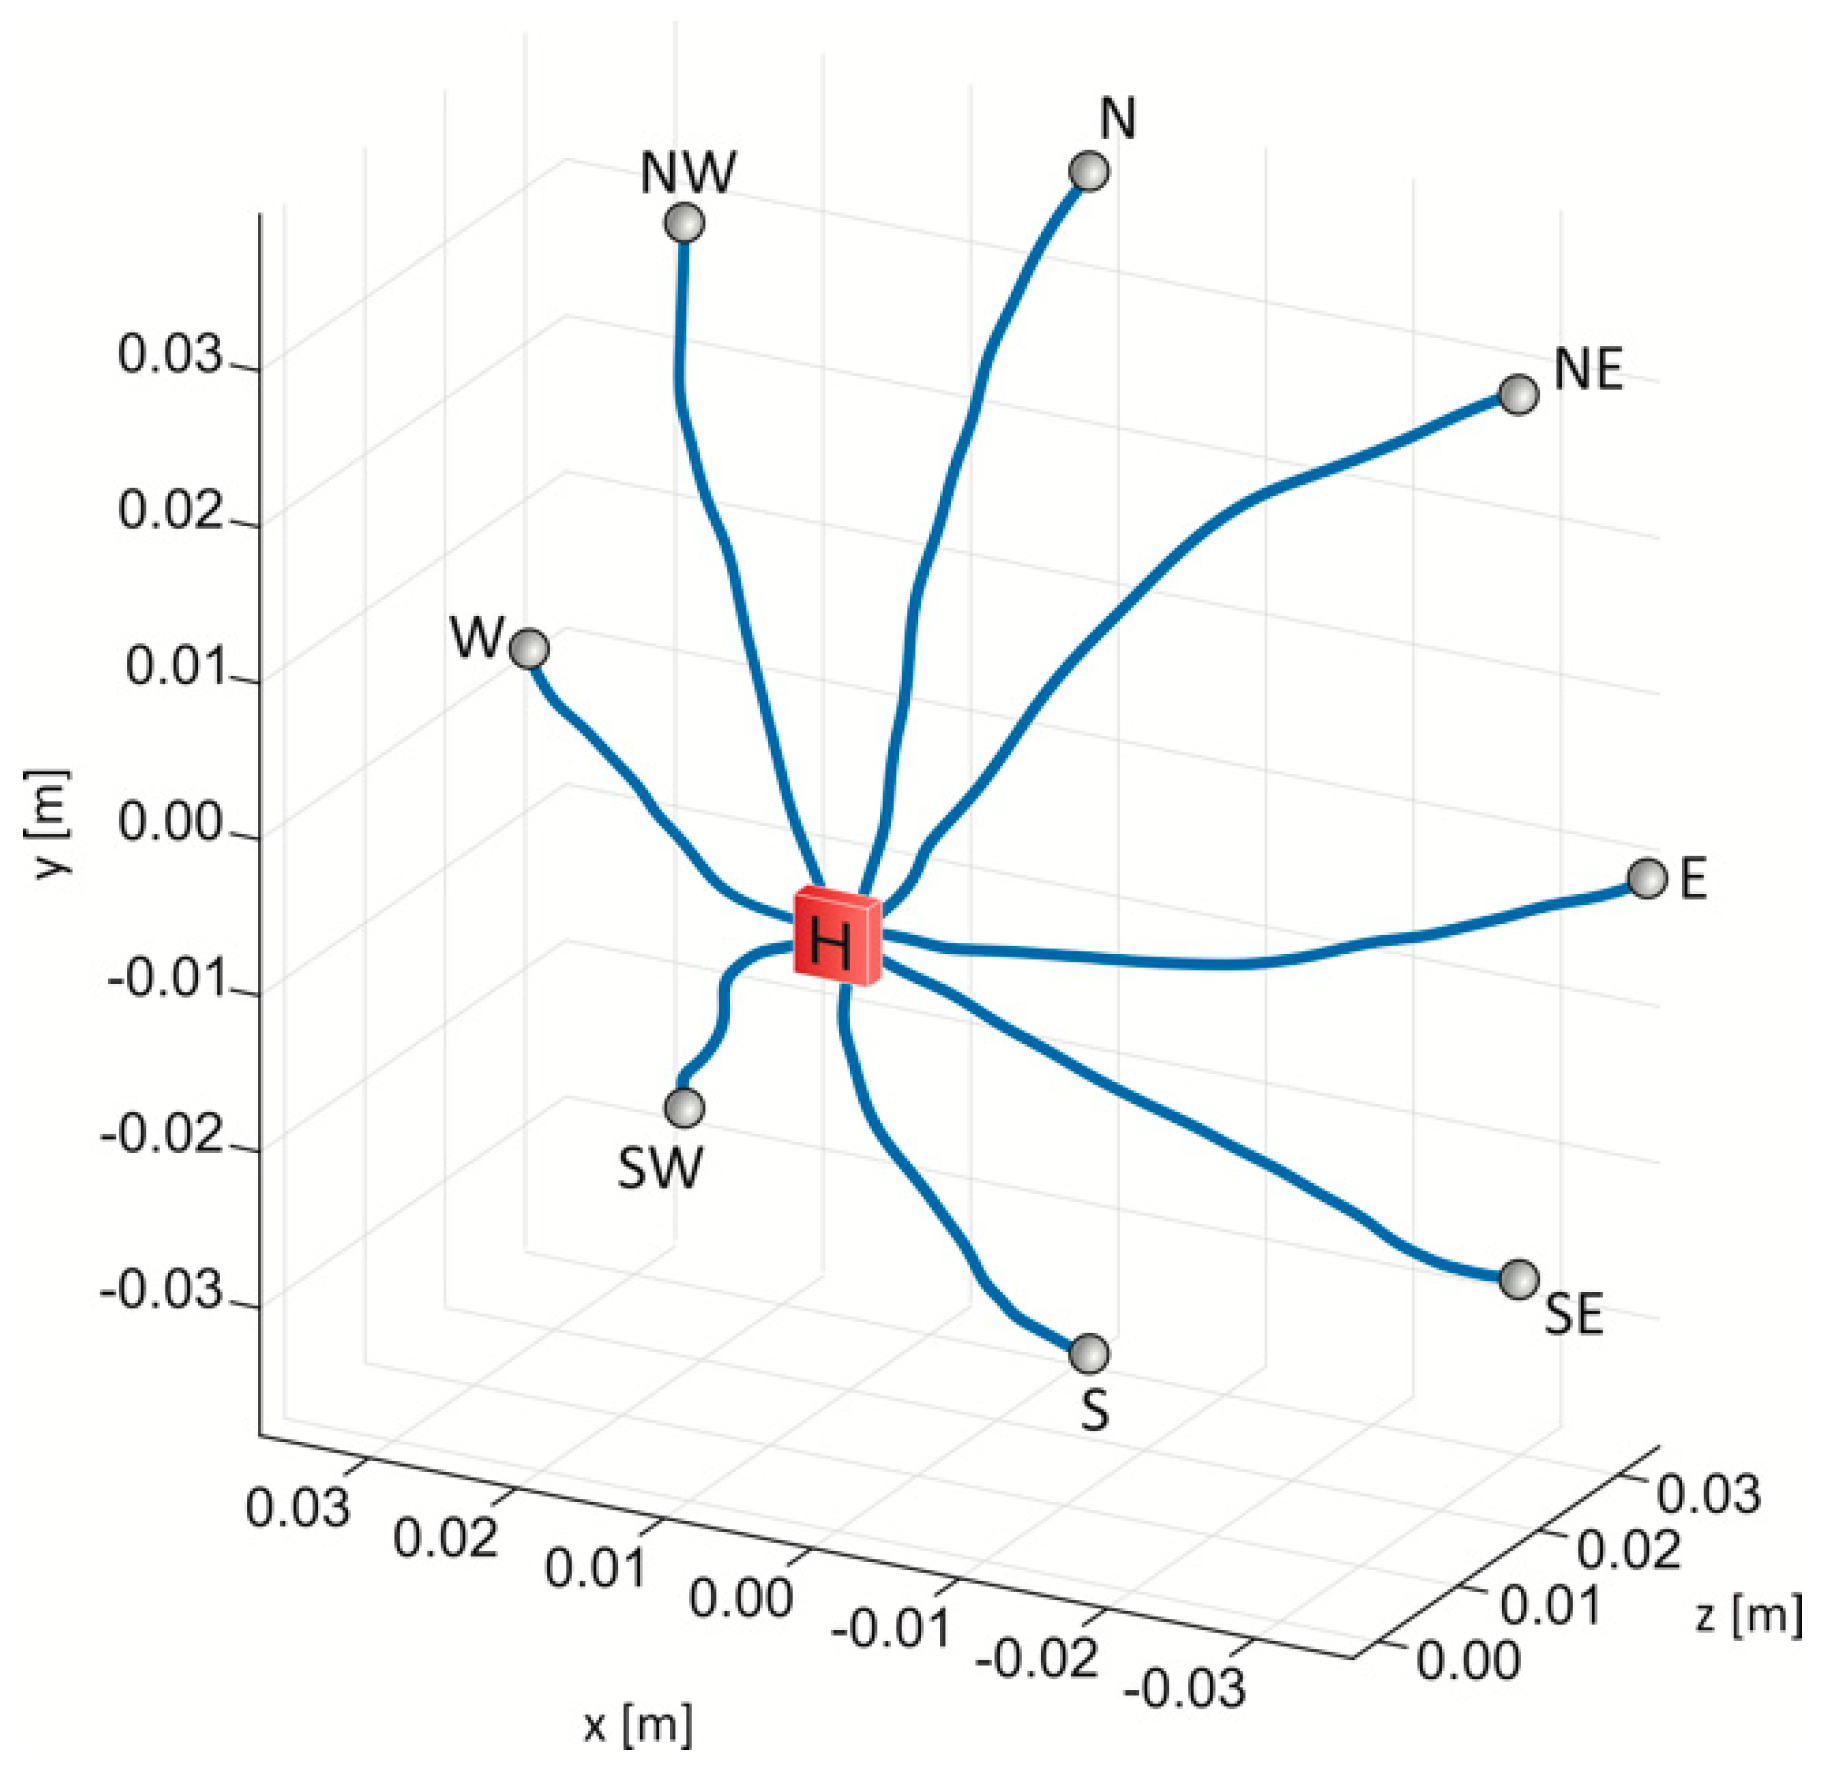
2.1. Experimental Setup and Game Design

The experimental setup consisted of a 3D haptic interface (Novint Falcon, Washington, PA, USA) and a game scenario that was developed using the Unity3D game engine.
The Novint Falcon is a delta robot and its end-effector can translate to a workspace of 101.6 mm × 101.6 mm × 101.6 mm, while rotations are not allowed. The Falcon can deliver forces up to 8.8 N, controllable in amplitude and direction. Forces were generated by three DC brushed motors, with each one mounted on the base of one of the three Falcon arms. Each motor was equipped with a linear encoder, which resulted in a spatial resolution of the end-effector position of about 60 μm for each axis. Unity 3D does not natively support the Novint Falcon, so a C++ library was developed and compiled into a dynamic linked library (dll), using the open source library libnifalcon (https://github.com/kbogert/falconunity).
The game scene (Figure 1) was set in outer space and the user, by means of the Falcon, could move a starship positioned on a base (home-base) placed in the origin of the scene.
Eight bases (target bases) were positioned at a depth of 30 mm along the axis perpendicular to the screen plane (Z axis), equidistant along a circumference with a 40 mm radius, in the plane on the screen (XY plane). In each task, the starship was positioned at home-base in the center of the screen. When the experimenter pressed the start button, an asteroid, which represents the target of the reaching movement, randomly appeared in one of the eight target-bases. The user, moving the end-effector of the Falcon, had to reach the target and then return to the home base, as shown in Figure 2. The game ends when 80 targets have been reached. The users can select from 6 levels of force by selecting from the options in the main menu on the second screen: F0 (zero force imposed), F1 (1.0 N), F2 (2.0 N), F3 (3.0 N), F4 (4.0 N) and, F5 (5.0 N). The applied force is opposed to the direction travelled by the starship to reach the target (from the grey dots to the center). Before starting the game, a calibration procedure, in which the end-effector was set to the center of the workspace, was needed to allow the Falcon to move in the scene and the scale of the movement on the screen is 1:100.

2.2. Experimental Protocol

Twenty right-handed healthy adults (ranging in age between 17 and 40 years) were enrolled in the study. The experimental protocol consisted of six reaching sessions to be performed at varying force levels: F0, F1, F2, F3, F4, and F5. During each session, the subject had to move from the center to the target and once the target was hit, they returned to the center. A total of 80 targets were reached by the subject, which were divided in 40 forward (from the home-base to the target-base) and 40 backward (from the target-base to the home-base) movements. The backward movements allowed the subject to return back to the center of the scene (home base) and be ready to perform the next movement. Between two consecutive reaching sessions, a time of 60 s was set to allow the subject to rest. Before starting the data acquisition, the subject completed a session of reaching 80 targets, where no force field was applied, in order to familiarize the subject with the motor task. The entire protocol was repeated across three different sessions, each of which was separated with at least a 24 h break.

2.3. Data Analysis

The position of the end-effector was acquired with a sampling frequency of 50 Hz. The acquired data were processed offline with Matlab (MathWorks, 2012b, Natick, MA, USA). Initially, the position of the end-effector was filtered with a 6th order, zero phase shift low-pass Butterworth filter, with a cut-off frequency of 10 Hz, and then used to obtain speed, acceleration, and jerk. The processed data were divided into 8 reaching movements according to direction: North (N), North-East (NE), East (E), South-East (SE), South (S), South-West (SW), West (W), and North-West (NW). Only forward movements were analyzed. In particular, each movement was assumed to begin when the speed magnitude increased by more than 10% of the peak speed [31]; the movement was assumed to end when the starship hit the target.
To characterize the kinematics of the movement and in particular the ability of the subject to perform the task, the Duration of Movement (T), defined as the time between the onset and the end of the movement [34], was calculated. Balasubramanian et al. [34] indicated the Duration of Movement as an index of recovery since it demonstrated that movements tended to become faster with therapy, and resulted in a decreased duration.
To evaluate the accuracy of the trajectories, the following indices were calculated:
  • The Length Ratio (LR) is the ratio between the path actually travelled by the subject and the ideal one (Lt), i.e., the minimum distance between the centers of the home-base and the target-base [35]:
    LR = dR L t
    where dR is the distance between two consecutive points of the trajectory. Zollo et al. [35] proposed this index to evaluate the gradual performance in a chronic stroke cohort.
  • The Lateral Deviation (LD) is defined as the highest deviation from a straight line connecting the starting and the ending points of the movement trajectory [14]. Masia et al. [14] found that the LD values for a group of children with cerebral palsy, were higher compared to a group of typically developed children.
  • The Aiming Angle (AA) is the angle between the line connecting the starting and ending target, and the line at the starting point to the trajectory point, which is characterized by the maximum peak of velocity. Germanotta et al. [31] found higher values for AA in patients with Friedreich’s Ataxia compare to a healthy control group. Higher values of LR, LD and AA represent a reaching task performed with a lower accuracy [34].
The smoothness of the trajectories was evaluated with the following indices:
  • The Speed Metric (SM) is measured as the ratio between the mean velocity and the peak of velocity [36]:
    SM = v mean v peak
    The SM value increases when movement smoothness increases. Roher et al. [36] used the SM to quantify the movement smoothness changes during post-stroke recovery.
  • The Normalized Jerk (NJ), as proposed by Teulings et al. [37]:
    NJ = 1 2 j 2 T 5 ( dR ) 2 dt
    where j is the jerk, i.e., the derivative of acceleration and T is the duration of the movement. Lower values of NJ indicate smoother movements. Teulings et al. [37] evaluated the motor performance for a group of patients suffering from Parkinson’s disease using the NJ.

2.4. Statistical Analysis

After calculating the indices, coefficients of variation (CV) were calculated to study the intra-subject variability of the protocol. In particular, CV was calculated for each daily repetition as a percentage ratio between the standard deviation and the average value of each index, considering each direction, each force level, and each subject. Successively, the Intra-class correlation coefficient (ICC) was calculated in order to assess the reliability of the parameters, with an ICC (2, k) model. Additionally, the ICC was calculated for each subject, repetition, force level and movement direction. Reliability was classified as excellent (ICC ≥ 0.90), very good (ICC ≥ 0.80), good (ICC ≥ 0.70), moderate (ICC ≥ 0.60) or poor otherwise [31]. Ultimately, two-way repeated measures ANOVA tests were performed for all indices in order to determine the statistical differences across the 6 levels of force and the 8 directions of the reaching task. Therefore, forces and directions were considered as independent variables. The Greenhouse-Geisser correction was adopted if the assumption of sphericity was violated. If the interaction effects were significant, the interactions comparing force levels were broken down at each direction with one-way repeated measurements ANOVA. A Bonferroni’s test for multiple comparisons was performed when statistical differences were found. A statistical analysis was performed using SPSS (IBM, Armonk, NY, USA). The statistical power of the analysis was computed using G* power.

3. Results

3.1. Repeatability and Reliability of the Protocol

Means and standard deviations of the CV were evaluated among forces, directions, and the subjects were reported for each index and each repetition, as noted in Table 1.
Looking at the results, among the accuracy indices, the Length Ratio was the least variable index since the maximum CV was equal to 8.3%. A greater variability was instead associated with the computed CV for Aiming Angle, which was equal to 46%. Considering the smoothness indices, the variability associated with Speed Metric was lower (14.5% in the worst case) than the variability related to the Normalized Jerk (42.4% in the worst case).
Means and standard deviations for the ICC were calculated for each index among forces, directions, repetitions and subjects and are also reported in Table 1. The ICC value related to the Duration of Movement was equal to 0.82, indicating a good reliability for this index. Comparing the accuracy indices (LR, LD, and AA), all of the indices showed good reliability (ICC > 0.80), while the Length Ratio was the most reliable index (ICC = 0.86). Regarding the indices of smoothness, the Speed Metric showed good reliability (ICC = 0.77), and it was more reliable than Normalized Jerk (ICC = 0.65), which showed moderate reliability.

3.2. Evaluation of Motor Performance

The outcomes of power statistical analysis showed a mean power value of about 81% for both independent variables, i.e., direction and force, with a medium effect size (0.5) [38]. Mean values among subjects and repetitions of temporal, accuracy and smoothness indices for each force and each direction are reported in Figure 3, Figure 4 and Figure 5 respectively. ANOVA results are also reported in each figure.
Looking at the Duration of Movement index (Figure 3), we can note that differences occurred across directions (p < 0.01) and that no differences occurred among the forces. In particular, the trajectories in N direction occurred with lower Duration of Movement values than the others. The W, NW, NE and E trajectories had similar duration values, and the S, SW and SE trajectories displayed higher values of Duration of Movement.
Regarding the indices of smoothness (Figure 4), Speed Metric showed statistical differences across directions (p < 0.01) and forces (p < 0.01). Since the interaction effect was significant (p < 0.01), force amplitudes at each direction and directions at each force level were compared by means of one-way repeated measurements ANOVA tests. Initially, the directions were fixed and the forces were considered as independent variables. From the results, it emerged that differences occurred among forces for all directions.
In particular, the greatest differences among force field amplitudes were found for W, S, SW, SE and E trajectories, especially between the lower force fields (F0, F1, and F2) and the higher ones (F3, F4, F5). Considering directions as the independent variable, differences occurred for all of the force fields, with the exception of F2. More specifically, the tasks in which the largest number of differences between directions occurred were F0 and F5. Looking at the results of the Normalized Jerk, statistical differences were found across movement directions (p < 0.01) and forces (p < 0.02), and the interaction factor was significant (p = 0.04). Considering force as an independent variable, differences between F0 and the other force levels were found for W, S, SW and SE. Considering direction as an independent variable, differences were noted between trajectories in the upper quadrant and those in the lower one for all the force levels.
Regarding the accuracy indices (Figure 5), statistical differences for Length Ratio were found in movement directions (p < 0.01) and forces (p < 0.01). The trajectories in N, NW and NE directions showed lower values of Length Ratio than the others. The highest values of Length Ratio were found in the S trajectories. W, SW, and SE showed similar values of Length Ratio. Focusing on force amplitude, Length Ratio values were lower in the trajectories performed without a force field than in the trajectories with a force field F1. Focusing on Lateral Deviation, statistical differences were recorded among movement directions (p < 0.01) and forces (p = 0.02). The trajectories performed with lower values of Lateral Deviation were those in the N direction. In contrast, S, SW and SE were characterized by the highest values of Lateral Deviation. Considering variations across force fields, a statistical difference was observed between F0 and F1. In terms of Aiming Angle, differences were found across movement directions (p < 0.01). More specifically, Aiming Angle was lower in N, NW, and NE directions than in other directions.

4. Discussion

This study proposes a new protocol that is based on the use of virtual reality, integrated with a portable haptic device, to evaluate motion performance during perturbed 3D reaching tasks. The reliability and repeatability of the protocol have been validated using kinematic indices, which evaluate motor performance during reaching tasks. Thus, we have identified how different force amplitudes and different reaching directions affected the kinematic indices and, more generally, the motor performance of healthy subjects.

4.1. Repeatability and Reliability of the Protocol

The repeatability of the kinematic indices was studied by means of the CV, and evaluated for everyday repetitive tasks. By examining the results reported in Table 1, it is evident that the variability of Duration of Movement decreased over a number of days, indicating that the subjects became more familiar with the motor tasks and, consequently, required less time to complete the protocol. In relation to the accuracy indices, the Length Ratio was the most repeatable and therefore more suitable than LD and AA for evaluating trajectory accuracy. The high values of Lateral Deviation and Aiming Angle variability across all three days of repeating the protocol are in line with [31]; a higher standard deviation of Lateral Deviation and Aiming Angle was reported than the Length Ratio on a group of 18 healthy subjects, who performed planar reaching movements. This finding could be attributed to the different mathematical definition of the indices. In particular, while Lateral Deviation and Aiming Angle are calculated on a specific point of the trajectory, i.e., when the maximum deviation from the ideal trajectory (LD) and the peak of velocity (AA) are reached during the motor task, the Length Ratio is defined considering the entire trajectory. Unexpected rapid variations in movement performed by subjects can generate outlier values, primarily for the first two indices, thereby causing an increase in their variability (CV). Therefore, Length Ratio should be preferred as a parameter for evaluating overall accuracy of trajectory. The variability of Length Ratio and Lateral Deviation decreased during the repeated exercises, thereby indicating an improvement in the execution of the tasks over time. Considering the smoothness indices, the Speed Metric appeared to be more robust than Normalized Jerk, which showed a significant intra-subject variability across repetitions. Furthermore, it should be noted that for temporal and accuracy indices, the variability associated with Speed Metric and Normalized Jerk declined over time, thereby confirming the subject’s growing familiarization with the protocol.
Regarding the reliability of the evaluated indices, all of the indices showed consistency. In particular, the most suitable indices for assessing motor performance were Duration of Movement for duration, Length Ratio for accuracy, and Speed Metric for smoothness. These ICC values are slightly lower than the ones reported by [31]. These dissimilarities could be ascribed to the different reaching movements performed by subjects in the two experimental protocols. More specifically, subjects in [31] performed unperturbed planar reaching movements, while in our study subjects performed 3D reaching movements in a perturbing force field and it is reasonable to consider that the application of the force field lead to more variable trajectories between the tasks. However, all of the aforementioned indices demonstrated reliability and are therefore suitable for evaluating motor performance for the proposed protocol.
In conclusion, the proposed protocol appears to be repeatable and reliable, thereby suggesting that the use of Movement Duration, Length Ratio and Speed Metric are suitable for evaluating the motor performance of subjects during perturbed reaching tasks.

4.2. Is the Movement Performance Influenced by an Increase in Force Field Magnitude?

Considering the Duration of Movement, a statistical analysis indicates that there were no differences among the forces. However, although the complexity of the motor task increased, due to an increase in the force opposing the subject’s movements, the time needed to reach the targets did not change. This effect reflects the subject’s effort to respond to real-time force feedback by exerting a continuous and fine regulation of the end-effector position in order to perform fast and efficient movements that can compensate for unknown external loads [4]. By analyzing how the force magnitude influences the trajectory accuracy, it was clear that the results for Length Ratio and Lateral Deviation were similar. More specifically, the subject’s movements were affected by the unknown perturbation when the force field was introduced at the minimum level of magnitude (F1). With increasing levels of force (from F2 to F5), subjects were able to respond to the force feedback, thereby optimizing their trajectory accuracy and could adapt their movement to different environments. These findings are well in line with those from [39], who found that all subjects showed a similar hand path even if different weights were attached to the subject’s wrist during reaching tasks. More precisely, only the first movement, after the load change, followed a distinctly different path. Considering the Aiming Angle index, no differences across the forces were found. This could be a result of the insignificant intrinsic variability of Aiming Angle index, as it emerged from the CV values, which completely overlapped the differences between F0 and F1 and highlighted by both Length Ratio and Lateral Deviation.
Considering the smoothness of the trajectories, evaluated by means of Speed Metric and Normalized Jerk, a large number of differences between the varied force tasks occurred in the lower quadrant and in the W and E directions. In particular, Speed Metric indicated that the smoothness of movement decreased as the force increased. This result corroborates with the findings of [39], which showed a dependency between speed of movement and the magnitude of the applied force. Since the Speed Metric depends on velocity, a variation in speed of movement leads to a variation of movement smoothness. To summarize, healthy subjects respond to variations in force magnitude with movements of similar duration, promptly adapting accuracy of movement as soon as the force field application occurs, and, subsequently, decreasing the smoothness with an increase in force level. In fact, subjects perceive the changes as soon as the field is applied and he is able to compensate for these changes very quickly, in terms of duration and accuracy, but not in terms of smoothness. Finally, in order to perform perturbed reaching movements, subjects prefer to optimize the duration and accuracy of trajectories in response to the smoothness.

4.3. Do Movement Directions Influence Motor Performance?

In reference to the direction of movement, all of the indices showed the same results. In particular, when focusing on the time needed to perform the reaching task, subjects were able to reach the N target in the shortest time and, in general terms, the movement performed in the upper quadrant required less time to be completed. In terms of accuracy and smoothness of movement, results indicate that the trajectories made in the upper quadrant were smoother and more accurate than the other movements. These results are in line with [14], where subjects performed planar reaching tasks in a perturbed environment. Specifically, the authors observed an increase in the difference between the path traveled by the subject and the ideal path, especially in the directions of movement in which the subject primarily perceived inertial effect of the robotic device. Our results have also confirmed the outcomes of [40,41], whereby the authors inferred that the movement anisotropy of the human arm, i.e., having different dynamical behavior in a different direction of measurement, is responsible for a directional variability of movement kinematics in healthy subjects. Furthermore, the magnitude of the distance between the ideal trajectory and the actual one varies as subjects move in different directions, while experiencing the same structured force field.
Considering the smoothness indices, small differences occurred between W and E. In particular, subjects were more capable of compensating for different force fields in the E direction with respect to the W one. This is probably because all of the subjects were right-handed. Comparing the effects of the directions of movement with the effects of the different force fields, the change in the kinematics over the eight directions, suggests that the subjects were able to balance the force field performing straight trajectories, but were not able to control the inertial anisotropy of the upper limb.

5. Conclusions

In this paper, a new protocol has been proposed, which is based upon the use of virtual reality and a portable haptic device for tele-rehabilitation to evaluate movement performance during perturbed 3D reaching tasks. More specifically, the protocol consisted of several tasks with increasing levels of difficulty, which can aid in the assessment of functional recovery to impaired upper limbs. We validated our protocol by using the most widely kinematic indices to evaluate motor performance in reaching tasks. As a result, Duration of Movement, Length Ratio and Speed Metric have shown less variability, yet proving to be the most reliable kinematic indices. Therefore, these indices are the most suitable for assessing kinematic performance during the reaching tasks contained in this proposed protocol. Considering the different force fields, subjects were able to optimize trajectory in terms of duration and accuracy but not in terms of smoothness during perturbed reaching tasks. In terms of direction of movement, the best motor performance occurs when the movement trajectories were performed using the upper quadrant, compared to those exhibited by the lower quadrant, which indicates that subjects were not able to control the inertial anisotropy of the upper limbs.
This study sought to evaluate the potential use of the Novint Falcon and the proposed protocol for motor performance assessment on healthy subjects. Before testing the protocol on subjects affected by neurological disorders, our goal was to quantify the variability of the data gathered from a healthy population to assess the viability of our protocol while identifying reliable motor performance indices. The encouraging results obtained suggest the need for future testing of the protocol on a population with neuro-motor disorders and, ultimately comparing these acquired results with those of healthy subjects so as to monitor the progress of the therapy and the state of recovery during rehabilitation. The device and the proposed protocol will be useful in the sub-acute phase, thereby enabling patients to continue their rehabilitation therapy in a domestic environment.

Author Contributions

Conceptualization, E.S. and S.R.; Data curation, E.S. and S.R.; Formal analysis, E.S. and S.R.; Funding acquisition, E.P.; Investigation, E.S. and D.H.; Methodology, E.S., D.H., E.P. and S.R.; Project administration, S.R.; Resources, E.P.; Software, E.S., D.H. and E.P.; Supervision, Z.D.P. and S.R.; Validation, Z.D.P.; Visualization, Z.D.P.; Writing-original draft, E.S., D.H. and S.R.; Writing-review & editing, E.S., Z.D.P., E.P. and S.R.

Funding

This research received no external funding.

Conflicts of Interest

The authors declare no conflict of interest.

References

  1. Mang, C.S.; Campbell, K.L.; Ross, C.J.D.; Boyd, L.A. Promoting Neuroplasticity for Motor Rehabilitation After Stroke: Considering the Effects of Aerobic Exercise and Genetic Variation on Brain-Derived Neurotrophic Factor. Phys. Ther. 2018, 93, 1707–1716. [Google Scholar] [CrossRef] [PubMed]
  2. You, S.; Jang, S.; Kim, H.Y.; Hallett, M.; Ahn, S.; Kwon, Y.; Kim, H.J.; Lee, M. Virtual Reality–Induced Cortical Reorganization and Associated Locomotor Recovery in Chronic Stroke. Stroke 2005, 36, 1166–1171. [Google Scholar] [CrossRef] [PubMed]
  3. Pacilli, A.; Germanotta, M.; Rossi, S.; Cappa, P. Quantification of age-related differences in reaching and circle-drawing using a robotic rehabilitation device. Appl. Bionics Biomech. 2014, 11, 91–104. [Google Scholar] [CrossRef]
  4. Cappa, P.; Clerico, A.; Nov, O.; Porfiri, M. Can Force Feedback and Science Learning Enhance the Effectiveness of Neuro-Rehabilitation? An Experimental Study on Using a Low-Cost 3D Joystick and a Virtual Visit to a Zoo. PLoS ONE 2013, 8, e83945. [Google Scholar] [CrossRef] [PubMed]
  5. Li, Y.; Kaber, D.B.; Tupler, L.; Lee, Y.-S. Haptic-based Virtual Environment Design and Modeling of Motor Skill Assessment for Brain Injury PatientsRehabilitation. Comput. Aided Des. Appl. 2011, 8, 149–162. [Google Scholar] [CrossRef] [Green Version]
  6. Muhanna, M.A. Virtual reality and the CAVE: Taxonomy, interaction challenges and research directions. J. King Saud Univ. Comput. Inf. Sci. 2015, 27, 344–361. [Google Scholar] [CrossRef]
  7. Scalona, E.; Hayes, D.; Palermo, E.; Del Prete, Z.; Rossi, S. Performance Evaluation of 3D Reaching Tasks Using a Low-cost Haptic Device and Virtual Reality. In Proceedings of the 2017 IEEE International Symposium on Haptic, Audio and Visual Environments and Games (HAVE), Abu Dhabi, UAE, 22–23 October 2017. [Google Scholar]
  8. Alamri, A.; Eid, M.; Iglesias, R.; Shirmohammadi, S.; Saddik, A. El Haptic Virtual Rehabilitation Exercises for Post- stroke Diagnosis. IEEE Trans. Instrum. Meas. 2007, 57, 1–10. [Google Scholar]
  9. Ramaprabha, T.; Sathik, M. The Efficiency Enhancement in Non Immersive Virtual Reality System by Haptic Devices. Int. J. Adv. Res. Comput. Sci. 2012, 2, 1–5. [Google Scholar]
  10. Leonardis, D.; Solazzi, M.; Bortone, I.; Frisoli, A. A 3-RSR Haptic Wearable Device for Rendering Fingertip Contact Forces. IEEE Trans. Haptics 2017, 10, 305–316. [Google Scholar] [CrossRef]
  11. Frisoli, A.; Solazzi, M.; Salsedo, F.; Bergamasco, M. A Fingertip Haptic Display for Improving Curvature Discrimination. Presence Teleoperators Virtual Environ. 2008, 17, 550–561. [Google Scholar] [CrossRef]
  12. Igo Krebs, H.; Hogan, N.; Aisen, M.L.; Volpe, B.T. Robot-aided neurorehabilitation. IEEE Trans. Rehabil. Eng. 1998, 6, 75–87. [Google Scholar] [CrossRef] [Green Version]
  13. Lo, A.C.; Guarino, P.D.; Richards, L.G.; Haselkorn, J.K.; Wittenberg, G.F.; Federman, D.G.; Ringer, R.J.; Wagner, T.H.; Krebs, H.I.; Volpe, B.T.; et al. Robot-assisted therapy for long-term upper-limb impairment after stroke. N. Engl. J. Med. 2010, 362, 1772–1783. [Google Scholar] [CrossRef]
  14. Masia, L.; Frascarelli, F.; Morasso, P.; Di Rosa, G.; Petrarca, M.; Castelli, E.; Cappa, P. Reduced short term adaptation to robot generated dynamic enviroment in children affected by Cerebral Palsy. J. Neuroeng. Rehabil. 2011, 8, 28. [Google Scholar] [CrossRef] [PubMed]
  15. Lum, P.S.; Burgar, C.G.; Van der Loos, M.; Shor, P.C.; Majmundar, M.; Yap, R. MIME robotic device for upper-limb neurorehabilitation in subacute stroke subjects: A follow-up study. J. Rehabil. Res. Dev. 2006, 43, 631–642. [Google Scholar] [CrossRef] [PubMed]
  16. Amirabdollahian, F.; Loureiro, R.; Gradwell, E.; Collin, C.; Harwin, W.; Johnson, G. Multivariate analysis of the Fugl-Meyer outcome measures assessing the effectiveness of GENTLE/S robot-mediated stroke therapy. J. Neuroeng. Rehabil. 2007, 4, 4. [Google Scholar] [CrossRef] [PubMed]
  17. Bovolenta, F.; Goldoni, M.; Clerici, P.; Agosti, M.; Franceschini, M. Robot therapy for functional recovery of the upper limbs: A pilot study on patients after stroke. J. Rehabil. Med. 2009, 41, 971–975. [Google Scholar] [CrossRef] [Green Version]
  18. Basteris, A.; Nijenhuis, S.M.; Stienen, A.H.A.; Buurke, J.H.; Prange, G.B.; Amirabdollahian, F. Training modalities in robot-mediated upper limb rehabilitation in stroke: A framework for classification based on a systematic review. J. Neuroeng. Rehabil. 2014, 11, 111. [Google Scholar] [CrossRef] [PubMed]
  19. Viau, A.; Feldman, A.G.; McFadyen, B.J.; Levin, M.F. Reaching in reality and virtual reality: A comparison of movement kinematics in healthy subjects and in adults with hemiparesis. J. Neuroeng. Rehabil. 2004, 1, 11. [Google Scholar] [CrossRef]
  20. Gouveia, D.; Lopes, D.; De Carvalho, C.V. Serious Gaming for Experiential Learning. In Proceedings of the 41st ASEE/IEEE Frontiers in Education Conference, Rapid City, SD, USA, 12–15 October 2011; pp. 1–6. [Google Scholar]
  21. Silva, A.J.; Ramirez, O.A.D.; Vega, V.P.; Oliver, J.P.O. PHANToM OMNI Haptic Device: Kinematic and Manipulability. In Proceedings of the 2009 Electronics, Robotics and Automotive Mechanics Conference (CERMA), Cuernavaca, Mexico, 22–25 September 2009; pp. 193–198. [Google Scholar]
  22. Rodet, X.; Lambert, J.; Gaudy, T.; Gosselin, F. Study of haptic and visual interaction for sound and music control in the Phase project. In Proceedings of the 2005 Conference on New Interfaces for Musical Expression, Vancouver, BC, Canada, 26–28 May 2005; pp. 109–114. [Google Scholar]
  23. Ferreira, A.; Mavroidis, C. Virtual reality and haptics for nanorobotics. IEEE Robot. Autom. Mag. 2006, 13, 78–92. [Google Scholar] [CrossRef]
  24. Martin, S.; Hillier, N. Characterisation of the Novint Falcon Haptic Device for Application as a Robot Manipulator. In Proceedings of the Australasian Conference on Robotics and Automation (ACRA), Sydney, Australia, 2–4 December 2009. [Google Scholar]
  25. Chortis, A.; Standen, P.J.; Walker, M. Virtual reality system for upper extremity rehabilitation of chronic stroke patients living in the community. In Proceedings of the 7th ICDVRAT with ArtAbilitation, Maia, Portugal, 8–11 September 2008; pp. 221–228. [Google Scholar]
  26. Palsbo, S.E.; Marr, D.; Streng, T.; Bay, B.K.; Norblad, A.W. Towards a modified consumer haptic device for robotic-assisted fine-motor repetitive motion training. Disabil. Rehabil. Assist. Technol. 2011, 6, 546–551. [Google Scholar] [CrossRef]
  27. Loureiro, R.C.V.; Harwin, W.S. Reach & Grasp Therapy: Design and Control of a 9-DOF Robotic Neuro-rehabilitation System. In Proceedings of the 2007 IEEE 10th International Conference on Rehabilitation Robotics, Noordwijk, The Netherlands, 13–15 June 2007; IEEE: Piscataway, NJ, USA, 2007; pp. 757–763. [Google Scholar]
  28. Prange, G.B.; Jannik, M.J.; Groothuis-Oudshoorn, C.G.; Hermens, H.J.; Ijzerman, M.J. Systematic review of the effect of robot-aided therapy on recovery of the hemiparetic arm after stroke. J. Rehabil. Res. Dev. 2006, 43, 171–184. [Google Scholar] [CrossRef] [PubMed]
  29. Scalona, E.; Martelli, F.; Del Prete, Z.; Palermo, E.; Rossi, S. A novel protocol for the evaluation of motor learning in 3D reching tasks using novint falcon. In Proceedings of the 7th IEEE RAS/EMBS International Conference on Biomedical Robotics and Biomechatronics, Enschede, The Netherlands, 27–29 August 2018; pp. 268–272. [Google Scholar]
  30. Scheidt, R.A.; Stoeckmann, T. Reach adaptation and final position control amid environmental uncertainty after stroke. J. Neurophysiol. 2007, 97, 2824–2836. [Google Scholar] [CrossRef] [PubMed]
  31. Germanotta, M.; Vasco, G.; Petrarca, M.; Rossi, S.; Carniel, S.; Bertini, E.; Cappa, P.; Castelli, E. Robotic and clinical evaluation of upper limb motor performance in patients with Friedreich’s Ataxia: An observational study. J. Neuroeng. Rehabil. 2015, 12, 41. [Google Scholar] [CrossRef] [PubMed]
  32. Harwin, B.W.S.; Patton, J.L.; Edgerton, V.R. Challenges and Opportunities for Robot-Mediated Neurorehabilitation. Proc. IEEE 2006, 94, 1717–1726. [Google Scholar] [CrossRef]
  33. Celik, O.; O’Malley, M.K.; Boake, C.; Levin, H.S.; Yozbatiran, N.; Reistetter, T.A. Normalized Movement Quality Measures for Therapeutic Robots Strongly Correlate with Clinical Motor Impairment Measures. IEEE Trans. Neural Syst. Rehabil. Eng. 2010, 18, 433–444. [Google Scholar] [CrossRef] [PubMed]
  34. Balasubramanian, S.; Colombo, R.; Sterpi, I.; Sanguineti, V.; Burdet, E. Robotic Assessment of Upper Limb Motor Function After Stroke. Am. J. Phys. Med. Rehabil. 2012, 91, S255–S269. [Google Scholar] [CrossRef] [PubMed]
  35. Zollo, L.; Gallotta, E.; Guglielmelli, E.; Sterzi, S. Robotic technologies and rehabilitation: New tools for upper-limb therapy and assessment in chronic stroke. Eur. J. Phys. Rehabil. Med. 2011, 47, 223–236. [Google Scholar]
  36. Rohrer, B.; Fasoli, S.; Krebs, H.I.; Hughes, R.; Volpe, B.; Frontera, W.R.; Stein, J.; Hogan, N. Movement smoothness changes during stroke recovery. J. Neurosci. Off. J. Soc. Neurosci. 2002, 22, 8297–8304. [Google Scholar] [CrossRef]
  37. Teulings, H.L.; Contreras-Vidal, J.L.; Stelmach, G.E.; Adler, C.H. Parkinsonism reduces coordination of fingers, wrist, and arm in fine motor control. Exp. Neurol. 1997, 146, 159–170. [Google Scholar] [CrossRef]
  38. Cohen, J. Statistical Power Analysis for the Behavioral Sciences, 2nd ed.; Lawrence Erlbaum Associates: Mahwah, NJ, USA, 1988; ISBN 0805802835. [Google Scholar]
  39. Bock, O. Load compensation in human goal-directed arm movements. Behav. Brain Res. 1990, 41, 167–177. [Google Scholar] [CrossRef]
  40. Hwang, E.J.; Donchin, O.; Smith, M.A.; Shadmehr, R. A gain-field encoding of limb position and velocity in the internal model of arm dynamics. PLoS Biol. 2003, 1, e25. [Google Scholar] [CrossRef] [PubMed]
  41. Gordon, J.; Ghilardi, M.F.; Cooper, S.E.; Ghez, C. Accuracy of planar reaching movements II. Systematic extent errors resulting from inertial anisotropy. Exp. Brain Res. 1994, 99, 112–130. [Google Scholar] [CrossRef] [PubMed]
Figure 1. The game scene on the left and experimental set-up on the right.
Electronics 08 00032 g001
Figure 2. Representation of the 3D trajectories performed by the subjects from the home-base (H) to the 8 different targets (grey dots). The applied forces were always directed from the targets to the home base thereby changing the direction as soon as the subject moved the end effector in a different direction.
Electronics 08 00032 g002
Figure 3. Duration of movement (T): mean values among subjects and repetition for each force and each direction on the left; on the right the two-way ANOVA results: statistical Differences between the direction and between the force. (‘*’ represents p-value < 0.05; ‘**’ represents for p-value < 0.01).
Electronics 08 00032 g003
Figure 4. Speed Metric (SM) and Normalized Jerk (NJ): mean values among subjects and repetition for each force and each direction on the left; the interaction factor was significant and on the right the one-way ANOVA results: differences between the direction and between the force. (‘*’ represents p-value <0.05; ‘**’ represents for p-value <0.01).
Electronics 08 00032 g004
Figure 5. Length Ratio (LR), Lateral Deviation (LD) and Aiming Angle (AA): mean values among subjects and repetition for each force and each direction on the left; on the right the two-way ANOVA results: statistical Differences between the direction and between the force. (‘*’ represents p-value < 0.05; ‘**’ represents for p-value < 0.01).
Electronics 08 00032 g005
Table 1. Mean and standard deviation of CV values for all the indices (Duration of movement (T), Length ratio (LR), Lateral Deviation (LD), Aiming angle (AA), Speed metric (SM), Normalized jerk (NJ)) among forces, directions and subjects, calculated for each day repetition, and Mean and standard deviation of ICC for each index among forces, directions, repetitions and subjects.
CV (%)ICC
Rep1Rep2Rep3
T18.5 (4.1)18.4 (2.6)17.1 (3.8)0.82 (0.03)
LR8.3 (3.3)6.6 (2.5)5.3 (2.3)0.86 (0.02)
LD27.6 (4.4)27.0 (4.7)25.7 (5.2)0.82 (0.02)
AA46.3 (13.7)46.0 (12.9)46.0 (12.9)0.80 (0.02)
SM14.5 (2.0)13.5 (2.9)12.0 (2.4)0.77 (0.05)
NJ42.4 (10.9)42.0 (5.2)38.8 (8.6)0.65 (0.07)

