Next Article in Journal
A Plug and Play IoT Wi-Fi Smart Home System for Human Monitoring
Next Article in Special Issue
Correction: Billeci, L.; et al. Automatic Detection of Atrial Fibrillation and Other Arrhythmias in ECG Recordings Acquired by a Smartphone Device. Electronics 2018, 7, 199
Previous Article in Journal
Antenna Mutual Coupling Suppression Over Wideband Using Embedded Periphery Slot for Antenna Arrays
Previous Article in Special Issue
Cost-Effective eHealth System Based on a Multi-Sensor System-on-Chip Platform and Data Fusion in Cloud for Sport Activity Monitoring
 
 
Correction published on 12 October 2018, see Electronics 2018, 7(10), 248.
Article

Automatic Detection of Atrial Fibrillation and Other Arrhythmias in ECG Recordings Acquired by a Smartphone Device

1
Institute of Clinical Physiology, National Research Council of Italy, via Moruzzi 1, 56124 Pisa, Italy
2
Cardioline S.p.A., via Linz 19-21-21, 38121 Spini di Gardolo (TN), Italy
3
Dedalus S.p.A. Via Gaetano Malasoma, 24, 56121 Pisa, Italy
*
Author to whom correspondence should be addressed.
Electronics 2018, 7(9), 199; https://doi.org/10.3390/electronics7090199
Submission received: 9 August 2018 / Revised: 6 September 2018 / Accepted: 14 September 2018 / Published: 16 September 2018
(This article belongs to the Special Issue Data Processing and Wearable Systems for Effective Human Monitoring)

Abstract

:
Atrial fibrillation (AF) is the most common cardiac disease and is associated with other cardiac complications. Few attempts have been made for discriminating AF from other arrhythmias and noise. The aim of this study is to present a novel approach for such a classification in short ECG recordings acquired using a smartphone device. The implemented algorithm was tested on the Physionet Computing in Cardiology Challenge 2017 Database and, for the purpose of comparison, on the MIT-BH AF database. After feature extraction, the stepwise linear discriminant analysis for feature selection was used. The Least Square Support Vector Machine classifier was trained and cross-validated on the available dataset of the Challenge 2017. The best performance was obtained with a total of 30 features. The algorithm produced the following performance: F1 Normal rhythm = 0.92; F1 AF rhythm: 0.82; F1 Other rhythm = 0.75; Global F1 = 0.83, obtaining the third best result in the follow-up phase of the Physionet Challenge. On the MIT-BH ADF database the algorithm gave the following performance: F1 Normal rhythm = 0.98; F1 AF rhythm: 0.99; Global F1 = 0.98. Since the algorithm reliably detect AF and other rhythms in smartphone ECG recordings, it could be applied for personal health monitoring systems.

1. Introduction

Atrial fibrillation (AF) is the most common cardiac arrhythmia and is associated with several complications. According to the Global Burden of Disease, the prevalence of AF is of 33.5 million persons, affecting 2.5% to 3.2% of population worldwide [1]. Several studies suggest a rising prevalence and incidence of AF; it is expected that AF will affect 6–12 million people in the USA by 2050 and 17.9 million in Europe by 2060 [2]. Possible causes of this rise are enhanced detection, increasing ageing of the population, and lifestyle changes [3,4]. AF is associated with increased cardiovascular problems, especially stroke and heart failure, as well as increased mortality [5]. Thus, the detection of AF is helpful to prevent subsequent complications.
Academia and industry have responded to this need with an increase in research and development regarding devices and studies to widen the choices for screening and monitoring AF.
The traditional cardiac monitoring technologies for AF detection, like the Holter device, have one or more drawbacks that limit the application of signal monitoring outside the clinics, including laborious workflow, the need for specialized staff trained in arrhythmia detection, poor patient compliance, cost, and invasiveness. Recently, ECG data have been collected using novel developed technologies, including single-lead ECG adhesive sensors, implantable loop recorders, smartphone attachments, and wearables [6]. Recent advances in these wearable and point of care devices could potentially allow the detection of AF episodes outside of clinical settings in an easy and cost-effective way. Importantly, the computational power and the storage capacity of these devices allow the execution of complex algorithms in real time, making possible the online detection of AF or other cardiac episodes using stand-alone applications at home.
Different approaches have been adopted so far for AF detection, mainly using traditional technologies. These approaches consist in inter-beat (RR) intervals analysis [7,8], time-frequency analysis of ECG [9,10], analysis based on P wave absence (PWA) and frequency spectrum analysis (FSA) [11,12]. Algorithms based on P waves have a low performance in the presence of noise as these waves are prone to contamination with motion and noise artefacts [13]. Thus, most of the more recent approaches for AF detection are based on RR analysis. However, some algorithms have been developed combining RR analysis and analysis of PWA and/or FSA, to enhance detection performance [14,15,16]. Moreover, to improve accuracy and specificity in AF detection, several pattern recognition approaches have been recently proposed including neural networks [17,18]. In particular, the Support Vector Machine (SVM), a non-parametric classifier, has been employed as it gives promising results in various medical diagnostics [19] including AF detection [20,21].
One of the major limitations of the algorithms available to date is that they are usually aimed only at distinguishing AF from normal rhythms and not from the other arrhythmias. Very few attempts have been made in this direction. Carrara et al. [22] applied a K-NN (K-Nearest Neighborhood) to classify AF, normal sinus rhythm (NSR) and sinus rhythm (SR) with frequent ectopy, using entropy, local dynamics, and fractal scaling. The authors achieved high performance on their own database of 2722 patients with 24 h ECG recordings (AF: 97%, NSR: 98% and SR with ectopy: 90%). The authors also tested the algorithm on MIT–BIH databases obtaining lower performance for SR with ectopy (40%) thus suggesting that dynamical measures did not distinguish atrial from ventricular ectopy [23]. Entropy estimation was also applied to distinguish AF from ventricular tachycardia/ventricular fibrillation obtaining an accuracy of 98% [24]. Up to now, none of the published studies have tested a wide set of arrhythmias to evaluate how accurately they can be discriminated from AF.
Recently, the Physionet/Computing in Cardiology Challenge 2017 encouraged the development of algorithms to classify single short ECG lead recordings, as NSR, AF, other rhythm, or too noisy to be classified [25]. Notably, these recordings are obtained using a point of care device, AliveCorTM, a novel smartphone connected ECG device coupled with an application to record and diagnose the ECG, which was previously demonstrated to provide an accurate and sensitive single-lead ECG diagnosis of AF [26,27].
In this paper, we propose a novel approach for the classification of single-lead short ECG recording as AF, normal rhythms, other type of rhythms and noise, by combining the three most important characteristics of AF, i.e., RR, PWA and FSA features. A multi-class SVM was then applied, for a robust classification. The proposed approach was tested on the Physionet Computing in Cardiology Challenge 2017 database [28]. The developed code was submitted to the Physionet Open-Source Challenge call and is available for download (https://www.physionet.org/challenge/2017/sources/). For the sake of comparison, the algorithm was also tested on the MIT-BIH AF database (AFDB), consisting in long-term ECG signals acquired using ambulatory ECG recorders, although in this database only AF and NSR are annotated.

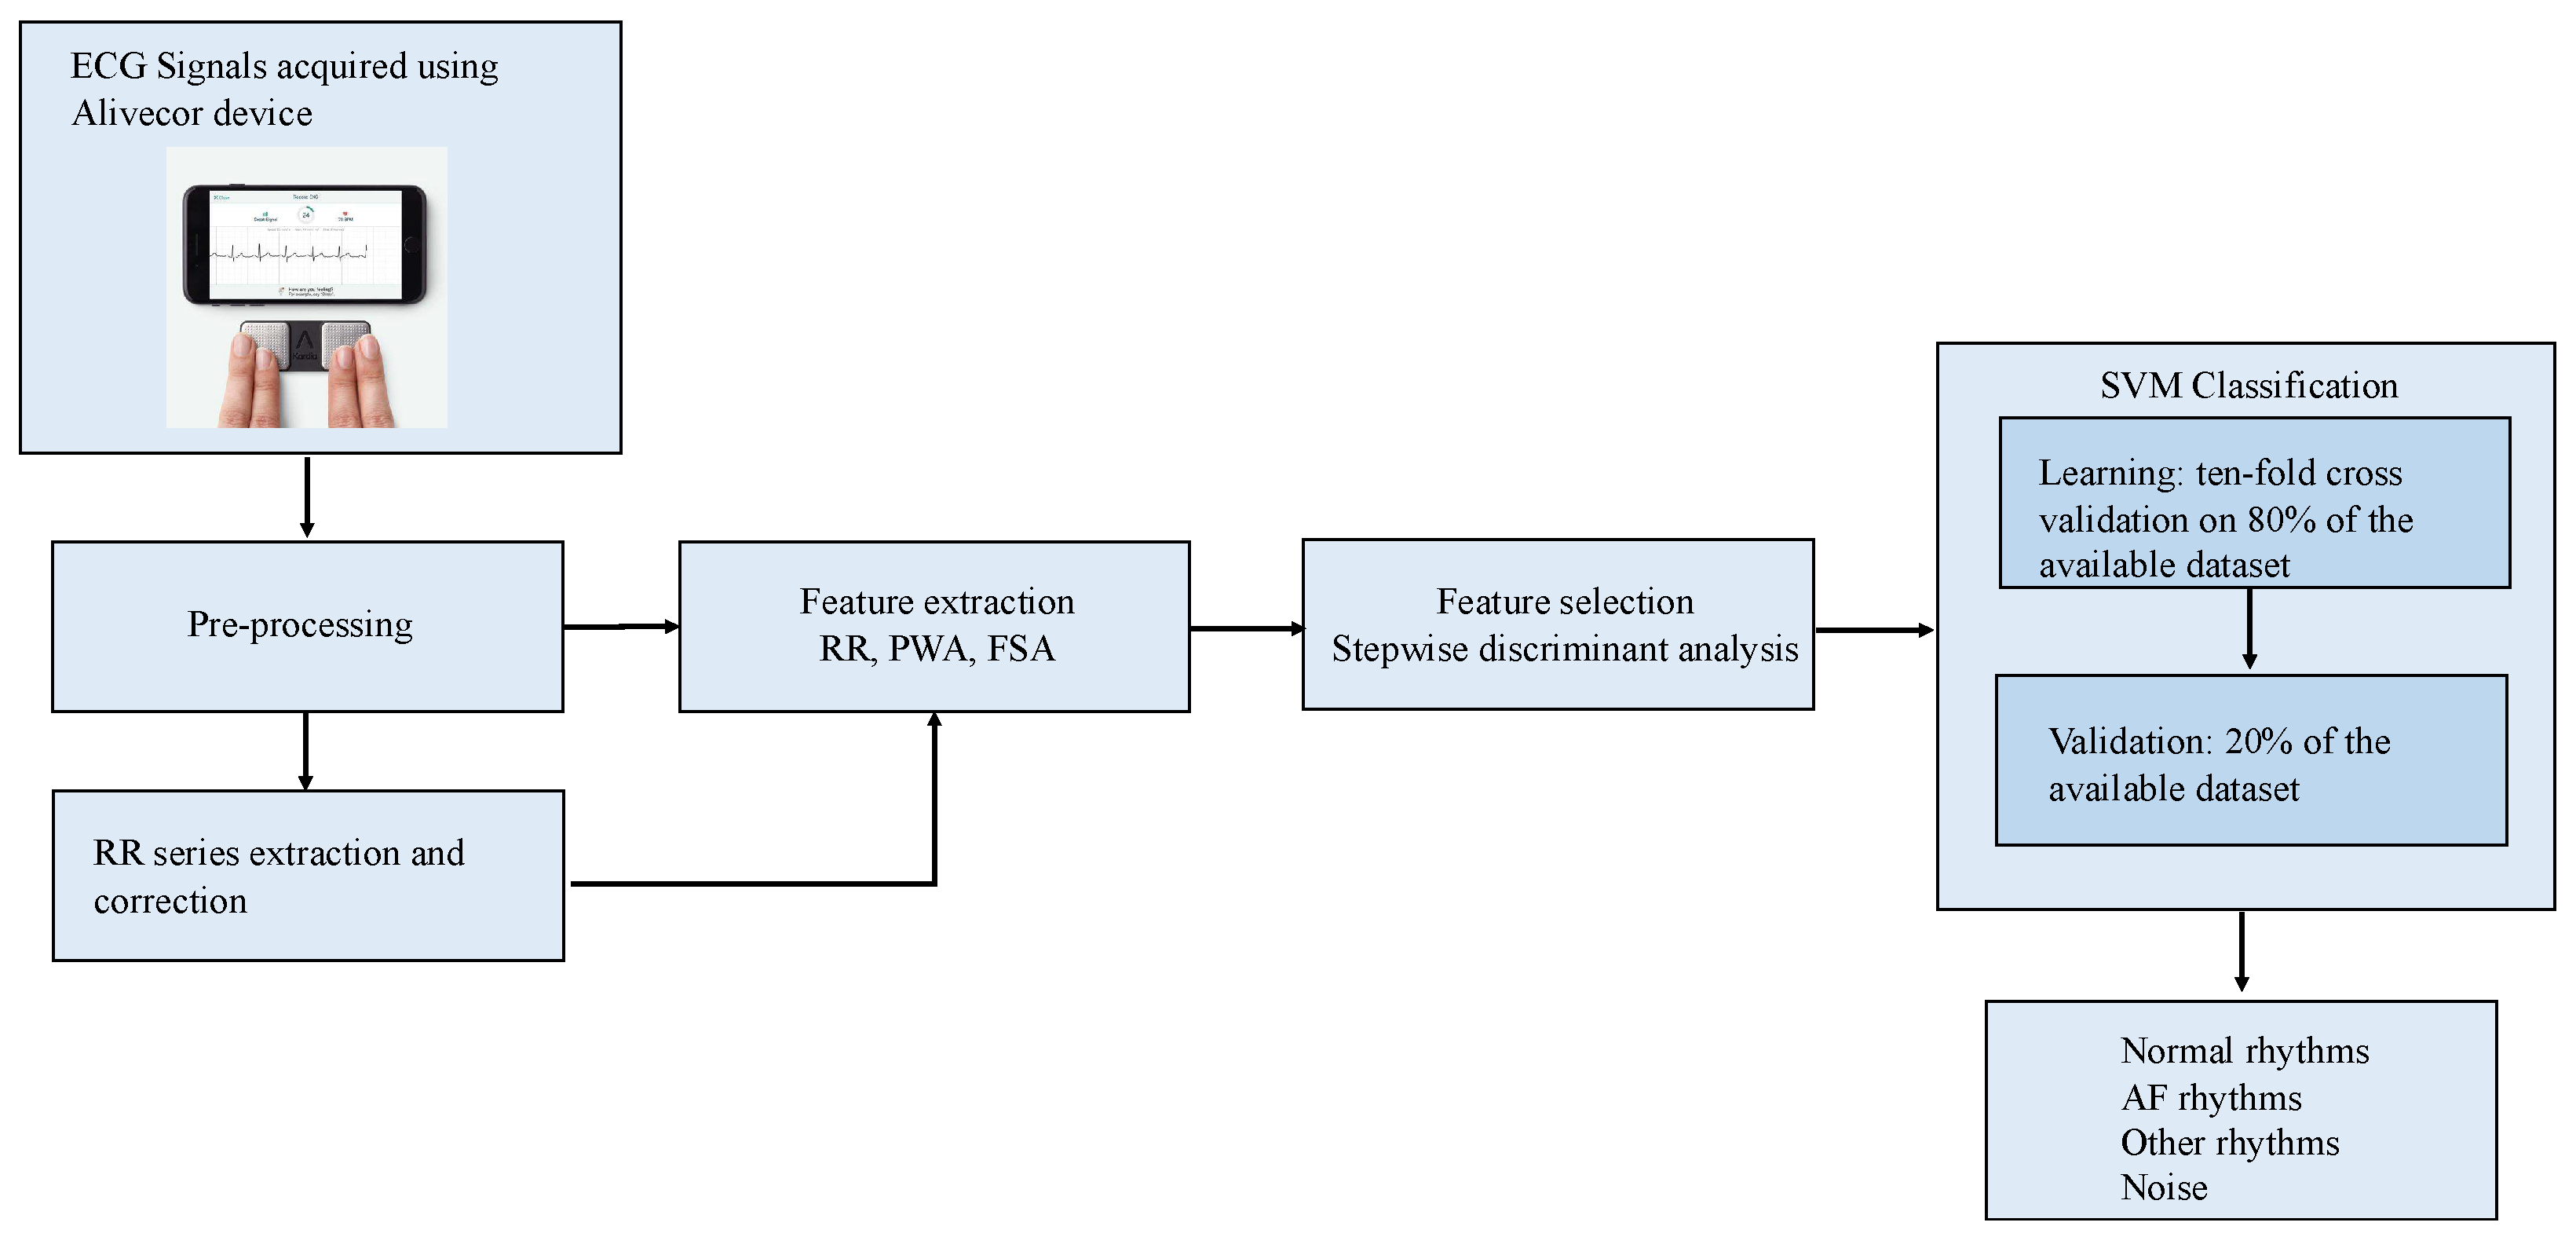
2. Materials and Methods

2.1. Datasets

The Physionet Computing in Cardiology Challenge 2017 database consists of a total of 12,186 ECG recordings. These data are single-channel signals obtained by the AliveCorTM Kardia smartphone connected device. Data were bandpass filtered (0.5–40 Hz) and stored at 300 sps, with 16 bit precision and a ±5 mV dynamic range.
The dataset was divided in a dataset, available to the public, for the development, training, and validation of the algorithms and a hidden dataset, not available to the public, on which the performance of the algorithms was evaluated by the Challenge organizers. The available dataset consisted of 8528 recordings lasting from 9 s to 61 s while the hidden dataset contained 3658 recordings of similar lengths and class distributions. The recordings were labeled as belonging to four different classes: NSR, AF, other rhythm, and noisy recordings. After the official Challenge closure, there was follow-up phase in which the annotations were reviewed and re-evaluated by experts to create a corrected version (v3). Further details about the Physionet Computing in Cardiology Challenge 2017 database can be found in Clifford et al. [25].
The AFDB database [29] includes 25 fully annotated ECG recordings and a total of 299 AF episodes (mostly paroxysmal). Each ECG recording is approximately 10 h long and is sampled at 250 Hz. It also contains some cases of atrial flutter and NSR.
In Figure 1 the full process of the proposed method is reported.

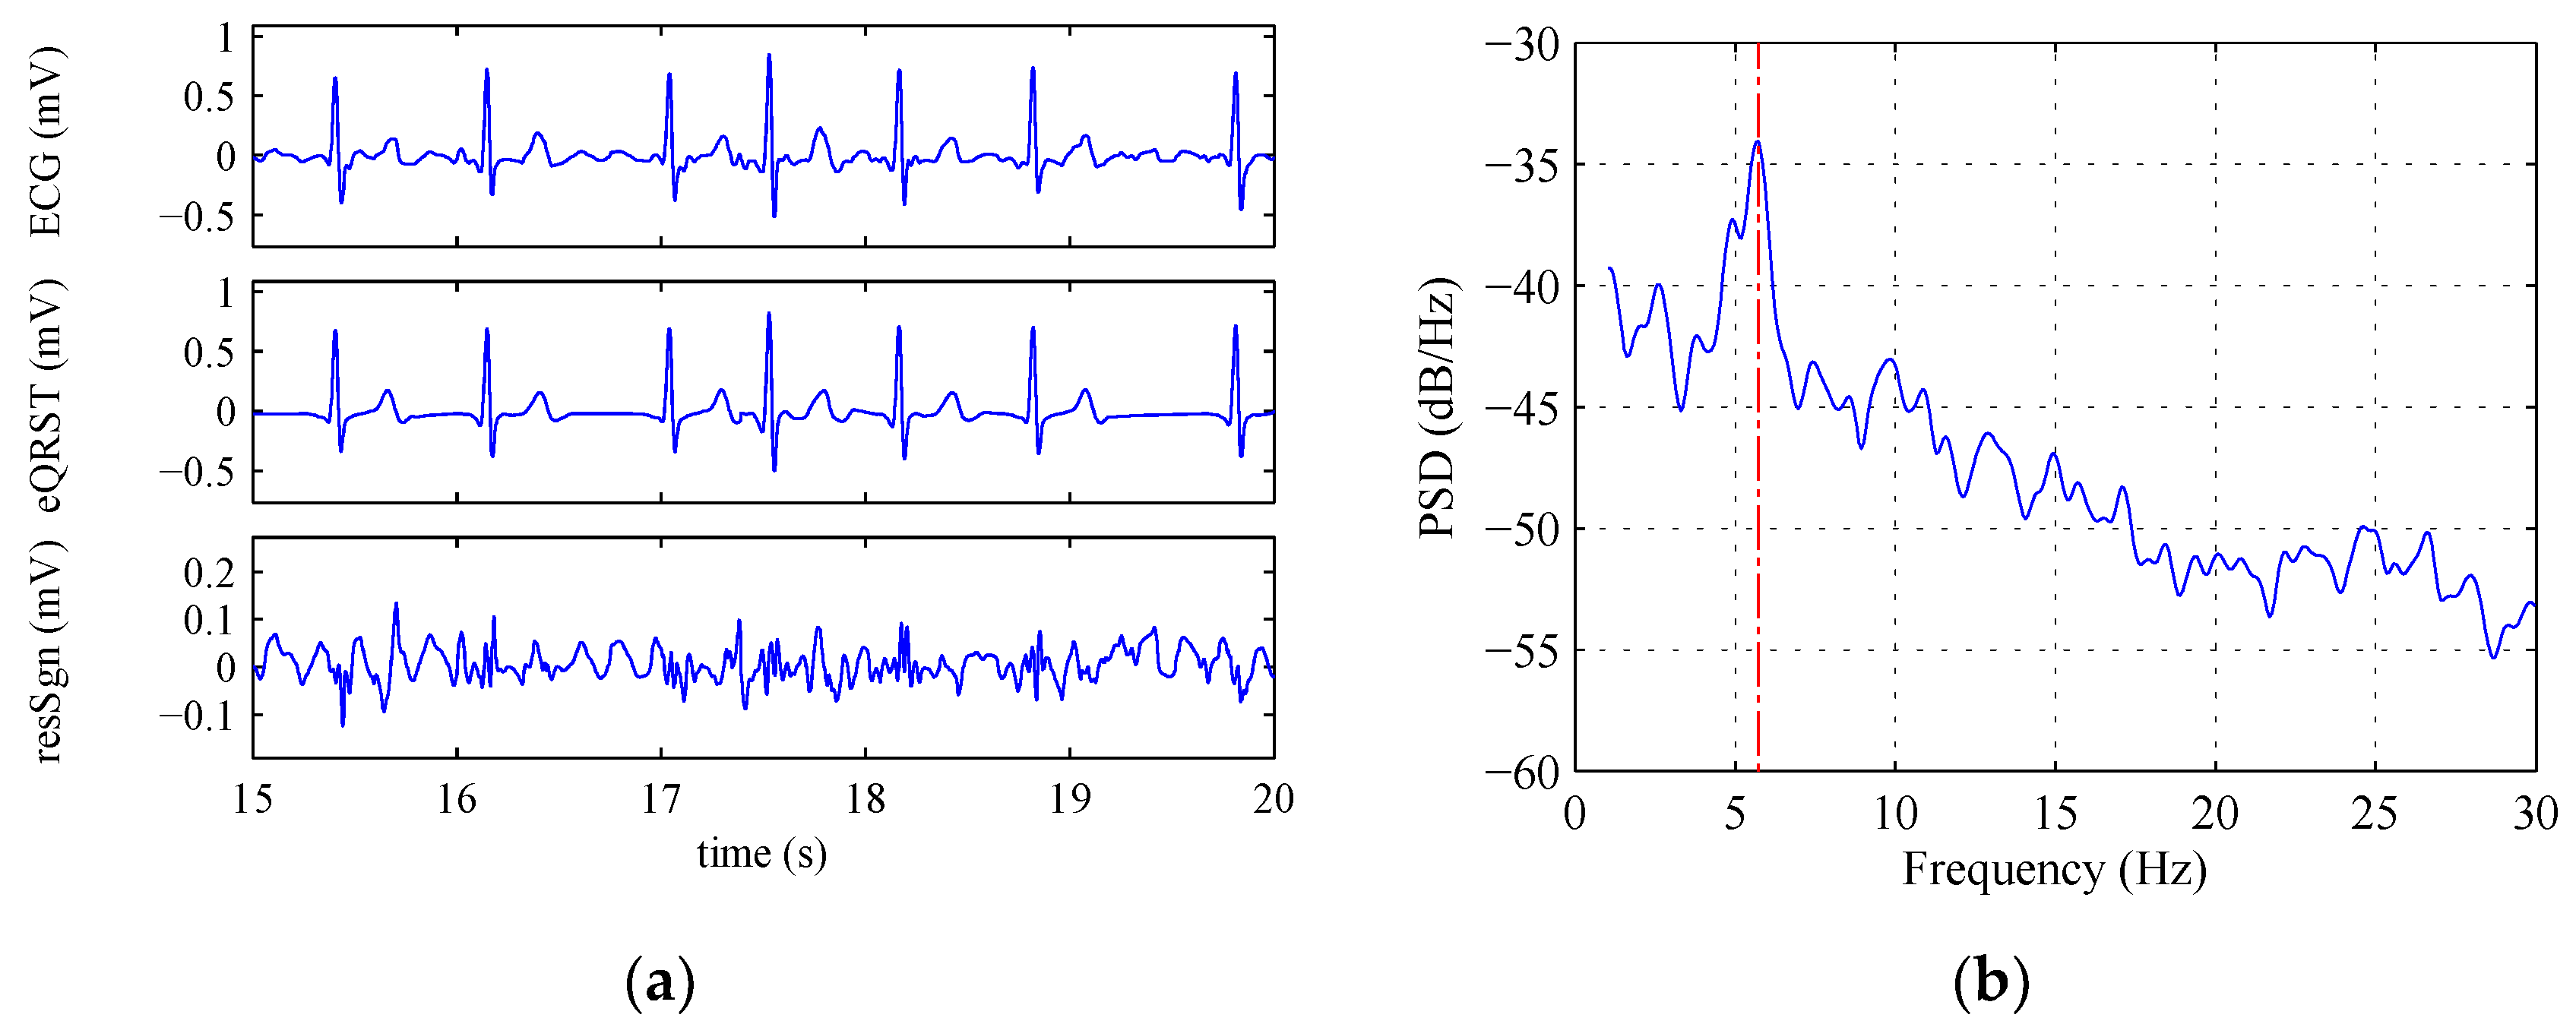
2.2. ECG Pre-Processing and RR Series Construction

ECG signals were first submitted to some pre-processing steps in order to reduce noise and improve quality. First, impulsive artifact canceling was obtained by comparing the ECG signal with a median filtered signal (60 ms window): the ECG values whose absolute difference with the filtered ones exceeded a threshold were replaced with the average of the values before and after them [30]. The resulting signal was then upsampled to 1200 Hz to increase the accuracy in the localization of QRSs thus reducing the quantization of the RR intervals.
QRS detection was performed by applying a threshold on the absolute amplitude of a filtered derivative signal. This threshold was updated at each new detection and was changed with the temporal distance from the previous QRS. The fiducial point of each QRS was selected as the time occurrence of the maximum (minimum) of the signed derivative signal. The beginning and the end of QRS were estimated by the crossing of derivative through the 0.25 threshold. This algorithm for QRS detection has been previously published by our group and obtained a very good performance [31]. The RR series was then obtained as the difference between successive QRSs.

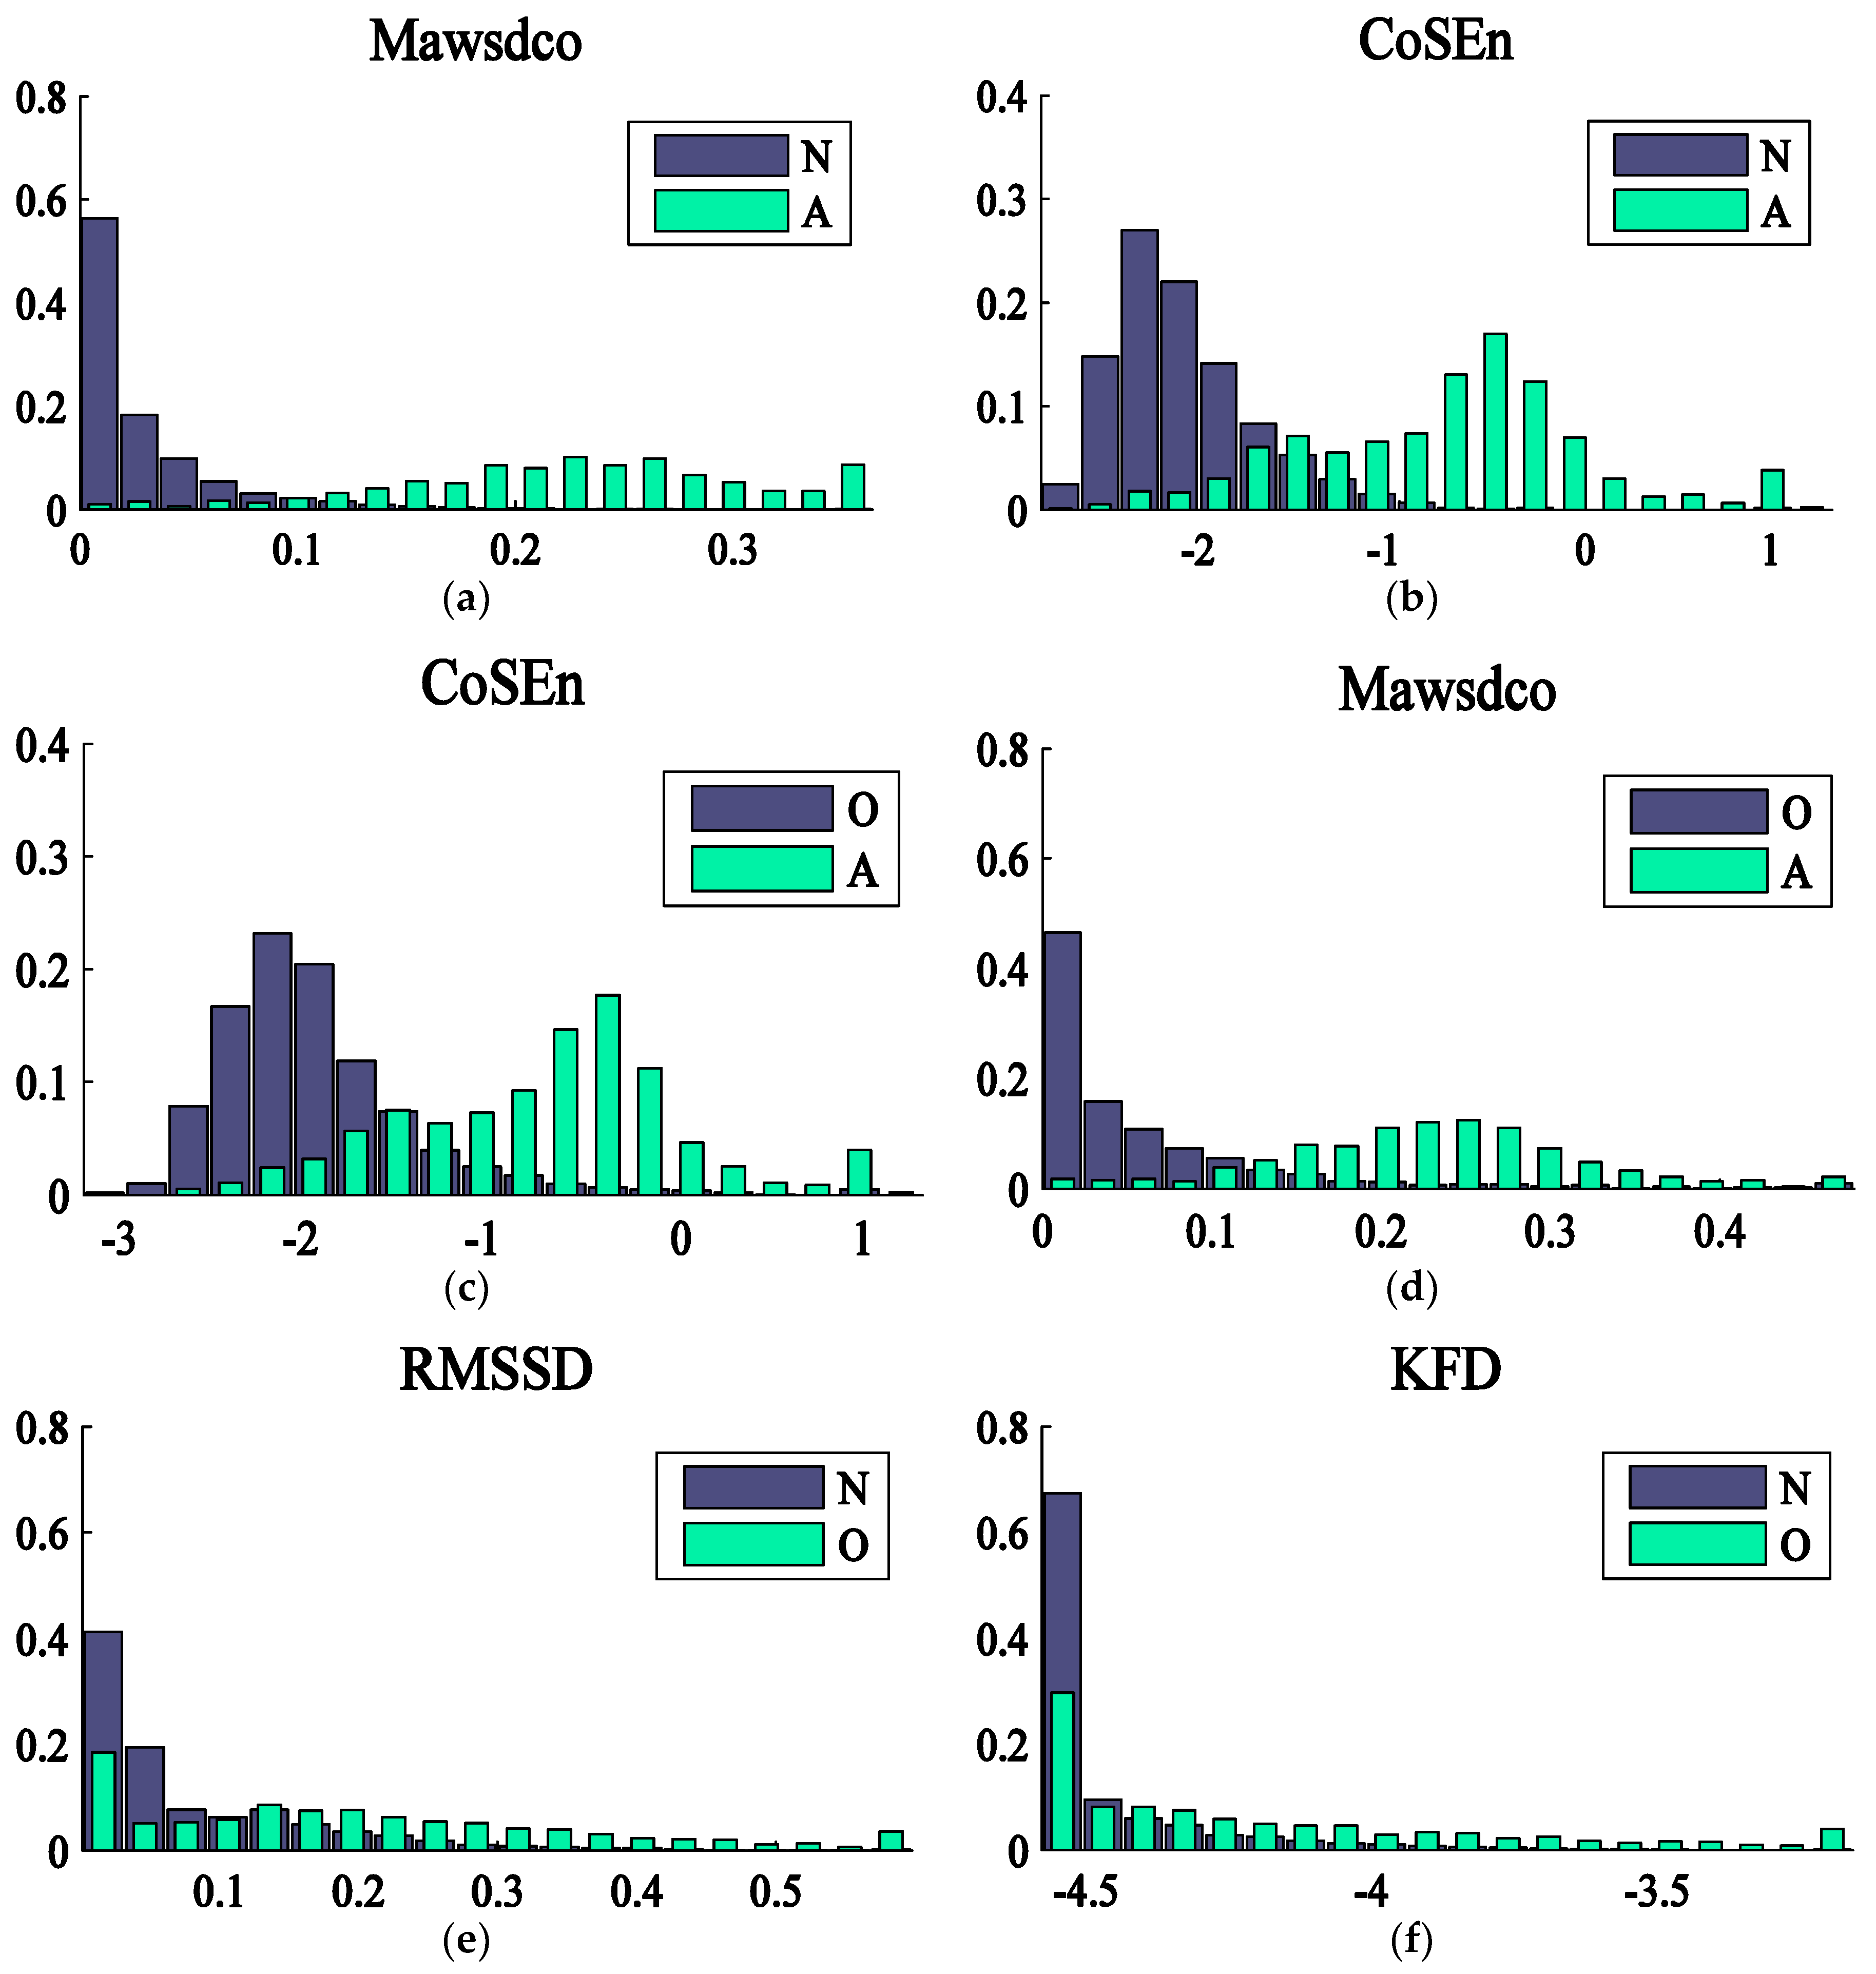
2.3. Feature Extraction and Selection

The extracted features can be categorized in four types: (1) derived from the RR series analysis; (2) derived from PWA; (3) derived from FSA; and (4) other features derived from the ECG and QRS analysis. A set of 55 features was considered. The motivation for the selection of these features is that in clinical practice arrhythmia can be distinguished from normal heartbeats in terms of both morphological and dynamic differences. Indeed, arrhythmia are typically associated with various irregularities in heart rhythm, but can usually be characterized also by different abnormal or distorted patterns in the waveform shape (e.g., distorted QRS complex) or by them missing some important components (e.g., P wave). For this reason, we decided to use a combination of different types of features for the representation of the rhythm.
ANOVA was used for feature pre-selection and tuning (some features were log-transformed in order to normalize their distribution and increase their discriminant power), then the stepwise discriminant analysis with Rao’ V criterion for feature inclusion was applied to select ten sets with an increasing number of features. The final set of features was determined by the validation of LS-SVM classifiers as described in Section 2.4. The 30 finally selected features, as well as their discriminant power (F), are reported in Table 1. In the following, a generic description of the features is reported, for details see the submitted code.

2.3.1. RR Analysis

The features extracted from the RR series were the most discriminant. The subset selected by step-wise discriminant analysis included: the mean and the max value of the RR intervals; an index of tachycardia; an index of bradycardia; and index of bigeminy and an index of trigeminy; the mean of the absolute weighted successive difference (Mawsd); the coefficient of sample entropy (CoSEn) [32] and the Katz Fractal Dimension (KFD) [33].
For the computation of the bigeminy rhythm index, we defined RRodd as the mean of RR with odd index and RReven as the mean of RR with even index. The bigeminy index was then calculated as the absolute value of the ratio: (RRodd − RReven)/(RRodd + RReven).
For the computation of the trigeminy rhythm index, we defined RRmd as the median filtered RR using a window length of 3 values. Trigeminy index was computed as the ratio between the sum of the absolute value of successive differences of RR and the sum of the absolute value of successive differences of RRmd.
The feature Mawsd was built with the aim of getting an index which takes into account mostly the RR variability due to AF, excluding that due to respiratory sinus arrhythmia and that due to other arrhythmic events. Maswd was calculated as the mean of absolute weighted successive differences of RR obtained as follows: (a) only the RR successive differences lower than a high threshold value and higher than a low threshold value were considered (these thresholds are proportional the median RR); (b) a different weight was then assigned to these RR differences depending on the sign change between two consecutive RR differences. Moreover, a specific control aimed at excluding the changes due to premature contractions with a compensatory pause was introduced in a modified version of the feature (Mawsdc). We also computed an optimized version of these two features (Mawsdo and Mawsdco). In this case, the initial values of the weights and thresholds which control the routine behavior, were optimized by the Mesh Adaptive Direct Search (MADS) algorithm. We used the toolbox “NOMAD” [34] with the target to maximize the F1 score in AF detection using a single feature decision rule.

2.3.2. P Wave Analysis

The existence of a P wave was evaluated by applying a previously published algorithm [35]. The algorithm is based on two moving average filters (widths: 0.06 s and 0.12 s), followed by a dynamic event-related threshold. A modified version of this algorithm was also applied, which used a moving average of 0.06 s width and a comb filter consisting of two moving averages of 0.04 s width delayed by 0.04 s. In addition, an index of P wave existence was also obtained by evaluating the power of the signal in a specific interval before the QRS complex.

2.3.3. Frequency Spectrum Analysis

The measures for the detection of the weak oscillation which characterize AF were extracted by frequency spectrum analysis. Since the high QRST power may cover this weak AF component, a QRST cancelling procedure was applied. This was based on approximating each QRST by Principal Component method using the powerful Singular Value Decomposition (SVD). The signal around each QRS was weighted by a trapezoidal window and stored in the columns of the matrix X, which was decomposed by SVD. A matrix Xr was then rebuilt from the SVD decomposition using only the eigenvectors associated to the greatest 2 or 3 eigenvalues. These eigenvectors contain only the signal components which are powerful and synchronous, thus the columns of the matrix Xr approximate the original QRST. A signal, containing mainly the component with ventricular origin, was obtained by unweighting the estimated QRST segments and connecting them with a straight line. This signal was subtracted from the original ECG, obtaining a residual signal which retains the AF component. Figure 2 shows, on the left, an example of QRST cancellation (from the top: the original signal, the QRST estimated component, and the residual signal where the oscillatory AF is enhanced), on the right, the estimate of the power spectral density obtained by the Welch method showing the peak due to the AF component.
The measures related to AF extracted were: the power of the signal in the band 4–10 Hz; the ratio between the power in 4–10 Hz band and the power outside this band; the power around the peak of a weighted spectral density in the 3–20 Hz band (the power of three harmonics was considered); the ratio between the power of the peak and the power around.

2.3.4. Other Features

From the whole ECG an index of noise was obtained as the power of difference between the original signal and the 30 Hz low-pass pass filtered ECG (pRhf). From the QRS complex, measures of QRS width, peak-peak amplitude, and polarization were extracted. Other features were obtained combining QRS morphology measures (e.g., QRS width) and rhythm (e.g., prematurity). Descriptions of these features are reported in Table 1.

2.4. Classification

In this study, we applied the LS-SVM (Least Square SVM) classifier [36], which is derived by the original SVM [37]. As LS-SVM involves a least squares cost function with equality constraints, the solution can be obtained by solving a system of linear equations in the transformed space. Defining a positive kernel:
k ( x i , x j ) = φ ( x i ) T φ ( x j )
the LS-SVM classifier formulation results as:
y ( x ) = sign [ 1 n α i y i K ( x , x i ) ]
The radial basis function (RBF) was selected as kernel function K (·,·):
K ( x , x i ) = exp [ x x i 2 / σ 2 ]
For the classification of the rhythms of the Physionet Challenge database, a multiclass model was adopted. The multiclass categorization problem is solved by a set of binary classifiers. We adopted the “one-versus-one” coding [38], consisting in a set of binary classifiers, each discriminating between two classes.
The LS-SVMlab toolbox [39] was used. First, the hyper-parameters (regularization γ and the RBF kernel dispersion σ2) were estimated and optimized by cross-validation (10-fold) selecting the values which minimize the rate of misclassifications. Then, the parameters α and b of the SVM model were estimated. Overfitting of the dataset may occur and the estimated classifier may have poor generalization capability. Therefore, we compared different LS-SVM classifiers using different numbers of features, pre-selected by step-wise discriminant analysis. Such classifiers were trained on the 80% of the available dataset and then they were validated on the remaining 20%. The feature set leading to the best performance on the validation set was selected. Since cross-validation is used to validate the hyper-parameters to train a model, rather than to validate the model itself, we then selected the best parameters to re-train the selected model on all the available dataset. This allowed us to reduce overfitting using a higher number of cases.
The final performance of the algorithm was then assessed by the Challenge organizers running the code on an independent hidden “test set”, which was never used for the classifier estimation.
For the AFDB, a binary classification was applied as the rhythms were only categorized as NSR or AF. In this case, the classifier was trained on the 60% of the AFDB and then validated on the remaining 40%. In order to test the generalization capabilities of the approach, the same set of 30 features selected for the Physionet Challenge database was used for AFDB.

2.5. Scoring

According to the Physionet Challenge 2017 scoring system [25], we evaluated the performance of the algorithm using the F1 measure, which is the harmonic mean between sensitivity and positive predictive value. The following notation proposed in Clifford et al. [25] is used: the true classes for Normal, AF, Other and Noisy rhythms are indicated by the uppercase letters “N”, “A”, “O” and “P” respectively, the predicted classes are indicated by the lowercase letters “n”, “a”, “o” and “p”. The notation “Xy” denotes the number of elements of the class “X” assigned to the class “y”. The F1 value was obtained for each class as follows:
NSR : F 1 n = 2 × N n N + n
AF   rhythms : F 1 a = 2 × A a A + a
Other   rhythms : F 1 o = 2 × O o O + o
Noisy   rhythms : F 1 p = 2 × P p P + p
The global value was then calculated as the mean of the single values:
F 1 = F 1 n + F 1 a + F 1 o 3
Notably, the global score was the average of performance for NSR, AF rhythms and other rhythms with the intent to emphasize correct classification of usable recordings, reducing the effective weight assigned to recordings that are too noisy to be analyzed [25]. In the AFDB only NSR and AF rhythms were present and so the F1 was computed as:
F 1 = F 1 n + F 1 a 2

3. Results

3.1. Physionet Challenge 2017 Database

The results reported hereafter refer to the latest results achieved on the final set of ground-truth labels (v3) of the follow-up phase of the challenge agreed upon by the challenge organizers, which were made available in November 2017. Indeed, these annotations were corrected and revised compared to the official challenge version and so the results are more reliable.
The stepwise discriminant analysis selected 30 discriminant features, which are described in Table 1. Among these, the Mawsdco (F = 2114) and the CosEn (F = 1913) were the features with the most discriminant power, according to the multiclass ANOVA analysis.
In order to understand which were the most significant features in discriminating each pair of classes, every between classes ANOVA was also performed. Mawsdco had the maximal F in discriminating NSR and AF rhythms (F = 10208) as shown in Figure 3a. It is possible to notice that this feature is usually higher in AF rhythms compared with NSR.
One important aim of this study was to accurately discriminate AF from other rhythms as the literature on this topic is still poor. According to the ANOVA, the CoSEn (F = 2563) and the Mawsdco (F = 1933) were the features with the most discriminant power for the classification between these two classes as observed in Figure 3c,d. Both the two features resulted generally higher in AF rhythms compared with other rhythms.
For the discrimination between normal and other rhythms, RMSSD results as the most powerful in the discrimination (F = 1712) followed by KFD (F = 1551) as shown in Figure 3e,f. Although there is a window of overlap between the two classes, other rhythms have often a higher RMSSD compared with NSR. It should be noted that, despite its discriminant power in differentiating between normal and other rhythms, the RMSSD was not selected by the stepwise discriminant analysis, as probably its discriminant information was redundant considering the other included features.
In all the figures, the areas of the histograms for each class are normalized to one, so are estimates of the class-conditional probability densities.
Using the 30 selected features, the LS-SVM classifier provided the following performance in the multi-class classification on all the available dataset of the Challenge (after the re-train of the model): F1n = 0.93; F1a = 0.85; F1o = 0.83 and F1 = 0.87. For noisy recordings we got F1p = 0.83. The confusion matrix obtained is reported in Table 2.
On the hidden test of the follow-up phase the performance was: F1n = 0.919; F1a = 0.824; F1o = 0.746 and F1 = 0.83. With this performance we obtained the third place out of 84 participants in the final rank of the follow-up challenge (first place: F1n = 0.921; F1a = 0.857; F1o = 0.766 and F1 = 0.848 [40]; second place: F1n = 0.908; F1a = 0.841; F1o = 0.745 and F1 = 0.832 [41] (https://groups.google.com/forum/#!topic/physionet-challenges/qA2iUfQmRtc). A comparative summary of the algorithms [40,41,42,43], which obtained the top five scores in the follow-up phase of the Physionet Challenge 2017, is reported in Table 3.

3.2. MIT-BH AF Database

The application of the binary SVM classifier on the AFDB provided the following performance: F1 Normal rhythm = 0.98; F1 AF rhythm: 0.99; Global F1 = 0.98. The confusion matrix obtained is reported in Table 4.

4. Discussion

In this study, we proposed a novel approach for discriminating between normal, AF, other rhythms, and noisy ECG records. The algorithm achieved high global performance both in short-term (F1 = 0.83) and long-term recordings (F1 = 0.98). Importantly, the results of this study showed the possibility of accurately detecting and discriminating AF in single short-lead ECG recordings obtained with a smartphone-connected device. In particular, as can be observed from the confusion matrix, the classifier seems particularly efficient in discriminating between normal AF rhythms and AF from other rhythms, while it is less efficient in discriminating normal from other rhythms, as shown in Table 2. Very few attempts have been made, outside the Physionet Challenge 2017, to discriminate AF from the other arrhythmia. Thus, the classification of different types of rhythms is an important novel aspect of the algorithms, including ours, implemented for the challenge.
Compared to the other algorithms submitted for the challenge, the strength of our approach is that it used a quite simple method for extracting temporal and spectral features and applying the LS-SVM for classification. This allowed us to obtain a good trade-off between accuracy and computational time, thus potentially allowing a real-time application of the algorithm. Moreover, we used a low number of features compared to the other algorithms, as seen in Table 3, which fostered a good generalization capability of the algorithm.
Notably, the proposed algorithm relies on the combination of different types of features, obtained by RR analysis, PWA, and FSA for a better characterization and discrimination of AF. Moreover, other features extracted from the ECG or specifically from the QRS have been computed in order to better discriminate AF from other rhythms. Few previous studies have used a similar combined approach for a binary classification of AF and NSR obtaining high performance [14,15]. The results of our study suggest that a similar multidimensional approach can be extended to the multiclass problem. Indeed, according to the results of a comparative study of AF detection algorithms, the ones that combine RR and atrial activity (AA) analysis are those with the highest positive predictive value, so with both a high specificity and sensitivity [13]. This is relevant when the aim is not only to detect AF but also to distinguish it from other rhythms.
According to the ANOVA analysis, the features extracted from the RR series were the most discriminant ones. Indeed, the AF does not convey to the ventricles the rhythm of the sinus node, but irregular stimulation due to the recurrent propagation of the depolarization wave on the atria. Thus, the irregularity of AF mostly affects the RR. In addition, the AA can be influenced by noise [13] limiting the reliability of the FSA features.
In particular, the Mawsdco and the CoSEn were the most discriminant features for distinguishing among the different classes. CoSEn also resulted as one of the two most discriminant features in classifying NSR and AF rhythms. The high efficiency of CoSEn in detecting AF confirms previous studies [18]. Indeed, during AF, electrical discharges conducted from the atrium into the ventricles are irregular and disorganized so that randomness and entropy increase during an AF episode. In particular, it has been noticed that CoSEn is particularly relevant when classifying short length recordings [32,44]. Importantly, we observed that CoSEn is also the most powerful feature in the discrimination between AF and other rhythms. The few studies which attempt to discriminate between AF and other type of rhythms showed the good discriminant power of this feature [22,23,24]. Thus, our study confirms the importance of including this feature to discriminate AF from other rhythms.
Importantly, we introduced a novel feature, the Mawsdco, specifically designed for AF discrimination. Indeed, this feature showed the highest discriminant power in multiclass discrimination overall the other computed features. This result suggests that the new developed feature could be relevant in the complex task of discriminating different types of rhythms. In addition, the Mawsdco displayed the highest discriminant power in the discrimination between AF and NSR and was one of the most powerful features in classifying AF and other rhythms. Indeed, this feature excludes or penalizes the effect of small RR changes typical of NSR (as that due to RSA) and large RR differences typical of ectopic beats, thus exalts intermediate differences that are mostly related to AF.
The problem of discriminating between normal and other rhythms was the most difficult, as observed in the confusion matrix resulting from the application of LS-SVM. Among the computed features RMSSD appeared as the most discriminant one. Probably this is because RMSSD is obtained as the sum of quadratic difference and thus exalts big differences that may be characteristics of other rhythms. The second most powerful feature in classifying NSR and other rhythms was KFD, which could be due to the higher fractal properties of RR series with ectopic beats [45].
The inclusion of features which are a direct index of AA substantially improved the performance of our algorithm. Indeed, AF causes, on the surface ECG, a weak oscillation in the range of 3–10 Hz; although sometimes it may be too small to be observable, it is of considerable importance in the detection of AF. The FSA consists of the cancellation of ventricular activity (QRS complex and T wave) followed by the spectral computation of the remaining atrial signal. Some previous algorithms have used different approaches to implement QRS cancellation, including blind source separation, spatio-temporal cancellation and wavelet transform [46,47,48]. However, most of these approaches need several ECG leads to be implemented so they are not suitable for mobile devices, such as AliveCor, where only one ECG lead is available. Alcaraz and Rieta [49] previously demonstrated that SVD can give an accurate AA extraction in short and single-lead AF recordings. In this work spectral analysis for AF oscillation detection was performed using a quite novel approach, considering the residual signal resulting from canceling the QRST complexes reconstructed by weighted SVD, which provided an accurate estimation of AA, as seen in Figure 2.
With the aim of evaluating the applicability of the proposed approach also on long-term recordings, we tested the algorithm on the AFDB. However, on this database, only the capability of discriminating between NSR and AF rhythms was evaluated as only these two types of rhythms are annotated. The performance obtained on this database was much higher than that obtained on the Physionet Challenge database. This result suggests that short single-lead signals, acquired with a mobile device, are more difficult to analyze. However, as stated above, the use of novel technologies allows to overcame several limitations of the traditional ECG recorders, including laborious workflow, the need for specialized staff trained in arrhythmia detection, poor patient compliance, cost, and invasiveness.
In the future, it will be important to implement a real-time version of the algorithm so that it could be applied for an online detection of AF and other arrhythmias in a point of care device. Notably, the computation time of our overall algorithm (including pre-processing and QRS detection) is quite short, taking on average 0.004 s for processing 1 s of ECG signal. However, some of the features used for AF detection need to be calculated on a longer ECG segment containing a few dozen of QRSs. Obviously, for a real-time AF detection, small window lengths are preferred, while the accuracy of the diagnosis increases with the number of RR intervals. Thus, the window size of the ECG represents a trade-off between accuracy and speed of detection. Our experiments on long term recordings containing AF episodes showed that a good compromise between the accuracy and the time resolution in AF detection is to use an ECG segment of 30 s. It should be noted that the vast majority of the records for the Physionet Challenge database acquired with the smartphone device have this duration. This window size is shorter compared to that used in most of the previously developed algorithms which did not show a good performance with short window lengths and required at least 1 min of data in order to have a good performance [13]. Notably, our algorithm employs on average about 0.12 s with a maximum time of 0.40 s, to process a 30 s length segment (values were obtained using a Matlab script running on a 2013 notebook with I7-dual [email protected] GHz). The time lag between the arising of an AF episode and its detection is therefore less than 30.4 s, i.e., the sum of segment length and the time needed to process it. This suggests that our algorithm could be used for a real-time detection of AF episodes in ECG recordings from smartphone or wearable devices.
Thus, the good performance of the proposed algorithm in signals obtained with the Alivecor technology and the widespread distribution of smartphones foster the application of the proposed approach for the continuous ECG signal monitoring, possibly using a real-time approach for self-monitoring application.

5. Conclusions

In conclusion, we showed that our algorithm was efficient in classifying AF from normal rhythm and to distinguish it from other kinds of rhythms. An accurate differentiation between AF and other types of rhythms would be important in the clinical practice for the implementation of the specific treatment. For example, the diagnosis of AF could require the use of anticoagulation, rate control, and rhythm control. Other types of arrhythmias can have a different prognosis and require different treatment. For example, atrial ectopy may predict the onset of AF [50] while ventricular ectopy may lead to cardiomyopathy or increase the risk of mortality [51].
Notably, the algorithm performed well even in short single-lead registrations acquired with a smartphone connected device. Thus, it could be implemented both in a clinical setting and in personal monitoring devices.

Author Contributions

Conceptualization, L.B. and M.V.; Methodology, L.B., M.V.; Software, L.B. and M.V.; Writing—Original Draft Preparation, L.B.; Writing—Review & Editing, M.V., M.C., D.L. and F.C.; Funding Acquisition, M.V. and F.C.

Funding

This work was supported by Cardioline S.p.A., Trento, Italy and by Bando FAS Salute Sviluppo Toscana 2014-PANACEE Project (No. 6247).

Conflicts of Interest

Magda Costi and David Lombardi work at Cardioline S.p.A., Trento, Italy, which has supported this study. The authors declare no conflict of interest.

References

  1. Chugh, S.S.; Havmoeller, R.; Narayanan, K.; Singh, D.; Rienstra, M.; Benjamin, E.J.; Gillum, R.F.; Kim, Y.H.; McAnulty, J.H., Jr.; Zheng, Z.J.; et al. Worldwide epidemiology of atrial fibrillation: A Global Burden of Disease 2010 Study. Circulation 2014, 129, 837–847. [Google Scholar] [CrossRef] [PubMed]
  2. Krijthe, B.P.; Kunst, A.; Benjamin, E.J.; Lip, G.Y.; Franco, O.H.; Hofman, A.; Witteman, J.C.; Stricker, B.H.; Heeringa, J. Projections on the number of individuals with atrial fibrillation in the European Union, from 2000 to 2060. Eur. Heart J. 2013, 34, 2746–2751. [Google Scholar] [CrossRef] [PubMed] [Green Version]
  3. Chugh, S.S.; Blackshear, J.L.; Shen, W.K.; Hammill, S.C.; Gersh, B.J. Epidemiology and natural history of atrial fibrillation: Clinical implications. J. Am. Coll. Cardiol. 2001, 37, 371–378. [Google Scholar] [CrossRef]
  4. Miyasaka, Y.; Barnes, M.E.; Gersh, B.J.; Cha, S.S.; Bailey, K.R.; Abhayaratna, W.P.; Seward, J.B.; Tsang, T.S. Secular trends in incidence of atrial fibrillation in olmsted county, minnesota, 1980 to 2000, and implications on the projections for future prevalence. Circulation 2006, 114, 119–125. [Google Scholar] [CrossRef] [PubMed]
  5. Wang, T.J.; Larson, M.G.; Levy, D.; Vasan, R.S.; Leip, E.P.; Wolf, P.A.; D’Agostino, R.B.; Murabito, J.M.; Kannel, W.B.; Benjamin, E.J. Temporal relations of atrial fibrillation and congestive heart failure and their joint influence on mortality: The framingham heart study. Circulation 2003, 107, 2920–2925. [Google Scholar] [CrossRef] [PubMed]
  6. Singh, N.; Chun, S.; Hadley, D.; Froelicher, V. Clinical Implications of Technological Advances in Screening for Atrial Fibrillation. Prog. Cardiovasc. Dis. 2018, 60, 550–559. [Google Scholar] [CrossRef] [PubMed]
  7. Tateno, K.; Glass, L. A method for detection of atrial fibrillation using rr intervals. Comput. Cardiol. 2000, 27, 391–394. [Google Scholar]
  8. Dash, S.; Chon, K.; Lu, S.; Raeder, A. Automatic real time detection of atrial fibrillation. Ann. Biomed. Eng. 2009, 37, 1701–1709. [Google Scholar] [CrossRef] [PubMed]
  9. Chiarugi, F.; Varanini, M.; Cantini, F.; Conforti, F.; Vrouchos, G. Noninvasive ecg as a tool for predicting termination of paroxysmal atrial fibrillation. IEEE Trans. Biomed. Eng. 2007, 54, 1399–1406. [Google Scholar] [CrossRef] [PubMed]
  10. Stridth, M.; Sornmo, L. Shape characterization of atrial fibrillation using time-frequency analysis. Comput. Cardiol. 2002, 29, 17–20. [Google Scholar]
  11. Slocum, J.; Sahakian, A.; Swiryn, S. Diagnosis of Atrial Fibrillation from Surface Electrocardiograms Based on Computer-detected Atrial Activity. J. Electrocardiol. 1992, 25, 1–8. [Google Scholar] [CrossRef]
  12. Clavier, L.; Boucher, J.; Lepage, R.; Blanc, J.; Cornily, J. Automatic p-wave analysis of patients prone to atrial fibrillation. Med. Biol. Eng. Comput. 2002, 40, 63–71. [Google Scholar] [CrossRef] [PubMed]
  13. Larburu, N.; Lopetegi, T.; Romero, I. Comparative study of algorithms for atrial fibrillation detection. Comput. Cardiol. 2011, 38, 265–268. [Google Scholar]
  14. Couceiro, R.; Carvalho, P.; Henriques, J.; Antunes, M.; Harris, M.; Habetha, J. Detection of Atrial Fibrillation using model-based ECG analysis. In Proceedings of the 19th International Conference on Pattern Recognition, Tampa, FL, USA, 8–11 December 2008; pp. 1–5. [Google Scholar]
  15. Schmidt, R.; Harris, M.; Novac, D.; Perkhun, M. Atrial Fibrillation Detection; Patent Cooperation Treaty: Eindhoven, The Netherlands, 2008. [Google Scholar]
  16. Babaeizadeh, S.; Gregg, R.E.; Helfenbein, E.D.; Lindauer, J.M.; Zhou, S.H. Improvements in atrial fibrillation detection for real-time monitoring. J. Electrocardiol. 2009, 42, 522–526. [Google Scholar] [CrossRef] [PubMed]
  17. Kara, S.; Okandan, M. Atrial fibrillation classification with artificial neural networks. Pattern Recogn. 2007, 40, 2967–2973. [Google Scholar] [CrossRef]
  18. Kennedy, A.; Finlay, D.; Guldenring, D.; Bond, R.; Moran, K.; McLaughlin, J. Automated detection of atrial fibrillation using R-R intervals and multivariate-based classification. J. Electrocardiol. 2016, 49, 871–876. [Google Scholar] [CrossRef] [PubMed] [Green Version]
  19. Nayak, J.; Naik, B.; Behera, H. A comprehensive survey on support vector machine in data mining tasks: Applications & challenges. Int. J. Database Theory Appl. 2015, 8, 169–186. [Google Scholar]
  20. Mohebbi, M.; Ghassemian, H. Detection of atrial fibrillation episodes using SVM. Conf. Proc. IEEE Eng. Med. Biol. Soc. 2008, 2008, 177–180. [Google Scholar] [PubMed]
  21. Asgari, S.; Mehrnia, A.; Moussavi, M. Automatic detection of atrial fibrillation using stationary wavelet transform and support vector machine. Comput. Biol. Med. 2015, 60, 132–142. [Google Scholar] [CrossRef] [PubMed]
  22. Carrara, M.; Carozzi, L.; Moss, T.; De Pasquale, M.; Cerutti, S.; Ferrario, M. Heart rate dynamics distinguish among atrial fibrillation, normal sinus rhythm and sinus rhythm with frequent ectopy. Physiol. Meas. 2015, 36, 1873–1888. [Google Scholar] [CrossRef] [PubMed] [Green Version]
  23. Carrara, M.; Carozzi, L.; Moss, T.; De Pasquale, M.; Cerutti, S.; Lake, D.E.; Moorman, J.R.; Ferrario, M. Classification of cardiac rhythm using heart rate dynamical measures: Validation in MIT-BIH databases. J. Electrocardiol. 2015, 48, 943–946. [Google Scholar] [CrossRef] [PubMed]
  24. DeMazumder, D.; Lake, D.E.; Cheng, A.; Moss, T.J.; Guallar, E.; Weiss, R.G.; Jones, S.R.; Tomaselli, G.F.; Moorman, J.R. Dynamic analysis of cardiac rhythms for discriminating atrial fibrillation from lethal ventricular arrhythmias. Circ. Arrhythm. Electrophysiol. 2013, 6, 555–561. [Google Scholar] [CrossRef] [PubMed]
  25. Clifford, G.; Liu, C.; Moody, B.; Lehman, L.H.; Silva, I.; Li, Q.; Johnson, A.; Mark, R.G. AF classification from a short single lead ecg recording: The PhysioNet/Computing in Cardiology Challenge 2017. Comput. Cardiol. 2017, 44, 1–4. [Google Scholar]
  26. Lau, J.K.; Lowres, N.; Neubeck, L.; Brieger, D.B.; Sy, R.W.; Galloway, C.D.; Albert, D.E.; Freedman, S.B. iPhone ECG application for community screening to detect silent atrial fibrillation: A novel technology to prevent stroke. Int. J. Cardiol. 2013, 165, 193–194. [Google Scholar] [CrossRef] [PubMed]
  27. Tu, H.T.; Chen, Z.; Swift, C.; Churilov, L.; Guo, R.; Liu, X.; Jannes, J.; Mok, V.; Freedman, B.; Davis, S.M.; et al. Smartphone electrographic monitoring for atrial fibrillation in acute ischemic stroke and transient ischemic attack. Int. J. Stroke 2017, 12, 786–789. [Google Scholar] [CrossRef] [PubMed]
  28. Billeci, L.; Chiarugi, F.; Costi, M.; Lombardi, D.; Varanini, M. Detection of AF and Other Rhythms Using RR Variability and ECG Spectral Measures. Comput. Cardiol. 2017, 44, 44. [Google Scholar] [CrossRef]
  29. The Physionet ECG Database. Available online: http://physionet.org/physiobank/database/.
  30. Varanini, M.; Tartarisco, G.; Billeci, L.; Macerata, A.; Pioggia, G.; Balocchi, R. An efficient unsupervised fetal qrs complex detection from abdominal maternal ecg. Physiol. Meas. 2014, 35, 1607–1619. [Google Scholar] [CrossRef] [PubMed]
  31. Taddei, A.; Marchesi, C.; Landucci, L. Performance comparison of fast QRS detection algorithms. In Ambulatory Monitoring; Marchesi, C., Ed.; Martinus Nijhoff: Boston, MA, USA, 1984; pp. 189–207. [Google Scholar]
  32. Lake, D.E.; Moorman, J.R. Accurate estimation of entropy in very short physiological time series: The problem of atrial fibrillation detection in implanted ventricular devices. Am. J. Physiol. Heat Circ. Physiol. 2011, 300, H319–H325. [Google Scholar] [CrossRef] [PubMed]
  33. Katz, M. Fractals and the analysis of waveforms. Comput. Biol. Med. 1988, 18, 45–156. [Google Scholar] [CrossRef]
  34. Le Digabel, S. Algorithm 909: NOMAD: Nonlinear Optimization with the MADS algorithm. ACM Trans. Math. Softw. 2011, 37, 1–15. [Google Scholar] [CrossRef]
  35. Elgendi, M.; Meo, M.; Abbott, D. A Proof-of-Concept Study: Simple and Effective Detection of P and T Waves in Arrhythmic ECG Signals. Bioengineering 2016, 3, 26. [Google Scholar] [CrossRef] [PubMed]
  36. Suykens, J.; Vandewalle, J. Least Squares Support Vector Machine Classifier. Neural Process. Lett. 1999, 9, 293–300. [Google Scholar] [CrossRef]
  37. Vapnik, V. Pattern recognition using generalized portrait method. Autom. Remote Control 1963, 24, 774–780. [Google Scholar]
  38. Hastie, T.; Tibshirani, R. Classification by pairwise coupling. Ann. Stat. 1998, 26, 451–471. [Google Scholar] [CrossRef]
  39. Suykens, J.A.K.; Van Gestel, T.; De Brabanter, J.; De Moor, B.; Vandewalle, J. Least Squares Support Vector Machines; World Scientific: Singapore, 1984. [Google Scholar]
  40. Teijeiro, T.; García, C.A.; Castro, D.; Félix, P. Abductive reasoning as the basis to reproduce expert criteria in ECG Atrial Fibrillation identification. Physiol. Meas. 2018, 39, 084006. [Google Scholar] [CrossRef]
  41. Kropf, M.; Hayn, D.; Schreier, G. ECG Classification Based on Time and Frequency Domain Features Using Random Forests. Comput. Cardiol. 2017, 44. [Google Scholar] [CrossRef]
  42. Datta, S.; Chetanya, P.; Mukherjee, A.; Banerjee, R.; Choudhury, A.D.; Singh, R.; Ukil, A.; Bandyopadhyay, S.; Pal, A.; Khandelwal, S. Identifying Normal, AF and other Abnormal ECG Rhythms using a Cascaded Binary Classifier. Comput. Cardiol. 2017, 44. [Google Scholar] [CrossRef]
  43. Plesinger, F.; Nejedly, P.; Viscor, I.; Halamek, J.; Jurak, P. Parallel use of a convolutional neural network and bagged tree ensemble for the classification of Holter ECG. Physiol. Meas. 2018, 39, 094002. [Google Scholar] [CrossRef]
  44. Langley, P.; Dewhurst, M.; Di Marco, L.Y.; Adams, P.; Dewhurst, F.; Mwita, J.C.; Walker, R.; Murray, A. Accuracy of algorithms for detection of atrial fibrillation from short duration beat interval recordings. Med. Eng. Phys. 2012, 34, 1441–1447. [Google Scholar] [CrossRef] [PubMed]
  45. Saeed, M. Fractals analysis of cardiac arrhythmias. Sci. World J. 2005, 5, 691–701. [Google Scholar] [CrossRef] [PubMed]
  46. Stridh, M.; Sörnmo, L. Spatiotemporal QRST cancellation techniques for analysis of atrial fibrillation. IEEE Trans. Biomed. Eng. 2001, 48, 105–111. [Google Scholar] [CrossRef] [PubMed]
  47. Senhaji, L.; Wang, F.; Hernandez, A.I.; Carrault, G. Wavelets Extrema Representation for QRS-T Cancellation and P Wave Detection. Comput. Cardiol. 2002, 29, 37–40. [Google Scholar]
  48. Rieta, J.J.; Castells, F.; Sánchez, C.; Zarzoso, V.; Millet, J. Atrial activity extraction for atrial fibrillation analysis using blind source separation. IEEE Trans. Biomed. Eng. 2004, 51, 1176–1186. [Google Scholar] [CrossRef] [PubMed]
  49. Alcaraz, R.; Rieta, J.J. Adaptive singular value cancelation of ventricular activity in single-lead atrial fibrillation electrocardiograms. Physiol. Meas. 2008, 29, 1351–1369. [Google Scholar] [CrossRef] [PubMed]
  50. Dewland, T.A.; Vittinghoff, E.; Mandyam, M.C.; Heckbert, A.R.; Siscovick, D.S.; Stein, P.K.; Psaty, B.M.; Sotoodehnia, N.; Gottdiener, J.S.; Marcus, G.M. Atrial ectopy as a predictor of incident atrial fibrillation: A cohort study. Ann. Intern. Med. 2013, 159, 721–728. [Google Scholar] [CrossRef] [PubMed]
  51. Lee, V.; Hemingway, H.; Harb, R.; Crake, T.; Lambiase, P. The prognostic significance of premature ventricular complexes in adults without clinically apparent heart disease: A meta-analysis and systematic review. Heart 2012, 98, 1290–1298. [Google Scholar] [CrossRef] [PubMed]
Figure 1. Flowchart of the proposed algorithm. Abbreviations are: P wave absence (PWA), frequency spectrum analysis (FSA), atrial fibrillation (AF).
Electronics 07 00199 g001
Figure 2. Record A0090: QRST cancellation by Singular Value Decomposition (SVD) (a) and Power spectral density (PSD) of residual signal (b). eQRST: estimated QRST; resSgn: residual signal after SVD cancellation.
Electronics 07 00199 g002
Figure 3. Histograms of Mean of the absolute weighted successive difference controlling for premature beats with compensatory pause (weight optimization) (Mawsdco) (a) and coefficient of sample entropy (CoSEn) (b) for N and A rhythms; histograms of CoSEn (c) and Mawsdco (d) for O and A rhythms; histograms of root mean square of successive differences (RMSSD) (e) and Katz Fractal Dimension (KFD) (f) for N and O rhythms. N: normal; A: atrial fibrillation; O: other.
Electronics 07 00199 g003
Table 1. Description of the selected features. F: discriminant power.
FeatureFDescription
Features extracted from the RR series
bigem910Bigemy rhythm index
trigem440Trigemy rhythm index
RRmean250Mean value of the RR intervals
RRmax168Max value of the RR intervals
RRbrady125Mean value of the RR intervals above the threshold of 1.2 s
RRtachy659Mean value of the RR intervals below the threshold of 0.7 s
CoSEn1913Coefficient of sample entropy
Mawsdo1771Mean of the absolute weighted successive difference with weight optimization
Mawsdco2114Mean of the absolute weighted successive difference controlling for premature beats with compensatory pause (weight optimization)
KFD993Katz Fractal Dimension
Frequency Spectrum Analysis (FSA)
mPdAF357Power around the peak of the weighted spectral density in the 3–20 Hz band. The power of the three harmonics was considered
mPdAFr449Ratio between the power of the peak and the power in the around
P wave analysis (PWA)
P_numr88Index of P wave existence based on the comparison between a moving average of 0.06 s width and a moving average of 0.12 s width
Pexist67Index of P wave existence obtained comparing a moving average of 0.06 s width with the output of a comb filter consisting of two moving average of 0.04 s width, delayed by 0.04 s
PintNr240Index of P wave existence obtained calculating the power peaks within intervals before the QRS onset and computing the mode of the distribution of the positions of such peaks
Other features extracted from the ECG and the QRS complex
pRhf62Power of the signal obtained as the difference between the original and the low-pass filtered (30 Hz) signal (index of noise)
QRSwidthMeanQ1101Trimmed mean (2% tail discard) of the QRS width values
QRSwidthStdQ545Trimmed standard deviation (2% tail discard) of the QRS width values
QRSwidthMax3Q619Mean of the three max values of the QRS width
QRSwidthMaxQs292Max value of the moving average on 3 values of the QRS width
QRSppAmplMea44Trimmed mean (2% tail discard) of the QRS peak-peak amplitude
QRSpprAmplMea311Ratio between the QRSppAmplMea and the peak-peak amplitude of the signal outside the QRST interval
QRSpolMea26Trimmed mean (3% tail discard) of the QRS polarity computed as the sum of the maximum and the minimum of the QRS values
QRSwidthMin183Min value of the QRS equivalent widths, defined as the QRS absolute area divided by the peak-peak amplitude
QRSwidthNmea508Trimmed mean (discarding 40% of high values) of the QRS equivalent widths
PnWideQRS149Ratio between the number of QRS with equivalent width >1.25 × QRSwidthNmea
morphDiffr550Mean of the sum of absolute differences between the QRSs and the QRS mean
QRSsadV19Sum of the absolute differences between the two first right-singular-vectors
nPVCp353Fraction of the premature beats that are followed by a compensatory pause
AtypBeatPrk450Ratio between the relative QRS width and the beat prematurity
Table 2. Confusion matrix on the available set of the Physionet Computing in Cardiology Challenge 2017. N: normal, A: atrial fibrillation, O: other rhythms, P: noisy. Lowercase letters denote the classifier predicted classes. The background green color indicates correct classifications.
naop
N4923161298
A23635955
O4597418756
P5873108
Table 3. Comparison of the results of the proposed methods with that of the other algorithms proposed for the Physionet Challenge 2017 obtained in the follow-up phase.
ReferenceNumber of FeaturesClassification MethodOverall Performance
Teijeiro et al. [40]42Gradient Boosting classifier and Recurrent Neural NetworkF1 = 0.848
Kropf et al. [41]380Random ForestF1 = 0.832
Billeci et al. (proposed method)30Least Square-Support Vector MachineF1 = 0.830
Datta et al. [42]150Multi-layer Cascaded BinaryF1 = 0.8294
Plesinger [43]60Neural Netwok + Bagged Tree EnsembleF1 = 0.8278
Notably, our performance on the hidden test set of the official challenge phase was: F1n = 0.911; F1a = 0.784; F1o = 0.739 and F1 = 0.812 (obtaining the 12th place in the official ranking list). The increase in performance achieved from the official phase to the follow-up phase suggests the importance of having reliable annotations for the algorithm training and evaluation.
Table 4. Confusion matrix on the AFDB. N: normal, A: atrial fibrillation; lowercase letters denote the classifier predicted classes. The background green color indicates correct classifications.
na
N539375
A8010,937

