Dual Battery Storage System: An Optimized Strategy for the Utilization of Renewable Photovoltaic Energy in the United Kingdom

 ,
,  ,
, 
Abstract

1. Introduction
1.1. Energy Spread and Photovoltaic Technology/PV Energy and World Demand
1.2. Energy Storage and Its Effective Utilization
1.3. Batteries and Feed-In-Tariff Incentives/Effective Cost, and the Impact of the PV System
2. Material and Methods
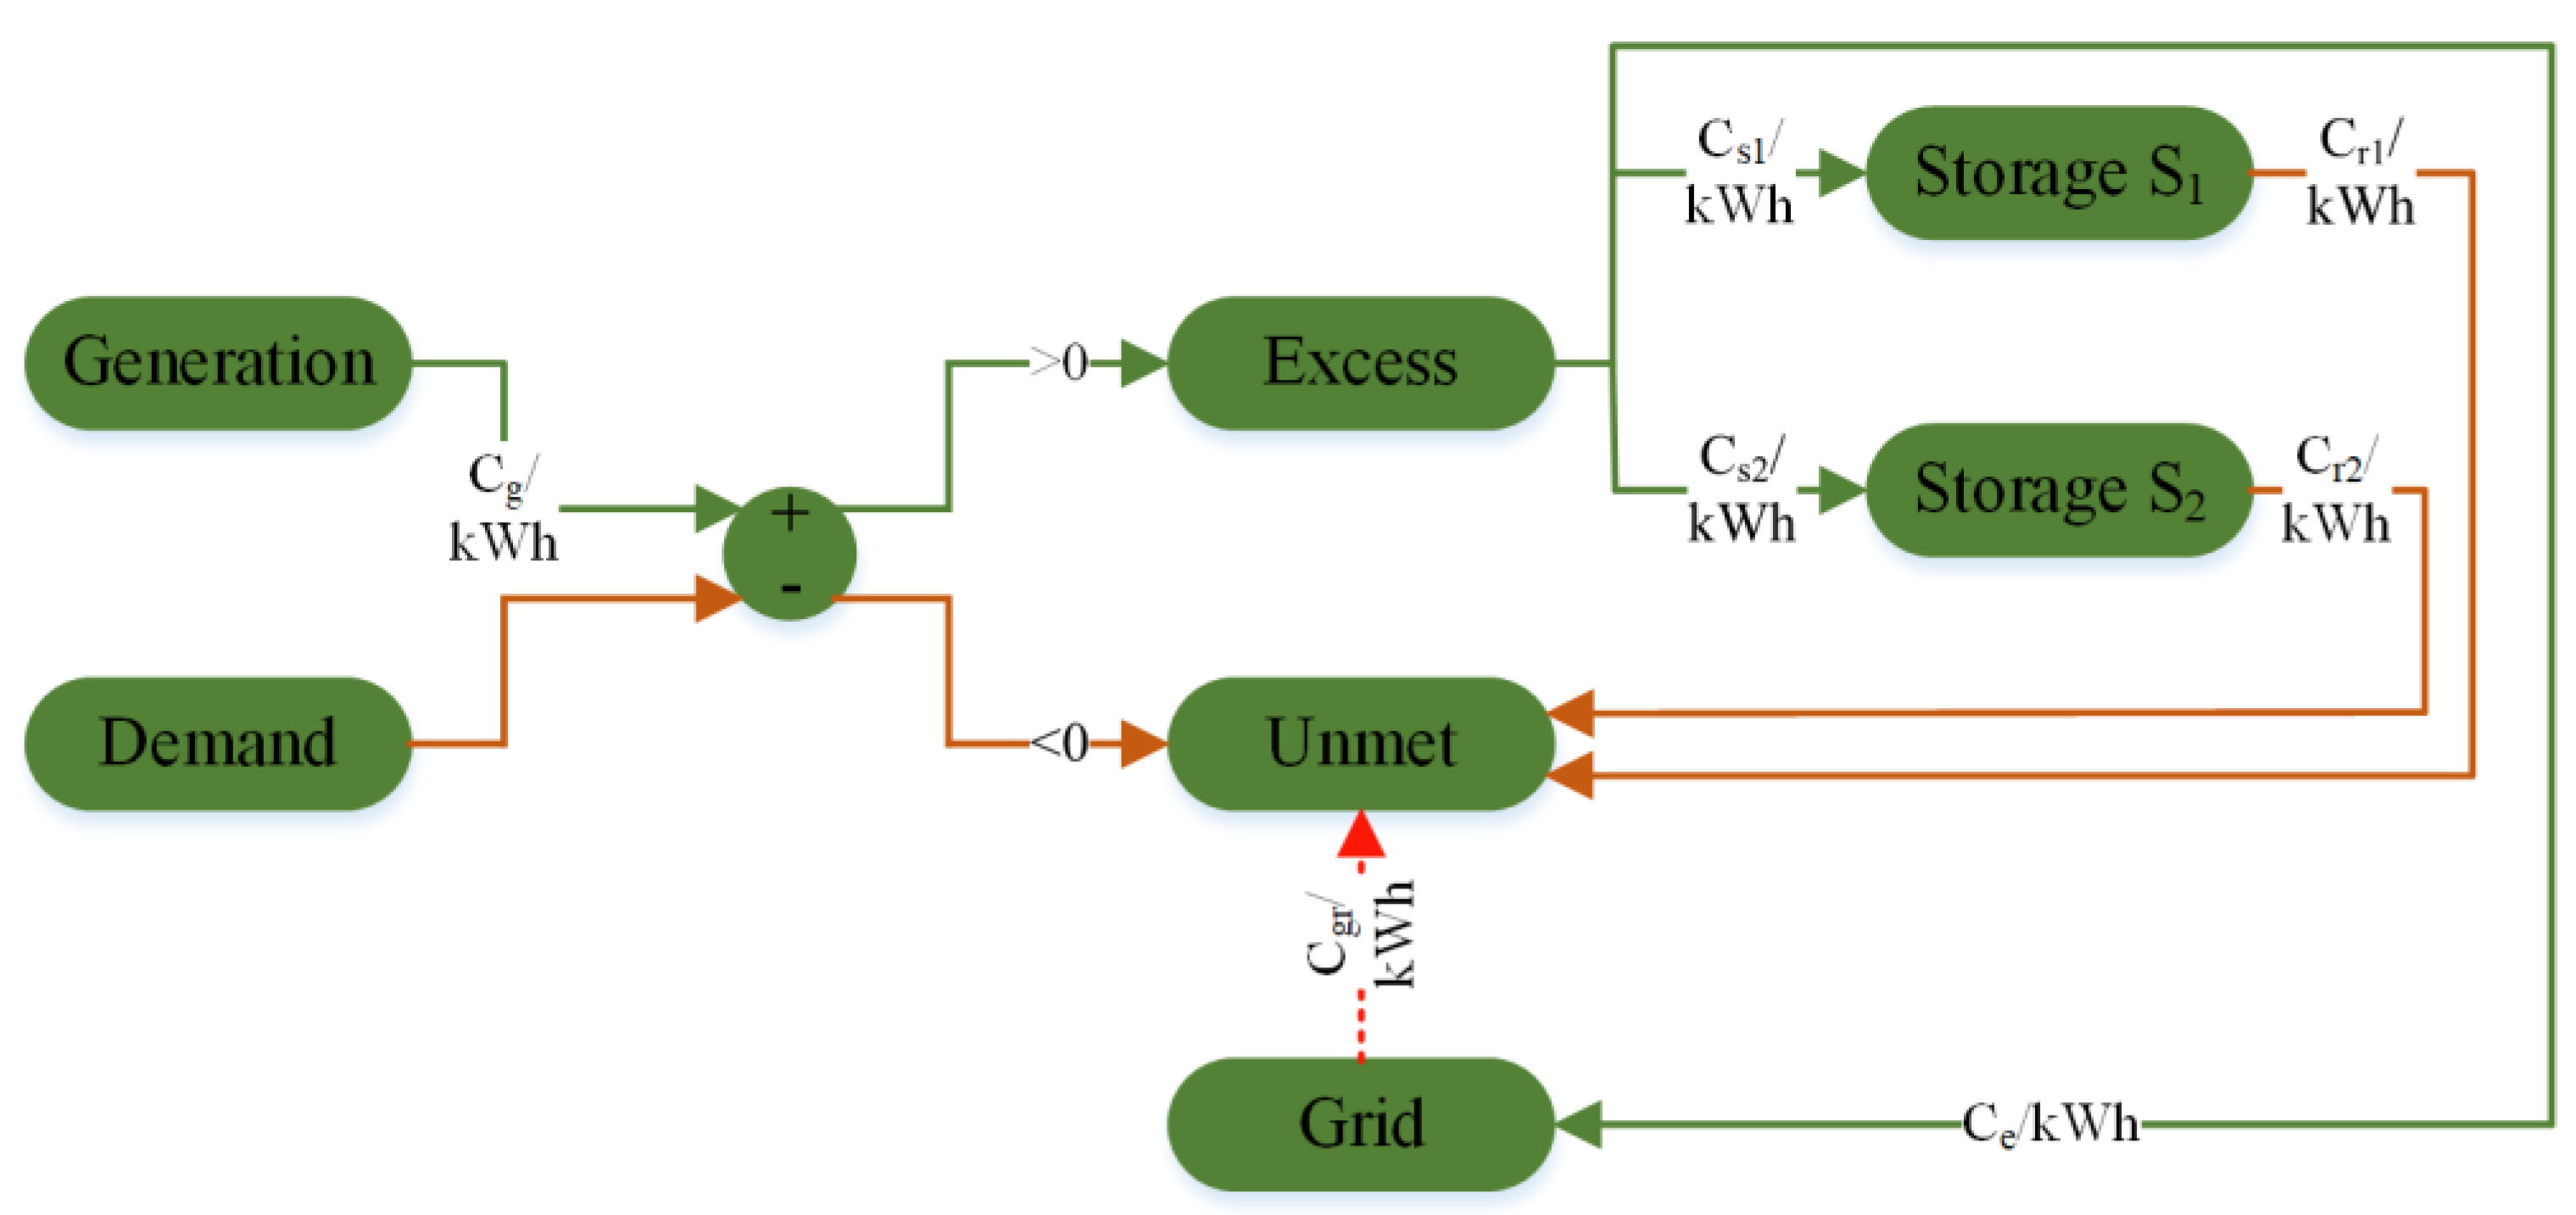
2.1. Problem Formulation
2.2. Methodological Detail
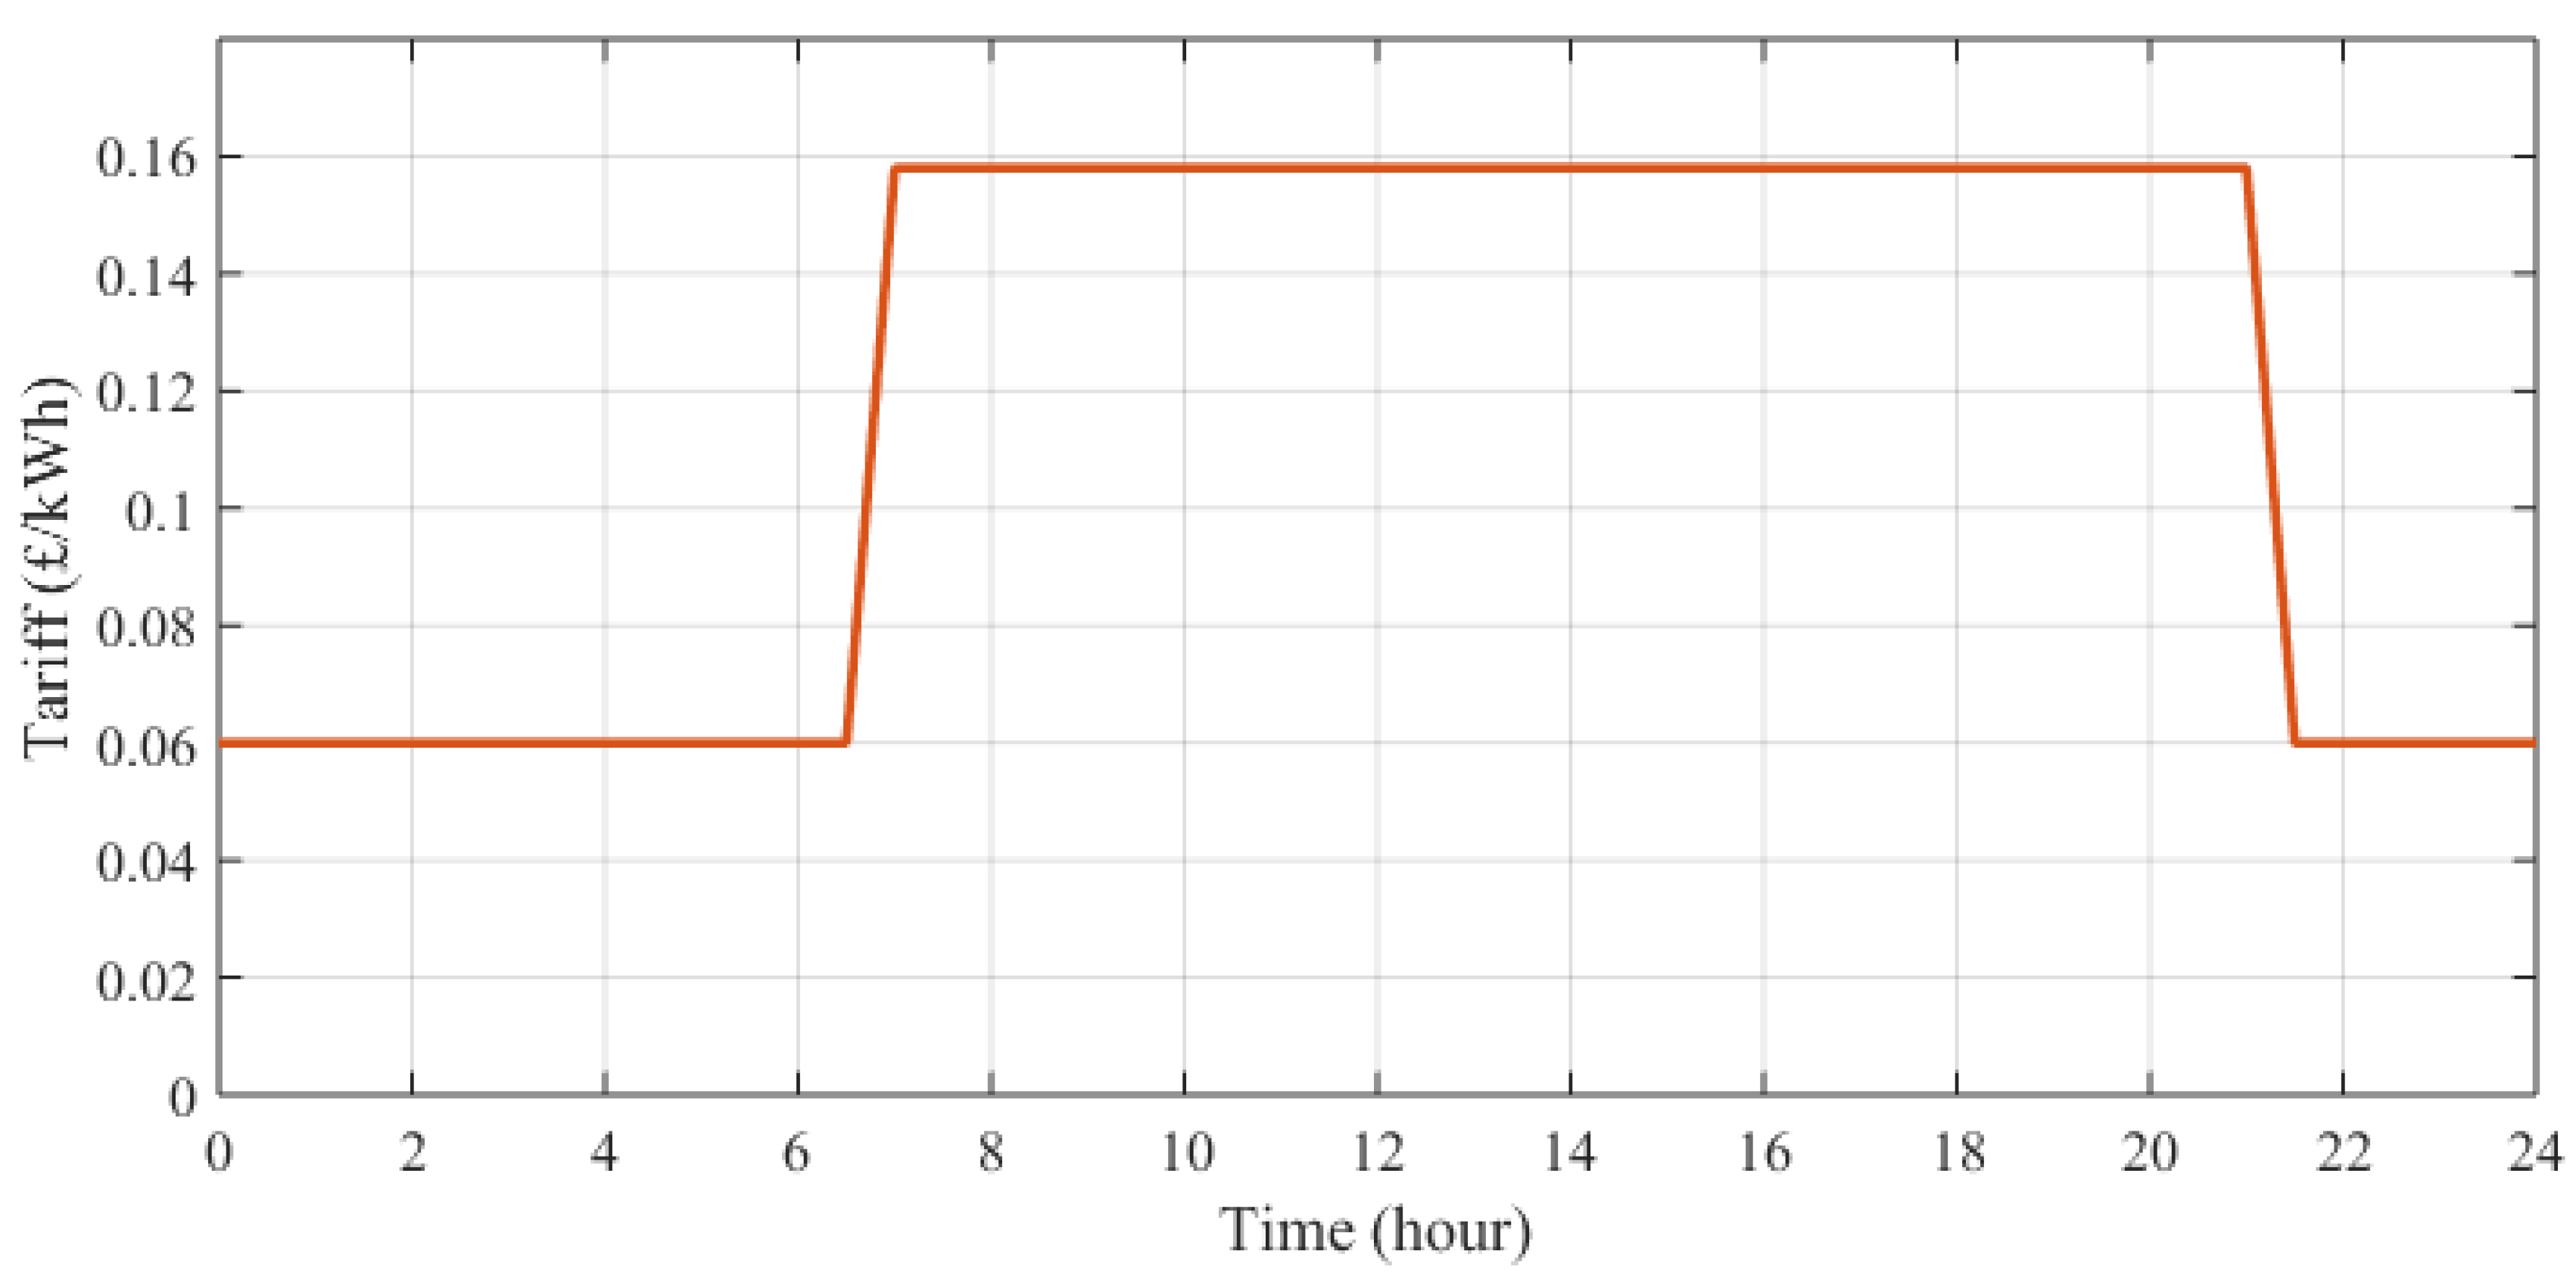
2.3. Tariff Details
2.3.1. The Time-Of-Use Tariff
2.3.2. Export Tariff
2.3.3. Import Tariff
3. Results and Discussion
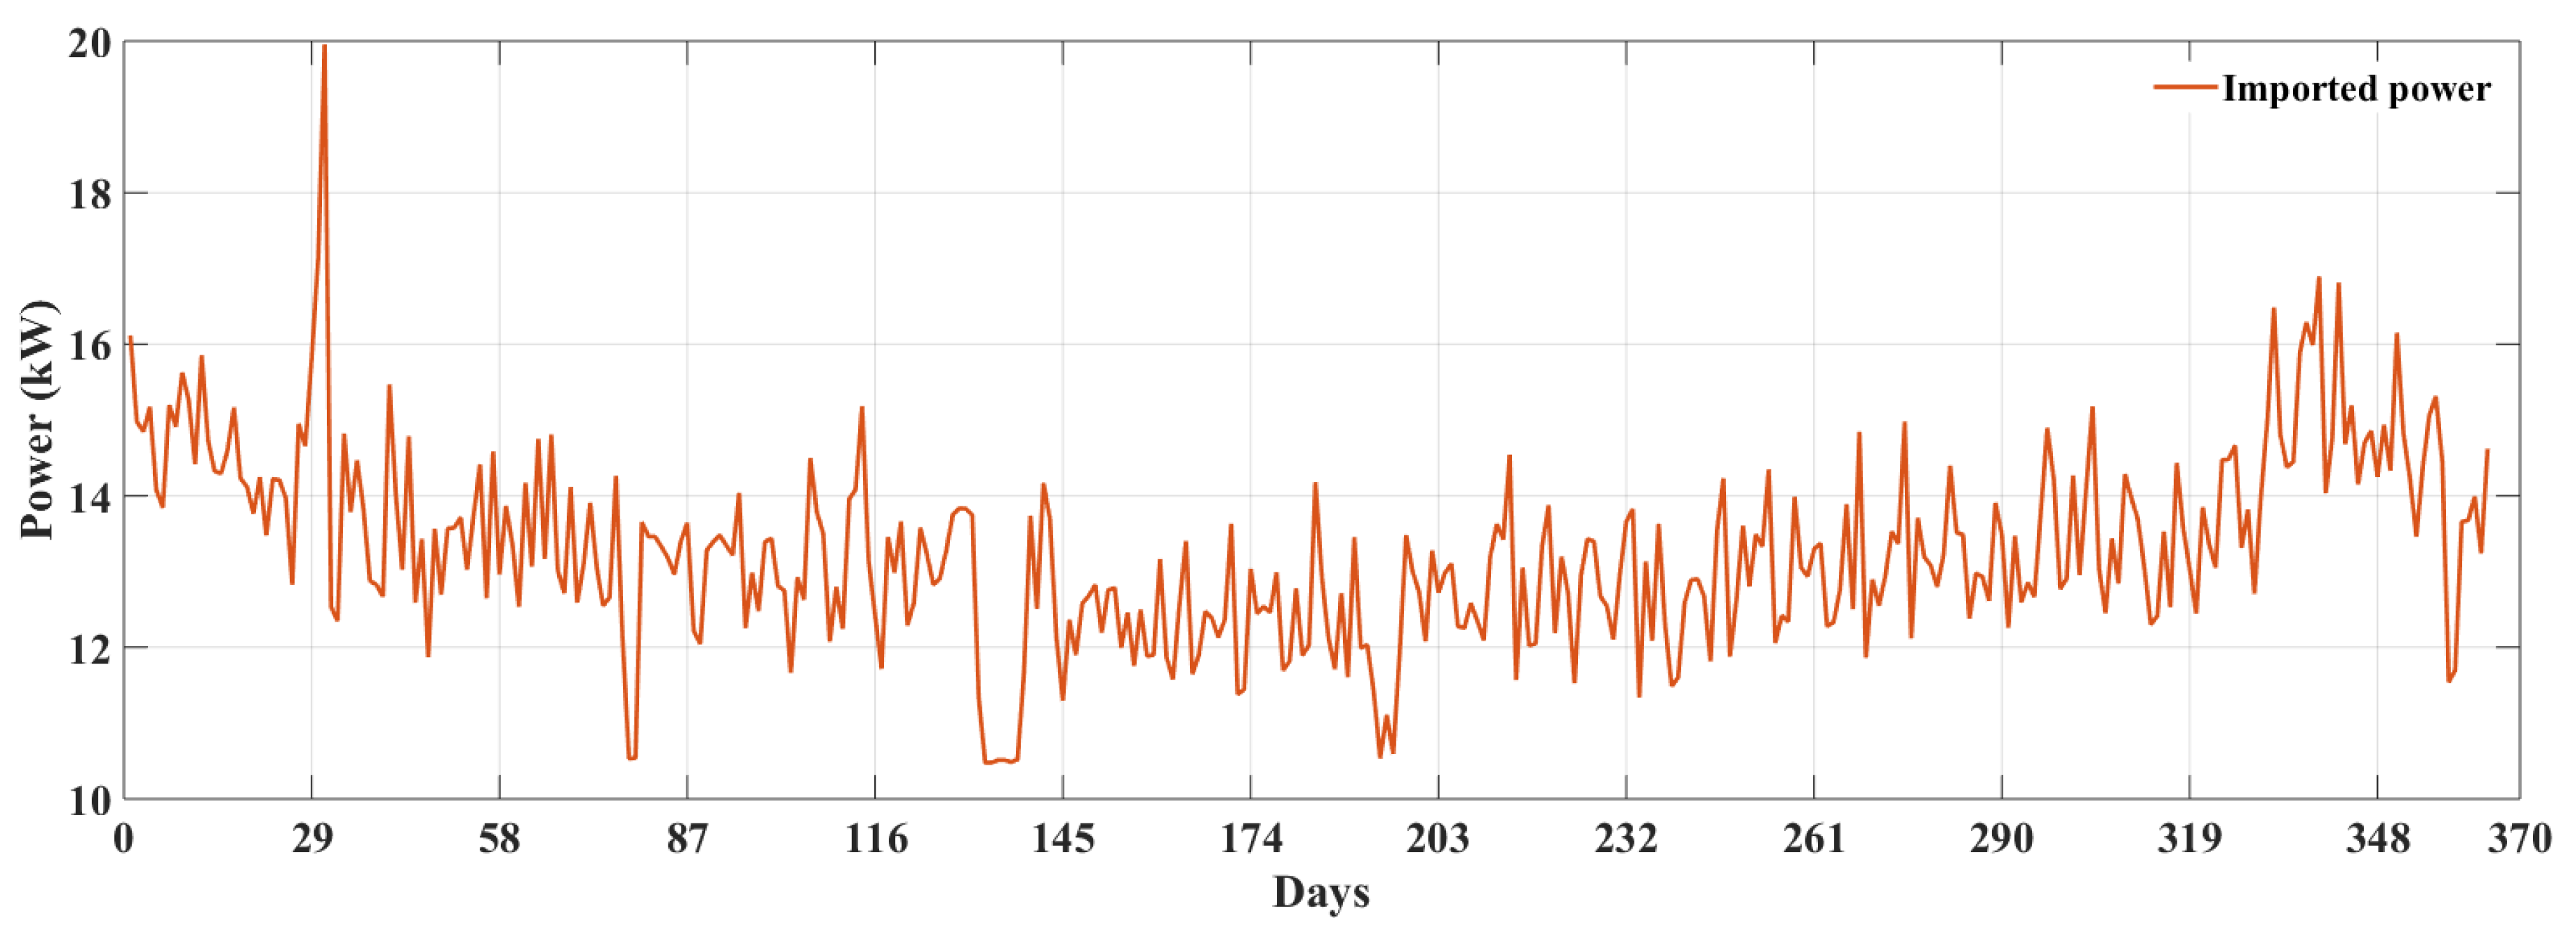
3.1. Case 1
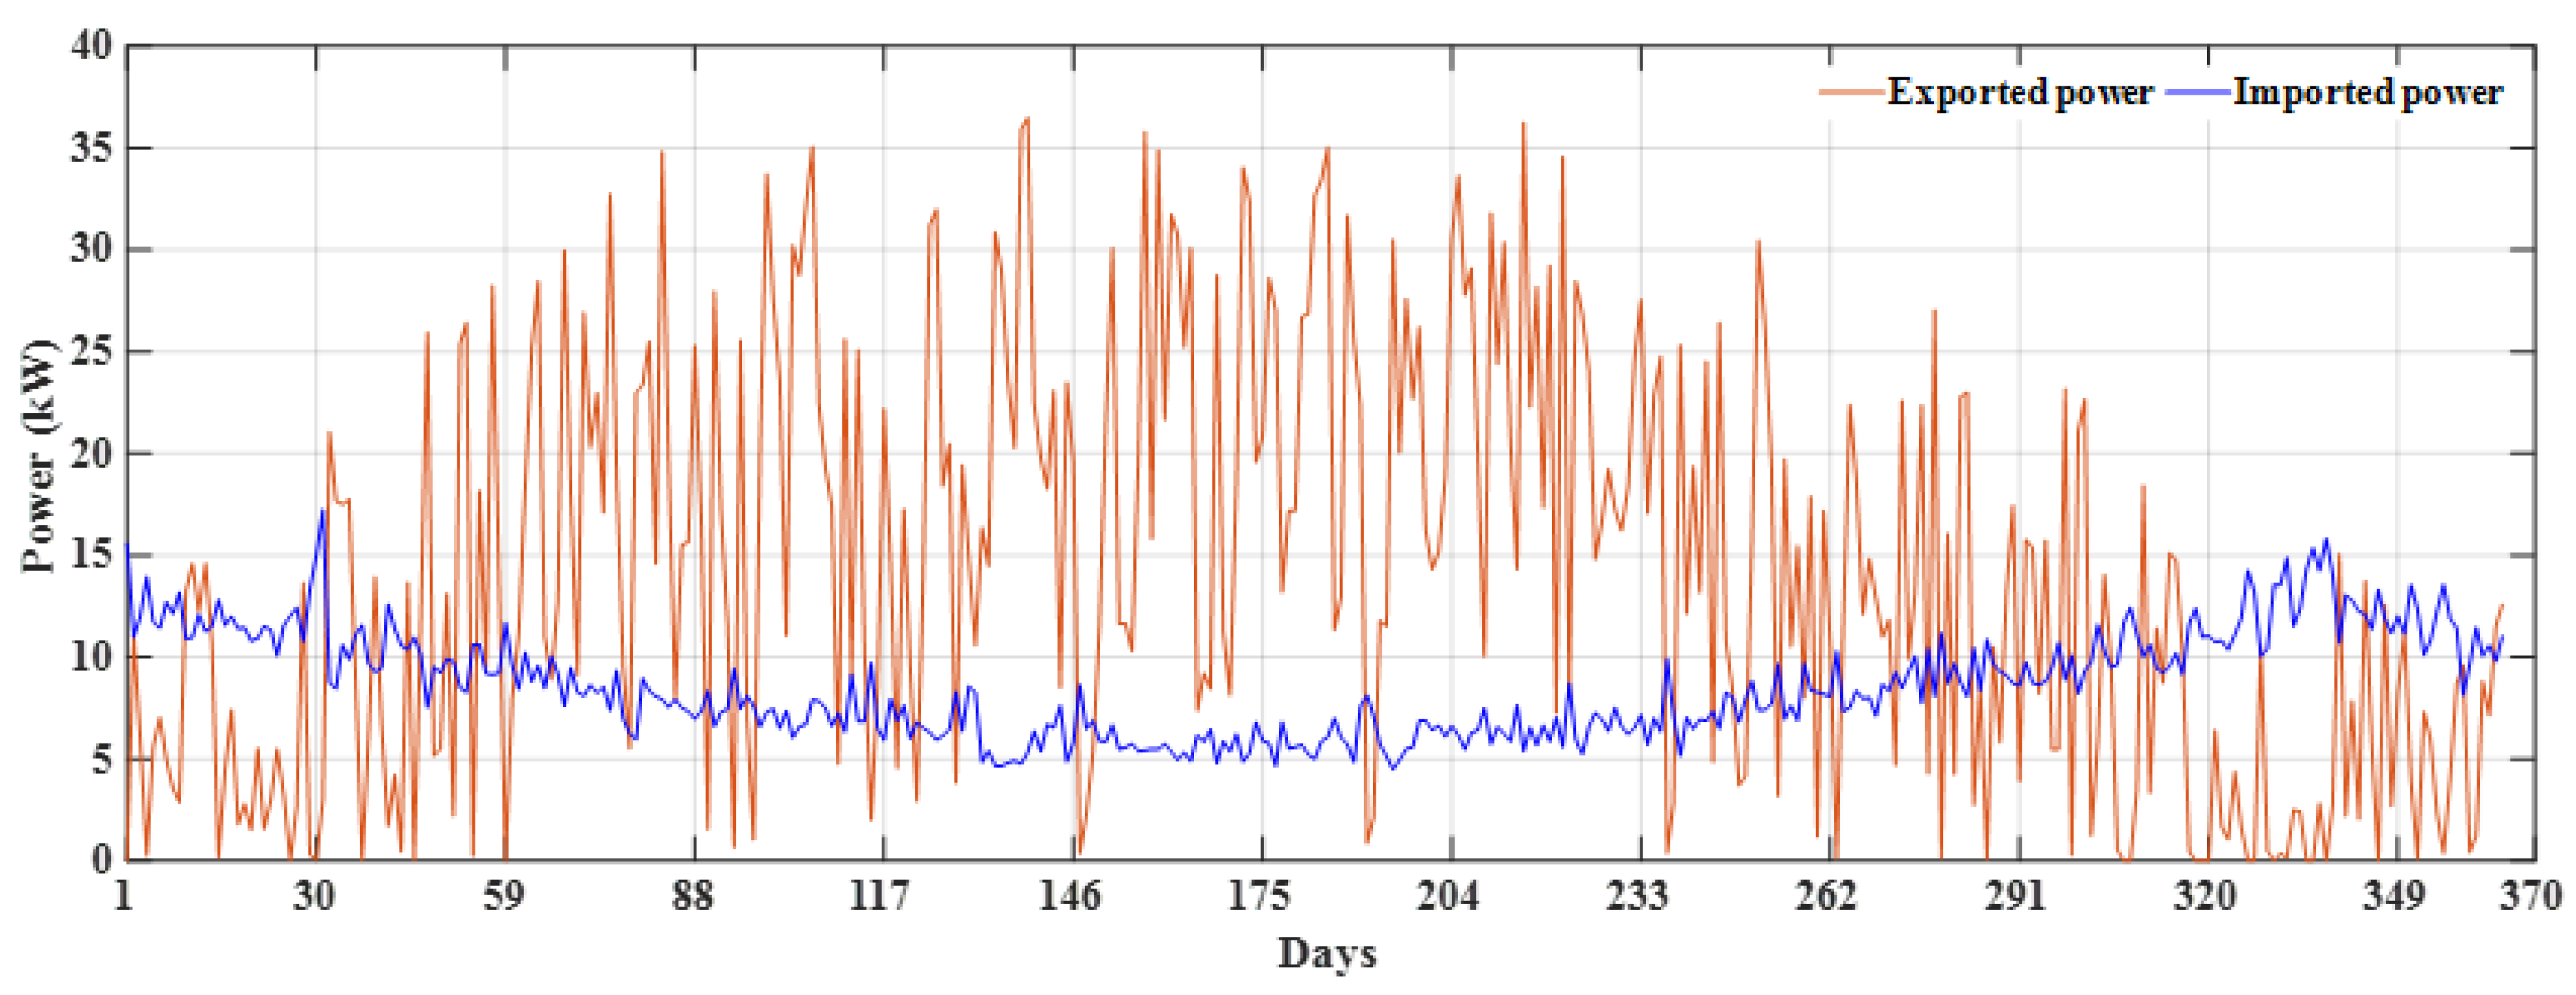
3.2. Case 2
3.3. Case 3
4. Conclusions
Author Contributions
Funding
Acknowledgments
Conflicts of Interest
References
- Mobil, E. The Outlook for Energy: A View to 2040. Exxon Mobil 2013, 6. Available online: https://cdn.exxonmobil.com/~/media/global/files/outlook-for-energy/2018/2018-outlook-for-energy.pdf (accessed on 4 April 2018).
- Alexander, L.V.; Allen, S.K.; Bindoff, N.L.; Breon, F.-M.; Church, J.A.; Cubasch, U.; Emori, S.; Forster, P.; Friedlingstein, P.; Gillett, N. Summary for Policymakers. In Climate Change 2013: The Physical Science Basis. Contribution of Working Group I to the Fifth Assessment Report of the Intergovernmental Panel on Climate Change; Cambridge University Press: Cambridge, UK, 2013; pp. 3–30. [Google Scholar]
- Houghton, D. Global Warming: The Complete Briefing; Cambridge University Press: Cambridge, UK, 1997; pp. 107–140. [Google Scholar]
- Meadows, D.; Randers, J.; Behrens, W. The Limits to Growth: A Report for the Club of Rome’s Project on the Predicament of Mankind; Universe Book: New York, NY, USA, 1972; Available online: https://en.wikipedia.org/wiki/The_Limits_to_Growth (accessed on 4 April 2018).
- Peet, J. Energy and the Ecological Economics of Sustainability; Island Press: Washington, WA, USA, 1992; pp. 114–123. [Google Scholar]
- Minger, T.J. Greenhouse/Glasnost: the Sundance Symposium on Global Climate Change. In Greenhouse Glasnost: The Crisis of Global Warming: Essays; Ecco Press: Manhattan, NY, USA, 1990; pp. 101–109. [Google Scholar]
- Haines, A.; McMichael, A.J.; Epstein, P.R. Environment and health: 2. Global climate change and health. Can. Med. Assoc. J. 2000, 163, 729–734. [Google Scholar]
- Philipps, S.; Ise, F.; Warmuth, W. Fraunhofer ISE: Photovoltaics Report. 2017. Available online: http://www.solarbabax.com/lib/lib019-pv-report2017.pdf (accessed on 4 April 2018).
- Panagea, I.S.; Tsanis, I.K.; Koutroulis, A.G.; Grillakis, M.G. Climate change impact on photovoltaic energy output: The case of greece. Adv. Meteorol. 2014, 2014. [Google Scholar] [CrossRef]
- Sawin, J. Renewable Energy Policy Network for the 21st Century Renewables 2017 Global Status Report; REN21 Secretariat: Paris, France, 2017; pp. 1–302. [Google Scholar]
- Renewable’s 2018 Global Status Report. Available online: http://www.ren21.net/wp-content/uploads/2018/06/17-8652_GSR2018_FullReport_web_-1.pdf (accessed on 4 April 2018).
- Turner, J.A. A realizable renewable energy future. Science 1999, 285, 687–689. [Google Scholar] [CrossRef] [PubMed]
- Rose, A. A global view of solar energy in rational units. Phys. Status solidi A 1979, 56, 11–26. [Google Scholar] [CrossRef]
- Shah, A.; Torres, P.; Tscharner, R.; Wyrsch, N.; Keppner, H. Photovoltaic technology: The case for thin-film solar cells. Science 1999, 285, 692–698. [Google Scholar] [CrossRef] [PubMed]
- Pacca, S.A. Global Warming Effect Appliedd to Electricity Generation Technologies; University of California: Berkeley, CA, USA, 2003; Available online: http://rael.berkeley.edu/old_drupal/sites/default/files/old-site-files/diss/Sergio_Pacca_2003.pdf (accessed on 4 April 2018).
- Sherwani, A.F.; Usmani, J.A. Life cycle assessment of solar pv based electricity generation systems: A review. Renew. Sust. Energy Rev. 2010, 14, 540–544. [Google Scholar] [CrossRef]
- McEvoy, A.; Markvart, T.; Castañer, L.; Markvart, T.; Castaner, L. Practical Handbook of Photovoltaics: Fundamentals and Applications; Elsevier: New York, NY, USA, 2003; pp. 566–567. [Google Scholar]
- Stoppato, A. Life cycle assessment of photovoltaic electricity generation. Energy 2008, 33, 224–232. [Google Scholar] [CrossRef]
- Aulich, H.A.; Schulze, F.W. Crystalline silicon feedstock for solar cells. Prog. Photovoltaics Res. Appl. 2002, 10, 141–147. [Google Scholar] [CrossRef]
- Phylipsen, G.J.M.; Alsema, E.A. Environmental Life-Cycle Assessment of Multicrystalline Silicon Solar Cell Modules (Report No. 95057); Technical report; Department of Science, Technology and Society, Utrecht University: Princetonplein, The Netherlands, 1995; pp. 35–38. [Google Scholar]
- Pacca, S.; Sivaraman, D.; Keoleian, G.A. Parameters affecting the life cycle performance of pv technologies and systems. Energy Policy 2007, 35, 3316–3326. [Google Scholar] [CrossRef]
- Zsiborács, H.; Bai, A.; Popp, J.; Gabnai, Z.; Pályi, B.; Farkas, I.; Hegedűsné Baranyai, N.; Veszelka, M.; Zentkó, L.; Pintér, G. Change of real and simulated energy production of certain photovoltaic technologies in relation to orientation, tilt angle and dual-axis sun-tracking. A case study in hungary. Sustainability 2018, 10. [Google Scholar] [CrossRef]
- Fthenakis, V.; Kim, H.C. Photovoltaics: Life-cycle analyses. Sol. Energy 2011, 85, 1609–1628. [Google Scholar] [CrossRef]
- Linssen, J.; Stenzel, P.; Fleer, J. Techno-economic analysis of photovoltaic battery systems and the influence of different consumer load profiles. Appl. Energy 2017, 185, 2019–2025. [Google Scholar] [CrossRef]
- Pintér, G.; Baranyai, N.H.; Wiliams, A.; Zsiborács, H. Study of photovoltaics and led energy efficiency: Case study in hungary. Energies 2018, 11, 790. [Google Scholar] [CrossRef]
- Denholm, P.; Margolis, R.M. Evaluating the limits of solar photovoltaics (pv) in electric power systems utilizing energy storage and other enabling technologies. Energy Policy 2007, 35, 4424–4433. [Google Scholar] [CrossRef]
- Perrin, M.; Saint-Drenan, Y.; Mattera, F.; Malbranche, P. Lead–acid batteries in stationary applications: Competitors and new markets for large penetration of renewable energies. J. Power Sources 2005, 144, 402–410. [Google Scholar] [CrossRef]
- Zsiborács, H.; Baranyai, N.H.; Vincze, A.; Háber, I.; Pintér, G. Economic and technical aspects of flexible storage photovoltaic systems in europe. Energies 2018, 11. [Google Scholar] [CrossRef]
- Nizetic, S.; Coko, D.; Marasovic, I. Experimental study on a hybrid energy system with small-and medium-scale applications for mild climates. Energy 2014, 75, 379–389. [Google Scholar] [CrossRef]
- Vavilapalli, S.; Padmanaban, S.; Subramaniam, U.; Mihet-Popa, L. Power balancing control for grid energy storage system in photovoltaic applications—Real time digital simulation implementation. Energies 2017, 10, 928. [Google Scholar] [CrossRef]
- Swaminathan, G.; Ramesh, V.; Umashankar, S.; Sanjeevikumar, P. Investigations of microgrid stability and optimum power sharing using robust control of grid tie pv inverter. In Advances in Smart Grid and Renewable Energy; Springer: Berlin, Germany, 2018; pp. 379–387. [Google Scholar]
- Tamvada, K.; Umashankar, S.; Sanjeevikumar, P. Impact of power quality disturbances on grid-connected double fed induction generator. In Advances in Smart Grid and Renewable Energy; Springer: Berlin, Germany, 2018; pp. 339–345. [Google Scholar]
- Castillo, A.; Gayme, D.F. Grid-scale energy storage applications in renewable energy integration: A survey. Energy Convers. Manag. 2014, 87, 885–894. [Google Scholar] [CrossRef]
- Leadbetter, J.; Swan, L.G. Selection of battery technology to support grid-integrated renewable electricity. J. Power Sources 2012, 216, 376–386. [Google Scholar] [CrossRef]
- Wu, Z.; Tazvinga, H.; Xia, X. Demand side management of photovoltaic-battery hybrid system. Appl. Energy 2015, 148, 294–304. [Google Scholar] [CrossRef]
- Mariaud, A.; Acha, S.; Ekins-Daukes, N.; Shah, N.; Markides, C.N. Integrated optimisation of photovoltaic and battery storage systems for uk commercial buildings. Appl. Energy 2017, 199, 466–478. [Google Scholar] [CrossRef]
- Khalilpour, R.; Vassallo, A. Planning and operation scheduling of pv-battery systems: A novel methodology. Renew. Sust. Energy Rev. 2016, 53, 194–208. [Google Scholar] [CrossRef]
- Pazouki, S.; Haghifam, M.-R. Optimal planning and scheduling of energy hub in presence of wind, storage and demand response under uncertainty. Int. J. Electr. Power 2016, 80, 219–239. [Google Scholar] [CrossRef]
- Bortolini, M.; Gamberi, M.; Graziani, A. Technical and economic design of photovoltaic and battery energy storage system. Energy Convers. Manag. 2014, 86, 81–92. [Google Scholar] [CrossRef]
- Tazvinga, H.; Zhu, B.; Xia, X. Optimal power flow management for distributed energy resources with batteries. Energy Convers. Manag. 2015, 102, 104–110. [Google Scholar] [CrossRef]
- Pamparana, G.; Kracht, W.; Haas, J.; Díaz-Ferrán, G.; Palma-Behnke, R.; Román, R. Integrating photovoltaic solar energy and a battery energy storage system to operate a semi-autogenous grinding mill. J. Clean. Prod. 2017, 165, 273–280. [Google Scholar] [CrossRef]
- Luo, F.; Meng, K.; Dong, Z.Y.; Zheng, Y.; Chen, Y.; Wong, K.P. Coordinated operational planning for wind farm with battery energy storage system. IEEE Trans. Sustain. Energy 2015, 6, 253–262. [Google Scholar] [CrossRef]
- Zou, P.; Chen, Q.; Xia, Q.; He, G.; Kang, C. Evaluating the contribution of energy storages to support large-scale renewable generation in joint energy and ancillary service markets. IEEE Trans. Sustain. Energy 2016, 7, 808–818. [Google Scholar] [CrossRef]
- Quoilin, S.; Kavvadias, K.; Mercier, A.; Pappone, I.; Zucker, A. Quantifying self-consumption linked to solar home battery systems: Statistical analysis and economic assessment. Appl. Energy 2016, 182, 58–67. [Google Scholar] [CrossRef]
- Hoppmann, J.; Volland, J.; Schmidt, T.S.; Hoffmann, V.H. The economic viability of battery storage for residential solar photovoltaic systems–a review and a simulation model. Renew. Sustain. Energy Rev. 2014, 39, 1101–1118. [Google Scholar] [CrossRef]
- Kairies, K.-P.; Magnor, D.; Sauer, D.U. Scientific measuring and evaluation program for photovoltaic battery systems (wmep pv-speicher). Energy Proc. 2015, 73, 200–207. [Google Scholar] [CrossRef]
- Linden, D. Fuel and Energy. In Handbook of Batteries; McGraw-Hill: NYC, NY, USA, 1995; p. 265. [Google Scholar]
- Luo, X.; Wang, J.; Dooner, M.; Clarke, J. Overview of current development in electrical energy storage technologies and the application potential in power system operation. Appl. Energy 2015, 137, 511–536. [Google Scholar] [CrossRef]
- Ali, M.U.; Nengroo, S.H.; Khan, M.A.; Zeb, K.; Kamran, M.A.; Kim, H.-J. A real-time simulink interfaced fast-charging methodology of lithium-ion batteries under temperature feedback with fuzzy logic control. Energies 2018, 11. [Google Scholar] [CrossRef]
- Menanteau, P.; Finon, D.; Lamy, M.-L. Prices versus quantities: Choosing policies for promoting the development of renewable energy. Energy Policy 2003, 31, 799–812. [Google Scholar] [CrossRef]
- Fouquet, D.; Johansson, T.B. European renewable energy policy at crossroads—Focus on electricity support mechanisms. Energy Policy 2008, 36, 4079–4092. [Google Scholar] [CrossRef]
- Mendonca, M. Feed-In tariffs: Accelerating the Deployment of Renewable Energy London; Cromwell Press: Trowbridge, UK, 2007; pp. 30–31. [Google Scholar]
- Deploying Renewables: Principles for Effective Policies; Organisation for Economic Co-operation and Development (OECD)/International Energy Agency (IEA): Paris, France, 2008.
- Deutsche Bank. Global Energy Transfer Feed-In Tariffs for Developing Countrie; DB Climate Change Advisers (DBCCA): Frankfurt, Germany, April 2010; Available online: http://www.dbcca.com/dbcca/EN/_media/GET_FiT_Program.pdf (accessed on 4 April 2018).
- Rickerson, W.H.; Sawin, J.L.; Grace, R.C. If the shoe fits: Using feed-in tariffs to meet us renewable electricity targets. Electr. J. 2007, 20, 73–86. [Google Scholar] [CrossRef]
- Cherrington, R.; Goodship, V.; Longfield, A.; Kirwan, K. The feed-in tariff in the uk: A case study focus on domestic photovoltaic systems. Renew. Energy 2013, 50, 421–426. [Google Scholar] [CrossRef]
- Yang, L.; Dong, C.; Wan, C.J.; Ng, C.T. Electricity time-of-use tariff with consumer behavior consideration. Int. J. Prod. Econ. 2013, 146, 402–410. [Google Scholar] [CrossRef]
- Faruqui, A.; Sergici, S. Household response to dynamic pricing of electricity: A survey of 15 experiments. J. Regul. Econ. 2010, 38, 193–225. [Google Scholar] [CrossRef]
- Faruqui, A.; George, S. Quantifying customer response to dynamic pricing. Electr. J. 2005, 18, 53–63. [Google Scholar] [CrossRef]
- Sheffield Solar. Available online: http://www.solar.sheffield.ac.uk/S.S.n.d (accessed on 27 October 2015).
- Newborough, M.; Augood, P. Demand-side management opportunities for the uk domestic sector. IEE Proc. Gener. Transm. Distrib. 1999, 146, 283–293. [Google Scholar] [CrossRef]
- Malvoni, M.; De Giorgi, M.G.; Congedo, P.M. Forecasting of pv power generation using weather input data-preprocessing techniques. Energy Proced. 2017, 126, 651–658. [Google Scholar] [CrossRef]


| Case | PV Installed | Battery Installed | Economy 7 Tariff Applied | Cost of Importing Electricity (£) (A) | Cost of Exporting Electricity (£) (B) | Net Value (£) (C = A − B) |
|---|---|---|---|---|---|---|
| 1 | No | No | Yes | 382.244 | Nil | 384.244 |
| 2 | Yes | No | Yes | 164.218 | 102.520 | 61.698 |
| 3 | Yes | Yes | Yes | 24.086 | 64.781 | −40.695 |
| Case | Skewness | Kurtosis | ||||
|---|---|---|---|---|---|---|
| Import | Export | Storage | Import | Export | Storage | |
| 1 | −0.1 | NA | NA | 3.8 | NA | NA |
| 2 | −0.3 | −0.1 | NA | 5 | 4.2 | NA |
| 3 | −1.6 | −0.3 | −0.4 | 6.3 | 7.3 | 7.6 |
© 2018 by the authors. Licensee MDPI, Basel, Switzerland. This article is an open access article distributed under the terms and conditions of the Creative Commons Attribution (CC BY) license (http://creativecommons.org/licenses/by/4.0/).
Share and Cite
Nengroo, S.H.; Kamran, M.A.; Ali, M.U.; Kim, D.-H.; Kim, M.-S.; Hussain, A.; Kim, H.J. Dual Battery Storage System: An Optimized Strategy for the Utilization of Renewable Photovoltaic Energy in the United Kingdom. Electronics 2018, 7, 177. https://doi.org/10.3390/electronics7090177
Nengroo SH, Kamran MA, Ali MU, Kim D-H, Kim M-S, Hussain A, Kim HJ. Dual Battery Storage System: An Optimized Strategy for the Utilization of Renewable Photovoltaic Energy in the United Kingdom. Electronics. 2018; 7(9):177. https://doi.org/10.3390/electronics7090177
Chicago/Turabian StyleNengroo, Sarvar Hussain, Muhammad Ahmad Kamran, Muhammad Umair Ali, Do-Hyun Kim, Min-Soo Kim, Altaf Hussain, and Hee Jee Kim. 2018. "Dual Battery Storage System: An Optimized Strategy for the Utilization of Renewable Photovoltaic Energy in the United Kingdom" Electronics 7, no. 9: 177. https://doi.org/10.3390/electronics7090177
APA StyleNengroo, S. H., Kamran, M. A., Ali, M. U., Kim, D.-H., Kim, M.-S., Hussain, A., & Kim, H. J. (2018). Dual Battery Storage System: An Optimized Strategy for the Utilization of Renewable Photovoltaic Energy in the United Kingdom. Electronics, 7(9), 177. https://doi.org/10.3390/electronics7090177